User login
Unusual shoulder injury from a motorcycle crash
A 38-YEAR-OLD MAN was brought into our emergency department (ED) after driving his motorcycle at high speed into a tree. The patient, who hadn’t been wearing a helmet, was thrown 30 feet. When EMS arrived, the patient was unresponsive, with his right arm in the air. En route, the patient regained consciousness; he appeared intoxicated and became combative.
The patient was evaluated in the ED and his vital signs were normal. His right arm was abducted and over his head (FIGURE 1). He reported significant pain with palpation and attempts at range of motion. We were unable to place the patient’s arm at his side. Other than some minor abrasions, the patient appeared to have no other injuries.
FIGURE 1Right upper extremity on presentation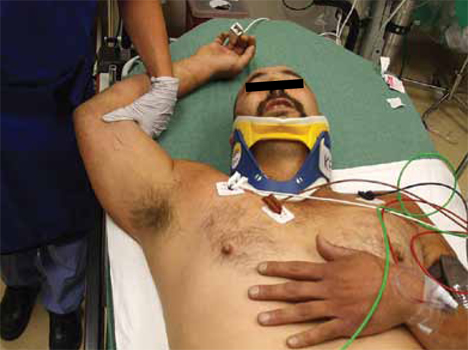
Routine laboratory tests showed an alcohol level of 0.175 g/dL and urine toxicology was positive for benzodiazepines and tetrahydrocannabinol. A focused assessment with sonography in trauma (FAST) exam was negative. We ordered a right shoulder x-ray and a chest x-ray.
WHAT IS YOUR DIAGNOSIS?
HOW WOULD YOU TREAT THIS PATIENT?
Diagnosis: Inferior dislocation of the shoulder
The right shoulder x-ray (FIGURE 2) revealed luxatio erecta—an inferior dislocation of the shoulder. The humeral head was displaced inferiorly with respect to the glenoid fossa and there was an associated greater tuberosity fracture. The chest x-ray demonstrated mild pulmonary contusions.
FIGURE 2
Right shoulder radiograph reveals luxatio erecta with greater tuberosity fracture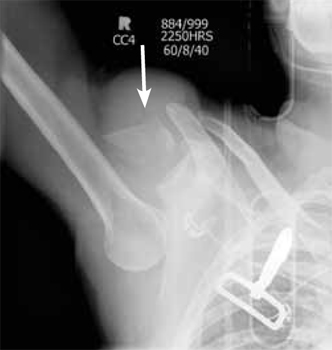
An uncommon dislocation
Inferior shoulder dislocation or luxatio erecta is the least common type of glenohumeral dislocation, comprising only about 0.5% of all shoulder dislocations.1 The 2 other types of shoulder dislocations—anterior and posterior—account for 95% to 97% and 2% to 4% of dislocations, respectively.2
Injury occurs in one of 2 ways, either by a direct or indirect mechanism. A direct dislocation occurs when there is axial loading on an arm that is fully abducted at the shoulder.3 The indirect mechanism, which is more common, is caused by a hyperabduction stress that directs the humeral neck superiorly against the acromion process, forcing the humeral head out of the glenoid fossa inferiorly.2 The indirect mechanism usually occurs when a patient falls and reacts by grasping an object above his or her head, resulting in hyperabduction.
Sometimes, there is no trauma. True inferior dislocations have also been reported in patients with stroke, septic arthritis, and other neuromuscular diseases.4
The presentation is distinctive
Patients with this type of dislocation present with their arm elevated, elbow flexed, and hand behind their head. Due to mechanical entrapment of the humeral head, patients can’t move their arm. The abducted position of the arm may hinder further assessment with computed tomography (CT) for life-threatening injuries, as was the case with our patient.
While an immobile, abducted arm is virtually pathognomonic, radiographs are useful for confirming the diagnosis and assessing for associated fractures. It is essential to obtain anteroposterior, axillary, and Y views.5 Radiographs typically show the shaft of the humerus directed superiorly and parallel to the scapular spine, with the humeral head below the coracoid process or glenoid fossa.3,5
Rotator cuff tears are a common complication
There are a number of complications associated with luxatio erecta. Eighty percent of patients with this injury have either an associated rotator cuff tear or a fracture of the greater tuberosity (which we’ll get to in a bit).3 Magnetic resonance imaging studies have shown rotator cuff injuries to involve the supraspinatus, infraspinatus, and, less frequently, the subscapularis tendon.6 It’s believed that rotator cuff tears may be even more prevalent than reported in the literature since they are often underrecognized at the time of presentation with the dislocation.6
Other complications. Sixty percent of patients report some degree of neurologic dysfunction after the dislocation.5 The most common nerve affected is the axillary, followed by the radial, ulnar, and median nerves.3 These injuries are more likely to occur with associated fractures of the greater tuberosity or axillary artery injuries.7 Symptoms generally resolve after reduction, although there have been cases that have taken up to 6 weeks to resolve.8
Vascular compromise, most commonly occurring as a result of axillary artery injury, has been reported in 3.3% of cases.5 This injury is most common in elderly patients, with 75% of cases occurring in patients older than 60 years.7 It’s been hypothesized that this is due to the loss of arterial elasticity as an individual ages. The most common presenting signs and symptoms include absent radial and/or brachial pulses, severe pain, axillary swelling, axillary masses due to hematoma formation, and neurologic deficits.7 Complications are minimal if diagnosed and treated early.
The most expeditious way to diagnose this complication is to obtain a Doppler ultrasound of the injured extremity. If surgery is indicated, saphenous vein graft has been reported as a successful treatment.3
Fractures are another complication to watch for. The most common fractures are of the greater tuberosity, although fractures to the glenoid, humeral head, acromion, and scapular body have also been reported.8 Fracture management depends on the characteristics of the fracture, including displacement, size of the fragment, and joint stability.
Treatment involves traction and countertraction
Luxatio erecta is normally treated by closed reduction using the traction-countertraction technique. In this maneuver, the shoulder is reduced with direct traction, while countertraction is applied with a sheet wrapped over the clavicle on the affected side and pulled down and across the chest toward the unaffected side. The affected arm is pulled in a cephalad direction and further abducted until the humeral head is reduced within the glenoid fossa. After reduction, the arm is gradually moved downwards toward the patient’s side and splinted in the adducted position.8
Special care should be taken with patients who are at risk of cervical spine injuries. Postreduction radiographs should be obtained to verify proper humeral placement and to assess for any associated fractures. While closed reduction is the definitive treatment, patients run the risk of recurrent instability that may necessitate capsular reconstruction.1
Our patient recovered well
Our patient was sedated with fentanyl and midazolam, and his shoulder was reduced with the traction-countertraction technique described earlier. Postreduction radiographs revealed satisfactory alignment of the right glenohumeral joint and that the greater tuberosity was reduced to within a centimeter of its normal position. No additional fractures were identified.
After the reduction, a head CT scan was done; it revealed a small intracerebral hemorrhage. The patient was admitted overnight and discharged the following day with a sling and swathe and instructions to follow up with orthopedics.
CORRESPONDENCE
Casey Z. MacVane, MD, MPH, Department of Emergency Medicine, Maine Medical Center, 47 Bramhall Street, Portland, ME 04102; [email protected]
1. Groh GI, Wirth MA, Rockwood CA, Jr. Results of treatment of luxatio erecta (inferior shoulder dislocation). J Shoulder Elbow Surg 2010;19:423-426.
2. Goldstein JR, Eilbert WP. Locked anterior-inferior shoulder subluxation presenting as luxatio erecta. J Emerg Med 2004;27:245-248.
3. Yamamoto T, Yoshiya S, Kurosaka M, et al. Luxatio erecta: a report of 5 cases and a review of the literature. Am J Orthop 2003;32:601-603.
4. Sonanis SV, Das S, Deshmukh N, et al. A true traumatic inferior dislocation of shoulder. Injury 2002;33:842-844.
5. Yanturali S, Aksay E, Holliman CJ, et al. Luxatio erecta: clinical presentation and management in the emergency department. J Emerg Med. 2005;29:85-89.
6. Krug DK, Vinson EN, Helms CA. MRI findings associated with luxatio erecta humeri. Skeletal Radiol. 2010;39:27-33.
7. Plaga BR, Looby P, Feldhaus SJ, et al. Axillary artery injury secondary to inferior shoulder dislocation. J Emerg Med. 2010;39:599-601.
8. Sewecke JJ, Varitimidis SE. Bilateral luxatio erecta: a case report and review of the literature. Am J Orthop. 2006;35:578-580.
A 38-YEAR-OLD MAN was brought into our emergency department (ED) after driving his motorcycle at high speed into a tree. The patient, who hadn’t been wearing a helmet, was thrown 30 feet. When EMS arrived, the patient was unresponsive, with his right arm in the air. En route, the patient regained consciousness; he appeared intoxicated and became combative.
The patient was evaluated in the ED and his vital signs were normal. His right arm was abducted and over his head (FIGURE 1). He reported significant pain with palpation and attempts at range of motion. We were unable to place the patient’s arm at his side. Other than some minor abrasions, the patient appeared to have no other injuries.
FIGURE 1Right upper extremity on presentation
Routine laboratory tests showed an alcohol level of 0.175 g/dL and urine toxicology was positive for benzodiazepines and tetrahydrocannabinol. A focused assessment with sonography in trauma (FAST) exam was negative. We ordered a right shoulder x-ray and a chest x-ray.
WHAT IS YOUR DIAGNOSIS?
HOW WOULD YOU TREAT THIS PATIENT?
Diagnosis: Inferior dislocation of the shoulder
The right shoulder x-ray (FIGURE 2) revealed luxatio erecta—an inferior dislocation of the shoulder. The humeral head was displaced inferiorly with respect to the glenoid fossa and there was an associated greater tuberosity fracture. The chest x-ray demonstrated mild pulmonary contusions.
FIGURE 2
Right shoulder radiograph reveals luxatio erecta with greater tuberosity fracture
An uncommon dislocation
Inferior shoulder dislocation or luxatio erecta is the least common type of glenohumeral dislocation, comprising only about 0.5% of all shoulder dislocations.1 The 2 other types of shoulder dislocations—anterior and posterior—account for 95% to 97% and 2% to 4% of dislocations, respectively.2
Injury occurs in one of 2 ways, either by a direct or indirect mechanism. A direct dislocation occurs when there is axial loading on an arm that is fully abducted at the shoulder.3 The indirect mechanism, which is more common, is caused by a hyperabduction stress that directs the humeral neck superiorly against the acromion process, forcing the humeral head out of the glenoid fossa inferiorly.2 The indirect mechanism usually occurs when a patient falls and reacts by grasping an object above his or her head, resulting in hyperabduction.
Sometimes, there is no trauma. True inferior dislocations have also been reported in patients with stroke, septic arthritis, and other neuromuscular diseases.4
The presentation is distinctive
Patients with this type of dislocation present with their arm elevated, elbow flexed, and hand behind their head. Due to mechanical entrapment of the humeral head, patients can’t move their arm. The abducted position of the arm may hinder further assessment with computed tomography (CT) for life-threatening injuries, as was the case with our patient.
While an immobile, abducted arm is virtually pathognomonic, radiographs are useful for confirming the diagnosis and assessing for associated fractures. It is essential to obtain anteroposterior, axillary, and Y views.5 Radiographs typically show the shaft of the humerus directed superiorly and parallel to the scapular spine, with the humeral head below the coracoid process or glenoid fossa.3,5
Rotator cuff tears are a common complication
There are a number of complications associated with luxatio erecta. Eighty percent of patients with this injury have either an associated rotator cuff tear or a fracture of the greater tuberosity (which we’ll get to in a bit).3 Magnetic resonance imaging studies have shown rotator cuff injuries to involve the supraspinatus, infraspinatus, and, less frequently, the subscapularis tendon.6 It’s believed that rotator cuff tears may be even more prevalent than reported in the literature since they are often underrecognized at the time of presentation with the dislocation.6
Other complications. Sixty percent of patients report some degree of neurologic dysfunction after the dislocation.5 The most common nerve affected is the axillary, followed by the radial, ulnar, and median nerves.3 These injuries are more likely to occur with associated fractures of the greater tuberosity or axillary artery injuries.7 Symptoms generally resolve after reduction, although there have been cases that have taken up to 6 weeks to resolve.8
Vascular compromise, most commonly occurring as a result of axillary artery injury, has been reported in 3.3% of cases.5 This injury is most common in elderly patients, with 75% of cases occurring in patients older than 60 years.7 It’s been hypothesized that this is due to the loss of arterial elasticity as an individual ages. The most common presenting signs and symptoms include absent radial and/or brachial pulses, severe pain, axillary swelling, axillary masses due to hematoma formation, and neurologic deficits.7 Complications are minimal if diagnosed and treated early.
The most expeditious way to diagnose this complication is to obtain a Doppler ultrasound of the injured extremity. If surgery is indicated, saphenous vein graft has been reported as a successful treatment.3
Fractures are another complication to watch for. The most common fractures are of the greater tuberosity, although fractures to the glenoid, humeral head, acromion, and scapular body have also been reported.8 Fracture management depends on the characteristics of the fracture, including displacement, size of the fragment, and joint stability.
Treatment involves traction and countertraction
Luxatio erecta is normally treated by closed reduction using the traction-countertraction technique. In this maneuver, the shoulder is reduced with direct traction, while countertraction is applied with a sheet wrapped over the clavicle on the affected side and pulled down and across the chest toward the unaffected side. The affected arm is pulled in a cephalad direction and further abducted until the humeral head is reduced within the glenoid fossa. After reduction, the arm is gradually moved downwards toward the patient’s side and splinted in the adducted position.8
Special care should be taken with patients who are at risk of cervical spine injuries. Postreduction radiographs should be obtained to verify proper humeral placement and to assess for any associated fractures. While closed reduction is the definitive treatment, patients run the risk of recurrent instability that may necessitate capsular reconstruction.1
Our patient recovered well
Our patient was sedated with fentanyl and midazolam, and his shoulder was reduced with the traction-countertraction technique described earlier. Postreduction radiographs revealed satisfactory alignment of the right glenohumeral joint and that the greater tuberosity was reduced to within a centimeter of its normal position. No additional fractures were identified.
After the reduction, a head CT scan was done; it revealed a small intracerebral hemorrhage. The patient was admitted overnight and discharged the following day with a sling and swathe and instructions to follow up with orthopedics.
CORRESPONDENCE
Casey Z. MacVane, MD, MPH, Department of Emergency Medicine, Maine Medical Center, 47 Bramhall Street, Portland, ME 04102; [email protected]
1. Groh GI, Wirth MA, Rockwood CA, Jr. Results of treatment of luxatio erecta (inferior shoulder dislocation). J Shoulder Elbow Surg 2010;19:423-426.
2. Goldstein JR, Eilbert WP. Locked anterior-inferior shoulder subluxation presenting as luxatio erecta. J Emerg Med 2004;27:245-248.
3. Yamamoto T, Yoshiya S, Kurosaka M, et al. Luxatio erecta: a report of 5 cases and a review of the literature. Am J Orthop 2003;32:601-603.
4. Sonanis SV, Das S, Deshmukh N, et al. A true traumatic inferior dislocation of shoulder. Injury 2002;33:842-844.
5. Yanturali S, Aksay E, Holliman CJ, et al. Luxatio erecta: clinical presentation and management in the emergency department. J Emerg Med. 2005;29:85-89.
6. Krug DK, Vinson EN, Helms CA. MRI findings associated with luxatio erecta humeri. Skeletal Radiol. 2010;39:27-33.
7. Plaga BR, Looby P, Feldhaus SJ, et al. Axillary artery injury secondary to inferior shoulder dislocation. J Emerg Med. 2010;39:599-601.
8. Sewecke JJ, Varitimidis SE. Bilateral luxatio erecta: a case report and review of the literature. Am J Orthop. 2006;35:578-580.

Alcoholism? Ask this
I read with interest Dr. Vinson’s approach to alcohol abuse (Patient abusing alcohol or drugs? Help starts with a single question. J Fam Pract. 2013;62:63-69).
For the past 3 years I have often used my residency director’s approach to patients with substance abuse issues. It, too, involves a single question.
Once I’ve established a rapport with a patient who I suspect has a chronic alcohol problem, I simply ask: “How long have you been an alcoholic?” This establishes that we’re both aware of the patient’s alcoholism and that I now want to establish the duration of the abuse.
Israel Wojnowich, MD
St. Petersburg, Fla
Psychotic and sexually deviant
CASE: Paranoid and distressed
Mr. P, age 21, is a single, white college student who presents to a psychiatric emergency room with his father at his psychotherapist’s recommendation. The psychotherapist, who has been treating Mr. P for anxiety and depression, recommended he be evaluated because of increased erratic behavior and paranoia. Mr. P reports that he has been feeling increasingly “anxious” and “paranoid” and thinks the security cameras at his college have been following him. He also describes an increased connection with God and hearing God’s voice as a commentary on his behaviors. Mr. P denies euphoria, depression, increased goal-directed activities, distractibility, increased impulsivity, or rapid speech. He is admitted voluntarily to the psychiatric unit for further evaluation.
During the hospitalization, Mr. P discloses that he has been viewing child pornography for 2 years, and during the past 6 months he has been distressed by the intensity of his sexual fantasies involving sexual contact with prepubescent girls. He also continues to experience paranoia and increased religiosity.
Mr. P says he began looking at pornography on the internet at age 14. He says he was watching “regular straight porn” and he would use it to masturbate and achieve orgasm. Mr. P began looking at child pornography at age 19. He stated that “regular porn” was no longer sufficiently arousing for him. Mr. P explains, “First, I started looking for 15- or 16-year-olds. They would work for a while [referring to sexual gratification], but then I would look for younger girls.” He says the images of younger girls are sexually arousing, typically “young girls, 8 to 10 years old” who are nude or involved in sex acts.
Mr. P denies sexual contact with prepubescent individuals and says his thoughts about such contact are “distressing.” He reports that he has viewed child pornography even when he wasn’t experiencing psychotic or mood symptoms. Mr. P’s outpatient psychotherapist reports that Mr. P first disclosed viewing child pornography and his attraction to prepubescent girls 2 years before this admission.
The authors’ observations
DSM-IV-TR diagnostic criteria for pedophilia (Table 1)1 are based on a history of sexual arousal to prepubescent individuals. A subset of sex offenders meet criteria for a paraphilia (Table 2),1 an axis I disorder, and a subset of sex offenders with paraphilia meet diagnostic criteria for pedophilia. Dunsieth et al2 found that among a sample of 113 male sex offenders, 74% had a diagnosable paraphilia, and 50% of individuals with paraphilia met criteria for pedophilia.
Table 1
DSM-IV-TR diagnostic criteria for pedophilia
| A) | Over a period of ≥6 months, recurrent, intense sexually arousing fantasies, sexual urges, or behaviors involving sexual activity with a prepubescent child or children (generally age ≤13) |
| B) | The person has acted on these sexual urges, or the sexual urges or fantasies cause marked distress or interpersonal difficulty |
| C) | The person is age ≥16 and ≥5 years older than the child or children in criterion A |
| Note: Do not include an individual in late adolescence involved in an ongoing sexual relationship with a 12- or 13-year-old | |
| Source: Reference 1 | |
DSM-IV-TR diagnostic criteria for a paraphilia
| The essential features of a paraphilia are recurrent, intense sexually arousing fantasies, sexual urges, or behaviors generally involving: | |
| A) | nonhuman objects, the suffering or humiliation of oneself or one’s partner, or children or other nonconsenting persons that occur over a period of ≥6 months |
| B) | The behavior, sexual urges, or fantasies cause clinically significant distress or impairment in social, occupational, or other important areas of functioning |
| Source: Reference 1 | |
Although most schizophrenia patients without a history of sexual offenses do not exhibit sexual deviancy, sexual content in hallucinations and delusions is common.6 Confusion about sexual identity and the boundaries of one’s body are common and may contribute to sexual deviancy.6 Psychiatric inpatients without a history of sexual offenses—including but not limited to psychotic patients—have higher rates of sexually deviant fantasies and behaviors compared with those without psychiatric illness.6 In one survey, 15% of men with schizophrenia displayed paraphilic behaviors and 20% had atypical sexual thoughts.7
Alish et al4 found that pedophilia was not necessarily linked to psychotic behavior or antisocial personality features when comparing pedophilia rates in individuals with or without schizophrenia. In a sample of 22 adolescent males who sexually molested a child at least once, axis I morbidity was common, and 55% met criteria for bipolar disorder.8
Few experts in paraphilias
A patient who endorses deviant sexual fantasies should be evaluated by a mental health professional with specialized training in paraphilias. Although paraphilias are not recognized as a subspecialty in psychiatry, diagnosing and treating patients with a paraphilia requires additional training. There is a scarcity of psychiatrists trained to evaluate and treat patients with paraphilias.
Sexual evaluation. Evaluating a patient who presents with problematic sexual behaviors includes performing a comprehensive psychiatric history with a focus on sexual history. A psychosexual history is distinct from general psychiatric evaluations because of the level of detail regarding a sexual history (Table 3). In addition to the clinical interview, objective testing to determine sexual interests may be useful in some patients (Table 4).9
Actuarial tools—risk assessment instruments based on statistically significant risk factors—are valid tools for determining the risk of sexual reoffending. There are several validated actuarial tools in the assessment of sex offender recidivism, such as the Static-99R,10 Stable-2007,11 and the Sex Offender Risk Appraisal Guide.12 However, these tools are used for sex offenders, and would not be used for individuals who have not committed a sex offense, such as Mr. P.
Table 3
Psychosexual evaluation
| Aspect of evaluation | Measures |
| Sexual behavior history | History of sexual abuse Childhood exposure to sex Masturbation history Preferred sexual partners Kinsey Scale |
| Sexual addiction or compulsion | Total Sexual Outlet measure Amount of time in sexual fantasy Financial, legal, or social cost of sexual behavior Prior treatment of sexual behavior |
| Sexual interests | Sex, age, and number of partner(s) Review of criteria for all paraphilias (exposing, voyeurism, cross-dressing, sadistic or masochistic interests) |
Objective testing to determine sexual interests
| Test | Results |
|---|---|
| Penile plethysmograph | Measures penis circumference with a mercury-in-rubber strain gauge. Used clinically by measuring circumferential changes in the penis while the patient is listening to audio or video stimuli of various sexual vignettes |
| Abel Assessment for Sexual Interests-3 | An objective method for evaluating deviant sexual interest uses noninvasive means to achieve objective measures of sexual interest. The subject’s visual response time is measured while viewing images of males and females of varying age. Visual reaction time is correlated with sexual interests |
| Source: Reference 9 | |
Medicolegal aspects of a psychosexual evaluation may include mandated reporting, confidentiality, and documentation. Mental health professionals are mandated to report to law enforcement or child welfare agencies when they observe or suspect physical, sexual, or other types of abuse in vulnerable populations such as children. In psychosexual evaluations, the evaluator is legally required to report if a patient discloses current sexual behavior with a child with a plan to continue to engage in the behavior. In Mr. P’s case, there was no duty to report because although he described viewing child pornography and had a sexual interest in prepubescent individuals, he did not report a history of engaging in handson sexual behaviors with children or impulses to do so. When an individual has engaged in sexual contact with a prepubescent individual, reporting is not mandated unless the individual continues to engage in sexual behavior with a minor. Mental health professionals are not responsible for calling the police or alerting authorities after a crime has been committed.
The relationship between viewing child pornography and pedophilia is unclear. Some child pornography viewers are pedophilic, others are sexually compulsive, and others are viewing out of curiosity and have no sexual deviance. Seto et al13 suggested that child pornography offenders show greater sexual arousal to children than to adults. Persistent child pornography use is a stronger diagnostic indicator of pedophilia than sexually offending against child victims.13 A clinician who learns that a patient is viewing child pornography should take a detailed sexual history, including a review of criteria for paraphilias. In addition, when appropriate, the clinician should perform a risk assessment to determine the patient’s risk of engaging in sexual offenses with children.
OUTCOME: Expert consultation
We start Mr. P on risperidone, 1 mg/d, to treat his paranoia and request a consultation with an expert in paraphilias to determine if Mr. P has a paraphilia and to discuss treatment options.
Mr. P’s initial diagnosis is psychotic disorder not otherwise specified. His viewing of child pornography and sexual interest in prepubescent individuals is not limited to his current mental status, and these interests persist in the absence of mood and psychotic states. Mr. P’s viewing of child pornography and sexual attraction to prepubescent girls meet the diagnostic criteria for pedophilia. During hospitalization, we educate Mr. P about his diagnoses and need for continued treatment. We refer him to a sexual disorders outpatient clinic, which continues to address his deviant sexual interests.
The authors’ observations
A meta-analysis indicates that a combination of pharmacologic and behavioral treatments coupled with close legal supervision seems to reduce the risk of repeated sexual offenses.14 Legal supervision is a general term to describe oversight of offenders in the community by supervisory boards, such as probation or parole, and tracking devices such as GPS. Currently, pedophilia treatment focuses on minimizing deviant sexual arousal through behavioral modification, cognitive-behavioral therapies, and testosterone-lowering medications, such as medroxyprogesterone or leuprolide. The decision to prescribe testosterone-lowering medication should be based on informed consent and the patient’s risk of dangerous sexual behaviors.
- Reijnen L, Bulten E, Nijman H. Demographic and personality characteristics of internet child pornography downloaders in comparison to other offenders. J Child Sex Abus. 2009;18(6):611-622.
- Hall RC, Hall RC. A profile of pedophilia: definition, characteristics of offenders, recidivism, treatment outcomes, and forensic issues. Mayo Clin Proc. 2007;82(4):457-471.
- Leuprolide • Eligard, Lupron
- Medroxyprogesterone • Cycrin, Provera
- Risperidone • Risperdal
The authors report no financial relationship with any company whose products are mentioned in this article or with manufacturers of competing products.
1. Diagnostic and statistical manual of mental disorders, 4th ed, text rev. Washington DC: American Psychiatric Association; 2000.
2. Dunsieth NW, Jr, Nelson EB, Brusman-Lovins LA, et al. Psychiatric and legal features of 113 men convicted of sexual offenses. J Clin Psychiatry. 2004;65(3):293-300.
3. Wallace C, Mullen P, Burgess P, et al. Serious criminal offending and mental disorder. Case linkage study. Br J Psychiatry. 1998;172:477-484.
4. Alish Y, Birger M, Manor N, et al. Schizophrenia sex offenders: a clinical and epidemiological comparison study. Int J Law Psychiatry. 2007;30(6):459-466.
5. Smith AD, Taylor PJ. Serious sex offending against women by men with schizophrenia. Relationship of illness and psychiatric symptoms to offending. Br J Psychiatry. 1999;174:233-237.
6. Drake CR, Pathé M. Understanding sexual offending in schizophrenia. Crim Behav Ment Health. 2004;14(2):108-120.
7. Harley EW, Boardman J, Craig T. Sexual problems in schizophrenia prevalence and characteristics: a cross sectional survey. Soc Psychiatry Psychiatr Epidemiol. 2010;45(7):759-766.
8. Galli V, McElroy SL, Soutullo CA, et al. The psychiatric diagnoses of twenty-two adolescents who have sexually molested other children. Compr Psychiatry. 1999;40(2):85-88.
9. Abel GG, Jordan A, Hand CG, et al. Classification models of child molesters utilizing the Abel Assessment for sexual interest. Child Abuse Negl. 2001;25(5):703-718.
10. Hanson RK, Thornton D. Improving risk assessments for sex offenders: a comparison of three actuarial scales. Law Hum Behav. 2000;24(1):119-136.
11. Hanson RK, Harris AJ, Scott TL, et al. Assessing the risk of sexual offenders on community supervision: The Dynamic Supervision Project. Vol 5. Ottawa, Canada: Public Safety Canada; 2007.
12. Quinsey VL, Harris AJ, Rice ME, et al. Violent offenders: appraising and managing risk. 2nd ed. Washington DC: American Psychological Association; 2006.
13. Seto M, Cantor JM, Blanchard R. Child pornography offenses are a valid diagnostic indicator of pedophilia. J Abnorm Psychol. 2006;115(3):610-615.
14. Thibaut F, De La Barra F, Gordon H, et al. WFSBP Task Force on Sexual Disorders. The World Federation of Societies of Biological Psychiatry (WFSBP) guidelines for the biological treatment of paraphilias. World J Biol Psychiatry. 2010;11(4):604-655.
CASE: Paranoid and distressed
Mr. P, age 21, is a single, white college student who presents to a psychiatric emergency room with his father at his psychotherapist’s recommendation. The psychotherapist, who has been treating Mr. P for anxiety and depression, recommended he be evaluated because of increased erratic behavior and paranoia. Mr. P reports that he has been feeling increasingly “anxious” and “paranoid” and thinks the security cameras at his college have been following him. He also describes an increased connection with God and hearing God’s voice as a commentary on his behaviors. Mr. P denies euphoria, depression, increased goal-directed activities, distractibility, increased impulsivity, or rapid speech. He is admitted voluntarily to the psychiatric unit for further evaluation.
During the hospitalization, Mr. P discloses that he has been viewing child pornography for 2 years, and during the past 6 months he has been distressed by the intensity of his sexual fantasies involving sexual contact with prepubescent girls. He also continues to experience paranoia and increased religiosity.
Mr. P says he began looking at pornography on the internet at age 14. He says he was watching “regular straight porn” and he would use it to masturbate and achieve orgasm. Mr. P began looking at child pornography at age 19. He stated that “regular porn” was no longer sufficiently arousing for him. Mr. P explains, “First, I started looking for 15- or 16-year-olds. They would work for a while [referring to sexual gratification], but then I would look for younger girls.” He says the images of younger girls are sexually arousing, typically “young girls, 8 to 10 years old” who are nude or involved in sex acts.
Mr. P denies sexual contact with prepubescent individuals and says his thoughts about such contact are “distressing.” He reports that he has viewed child pornography even when he wasn’t experiencing psychotic or mood symptoms. Mr. P’s outpatient psychotherapist reports that Mr. P first disclosed viewing child pornography and his attraction to prepubescent girls 2 years before this admission.
The authors’ observations
DSM-IV-TR diagnostic criteria for pedophilia (Table 1)1 are based on a history of sexual arousal to prepubescent individuals. A subset of sex offenders meet criteria for a paraphilia (Table 2),1 an axis I disorder, and a subset of sex offenders with paraphilia meet diagnostic criteria for pedophilia. Dunsieth et al2 found that among a sample of 113 male sex offenders, 74% had a diagnosable paraphilia, and 50% of individuals with paraphilia met criteria for pedophilia.
Table 1
DSM-IV-TR diagnostic criteria for pedophilia
| A) | Over a period of ≥6 months, recurrent, intense sexually arousing fantasies, sexual urges, or behaviors involving sexual activity with a prepubescent child or children (generally age ≤13) |
| B) | The person has acted on these sexual urges, or the sexual urges or fantasies cause marked distress or interpersonal difficulty |
| C) | The person is age ≥16 and ≥5 years older than the child or children in criterion A |
| Note: Do not include an individual in late adolescence involved in an ongoing sexual relationship with a 12- or 13-year-old | |
| Source: Reference 1 | |
DSM-IV-TR diagnostic criteria for a paraphilia
| The essential features of a paraphilia are recurrent, intense sexually arousing fantasies, sexual urges, or behaviors generally involving: | |
| A) | nonhuman objects, the suffering or humiliation of oneself or one’s partner, or children or other nonconsenting persons that occur over a period of ≥6 months |
| B) | The behavior, sexual urges, or fantasies cause clinically significant distress or impairment in social, occupational, or other important areas of functioning |
| Source: Reference 1 | |
Although most schizophrenia patients without a history of sexual offenses do not exhibit sexual deviancy, sexual content in hallucinations and delusions is common.6 Confusion about sexual identity and the boundaries of one’s body are common and may contribute to sexual deviancy.6 Psychiatric inpatients without a history of sexual offenses—including but not limited to psychotic patients—have higher rates of sexually deviant fantasies and behaviors compared with those without psychiatric illness.6 In one survey, 15% of men with schizophrenia displayed paraphilic behaviors and 20% had atypical sexual thoughts.7
Alish et al4 found that pedophilia was not necessarily linked to psychotic behavior or antisocial personality features when comparing pedophilia rates in individuals with or without schizophrenia. In a sample of 22 adolescent males who sexually molested a child at least once, axis I morbidity was common, and 55% met criteria for bipolar disorder.8
Few experts in paraphilias
A patient who endorses deviant sexual fantasies should be evaluated by a mental health professional with specialized training in paraphilias. Although paraphilias are not recognized as a subspecialty in psychiatry, diagnosing and treating patients with a paraphilia requires additional training. There is a scarcity of psychiatrists trained to evaluate and treat patients with paraphilias.
Sexual evaluation. Evaluating a patient who presents with problematic sexual behaviors includes performing a comprehensive psychiatric history with a focus on sexual history. A psychosexual history is distinct from general psychiatric evaluations because of the level of detail regarding a sexual history (Table 3). In addition to the clinical interview, objective testing to determine sexual interests may be useful in some patients (Table 4).9
Actuarial tools—risk assessment instruments based on statistically significant risk factors—are valid tools for determining the risk of sexual reoffending. There are several validated actuarial tools in the assessment of sex offender recidivism, such as the Static-99R,10 Stable-2007,11 and the Sex Offender Risk Appraisal Guide.12 However, these tools are used for sex offenders, and would not be used for individuals who have not committed a sex offense, such as Mr. P.
Table 3
Psychosexual evaluation
| Aspect of evaluation | Measures |
| Sexual behavior history | History of sexual abuse Childhood exposure to sex Masturbation history Preferred sexual partners Kinsey Scale |
| Sexual addiction or compulsion | Total Sexual Outlet measure Amount of time in sexual fantasy Financial, legal, or social cost of sexual behavior Prior treatment of sexual behavior |
| Sexual interests | Sex, age, and number of partner(s) Review of criteria for all paraphilias (exposing, voyeurism, cross-dressing, sadistic or masochistic interests) |
Objective testing to determine sexual interests
| Test | Results |
|---|---|
| Penile plethysmograph | Measures penis circumference with a mercury-in-rubber strain gauge. Used clinically by measuring circumferential changes in the penis while the patient is listening to audio or video stimuli of various sexual vignettes |
| Abel Assessment for Sexual Interests-3 | An objective method for evaluating deviant sexual interest uses noninvasive means to achieve objective measures of sexual interest. The subject’s visual response time is measured while viewing images of males and females of varying age. Visual reaction time is correlated with sexual interests |
| Source: Reference 9 | |
Medicolegal aspects of a psychosexual evaluation may include mandated reporting, confidentiality, and documentation. Mental health professionals are mandated to report to law enforcement or child welfare agencies when they observe or suspect physical, sexual, or other types of abuse in vulnerable populations such as children. In psychosexual evaluations, the evaluator is legally required to report if a patient discloses current sexual behavior with a child with a plan to continue to engage in the behavior. In Mr. P’s case, there was no duty to report because although he described viewing child pornography and had a sexual interest in prepubescent individuals, he did not report a history of engaging in handson sexual behaviors with children or impulses to do so. When an individual has engaged in sexual contact with a prepubescent individual, reporting is not mandated unless the individual continues to engage in sexual behavior with a minor. Mental health professionals are not responsible for calling the police or alerting authorities after a crime has been committed.
The relationship between viewing child pornography and pedophilia is unclear. Some child pornography viewers are pedophilic, others are sexually compulsive, and others are viewing out of curiosity and have no sexual deviance. Seto et al13 suggested that child pornography offenders show greater sexual arousal to children than to adults. Persistent child pornography use is a stronger diagnostic indicator of pedophilia than sexually offending against child victims.13 A clinician who learns that a patient is viewing child pornography should take a detailed sexual history, including a review of criteria for paraphilias. In addition, when appropriate, the clinician should perform a risk assessment to determine the patient’s risk of engaging in sexual offenses with children.
OUTCOME: Expert consultation
We start Mr. P on risperidone, 1 mg/d, to treat his paranoia and request a consultation with an expert in paraphilias to determine if Mr. P has a paraphilia and to discuss treatment options.
Mr. P’s initial diagnosis is psychotic disorder not otherwise specified. His viewing of child pornography and sexual interest in prepubescent individuals is not limited to his current mental status, and these interests persist in the absence of mood and psychotic states. Mr. P’s viewing of child pornography and sexual attraction to prepubescent girls meet the diagnostic criteria for pedophilia. During hospitalization, we educate Mr. P about his diagnoses and need for continued treatment. We refer him to a sexual disorders outpatient clinic, which continues to address his deviant sexual interests.
The authors’ observations
A meta-analysis indicates that a combination of pharmacologic and behavioral treatments coupled with close legal supervision seems to reduce the risk of repeated sexual offenses.14 Legal supervision is a general term to describe oversight of offenders in the community by supervisory boards, such as probation or parole, and tracking devices such as GPS. Currently, pedophilia treatment focuses on minimizing deviant sexual arousal through behavioral modification, cognitive-behavioral therapies, and testosterone-lowering medications, such as medroxyprogesterone or leuprolide. The decision to prescribe testosterone-lowering medication should be based on informed consent and the patient’s risk of dangerous sexual behaviors.
- Reijnen L, Bulten E, Nijman H. Demographic and personality characteristics of internet child pornography downloaders in comparison to other offenders. J Child Sex Abus. 2009;18(6):611-622.
- Hall RC, Hall RC. A profile of pedophilia: definition, characteristics of offenders, recidivism, treatment outcomes, and forensic issues. Mayo Clin Proc. 2007;82(4):457-471.
- Leuprolide • Eligard, Lupron
- Medroxyprogesterone • Cycrin, Provera
- Risperidone • Risperdal
The authors report no financial relationship with any company whose products are mentioned in this article or with manufacturers of competing products.
1. Diagnostic and statistical manual of mental disorders, 4th ed, text rev. Washington DC: American Psychiatric Association; 2000.
2. Dunsieth NW, Jr, Nelson EB, Brusman-Lovins LA, et al. Psychiatric and legal features of 113 men convicted of sexual offenses. J Clin Psychiatry. 2004;65(3):293-300.
3. Wallace C, Mullen P, Burgess P, et al. Serious criminal offending and mental disorder. Case linkage study. Br J Psychiatry. 1998;172:477-484.
4. Alish Y, Birger M, Manor N, et al. Schizophrenia sex offenders: a clinical and epidemiological comparison study. Int J Law Psychiatry. 2007;30(6):459-466.
5. Smith AD, Taylor PJ. Serious sex offending against women by men with schizophrenia. Relationship of illness and psychiatric symptoms to offending. Br J Psychiatry. 1999;174:233-237.
6. Drake CR, Pathé M. Understanding sexual offending in schizophrenia. Crim Behav Ment Health. 2004;14(2):108-120.
7. Harley EW, Boardman J, Craig T. Sexual problems in schizophrenia prevalence and characteristics: a cross sectional survey. Soc Psychiatry Psychiatr Epidemiol. 2010;45(7):759-766.
8. Galli V, McElroy SL, Soutullo CA, et al. The psychiatric diagnoses of twenty-two adolescents who have sexually molested other children. Compr Psychiatry. 1999;40(2):85-88.
9. Abel GG, Jordan A, Hand CG, et al. Classification models of child molesters utilizing the Abel Assessment for sexual interest. Child Abuse Negl. 2001;25(5):703-718.
10. Hanson RK, Thornton D. Improving risk assessments for sex offenders: a comparison of three actuarial scales. Law Hum Behav. 2000;24(1):119-136.
11. Hanson RK, Harris AJ, Scott TL, et al. Assessing the risk of sexual offenders on community supervision: The Dynamic Supervision Project. Vol 5. Ottawa, Canada: Public Safety Canada; 2007.
12. Quinsey VL, Harris AJ, Rice ME, et al. Violent offenders: appraising and managing risk. 2nd ed. Washington DC: American Psychological Association; 2006.
13. Seto M, Cantor JM, Blanchard R. Child pornography offenses are a valid diagnostic indicator of pedophilia. J Abnorm Psychol. 2006;115(3):610-615.
14. Thibaut F, De La Barra F, Gordon H, et al. WFSBP Task Force on Sexual Disorders. The World Federation of Societies of Biological Psychiatry (WFSBP) guidelines for the biological treatment of paraphilias. World J Biol Psychiatry. 2010;11(4):604-655.
PSYCHIATRY UPDATE 2013
Current Psychiatry and the American Academy of Clinical Psychiatrists were pleased to host more than 550 psychiatric practitioners for this conference, led by Meeting Chair Richard Balon, MD, and Meeting Co-Chairs Donald W. Black, MD, and Nagy Youssef, MD, April 4-6, 2013 at the Swissôtel in Chicago, IL. Attendees could earn up to 18 AMA PRA Category 1 Credits™.
THURSDAY, APRIL 4, 2013
MORNING SESSIONS
Evidence-based medicine and treatment guidelines may not address complex patients with treatment-resistant depression (TRD). Andrew A. Nierenberg, MD, Massachusetts General Hospital, reviewed newer medications for TRD, including olanzapine-fluoxetine combination, ketamine, riluzole, and L-methylfolate; however, use of these medications requires careful consideration of risks and benefits.
Many FDA-approved drugs have a “black-box” warning, but still are widely used. Henry A. Nasrallah, MD, University of Cincinnati, reviewed black-box warnings for antipsychotics, antidepressants, mood stabilizers, benzodiazepines, stimulants, opiates, and hypnotics and offered strategies on how to incorporate these warnings into clinical practice.
Dr. Nierenberg discussed the outcomes of 3 published medication effectiveness studies for bipolar disorder (BD)—STEP-BD, BALANCE, and LiTMUS—and one currently underway, CHOICE. These studies examined monotherapy and combination therapy with antidepressants, anticonvulsants, antipsychotics, and psychosocial interventions.
Although there is an association between psychosis and violence, most psychotic patients are not violent. Rajiv Tandon, MD, University of Florida, reviewed modifiable and nonmodifiable risk factors for violence, key clinical questions to consider, and scales to use when assessing a patient’s risk of violence.
AFTERNOON SESSIONS
Measuring biomarkers can augment other clinical methods to help identify metabolic, structural, and functional brain changes associated with preclinical stages of cognitive disorders. James Ellison, MD, MPH, McLean Hospital, Harvard Medical School, explained how biomarkers can improve the differential diagnosis of memory impairments and aid in identifying different types of dementia.

Donald W. Black, MD, (right) receives the 2013 George Winokur Research
Award from Carol S. North, MD, for his article on pathological gambling
Case-control studies have found a strong association between schizophrenia and type II diabetes, which contributes to higher mortality among schizophrenia patients. Along with vigilant metabolic monitoring, Dr. Tandon recommended a therapeutic approach that includes changing antipsychotics, prescribing metformin, suggesting lifestyle interventions, and treating comorbid conditions.
Depressed older adults may report anxiety, hopelessness, anhedonia, or somatic symptoms, rather than sadness. Depressive symptoms may be associated with vascular disease or cognitive impairment. Dr. Ellison reviewed psychotherapeutic and pharmacologic treatments for older depressed patients.
FRIDAY, APRIL 5, 2013
MORNING SESSIONS
Many strategies exist for treating patients with TRD; adding an atypical antipsychotic has the best evidence, but there are tolerability considerations. Dr. Nierenberg suggested using a combination of treatments.
Pregnancy is inherently risky for women who take antipsychotics. In all patients of childbearing potential, take a thorough reproductive history and ask about contraception use. Marlene P. Freeman, MD, Massachusetts General Hospital, explained that psychotropics with unfavorable FDA pregnancy ratings may be among first-line choices.

George T. Grossberg, MD, (left) speaks with attendees
Clinical symptoms, cognitive deficits, psychiatric comorbidities, genetic factors, neuroimaging features, and pharmacotherapy may overlap considerably between schizophrenia and BD. Dr. Nasrallah described clinical features that differentiate the 2 disorders.
Cognitive enhancers can improve activities of daily living, behavior, and cognition in patients with Alzheimer’s disease. George T. Grossberg, MD, St. Louis University, reviewed the evidence for acetylcholinesterase inhibitors, the NMDA receptor antagonist memantine, combination therapy, and atypical antipsychotics.
Dietary consultation for older patients might help delay or decrease their risk of dementia. Patients should consume omega-3 fatty acids, whole grains, fresh fruits and vegetables, beans, legumes, and certain spices. Dr. Grossberg also suggested patients engage in physical and mental exercises, social and spiritual activities, and stress reduction, and control cardiovascular risk factors.
AFTERNOON SESSIONS
Many women experience anxiety during pregnancy, and the risk is highest during the first trimester. Dr. Freeman reviewed prevalence, diagnosis, and treatment of panic disorder, generalized anxiety disorder, obsessive-compulsive disorder, and posttraumatic stress disorder during pregnancy and postpartum.
Kathleen Brady, MD, PhD, Medical University of South Carolina, explained how methylenedioxypyrovalerone, also known as bath salts, and other designer drugs are not detectable on standard urine drug screens. Agitation, tachycardia, combative behavior, hyperthermia, and hallucinations have been reported.

Kathleen Brady, MD, MPH
Alcohol abuse and depression are highly comorbid and are associated with higher suicidality, more severe symptoms, and poorer treatment response than either disorder alone. Depressive symptoms often are seen during alcohol withdrawal, and may resolve with abstinence. Dr. Brady reviewed the evidence for treating depressed alcoholics with antidepressants, medications targeting alcohol dependence such as disulfiram and naltrexone, and psychotherapy.
Ralph Aquila, MD, Columbia College of Physicians and Surgeons, discussed risk factors for and consequences of treatment nonadherence in patients with schizophrenia. Leslie L. Citrome, MD, MPH, New York Medical College, covered strategies to improve adherence, including identifying and addressing barriers to adherence for individual patients, improving the therapeutic alliance, and considering long-acting injectable antipsychotics.
SATURDAY, APRIL 6, 2013
MORNING SESSIONS
Forty-six percent of depressed patients will stop pharmacotherapy before they have a chance to respond. To minimize short-term side effects, Andrew J. Cutler, MD, Florida Clinical Research Center, suggested educating patients and slowly titrating medications; options for reducing long-term side effects or residual symptoms include switching or augmenting pharmacotherapy.
When treating patients addicted to opioids, outcome measures go beyond general health to obtaining employment and reducing criminal activity. Pharmacotherapy options include methadone maintenance therapy, oral and injectable naltrexone, and oral, sublingual, and implantable buprenorphine. Walter Ling, MD, David Geffen School of Medicine at UCLA, described factors that may improve patient outcomes.
Geriatric BD is relatively common in clinical settings, but there is a lack of evidence-based clinical practice guidelines. James W. Jefferson, MD, University of Wisconsin School of Medicine and Public Health, recommended choosing a treatment based on the illness phase and balancing the benefit of certain pharmacotherapies against short- and long-term risks.

Most medications for treating alcohol dependence work by modulating functions of opioids, glutamate, GABA, and serotonin. Dr. Ling reviewed the evidence base, dosing guidelines, and clinical recommendations for disulfiram, oral and injectable naltrexone, and acamprosate, which are FDA-approved for treating alcohol dependence. He also recommended combining medications with nonpharmacologic treatments, such as 12-step programs.
Most people who die by suicide deny suicide ideation at their last mental health visit. Risk factors for suicide include family history of suicide, childhood or adult trauma, substance abuse, stressful life events, chronic illness, and psychiatric disorders. Dr. Jefferson described suicide rating and tracking scales and encouraged clinicians to document suicide risk evaluations.
AFTERNOON SESSION

Roger S. McIntyre, MD, FRCPCRobert M.A. Hirschfeld, MD, University of Texas Medical Branch, discussed how the concept of allostatic load—bodily “wear and tear” that emerges with sustained allostatic states—may help explain cognitive and physical decline associated with BD. Roger S. McIntyre, MD, FRCPC, University of Toronto, emphasized that BD is a progressive disorder and comorbidities such as metabolic problems may promote this progression. Terence A. Ketter, MD, Stanford School of Medicine, covered new developments in BD treatment, including certain second-generation antipsychotics, dopaminergic neurotransmission enhancers, mood stabilizers, adjunctive antidepressants, and adjunctive psychotherapy.
Current Psychiatry and the American Academy of Clinical Psychiatrists were pleased to host more than 550 psychiatric practitioners for this conference, led by Meeting Chair Richard Balon, MD, and Meeting Co-Chairs Donald W. Black, MD, and Nagy Youssef, MD, April 4-6, 2013 at the Swissôtel in Chicago, IL. Attendees could earn up to 18 AMA PRA Category 1 Credits™.
THURSDAY, APRIL 4, 2013
MORNING SESSIONS
Evidence-based medicine and treatment guidelines may not address complex patients with treatment-resistant depression (TRD). Andrew A. Nierenberg, MD, Massachusetts General Hospital, reviewed newer medications for TRD, including olanzapine-fluoxetine combination, ketamine, riluzole, and L-methylfolate; however, use of these medications requires careful consideration of risks and benefits.
Many FDA-approved drugs have a “black-box” warning, but still are widely used. Henry A. Nasrallah, MD, University of Cincinnati, reviewed black-box warnings for antipsychotics, antidepressants, mood stabilizers, benzodiazepines, stimulants, opiates, and hypnotics and offered strategies on how to incorporate these warnings into clinical practice.
Dr. Nierenberg discussed the outcomes of 3 published medication effectiveness studies for bipolar disorder (BD)—STEP-BD, BALANCE, and LiTMUS—and one currently underway, CHOICE. These studies examined monotherapy and combination therapy with antidepressants, anticonvulsants, antipsychotics, and psychosocial interventions.
Although there is an association between psychosis and violence, most psychotic patients are not violent. Rajiv Tandon, MD, University of Florida, reviewed modifiable and nonmodifiable risk factors for violence, key clinical questions to consider, and scales to use when assessing a patient’s risk of violence.
AFTERNOON SESSIONS
Measuring biomarkers can augment other clinical methods to help identify metabolic, structural, and functional brain changes associated with preclinical stages of cognitive disorders. James Ellison, MD, MPH, McLean Hospital, Harvard Medical School, explained how biomarkers can improve the differential diagnosis of memory impairments and aid in identifying different types of dementia.
Donald W. Black, MD, (right) receives the 2013 George Winokur Research
Award from Carol S. North, MD, for his article on pathological gambling
Case-control studies have found a strong association between schizophrenia and type II diabetes, which contributes to higher mortality among schizophrenia patients. Along with vigilant metabolic monitoring, Dr. Tandon recommended a therapeutic approach that includes changing antipsychotics, prescribing metformin, suggesting lifestyle interventions, and treating comorbid conditions.
Depressed older adults may report anxiety, hopelessness, anhedonia, or somatic symptoms, rather than sadness. Depressive symptoms may be associated with vascular disease or cognitive impairment. Dr. Ellison reviewed psychotherapeutic and pharmacologic treatments for older depressed patients.
FRIDAY, APRIL 5, 2013
MORNING SESSIONS
Many strategies exist for treating patients with TRD; adding an atypical antipsychotic has the best evidence, but there are tolerability considerations. Dr. Nierenberg suggested using a combination of treatments.
Pregnancy is inherently risky for women who take antipsychotics. In all patients of childbearing potential, take a thorough reproductive history and ask about contraception use. Marlene P. Freeman, MD, Massachusetts General Hospital, explained that psychotropics with unfavorable FDA pregnancy ratings may be among first-line choices.
George T. Grossberg, MD, (left) speaks with attendees
Clinical symptoms, cognitive deficits, psychiatric comorbidities, genetic factors, neuroimaging features, and pharmacotherapy may overlap considerably between schizophrenia and BD. Dr. Nasrallah described clinical features that differentiate the 2 disorders.
Cognitive enhancers can improve activities of daily living, behavior, and cognition in patients with Alzheimer’s disease. George T. Grossberg, MD, St. Louis University, reviewed the evidence for acetylcholinesterase inhibitors, the NMDA receptor antagonist memantine, combination therapy, and atypical antipsychotics.
Dietary consultation for older patients might help delay or decrease their risk of dementia. Patients should consume omega-3 fatty acids, whole grains, fresh fruits and vegetables, beans, legumes, and certain spices. Dr. Grossberg also suggested patients engage in physical and mental exercises, social and spiritual activities, and stress reduction, and control cardiovascular risk factors.
AFTERNOON SESSIONS
Many women experience anxiety during pregnancy, and the risk is highest during the first trimester. Dr. Freeman reviewed prevalence, diagnosis, and treatment of panic disorder, generalized anxiety disorder, obsessive-compulsive disorder, and posttraumatic stress disorder during pregnancy and postpartum.
Kathleen Brady, MD, PhD, Medical University of South Carolina, explained how methylenedioxypyrovalerone, also known as bath salts, and other designer drugs are not detectable on standard urine drug screens. Agitation, tachycardia, combative behavior, hyperthermia, and hallucinations have been reported.
Kathleen Brady, MD, MPH
Alcohol abuse and depression are highly comorbid and are associated with higher suicidality, more severe symptoms, and poorer treatment response than either disorder alone. Depressive symptoms often are seen during alcohol withdrawal, and may resolve with abstinence. Dr. Brady reviewed the evidence for treating depressed alcoholics with antidepressants, medications targeting alcohol dependence such as disulfiram and naltrexone, and psychotherapy.
Ralph Aquila, MD, Columbia College of Physicians and Surgeons, discussed risk factors for and consequences of treatment nonadherence in patients with schizophrenia. Leslie L. Citrome, MD, MPH, New York Medical College, covered strategies to improve adherence, including identifying and addressing barriers to adherence for individual patients, improving the therapeutic alliance, and considering long-acting injectable antipsychotics.
SATURDAY, APRIL 6, 2013
MORNING SESSIONS
Forty-six percent of depressed patients will stop pharmacotherapy before they have a chance to respond. To minimize short-term side effects, Andrew J. Cutler, MD, Florida Clinical Research Center, suggested educating patients and slowly titrating medications; options for reducing long-term side effects or residual symptoms include switching or augmenting pharmacotherapy.
When treating patients addicted to opioids, outcome measures go beyond general health to obtaining employment and reducing criminal activity. Pharmacotherapy options include methadone maintenance therapy, oral and injectable naltrexone, and oral, sublingual, and implantable buprenorphine. Walter Ling, MD, David Geffen School of Medicine at UCLA, described factors that may improve patient outcomes.
Geriatric BD is relatively common in clinical settings, but there is a lack of evidence-based clinical practice guidelines. James W. Jefferson, MD, University of Wisconsin School of Medicine and Public Health, recommended choosing a treatment based on the illness phase and balancing the benefit of certain pharmacotherapies against short- and long-term risks.
Most medications for treating alcohol dependence work by modulating functions of opioids, glutamate, GABA, and serotonin. Dr. Ling reviewed the evidence base, dosing guidelines, and clinical recommendations for disulfiram, oral and injectable naltrexone, and acamprosate, which are FDA-approved for treating alcohol dependence. He also recommended combining medications with nonpharmacologic treatments, such as 12-step programs.
Most people who die by suicide deny suicide ideation at their last mental health visit. Risk factors for suicide include family history of suicide, childhood or adult trauma, substance abuse, stressful life events, chronic illness, and psychiatric disorders. Dr. Jefferson described suicide rating and tracking scales and encouraged clinicians to document suicide risk evaluations.
AFTERNOON SESSION
Roger S. McIntyre, MD, FRCPCRobert M.A. Hirschfeld, MD, University of Texas Medical Branch, discussed how the concept of allostatic load—bodily “wear and tear” that emerges with sustained allostatic states—may help explain cognitive and physical decline associated with BD. Roger S. McIntyre, MD, FRCPC, University of Toronto, emphasized that BD is a progressive disorder and comorbidities such as metabolic problems may promote this progression. Terence A. Ketter, MD, Stanford School of Medicine, covered new developments in BD treatment, including certain second-generation antipsychotics, dopaminergic neurotransmission enhancers, mood stabilizers, adjunctive antidepressants, and adjunctive psychotherapy.
Drive Change in an ACO

From informal polls I’ve recently conducted of hospitalists, many are not even aware they are part of an accountable-care organization (ACO). And if they are aware, they might not be engaging in meaningful dialogue with ACO leaders about their role in these organizations. But, in the long term, ACOs will need to bring hospitalists to the table in order to be successful.
Are You Part of an ACO?
David Muhlestein, who blogs for Health Affairs, tracks the growth of ACOs around the country. He states that, as of Jan. 31, there were 428 ACOs in the U.S. (see Figure 1).1 In terms of numbers, Florida, Texas, and California lead the nation with 42, 33, and 46 ACOs, respectively. So it is likely that you are part of an ACO. If you are unsure, ask your chief medical officer or president of the medical staff.

How ACOs Work
All ACOs seek to manage a group, or population, of patients as efficiently as possible while maintaining or improving quality of care. For Medicare ACOs, the goal is to bring together hospitals and physicians in order to share savings derived from efficiencies in care. But before any savings can be shared, the Medicare ACO must demonstrate that it achieved high-quality care across four domains, totaling 33 individual quality measures. (see Table 1)
Main Flavors of ACOs
There are two types of ACOs: private ACOs and Medicare ACOs. Prior to Medicare ACOs, which were launched in January 2012, there were 150 private-sector ACOs, and this number continues to grow. Private ACOs represent a heterogeneous group in terms of reimbursement model. Some operate under shared savings programs; others use full or partial capitation, bundled payments, and/or other types of arrangements. But nearly all ACOs operate under the premise that the incentives used to make care more efficient and less costly can only be applied if measurable quality is maintained or improved. ACOs do not pay doctors or hospitals more unless high quality is demonstrated.
ACO Quality Measures and Hospitalists
Most of the 33 quality measures required by Medicare ACOs are based in ambulatory practice. These include measures related to blood pressure, immunizations, cancer, and fall-risk screening, and measures for diabetics, such as lipids and hemoglobin A1C. However, there are a few measures for which hospitalists should share in accountability, including:
- All-cause hospital readmission rate—risk-standardized;
- Ambulatory sensitive condition hospital admission rates (CHF, COPD); and
- Medication reconciliation after discharge from an inpatient facility.
Four Key Actions for Hospitalists
Hospitalists make a significant contribution to the quality and the financial performance of ACOs. In addition to the quality metrics cited above, hospitalists impact the inpatient portion of the overall population’s cost of care. Furthermore, hospitalists are vital partners in the care coordination required for an ACO to be successful.
Here are four actions I suggest taking in order for your hospitalist group to be effective as participants in an ACO:
- Have a representative from your group participate in ACO committees that address hospital utilization and related matters, such as care coordination impacting pre- and post-hospital care.
- Learn how to work with ACO case managers on care transitions, including post-discharge follow-up and information transfer.
- Understand an ACO’s approach to engagement of and coordination with post-acute-care facilities. The ability of a post-acute facility, such a skilled nursing facility, to accept patients who have complex care needs, to manage changes in condition in the facility when appropriate, and to send complete information upon transfer to the hospital are important strategies for an ACO’s success.
- Understand how an ACO reports quality and cost performance and how savings will be shared among participants.
Mindset Change
If hospitalists are part of the chain of ACO physicians and providers held accountable for the health of a population of patients, we must work more closely with the medical home/neighborhood, post-acute-care facilities, and home-care providers. The change in mindset will occur only if we have a set of tools to get the job done, such as case managers and information technology, and the appropriate incentives to support better care coordination. I encourage my fellow hospitalists to make things happen, instead of taking a passive role in this monumental transformation.
Reference
Dr. Whitcomb is medical director of healthcare quality at Baystate Medical Center in Springfield, Mass. He is a co-founder and past president of SHM. Email him at [email protected].
From informal polls I’ve recently conducted of hospitalists, many are not even aware they are part of an accountable-care organization (ACO). And if they are aware, they might not be engaging in meaningful dialogue with ACO leaders about their role in these organizations. But, in the long term, ACOs will need to bring hospitalists to the table in order to be successful.
Are You Part of an ACO?
David Muhlestein, who blogs for Health Affairs, tracks the growth of ACOs around the country. He states that, as of Jan. 31, there were 428 ACOs in the U.S. (see Figure 1).1 In terms of numbers, Florida, Texas, and California lead the nation with 42, 33, and 46 ACOs, respectively. So it is likely that you are part of an ACO. If you are unsure, ask your chief medical officer or president of the medical staff.
How ACOs Work
All ACOs seek to manage a group, or population, of patients as efficiently as possible while maintaining or improving quality of care. For Medicare ACOs, the goal is to bring together hospitals and physicians in order to share savings derived from efficiencies in care. But before any savings can be shared, the Medicare ACO must demonstrate that it achieved high-quality care across four domains, totaling 33 individual quality measures. (see Table 1)
Main Flavors of ACOs
There are two types of ACOs: private ACOs and Medicare ACOs. Prior to Medicare ACOs, which were launched in January 2012, there were 150 private-sector ACOs, and this number continues to grow. Private ACOs represent a heterogeneous group in terms of reimbursement model. Some operate under shared savings programs; others use full or partial capitation, bundled payments, and/or other types of arrangements. But nearly all ACOs operate under the premise that the incentives used to make care more efficient and less costly can only be applied if measurable quality is maintained or improved. ACOs do not pay doctors or hospitals more unless high quality is demonstrated.
ACO Quality Measures and Hospitalists
Most of the 33 quality measures required by Medicare ACOs are based in ambulatory practice. These include measures related to blood pressure, immunizations, cancer, and fall-risk screening, and measures for diabetics, such as lipids and hemoglobin A1C. However, there are a few measures for which hospitalists should share in accountability, including:
- All-cause hospital readmission rate—risk-standardized;
- Ambulatory sensitive condition hospital admission rates (CHF, COPD); and
- Medication reconciliation after discharge from an inpatient facility.
Four Key Actions for Hospitalists
Hospitalists make a significant contribution to the quality and the financial performance of ACOs. In addition to the quality metrics cited above, hospitalists impact the inpatient portion of the overall population’s cost of care. Furthermore, hospitalists are vital partners in the care coordination required for an ACO to be successful.
Here are four actions I suggest taking in order for your hospitalist group to be effective as participants in an ACO:
- Have a representative from your group participate in ACO committees that address hospital utilization and related matters, such as care coordination impacting pre- and post-hospital care.
- Learn how to work with ACO case managers on care transitions, including post-discharge follow-up and information transfer.
- Understand an ACO’s approach to engagement of and coordination with post-acute-care facilities. The ability of a post-acute facility, such a skilled nursing facility, to accept patients who have complex care needs, to manage changes in condition in the facility when appropriate, and to send complete information upon transfer to the hospital are important strategies for an ACO’s success.
- Understand how an ACO reports quality and cost performance and how savings will be shared among participants.
Mindset Change
If hospitalists are part of the chain of ACO physicians and providers held accountable for the health of a population of patients, we must work more closely with the medical home/neighborhood, post-acute-care facilities, and home-care providers. The change in mindset will occur only if we have a set of tools to get the job done, such as case managers and information technology, and the appropriate incentives to support better care coordination. I encourage my fellow hospitalists to make things happen, instead of taking a passive role in this monumental transformation.
Reference
Dr. Whitcomb is medical director of healthcare quality at Baystate Medical Center in Springfield, Mass. He is a co-founder and past president of SHM. Email him at [email protected].
How EHRs went wrong
If, like me, you believe that electronic health records will play an important role in future of medicine but can’t figure out why the federal government is spending $19 billion dollars incentivizing the adoption of systems that aren’t ready for prime time, I have found an answer.
An article in the New York Times ("A Digital Shift on Health Data Swells Profits in an Industry," Feb. 19, 2013) provided a glimpse into the backstage story of some questionable associations that led to bad decisions.
Glen E. Tullman, who until recently was the chief executive of Allscripts, one of the three dominant players in the electronic health information business, was health technology advisor to the 2008 Obama campaign. Since President Obama took office in 2009, he has reportedly visited the White House on at least seven occasions. Mr. Tullman, who was quoted as saying, "We really haven’t done any lobbying," characterized his time in Washington as education. According to the New York Times article, Allscripts annual sales have more than doubled since 2009 to an estimated $1.44 billion dollars in 2012.
It appears that the lobbying efforts by Mr. Tullman and other members of the industry were instrumental in creating a timetable of incentives that had physicians and hospitals rushing to jump on the EHR train before it left the station – and before it was road worthy. The result has been huge profits to the largest digital records companies while smaller companies that may have been less ready to compete have withered, the Times said.
One could argue that this is just another example of survival of the fittest in the best tradition of American free market capitalism. The problem is that the subsidies have tilted the playing field, and the resulting products have not met the promises made by those who lobbied for them. The even bigger problem is that the government also failed to secure from the industry any guarantees that EHR systems would meet a set of minimum standards and be compatible with one another.
As physicians, we also must share some of the blame for this EHR debacle.
We have not been thoughtful consumers. Those of us in small physician-owned groups must understand the relationship between our overhead and the bottom line and carefully weigh whether an incentive makes sense for us financially. If we decide to buy an EHR, we must be good shoppers. We must visit several practices that match our demographic and have been using for several years the system we are considering – even if this means flying to other cities to get a broad sampling. We should drive a hard bargain with incentives for support and severe financial penalties for failure to produce. And we mustn’t be afraid to say to the vendors that either we or they aren’t ready.
Most of us, however, no longer practice in physician-owned practices anymore. For a variety of reasons, we have allowed others to make decisions that dictate how we practice medicine in the real world. Most of these "others" aren’t physicians, and if they were once physicians, they certainly aren’t now in the true sense of the word and they don’t have recent practical experience of seeing real patients in real time. These others are often the folks who choose when and from which vendors medical practices buy their EHRs.
By joining larger and larger provider organizations, practicing physicians have lost their ability to provide critical input into the choice of tools with which they will practice. The result has been large investments in EHR systems that neither save money nor provide better care. We can only hope that from the ashes of this first failed attempt will come a system that does what we and our patients want it to do.
Dr. Wilkoff practices general pediatrics in a multispecialty group practice in Brunswick, Maine. E-mail Dr. Wilkoff at [email protected].

The Corporation Cardiologist
In bygone days, your community hospital was a place where babies were born and gallbladders were removed. They were often run by city governments or local religious organizations. Of course, a lot has changed since then. Now your hospital advertises on television and extols the viewer about the medical miracles that are performed inside its walls. They also are getting bigger and merging with smaller and occasionally coequal institutions in the name of efficiency and in the effort to expand their patient catchment.
In an even larger sense, hospitals have been gobbled up by insurance companies and by for-profit networks in an attempt to maximize profits and minimize overhead. Some prestigious hospitals like the Mayo Clinic, the Cleveland Clinic, and MD Anderson Cancer Center have even established affiliations with community hospitals thousands of miles away seemingly to improve local care and at the same time to expand their referral network. Where local hospitals are not adequate and the market beckons, some have even built their own facilities not only in the United States, but also in countries around the globe.
The intent of these network affiliations is not only to improve their image but to impart some of their prestige to the local entities as well. As a result of these mergers and consolidations, they are positioning themselves to be more competitive in the new world of health care. Some would profess the altruism of providing better care either locally or at a distance, but in the long run, economics and market share are the driving force. They have not been concerned with delivering babies or taking out gallbladders for a long time.
Few can predict what the new world will look like, but it is quite certain that the Affordable Care Act will re-create or substantially modify American health care as we know it. The potential of attracting thousands of previously uninsured patients, who – with the help of the federal government – can come in the front door for care rather that using the back door of the emergency department for treatment, will be an important target.
In this environment, the practicing physician is caught in the changing tide. Many who are not in the swim will be washed up on the beach. Cardiology, along with oncology and gastroenterology, are the prime targets for the anticipated efficiencies evolving from the hospital system expansions and mergers. Although there is a well-recognized need for primary care health care professionals, much of this need is already being filled by nonphysician professionals. It is possible that cardiology, which has been one of the star profit centers, could become a target for consolidation and economy in the future. We may be seeing some of this, as the opportunities for finishing trainees appear to be diminishing.
It is obvious that there has been a major shift in the setting cardiology practices in the last few years. Since 2007, the proportion of physician-owned practices has decreased substantially. While the number of cardiologists employed by hospitals has grown from 11% to 35%, physician-owned practices have decreased from 59% to 36%. This migration of private practice to hospital-based practice is sure to continue. Cardiology practice will soon be directed by managers representing corporate health care who will be intent on putting in place programs that will establish protocol-driven therapy in the name of "quality" and "cost." Many of the changes will lead to better outcomes. Patient "satisfaction" will be measured by metrics already operational in the corporate environment. As the era of cardiology entrepreneurism faces institutional controls, such profit centers as imaging already are facing significant obstacles. The "down side" of this process will be the death of medical care as we knew it. It was not all bad. That mode of physician-driven, patient-centered care will not be easily transferred into the corporate care environment. The physician will need to ensure that at least that vestige of old-style medical care will not be entirely lost.
Dr. Goldstein, medical editor of Cardiology News, is professor of medicine at Wayne State University and division head emeritus of cardiovascular medicine at Henry Ford Hospital, both in Detroit. He is on data safety monitoring committees for the National Institutes of Health and several pharmaceutical companies.
Make your practice's Facebook page a success
LAS VEGAS – Hoping to make your practice’s Facebook page a success? Engage with your Facebook followers.
According to Monique Ramsey, founder of Del Mar, Calif.–based Cosmetic Social Media, the best path to social media success involves fostering. "Think about who your consumer is and what she wants to learn about," she advised.
"Provide that information to her and let her share it with her friends, because then your name is attached to that piece of content. And note it may not have anything to do with your cosmetic surgery practice, but this kind of a post will keep people coming to your page and get higher visibility for your posts in the newsfeed," she added.

The goal is to have your posts reach more than the Facebook average, which is about 16% of your Facebook followers. With more than 1 billion people using Facebook, physicians need to be able to "cut through the noise," Ms. Ramsey explained at the annual meeting of the American Academy of Cosmetic Surgery.
It’s okay for 20% of your posts to be about your practice – perhaps advertising special events and promotions – but the remaining 80% should be informative and off the topic yet engaging, meaningful, and fun.
For example, Ms. Ramsey crafted questions for one of her client’s Facebook page intended to trigger engagement in the form of comments. One read "It’s National Wine Day. Are you a red, white or bubbly?" Another post example was crafted to encourage fans to hit the "like" button and featured two cars, sporting false eyelashes which read, "Bet you the lady car uses Latisse – hit your LIKE button if you do too!" Both questions created a spike in traffic, engagement rate, and conversation on her client’s Facebook page, she said. The latter resulted in a reach of over 10,000 people and an engagement rate of over 11% (2% is average).
"You’re trying to create an emotional connection with your Facebook followers," Ms. Ramsey said. "When you’re doing your job right, you will. You will feel like a friend to people. You want people to feel like they’re part of a community. You want to be a resource for them. You want to share your own content as well as other people’s content. Social media is very reciprocal, so give a little and get a lot."
Other tips she shared for optimizing a practice’s Facebook page include the following:
• Be yourself. "Credibility and trust are important," Ms. Ramsey said. "Be authentic. Be humble. Think about influencing conversations, not controlling conversations. You can influence behavior but you don’t have to control it."
• Change your cover image at least monthly. That’s because cover images "get, on average, nine times more engagement than a regular post," she said. "Celebrate your 100th fan, or use this space to advertise a promotion you have going on."
• Make sure your avatar is superb. Ninety percent of Facebook users see your content in their newsfeed, "so it really needs to be good and easy to see," she said. "People prefer to hear from a face of the practice rather than a logo or building because we humans communicate with people, not logos."
• Monitor replies to your posts. If someone is sending abusive messages, "you can hide those messages and block that person from your page. Or it might be better to leave it there and let your community come to your defense on your behalf. I have only had to take down two messages on behalf of clients. Both were from competing physicians."
Ms. Ramsey is the founder of Cosmetic Social Media and had no other financial conflicts to disclose.
LAS VEGAS – Hoping to make your practice’s Facebook page a success? Engage with your Facebook followers.
According to Monique Ramsey, founder of Del Mar, Calif.–based Cosmetic Social Media, the best path to social media success involves fostering. "Think about who your consumer is and what she wants to learn about," she advised.
"Provide that information to her and let her share it with her friends, because then your name is attached to that piece of content. And note it may not have anything to do with your cosmetic surgery practice, but this kind of a post will keep people coming to your page and get higher visibility for your posts in the newsfeed," she added.
The goal is to have your posts reach more than the Facebook average, which is about 16% of your Facebook followers. With more than 1 billion people using Facebook, physicians need to be able to "cut through the noise," Ms. Ramsey explained at the annual meeting of the American Academy of Cosmetic Surgery.
It’s okay for 20% of your posts to be about your practice – perhaps advertising special events and promotions – but the remaining 80% should be informative and off the topic yet engaging, meaningful, and fun.
For example, Ms. Ramsey crafted questions for one of her client’s Facebook page intended to trigger engagement in the form of comments. One read "It’s National Wine Day. Are you a red, white or bubbly?" Another post example was crafted to encourage fans to hit the "like" button and featured two cars, sporting false eyelashes which read, "Bet you the lady car uses Latisse – hit your LIKE button if you do too!" Both questions created a spike in traffic, engagement rate, and conversation on her client’s Facebook page, she said. The latter resulted in a reach of over 10,000 people and an engagement rate of over 11% (2% is average).
"You’re trying to create an emotional connection with your Facebook followers," Ms. Ramsey said. "When you’re doing your job right, you will. You will feel like a friend to people. You want people to feel like they’re part of a community. You want to be a resource for them. You want to share your own content as well as other people’s content. Social media is very reciprocal, so give a little and get a lot."
Other tips she shared for optimizing a practice’s Facebook page include the following:
• Be yourself. "Credibility and trust are important," Ms. Ramsey said. "Be authentic. Be humble. Think about influencing conversations, not controlling conversations. You can influence behavior but you don’t have to control it."
• Change your cover image at least monthly. That’s because cover images "get, on average, nine times more engagement than a regular post," she said. "Celebrate your 100th fan, or use this space to advertise a promotion you have going on."
• Make sure your avatar is superb. Ninety percent of Facebook users see your content in their newsfeed, "so it really needs to be good and easy to see," she said. "People prefer to hear from a face of the practice rather than a logo or building because we humans communicate with people, not logos."
• Monitor replies to your posts. If someone is sending abusive messages, "you can hide those messages and block that person from your page. Or it might be better to leave it there and let your community come to your defense on your behalf. I have only had to take down two messages on behalf of clients. Both were from competing physicians."
Ms. Ramsey is the founder of Cosmetic Social Media and had no other financial conflicts to disclose.
EXPERT ANALYSIS FROM THE AACS ANNUAL MEETING

Unresponsive Woman Extricated From Car
ANSWER
The radiograph shows a right acetabular fracture that is mildly displaced. In addition, the right hip and femoral head are dislocated. Orthopedic consultation was made to reduce the hip and evaluate the fracture.
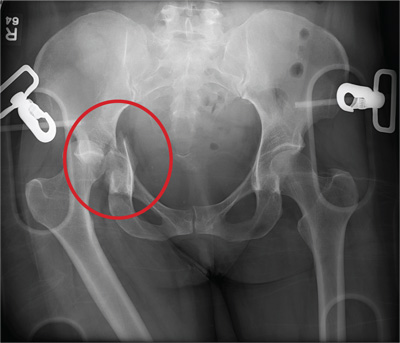
ANSWER
The radiograph shows a right acetabular fracture that is mildly displaced. In addition, the right hip and femoral head are dislocated. Orthopedic consultation was made to reduce the hip and evaluate the fracture.
ANSWER
The radiograph shows a right acetabular fracture that is mildly displaced. In addition, the right hip and femoral head are dislocated. Orthopedic consultation was made to reduce the hip and evaluate the fracture.

An unidentified female is brought in as a trauma code. She was apparently in a motor vehicle crash, the specific details of which are unclear. Emergency medical personnel describe extensive damage to her vehicle, which resulted in a pro-longed extrication time. Due to unresponsiveness at the scene, she was intubated in the field. The patient is probably in her late 30s to early 40s. She has two large-bore IV lines with normal saline infusing at a wide-open rate. Blood pressure is 90/60 mm Hg and heart rate, 140 beats/min. She has several superficial lacerations on her head, her pupils are fixed and dilated, and there is minimal withdrawal to pain in her extremities. No other trauma is im-mediately evident. Portable radiographs of her chest and pelvis are obtained prior to sending her for CT. Pelvis radiograph is shown. What is your impression?
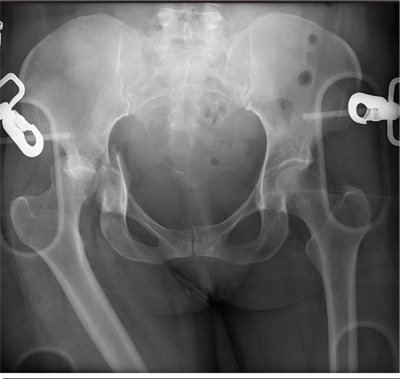
After 15 Years, Still Losing Hair, Only Faster
ANSWER
This is a classic clinical picture of androgenetic alopecia (choice “a”). See discussion for more details.
Alopecia areata (choice “b”) usually manifests acutely and leads to complete hair loss in a well-defined, annular pattern. It typically resolves on its own, with or without treatment.
Telogen effluvium (choice “c”) involves generalized hair loss without a pattern. The hair is actually “lost,” meaning markedly increased amounts of hair are seen in the comb, brush, sink, or shower. This results in an increasingly visible scalp.
Without a clear clinical picture of alopecia, a biopsy might have been indicated—primarily to rule out conditions such as lupus erythematosus (choice “d”), which can involve hair loss of various kinds. The negative ANA result obtained by the patient’s primary care provider helped rule out this diagnosis.
DISCUSSION
Androgenetic alopecia (AGA) affects both men and women, though the latter begin to develop it about 10 years later, on average, than men do. Among women, 13% develop AGA before menopause, while 75% note its appearance postmenopausally.
In both sexes, AGA results from the gradual conversion of terminal hairs to vellus hairs, with miniaturization of the follicles. Hair loss in men starts in the vertex, followed by bitemporal recession. In women, AGA primarily affects the crown of the scalp, often with partial preservation of the frontal hairline.
Dihydrotestosterone (DHT) appears to be the main culprit; testosterone is converted to DHT by means of the enzyme 5α-reductase. One of the most effective medications for AGA in men has been finasteride, which blocks the effects of 5α-reductase and can at least slow the rate of hair loss. Unfortunately, finasteride does not appear to be effective in treating AGA in women.
Women do, however, appear to respond to minoxidil, a topically applied solution, better than men. The response is moderate at best, and any hair gained is lost if the treatment is discontinued. Interestingly, the stronger 5% solution of minoxidil in women does not produce any demonstrable improvement over that seen with the 2% solution.
From a practical diagnostic standpoint, it is quite common for women with longstanding mild to moderate AGA to present with an acute episode of telogen effluvium (TE), in which hair all over the scalp falls out. Careful history taking is necessary to tease these stories apart, since TE will typically resolve on its own. The most common causes of TE, in my experience, are stress, extreme weight loss, and as a consequence of general anesthesia. For unknown reasons, TE is almost nonexistent in men.
TREATMENT
This patient chose to use 5% OTC minoxidil, an antihypertensive with an unknown mode of action in AGA. She’ll confine its application to the affected areas of the scalp, since unwanted hair growth has been reported on the face with the use of this medication.

A 43-year-old woman presents to dermatology with the extremely common complaint of hair loss. The problem is not new; she first noticed it 15 years ago. But the loss has now progressed to such an extent that the patient consulted her primary care provider. Blood tests were ordered, including complete blood count, antinuclear antibody (ANA), and thy-roid-stimulating hormone; all results were within normal limits. And so she decided to seek a specialist’s assessment. The patient is going through menopause—without the aid of medication—and claims to be otherwise healthy. She denies finding increased amounts of lost hair in her comb, brush, shower, or sink. She further denies any symptoms in her scalp. Her mother and one sister had similar problems with their scalp hair. Examination reveals extensive thinning of hair, which is almost totally confined to the crown of her scalp, with faint but obvious preservation of a thin band of the frontal hairline. There is no appreciable disruption of the skin surface in the scalp (eg, scaling, redness, edema, or scarring).
