User login
Inconsideration
"My friend took your elective," read the e-mail from Adam, a medical student I didn’t know. "I need one more rotation before I graduate and would love to get some dermatology experience, which I expect I’ll need for Family Medicine. Could you possibly accommodate me?"
Sure, no problem.
The day before he was to start, I e-mailed Adam with the time and place to show up, along with parking suggestions.
"Oh, sorry," came the reply. "I found another elective. Hope this causes no inconvenience."
Thanks, pal.
People, you may have noticed, are not always considerate. This includes patients. Take Irene. Please.
Irene is 28 years old. One of my associates diagnosed pyoderma and gave Irene oral antibiotics. She called Friday afternoon to report headaches and vomiting. Because of a scheduling mix-up, not one colleague – but both of them – thought they were covering and called her back. They each phoned Friday night and left messages on Irene’s home and cell numbers. And again on Saturday, twice each. Ditto on Sunday.
Irene finally did call back. Tuesday. She said she was fine.
Gee, thanks, Irene.
Or consider Zoe. Or more precisely, consider Zoe’s mother, Hildegard. Their family had just returned from Panama, a rain-forest jaunt being just the thing for a 2-year-old. Zoe had returned with a souvenir collection of bizarre, bull’s-eye–shaped plaques all over her face and torso. I had never seen anything like them. Perhaps bites? No one else in the travel party had them.
Because the child did not seem ill, I suggested to Hildegard that we spare Zoe a biopsy and see what happened over the next few days. I photographed the spots and said I would share the pictures with an academic specialist I know. Perhaps Hildegard would send me an e-mail update in 2 days? She would.
My academic friend looked at the photos and also had no idea. And from Hildegard? Radio silence. Was Zoe OK? Was she in an ICU?
I e-mailed Hildegard. No response. Not a good sign. I called and left a message, referring to the e-mail. No response. I wrote the referring pediatrician. No answer there either.
Three weeks later, Hortense, a nurse practitioner from the pediatrician’s office, came in as a patient. With some trepidation, I asked whether she was familiar with Zoe’s condition. She wasn’t. She would check and get back. She didn’t.
But I did, when I called Hortense a couple of days later with her own biopsy results. Had she perhaps checked on Zoe? Oh, right, she had. Zoe was fine. The spots had just gone away. Must have been bites or something.
Think I’ll just up my Valium.
Of course, more prosaic examples of this sort of thing happen all the time. Like the patient who calls for an emergency appointment. He has to come in. Right away.
"9:00 o’clock?" Not convenient. Staff meeting at work.
"2:00 o’clock?" Sorry, can’t make it then.
"5:30?" OK, I’ll be there! Thanks!
Then he doesn’t show. The rash went away. Or he got a better offer. Who knows?
After all these years, I should be used to this behavior by now, but sometimes, annoyance still gets the better of me. There are people – many, actually, and not just in the office – who really need you. Really, really. Their needs are urgent, overwhelming.
Your needs, less so.
There is no point in being cranky about this. We are in the people business, which means taking people as they come. It may mean following through when we worry about the consequences of not doing so, even if the patients themselves seem oblivious. It also means not taking it for granted when people do act with consideration.
Adam’s e-mail that he hoped I was not inconvenienced really steamed me. Then I thought, "I never met this guy, and I never will. He may find this kind of behavior unhelpful in his future professional dealings. But that will be his problem, won’t it?" So I decided not to respond.
Then I changed my mind.
"Inconvenience, no," I e-mailed back. "Inconsideration, for sure."
He apologized again, and I left it at that. There’s no emoticon for a Bronx cheer, anyway.
Dr. Rockoff practices dermatology in Brookline, Mass. To respond to this column, e-mail him at our editorial offices at [email protected].

High-Pressure Paint Gun Injection Injury to the Palm
Prolactin measure didn’t help localize pituitary adenoma
SAN FRANCISCO – Measurements of prolactin levels during inferior petrosal sinus sampling did not help localize pituitary adenomas in patients with Cushing’s disease in a study of 28 patients, contradicting findings from a previous study of 28 patients.
The value of prolactin measurements in tumor localization using inferior petrosal sinus sampling (IPSS) remains unclear and needs further study in a larger, prospective study, Dr. Susmeeta T. Sharma said at the Endocrine Society’s Annual Meeting. The current and previous studies were retrospective analyses.

Although IPSS has been considered the standard test in patients with ACTH-dependent Cushing’s syndrome to differentiate between ectopic ACTH secretion and Cushing’s disease, there has been controversy about its value in localizing adenomas within the pituitary gland once a biochemical diagnosis of Cushing’s disease has been made. Various studies that used an intersinus ACTH ratio of 1.4 or greater before or after corticotropin-releasing hormone (CRH) stimulation have reported success rates as low as 50% and as high as 100% for tumor location.
A previous retrospective study of 28 patients with Cushing’s disease reported that adjusting the ACTH intersinus gradient by levels of prolactin before or after CRH stimulation, and combining the prolactin-adjusted ACTH intersinus ratio, improved pituitary adenoma localization. Magnetic resonance imaging (MRI) alone correctly localized the pituitary adenoma in 17 patients (61%), a prolactin-adjusted ACTH intersinus ratio of at least 1.4 improved the localization rate to 21 patients (75%), and combining MRI and the prolactin-adjusted ACTH intersinus ratio improved localization further to 23 patients, or 82% (Clin. Endocrinol. 2012;77:268-74).
The findings inspired the current retrospective study. The investigators looked at prolactin levels measured in stored petrosal and peripheral venous samples at baseline and at the time of peak ACTH levels after CRH stimulation for 28 patients with Cushing’s disease and ACTH-positive pituitary adenomas who underwent IPSS in 2007-2013. The investigators calculated prolactin-adjusted values by dividing each ACTH value by the concomitant ipsilateral prolactin value. They used an intersinus ACTH ratio of 1.4 or greater to predict tumor location.
At surgery, 26 patients had a single lateral tumor (meaning its epicenter was not in the midline), 1 patient had a central microadenoma, and 1 patient had a macroadenoma, reported Dr. Sharma of the National Institute of Child Health and Human Development, Bethesda, Md.
MRI findings accurately identified the location of 21 of the 26 lateral tumors (81%), compared with accurate localization in 18 patients using either the unadjusted ACTH intersinus ratio or the prolactin-adjusted ACTH intersinus ratio (69% for each), she said.
Incorrect tumor localization occurred with one patient using MRI alone and seven patients using either ratio. In four patients whose tumors could not be localized by MRI, the uncorrected and prolactin-adjusted ratios localized one tumor correctly and three tumors incorrectly. Only MRI correctly localized the one central microadenoma.
"We did not find any difference in localization rates by measurement of prolactin during IPSS," she said. The small size of the study and its retrospective design invite further research in a more robust study.
Dr. Sharma reported having no financial disclosures.
On Twitter @sherryboschert
SAN FRANCISCO – Measurements of prolactin levels during inferior petrosal sinus sampling did not help localize pituitary adenomas in patients with Cushing’s disease in a study of 28 patients, contradicting findings from a previous study of 28 patients.
The value of prolactin measurements in tumor localization using inferior petrosal sinus sampling (IPSS) remains unclear and needs further study in a larger, prospective study, Dr. Susmeeta T. Sharma said at the Endocrine Society’s Annual Meeting. The current and previous studies were retrospective analyses.
Although IPSS has been considered the standard test in patients with ACTH-dependent Cushing’s syndrome to differentiate between ectopic ACTH secretion and Cushing’s disease, there has been controversy about its value in localizing adenomas within the pituitary gland once a biochemical diagnosis of Cushing’s disease has been made. Various studies that used an intersinus ACTH ratio of 1.4 or greater before or after corticotropin-releasing hormone (CRH) stimulation have reported success rates as low as 50% and as high as 100% for tumor location.
A previous retrospective study of 28 patients with Cushing’s disease reported that adjusting the ACTH intersinus gradient by levels of prolactin before or after CRH stimulation, and combining the prolactin-adjusted ACTH intersinus ratio, improved pituitary adenoma localization. Magnetic resonance imaging (MRI) alone correctly localized the pituitary adenoma in 17 patients (61%), a prolactin-adjusted ACTH intersinus ratio of at least 1.4 improved the localization rate to 21 patients (75%), and combining MRI and the prolactin-adjusted ACTH intersinus ratio improved localization further to 23 patients, or 82% (Clin. Endocrinol. 2012;77:268-74).
The findings inspired the current retrospective study. The investigators looked at prolactin levels measured in stored petrosal and peripheral venous samples at baseline and at the time of peak ACTH levels after CRH stimulation for 28 patients with Cushing’s disease and ACTH-positive pituitary adenomas who underwent IPSS in 2007-2013. The investigators calculated prolactin-adjusted values by dividing each ACTH value by the concomitant ipsilateral prolactin value. They used an intersinus ACTH ratio of 1.4 or greater to predict tumor location.
At surgery, 26 patients had a single lateral tumor (meaning its epicenter was not in the midline), 1 patient had a central microadenoma, and 1 patient had a macroadenoma, reported Dr. Sharma of the National Institute of Child Health and Human Development, Bethesda, Md.
MRI findings accurately identified the location of 21 of the 26 lateral tumors (81%), compared with accurate localization in 18 patients using either the unadjusted ACTH intersinus ratio or the prolactin-adjusted ACTH intersinus ratio (69% for each), she said.
Incorrect tumor localization occurred with one patient using MRI alone and seven patients using either ratio. In four patients whose tumors could not be localized by MRI, the uncorrected and prolactin-adjusted ratios localized one tumor correctly and three tumors incorrectly. Only MRI correctly localized the one central microadenoma.
"We did not find any difference in localization rates by measurement of prolactin during IPSS," she said. The small size of the study and its retrospective design invite further research in a more robust study.
Dr. Sharma reported having no financial disclosures.
On Twitter @sherryboschert
AT ENDO 2013
Major finding: The unadjusted and prolactin-adjusted ACTH intersinus ratios correctly localized 18 of 26 lateral pituitary adenomas (69%), compared with 21 localized by MRI (81%).
Data source: Retrospective study of 28 patients with Cushing’s disease and ACTH-positive pituitary adenomas who underwent IPSS in 2007-2013.
Disclosures: Dr. Sharma reported having no financial disclosures.

TSFRE announces a new Awards Program
Dear Colleague,
This is to officially announce the launch of the Thoracic Surgery Foundation for Research and Education (TSFRE) 2014 Awards Program. Please view the TSFRE Summer Newsletter with information about the 2014 Awards Program, including award descriptions, a timeline, links to download award applications, and a list of 2014 Research and Education Committee members (http://tinyurl.com/kfzdjz9).
Inside the issue you’ll find a special tribute to Dr. Carolyn E. Reed, a timely essay concerning the need to support cardiothoracic surgery research in today’s climate, and information about TSFRE’s mission and history of supporting cardiothoracic surgery research and education initiatives. You’ll also see the faces of many TSFRE supporters and friends.

I’d also like to mention that 2013 marks the 25th Anniversary of TSFRE. Since 1988, we have supported over $11 million toward cardiothoracic surgery research projects. We could not have accomplished this without the partnership of our society friends, the American Association for Thoracic Surgery (AATS), The Society of Thoracic Surgeons (STS), the Southern Thoracic Surgical Association (STSA), and the Western Thoracic Surgical Association (WTSA). And, we especially could not have achieved this without your support.
The quality and quantity of TSFRE-funded projects over the past 25 years have been phenomenal. Please join me today in making a contribution to the TSFRE 25th Anniversary Campaign by clicking on the link in the newsletter. Your donation will help ensure that TSFRE can continue funding important cardiothoracic surgery research and education for the next 25 years.
Thank you for your generosity as we head into our 25th year!
G. Alexander Patterson, M.D.
TSFRE President
Dear Colleague,
This is to officially announce the launch of the Thoracic Surgery Foundation for Research and Education (TSFRE) 2014 Awards Program. Please view the TSFRE Summer Newsletter with information about the 2014 Awards Program, including award descriptions, a timeline, links to download award applications, and a list of 2014 Research and Education Committee members (http://tinyurl.com/kfzdjz9).
Inside the issue you’ll find a special tribute to Dr. Carolyn E. Reed, a timely essay concerning the need to support cardiothoracic surgery research in today’s climate, and information about TSFRE’s mission and history of supporting cardiothoracic surgery research and education initiatives. You’ll also see the faces of many TSFRE supporters and friends.
I’d also like to mention that 2013 marks the 25th Anniversary of TSFRE. Since 1988, we have supported over $11 million toward cardiothoracic surgery research projects. We could not have accomplished this without the partnership of our society friends, the American Association for Thoracic Surgery (AATS), The Society of Thoracic Surgeons (STS), the Southern Thoracic Surgical Association (STSA), and the Western Thoracic Surgical Association (WTSA). And, we especially could not have achieved this without your support.
The quality and quantity of TSFRE-funded projects over the past 25 years have been phenomenal. Please join me today in making a contribution to the TSFRE 25th Anniversary Campaign by clicking on the link in the newsletter. Your donation will help ensure that TSFRE can continue funding important cardiothoracic surgery research and education for the next 25 years.
Thank you for your generosity as we head into our 25th year!
G. Alexander Patterson, M.D.
TSFRE President

An ounce of prevention is worth thousands of lives
Vaccinations and other preventive medicine issues are commonly felt to be the responsibility of primary care physicians.
After all, we are far too busy at the hospital putting out fires and dealing with acute, life-threatening emergencies to address routine matters, no matter how significant they may be, right? And, of course, our office-based colleagues have a lot of extra time on their hands. They merely have to see an unending stream of sick patients, return phone calls, refill prescriptions, and keep up with government regulations, implement new EHRs, ad nauseam. (Do any of these tasks remind you of why you steered clear of primary care in the first place?)
We all know that primary preventive issues often fall through the cracks for one reason or another. Many physicians have argued that "preventive services are not billable." Fortunately, with new regulations and the push for quality, accountable care, more primary care physicians will be forced to take preventive services more seriously.
But what about us?

In our day-to-day activities on the wards, do we really spend enough time on how we can prevent the potentially easy-to-prevent hospitalizations, or is our focus lost in the demands of meeting core measures and discharging patients as efficiently and safely as possible, pulling out our hair while trying to input orders electronically, or meeting a myriad of other challenges to using the latest EHR we need to learn? Or maybe the task of screening patients for vaccines is simply left up to the nursing staff.
A recent article titled "U.S. Hospitalizations for Pneumonia after a Decade of Pneumococcal Vaccination" gives us strong reason to rethink our sometimes laissez-faire attitude toward immunization (N. Engl. J. Med. 2013;369:155-63).
Specifically, investigators compared the average annual rates of pneumonia-related hospitalizations from 1997 through 1999 (prior to the introduction of the 7-valent pneumococcal conjugate vaccine [PCV7] into the U.S. childhood immunization schedule in 2000) to rates from 2007 through 2009, after its introduction. They calculated that there were 47,000 fewer annual hospitalizations than expected among children younger than 2 years of age and 73,000 fewer hospitalizations annually for adults 85 years of age or older, based on the rates of hospitalization prior to introduction of PCV7. When all age groups were evaluated, investigators reported a total of 168,000 fewer hospitalizations annually.
That is a tremendous disease burden that has been prevented thus far, and it provides undeniable proof that we should all take vaccination very seriously, no matter how busy we may be.
Dr. Hester is a hospitalist with Baltimore-Washington Medical Center who has a passion for empowering patients to partner in their health care. She is the creator of the Patient Whiz, a patient-engagement app for iOS.
Vaccinations and other preventive medicine issues are commonly felt to be the responsibility of primary care physicians.
After all, we are far too busy at the hospital putting out fires and dealing with acute, life-threatening emergencies to address routine matters, no matter how significant they may be, right? And, of course, our office-based colleagues have a lot of extra time on their hands. They merely have to see an unending stream of sick patients, return phone calls, refill prescriptions, and keep up with government regulations, implement new EHRs, ad nauseam. (Do any of these tasks remind you of why you steered clear of primary care in the first place?)
We all know that primary preventive issues often fall through the cracks for one reason or another. Many physicians have argued that "preventive services are not billable." Fortunately, with new regulations and the push for quality, accountable care, more primary care physicians will be forced to take preventive services more seriously.
But what about us?
In our day-to-day activities on the wards, do we really spend enough time on how we can prevent the potentially easy-to-prevent hospitalizations, or is our focus lost in the demands of meeting core measures and discharging patients as efficiently and safely as possible, pulling out our hair while trying to input orders electronically, or meeting a myriad of other challenges to using the latest EHR we need to learn? Or maybe the task of screening patients for vaccines is simply left up to the nursing staff.
A recent article titled "U.S. Hospitalizations for Pneumonia after a Decade of Pneumococcal Vaccination" gives us strong reason to rethink our sometimes laissez-faire attitude toward immunization (N. Engl. J. Med. 2013;369:155-63).
Specifically, investigators compared the average annual rates of pneumonia-related hospitalizations from 1997 through 1999 (prior to the introduction of the 7-valent pneumococcal conjugate vaccine [PCV7] into the U.S. childhood immunization schedule in 2000) to rates from 2007 through 2009, after its introduction. They calculated that there were 47,000 fewer annual hospitalizations than expected among children younger than 2 years of age and 73,000 fewer hospitalizations annually for adults 85 years of age or older, based on the rates of hospitalization prior to introduction of PCV7. When all age groups were evaluated, investigators reported a total of 168,000 fewer hospitalizations annually.
That is a tremendous disease burden that has been prevented thus far, and it provides undeniable proof that we should all take vaccination very seriously, no matter how busy we may be.
Dr. Hester is a hospitalist with Baltimore-Washington Medical Center who has a passion for empowering patients to partner in their health care. She is the creator of the Patient Whiz, a patient-engagement app for iOS.

A Validated Delirium Prediction Rule
Delirium is characterized by fluctuating disturbances in cognition and consciousness and is a common complication of hospitalization in medical and surgical patients. Studies estimate the prevalence of delirium in hospitalized patients[1] to be 14% to 56%, and up to 70% in critically ill elderly patients.[2] Estimates of total healthcare costs associated with delirium range from $38 to $152 billion per year in the United States.[3] Delirious patients are more likely to be discharged to a nursing home and have increased hospital mortality and longer lengths of stay.[4, 5, 6] Recent data suggest long‐term effects of delirium including cognitive impairments up to 1 year following the illness[7] and an increased likelihood of developing[8] or worsening dementia.[9]
It is estimated that one‐third of hospital‐acquired delirium cases could be prevented with appropriate interventions.[10] A prediction rule that easily and accurately identifies high‐risk patients upon admission could therefore have a substantial clinical impact. In addition, a prediction rule could be used to identify patients in whom new targeted interventions for delirium prevention could be investigated. A number of risk factors for delirium have been identified, including older age, preexisting cognitive dysfunction, vision and hearing impairment, severe illness, dehydration, electrolyte abnormalities, overmedication, and alcohol abuse.[11, 12, 13, 14, 15, 16] Existing prediction rules using various combinations of these measures have been limited by their complexity,[17] do not predict incident delirium,[18, 19] or are restricted to surgical[20, 21, 22] or intensive care[23] patients and therefore are not broadly applicable to the general medical population, which is particularly susceptible to developing delirium.
We conducted this study to develop a simple, efficient, and accurate prediction rule for hospital‐acquired delirium in adult medical inpatients assessed at the time of admission. Our a priori hypothesis was that a delirium prediction rule would consist of a combination of known risk factors and most likely incorporate old age, illness severity, and preexisting cognitive dysfunction.
METHODS
Design and Setting
This was a prospective cohort study with a derivation phase from May 2010 to November 2010 at 2 hospitals at the University of California, San Francisco (UCSF) (Moffitt‐Long and Mount Zion Hospitals) and a validation phase from October 2011 to March 2012 at the San Francisco Veterans Affairs Medical Center (SFVAMC).
Participants and Measurements
Subject identification, recruitment, and inclusion and exclusion criteria were identical for the derivation and validation cohorts. Subjects were identified by reviewing daily admission logs. All non‐intensive care unit patients aged 50 years or older admitted through the emergency department to the medicine, cardiology, or neurology services were screened for eligibility through chart review or in person within 24 hours of admission by a trained research assistant. One research assistant, a college graduate, conducted all screening for the derivation cohort, and 2 research assistants, 1 a fourth‐year medical student and the other a third‐year psychology graduate student, conducted screening for the validation cohort. In‐person screening included an assessment for delirium using the long version of the Confusion Assessment Method (CAM).[24] To minimize the possibility of enrolling delirious subjects, research assistants were instructed to notify the study supervisor (V.C.D.), a board‐certified neurologist, to discuss every case in which any yes checkbox was marked on the CAM score sheet. Subjects delirious upon initial evaluation, admitted for alcohol withdrawal, admitted for comfort care, who were aphasic or who could not speak English were excluded. For all patients, or if they were unable to provide consent, their surrogates provided written informed consent, and the study was approved by the institutional review boards at UCSF and SFVAMC.
In the derivation cohort, 1241 patients were screened, and 439 were eligible for enrollment. Of these, 180 declined, 50 were discharged prior to the first follow‐up visit, and 209 were included. In the validation cohort, 420 patients were screened, and 368 were eligible for enrollment. Of these, 144 declined, 59 were discharged prior to the first follow‐up visit, and 165 were included.
Baseline data regarding known delirium risk factors[11, 12, 13, 14, 15, 16] were collected from subjects in the derivation cohort. Cognitive performance was assessed with the Mini Mental Status Examination (MMSE),[25] forward digit span,[26] and clock draw.[27] Permission for administration of the MMSE was granted by Psychological Assessment Resources, Inc., and each administration was paid for. A structured interview was conducted with validated questions regarding visual and hearing impairment, pain, mobility, place of residence, and alcohol, tobacco, and drug use.[28, 29, 30, 31] A whisper test for hearing loss was performed.[32] Subjects' charts were reviewed for demographic, clinical, and laboratory data. Illness severity was assessed by asking each subject's nurse to rate their patient on a scale from not ill to mildly ill, moderately ill, severely ill, or moribund.[33] Each nurse was shown these 5 choices, but more specific definitions of what each level of illness severity meant were not provided. We chose this method to assess illness severity because this rating scale was incorporated into a previous validated and widely cited delirium prediction rule.[17] This illness severity scale has been validated as a predictor of outcomes and correlates with other measures of illness severity and comorbidity when graded by physicians.[33, 34] Nurse and physician ratings of illness severity have been shown to be comparable,[35] and therefore if the scale were incorporated into the prediction rule it would allow nurses to perform it independently. In the validation cohort, only data required to complete the baseline CAM and apply the prediction rule were collected.
Assessment of Outcomes
All subjects were assessed for delirium daily for 6 days after enrollment or until discharge, whichever came first. Follow‐up was limited to 6 days, based on the assumption that delirium occurring beyond 1 week is more likely due to events during the hospitalization as opposed to factors measurable at admission. Delirium was assessed using the short CAM, an internationally recognized and validated tool.[24] To complete the CAM during follow‐up visits, subjects and their nurses were interviewed using a written script, and an MMSE and forward digit span were performed.
Daily follow‐up assessments were performed by research assistants who were not blinded to the initial assessment but who, in the validation phase, were blinded to the prediction rule score. Some weekend follow‐ups were performed by postgraduate year 2, 3, or 4 neurology residents, or internal medicine faculty experienced in the assessment of delirium and blinded to both the initial assessment and prediction rule score. Neurology residents and internists read the CAM training manual and were educated in the administration and scoring of the CAM by 1 of the senior investigators (V.C.D.) prior to their first shift; these nonstudy personnel covered 17 of 189 days of follow‐up in the derivation cohort and 21 of 169 days of follow‐up in the validation cohort. To maximize sensitivity of delirium detection, for any change in cognition, MMSE score, or forward digit span compared to baseline, a board‐certified neurologist blinded to the initial assessment was notified to discuss the case and validate the diagnosis of delirium in person (derivation cohort) or over the phone (validation cohort). All research assistants were trained by a board‐certified neurologist (V.C.D.) in the administration and interpretation of the CAM using published methods prior to enrollment of any subjects.[36] Training included the performance of independent long‐version CAMs by the trainer and the trainee on a series of delirious and nondelirious patients until there was consistent agreement for each item on the CAM in 5 consecutive patients. In addition, a board‐certified neurologist supervised the first 5 administrations of the CAM performed by each research assistant.
Statistical Analysis
Sample size for the derivation cohort was based on the predicted ability to detect a difference in rates of delirium among those with and without cognitive impairment, the strongest risk factor for delirium. Using a [2] test with an of 0.05 and of 0.80, we estimated we would need to enroll 260 subjects, assuming a prevalence of cognitive dysfunction in our cohort of 10% and an estimated rate of delirium of 24% and 6% among those with and without cognitive dysfunction respectively.[14, 16, 17, 20] We were unable to reach enrollment targets because of a short funding period and slower than expected recruitment.
To construct the prediction rule in the derivation cohort, all variables were dichotomized. Age was dichotomized at 80 years because old age is a known risk factor for delirium, and only 1 of 46 subjects between the ages of 70 and 80 years became delirious in the derivation cohort. Components of the MMSE were dichotomized as correct/emncorrect, with a correct response requiring perfect performance based on expert consensus. For 3 subjects who would not attempt to spell world backward (2 in the derivation and 1 in the validation cohort), their score on serial 7s was used instead. The total MMSE score was not used because our objective was to develop a prediction rule using elements that could be assessed quickly in the fast‐paced environment of the hospital. Illness severity was dichotomized at moderate or worse/mild or better because there were only 15 subjects in the severe illness category, and the majority of delirium (22 outcomes) occurred in the moderate illness category. High blood urea nitrogen:creatinine ratio was defined as >18.[37]
The association between predictor variables and occurrence of delirium was analyzed using univariate logistic regression. A forward stepwise logistic regression was then performed using the variables associated with the outcome at a significance level of P<0.05 in univariate analysis. Variables were eligible for addition to the multivariable model if they were associated with the outcome at a significance level of <0.05. The 4 independent predictors thus identified were combined into a prediction rule by assigning each predictor 1 point if present. The performance of the prediction rule was assessed by using Cuzick's nonparametric test for a trend across groups ordered by score.[38]
The prediction rule was tested in the validation cohort using the nonparametric test for trend. Receiver operating characteristic (ROC) curves were compared between the derivation and validation cohorts. All statistical analysis was performed using Stata software (StataCorp, College Station, TX).
RESULTS
The derivation cohort consisted of elderly patients (mean age, 68.0811.96 years; interquartile range, 5096 years), and included more males than females (54.1% vs 45.9%). Subjects were predominantly white (73.7%) and lived at home (90%) (Table 1). The mean admission MMSE score was 27.0 (standard deviation [SD], 3.4; range, 730). Median follow‐up was 2 days (interquartile range, 13). Delirium developed in 12% (n=25) of the cohort.
| Derivation Cohort, N=209 | Validation Cohort, N=165 | |
|---|---|---|
| ||
| Gender, No. (%) | ||
| Male | 113 (54) | 157 (95) |
| Female | 96 (46) | 8 (4.8) |
| Race, No. (%) | ||
| White | 154 (74) | 125 (76) |
| African American | 34 (16) | 25 (15) |
| Asian | 21 (10.0) | 13 (7.9) |
| Native American | 0 | 2 (1.2) |
| Illness severity, No. (%) | ||
| Not ill | 1 (0.5) | 0 |
| Mildly ill | 49 (23) | 62 (38) |
| Moderately ill | 129 (62) | 86 (52) |
| Severely ill | 15 (7.2) | 17 (10) |
| Moribund | 0 | 0 |
| Living situation, No. (%) | ||
| Home | 188 (90) | 147 (89) |
| Assisted living | 11 (5.3) | 6 (3.6) |
| Hotel | 4 (1.9) | 5 (3.0) |
| SNF | 1 (0.5) | 3 (1.8) |
| Homeless | 4 (1.9) | 4 (2.4) |
| Developed delirium | 25 (12) | 14 (8.5) |
Univariate analysis of the derivation study identified 10 variables significantly associated (P<0.05) with delirium (Table 2). Predictors of delirium included abnormal scores on 4 subtests of the MMSE, low score on the Mini‐Cog, living in an assisted living or skilled nursing facility, moderate to severe illness, old age, a past history of dementia, and hearing loss as assessed by the whisper test. These predictors were then entered into a stepwise logistic regression analysis that identified 4 independent predictors of delirium (Table 3).
| Variable | No. (%) Without Delirium | No. (%) With Delirium | Odds Ratio | P Value | 95% Confidence Interval |
|---|---|---|---|---|---|
| |||||
| Age 80 years | 30 (16) | 13 (52) | 5.6 | <0.001 | 2.313.4 |
| Male sex | 99 (54) | 14 (56) | 1.1 | 0.84 | 0.52.5 |
| White race | 135 (73) | 19 (76) | 1.2 | 0.78 | 0.433.1 |
| Score <5 on date questions of MMSE | 37 (20) | 12 (48) | 3.7 | 0.003 | 1.68.7 |
| Score <5 on place questions of MMSE | 50 (27) | 14 (56) | 3.4 | 0.005 | 1.58.0 |
| Score <3 on MMSE recall | 89 (48) | 18 (72) | 2.7 | 0.03 | 1.16.9 |
| Score <5 on MMSE W‐O‐R‐L‐D backward | 37 (20) | 13 (52) | 4.3 | 0.001 | 1.810.2 |
| Score 0 on MMSE pentagon copy, n=203 | 53 (30) | 12 (48) | 2.2 | 0.07 | 0.935.1 |
| Score 0 on clock draw, n=203 | 70 (39) | 15 (60) | 2.3 | 0.05 | 0.985.4 |
| MiniCog score 02, n=203[27] | 46 (26) | 12 (48) | 2.7 | 0.03 | 1.16.2 |
| Self‐rated vision fair, poor, or very poor | 55 (30) | 8 (32) | 1.1 | 0.83 | 0.452.7 |
| Endorses hearing loss | 89 (48) | 12 (48) | 0.99 | 0.97 | 0.432.3 |
| Uses hearing aid | 19 (10) | 2 (8) | 0.76 | 0.72 | 0.173.5 |
| Fails whisper test in either ear | 39 (21) | 10 (40) | 2.5 | 0.04 | 1.05.9 |
| Prior episode of delirium per patient or informant | 70 (38) | 13 (52) | 1.8 | 0.19 | 0.764.1 |
| Dementia in past medical history | 3 (2) | 3 (12) | 8.2 | 0.01 | 1.643.3 |
| Depression in past medical history | 16 (9) | 1 (4) | 0.44 | 0.43 | 0.063.5 |
| Lives in assisted living or SNF | 8 (4) | 4 (16) | 4.2 | 0.03 | 1.215.1 |
| Endorses pain | 82 (45) | 7 (28) | 0.48 | 0.12 | 0.191.2 |
| Less than independent for transfers | 11 (6) | 3 (12) | 2.1 | 0.27 | 0.568.3 |
| Less than independent for mobility on a level surface | 36 (20) | 7 (28) | 1.6 | 0.33 | 0.624.1 |
| Score of 24 on CAGE questionnaire[29] | 5 (3) | 0 (0) | No outcomes | ||
| Drinks any alcohol | 84 (46) | 10 (40) | 0.79 | 0.60 | 0.341.9 |
| Current smoker | 20 (11) | 2 (8) | 0.71 | 0.66 | 0.164.1 |
| Uses illicit drugs | 13 (7) | 2 (8) | 1.2 | 0.83 | 0.255.6 |
| Moderately or severely ill on nursing assessment, n=194 | 121 (71) | 23 (96) | 9.3 | 0.031 | 1.270.9 |
| Fever | 8 (4) | 0 (0) | No outcomes | ||
| Serum sodium <134mmol/L | 38 (21) | 3 (12) | 0.52 | 0.31 | 0.151.8 |
| WBC count>10109/L, n=208 | 57 (31) | 6 (24) | 0.70 | 0.47 | 0.261.8 |
| AST>41 U/L, n=131 | 27 (23) | 2 (15) | 0.61 | 0.54 | 0.132.9 |
| BUN:Cr>18, n=208 | 66 (36) | 13 (52) | 1.9 | 0.13 | 0.834.5 |
| Infection as admission diagnosis | 28 (15) | 4 (16) | 1.1 | 0.92 | 0.343.3 |
| Variable | Odds Ratio | 95% Confidence Interval | P Value | Points Toward AWOL Score |
|---|---|---|---|---|
| Age 80 years | 5.7 | 2.115.6 | 0.001 | 1 |
| Unable to correctly spell world backward | 3.5 | 1.39.6 | 0.01 | 1 |
| Not oriented to city, state, county, hospital name, and floor | 2.9 | 1.17.9 | 0.03 | 1 |
| Nursing illness severity assessment of moderately ill, severely ill, or moribund (as opposed to not ill or mildly ill) | 10.5 | 1.386.9 | 0.03 | 1 |
These 4 independent predictors were assigned 1 point each if present to create a prediction rule with a range of possible scores from 0 to 4. There was a significant trend predicting higher rates of delirium with higher scores, with no subjects who scored 0 becoming delirious, compared to 40% of those subjects scoring 3 or 4 (P for trend<0.001) (Table 4).
| Derivation Cohorta | Validation Cohort | Combined Cohorts | ||||
|---|---|---|---|---|---|---|
| AWOL Score | Not Delirious | Delirious | Not Delirious | Delirious | Not Delirious | Delirious |
| ||||||
| 0 | 26 (100%) | 0 (0%) | 24 (96%) | 1 (4%) | 49 (98%) | 1 (2%) |
| 1 | 86 (95%) | 5 (5%) | 57 (97%) | 2 (3%) | 136 (96%) | 5 (4%) |
| 2 | 41 (85%) | 7 (15%) | 44 (90%) | 5 (10%) | 92 (86%) | 15 (14%) |
| 3 | 17 (74%) | 6 (26%) | 22 (79%) | 6 (21%) | 40 (80%) | 10 (20%) |
| 4 | 0 (0%) | 6 (100%) | 4 (100%) | 0 (0%) | 4 (36%) | 7 (64%) |
| Total | 170 | 24 | 151 | 14 | 321 | 38 |
| P<0.001 | P=0.025 | P<0.001 | ||||
The validation cohort consisted of adults with a mean age of 70.7210.6 years, (interquartile range, 5194 years), who were predominantly white (75.8%) and overwhelmingly male (95.2%) (Table 1). The mean admission MMSE score was 26.75 (SD, 2.8; range, 1730). Median follow‐up was 2 days (interquartile range, 15). Delirium developed in 8.5% (n=14) of the cohort. In the validation cohort, 4% of subjects with a score of 0 became delirious, whereas 19% of those scoring 3 or 4 became delirious (P for trend 0.025) (Table 4).
ROC curves were compared for the derivation and validation cohorts. The area under the ROC curve for the derivation cohort (0.81, 95% confidence interval [CI]: 0.720.90) was slightly better than that in the validation cohort (0.69, 95% CI: 0.540.83), but the difference did not reach statistical significance (P=0.14) (Figure 1).

DISCUSSION
We derived and validated a prediction rule to assess the risk of developing delirium in hospitalized adult medical patients. Four variables easily assessed on admission in a screen lasting less than 2 minutes were independently associated with the development of delirium. The prediction rule can be remembered with the following mnemonic: AWOL (Age80 years; unable to spell World backward; not fully Oriented to place; and moderate or severe iLlness severity).
It is estimated up to a third of hospital acquired delirium cases can be prevented.[10] Recent guidelines recommend the use of a multicomponent intervention to prevent delirium and provide evidence that such a strategy would be cost‐effective.[39] Nevertheless, such interventions are resource intense, requiring specialized nurse training and staffing[40] and have not been widely implemented. Acute care for the elderly units, where interventions to prevent delirium might logically be implemented, also require physical remodeling to provide carpeted hallways, handrails, and elevated toilet seats and door levers.[41] A method of risk stratification to identify the patients who would benefit most from resource‐intensive prevention strategies would be valuable.
The AWOL tool may provide a practical alternative to existing delirium prediction rules for adult medical inpatients. Because it can be completed by a nurse in <2 minutes, the AWOL tool may be easier to apply and disseminate than a previously described score relying on the MMSE, Acute Physiology and Chronic Health Evaluation scores, and measured visual acuity.[17] Two other tools, 1 based on chart abstraction[18] and the other based on clinical variables measured at admission,[19] are similarly easy to apply but only predict prevalent and not incident delirium, making them less clinically useful.
This study's strengths include its prospective cohort design and the derivation and validation being performed in different hospitals. The derivation cohort consisted of patients admitted to a tertiary care academic medical center or an affiliated hospital where routine mixed gender general medical patients are treated, whereas validation was performed at the SFVAMC, where patients are predominantly older men with a high incidence of vascular risk factors. The outcome was assessed on a daily basis, and the likelihood any cases were missed was low. Although there is some potential for bias because the outcome was assessed by a research assistant not blinded to baseline characteristics, this was mitigated by having each outcome validated by a blinded neurologist and in the validation cohort having the research assistant blinded to the AWOL score. Other strengths are the broad inclusion criteria, with both middle‐aged and elderly patients having a wide range of medical and neurological conditions, allowing for wide application of the results. Although many studies of delirium focus on patients over age 70 years, we chose to include patients aged 50 years or older because hospital‐acquired delirium still occurs in this age group (17 of 195 [8%] patients aged 5069 years became delirious in this study), and risk factors such as severe illness and cognitive dysfunction are likely to be predictors of delirium even at younger ages. Additionally, the inclusion of nurses' clinical judgment to assess illness severity using a straightforward rating scale allows bedside nurses to readily administer the prediction rule in practice.[34]
This study has several potential limitations. The number of outcomes in the derivation cohort was small compared to the number of predictors chosen for the prediction rule. This could potentially have led to overfitting the model in the derivation cohort and thus an overly optimistic estimation of the model's performance. In the validation cohort, the area under the ROC curve was lower than in the derivation cohort, and although the difference did not reach statistical significance, this may have been due to the small sample size. In addition, none of the 4 subjects with an AWOL score of 4 became delirious, potentially reflecting poor calibration of the prediction rule. However, the trend of higher rates of delirium among subjects with higher AWOL scores still reached statistical significance, and the prediction rule demonstrated good discrimination between patients at high and low risk for developing delirium.
To test whether a better prediction tool could be derived from our data, we combined the derivation and validation cohorts and repeated a stepwise multivariable logistic regression with the same variables used for derivation of the AWOL tool (with the exception of the whisper test of hearing and a past medical history of dementia, because these data were not collected in the validation cohort). This model produced the same 4 independent predictors of delirium used in the AWOL tool. We then used bootstrapping to internally validate the prediction rule, suggesting that the predictors in the AWOL tool were the best fit for the available data. However, given the small number of outcomes in our study, the AWOL tool may benefit from further validation in a larger independent cohort to more precisely calibrate the number of expected outcomes with each score.
Although the majority of medical inpatients were eligible for enrollment in our study, some populations were excluded, and our results may not generalize to these populations. Non‐English speaking patients were excluded to preserve the validity of our study instruments. In addition, patients with profound aphasia or an admission diagnosis of alcohol withdrawal were excluded. Patients discharged on the first day of their hospitalization were excluded either because they were discharged prior to screening or prior to their first follow‐up visit. Therefore, our results may only be valid in patients who remained in the hospital for over 24 hours. In addition, because we only included medical patients, our results cannot necessarily be generalized to the surgical population.
Finally, parts of the prediction rule (orientation and spelling world backward) are also components of the CAM and were used in the assessment of the outcome, and this may introduce a potential tautology: if patients are disoriented or have poor attention because they cannot spell world backward at admission, they already have fulfilled part of the criteria for delirium. However, a diagnosis of delirium using the CAM involves a comprehensive patient and caregiver interview, and in addition to poor attention, requires the presence of an acute change in mental status and disorganized thinking or altered level of consciousness. Therefore, it is possible, and common, for patients to be disoriented to place and/or unable to spell world backward, yet not be delirious, and predicting a subsequent change in cognition during the hospitalization is still clinically important. It is possible the AWOL tool works by identifying patients with impaired attention and subclinical delirium, but one could argue this makes a strong case for its validity because these patients especially should be triaged to an inpatient unit that specializes in delirium prevention. It is also possible the cognitive tasks that are part of the AWOL tool detect preexisting cognitive impairment, which is in turn a major risk factor for delirium.
Recognizing and classifying the risk of delirium during hospitalization is imperative, considering the illness' significant contribution to healthcare costs, morbidity, and mortality. The cost‐effectiveness of proven interventions to detect and prevent delirium could be magnified with focused implementation in those patients at highest risk.[39, 40, 41] Further research is required to determine whether the combination of delirium prediction rules such as those developed here and prevention strategies will result in decreased rates of delirium and economic savings for the healthcare system.
Acknowledgments
The following University of California, San Francisco neurology residents provided follow‐up of study subjects on weekends and were financially compensated: Amar Dhand, MD, DPhil; Tim West, MD; Sarah Shalev, MD; Karen DaSilva, MD; Mark Burish, MD, PhD; Maggie Waung, MD, PhD; Raquel Gardner, MD; Molly Burnett, MD; Adam Ziemann, MD, PhD; Kathryn Kvam, MD; Neel Singhal, MD, PhD; James Orengo, MD, PhD; Kelly Mills, MD; and Joanna Hellmuth, MD, MHS. The authors are grateful to Dr. Douglas Bauer for assisting with the study design.
Disclosures
Drs. Douglas, Hessler, Dhaliwal, Betjemann, Lucatorto, Johnston, Josephson, and Ms. Fukuda and Ms. Alameddine have no conflicts of interest or financial disclosures. This research was made possible by the Ruth E. Raskin Fund and a UCSF Dean's Research Scholarship. These funding agencies had no role in the design and conduct of the study; collection, management, analysis, and interpretation of the data; and preparation, review, or approval of the manuscript.
- , , . Occurrence and outcome of delirium in medical in‐patients: a systematic literature review. Age Ageing. 2006;35(4):350–364.
- , , , , , . Delirium in the intensive care unit: occurrence and clinical course in older patients. J Am Geriatr Soc. 2003;51(5):591–598.
- , , , , . One‐year health care costs associated with delirium in the elderly population. Arch Intern Med. 2008;168(1):27–32.
- , , , , . Does delirium contribute to poor hospital outcomes? A three‐site epidemiologic study. J Gen Intern Med. 1998;13(4):234–242.
- , , , , , . Delirium duration and mortality in lightly sedated, mechanically ventilated intensive care patients. Crit Care Med. 2010;38(12):2311–2318.
- , , , et al. Delirium epidemiology in critical care (DECCA): an international study. Crit Care. 2010;14(6):R210.
- , , , et al. Delirium as a predictor of long‐term cognitive impairment in survivors of critical illness. Crit Care Med. 2010;38(7):1513–1520.
- , , , , , . Delirium in elderly patients and the risk of postdischarge mortality, institutionalization, and dementia: a meta‐analysis. JAMA. 2010;304(4):443–451.
- , , , et al. Adverse outcomes after hospitalization and delirium in persons with Alzheimer disease. Ann Intern Med. 2012;156(12):848–856.
- , , , et al. A multicomponent intervention to prevent delirium in hospitalized older patients. N Engl J Med. 1999;340(9):669–676.
- , , , et al. Simple cognitive testing (Mini‐Cog) predicts in‐hospital delirium in the elderly. J Am Geriatr Soc. 2007;55(2):314–316.
- , , . A prospective study of delirium in hospitalized elderly. JAMA. 1990;263(8):1097–1101.
- , . Precipitating factors for delirium in hospitalized elderly persons. Predictive model and interrelationship with baseline vulnerability. JAMA. 1996;275(11):852–857.
- , , , , , . Risk factors for delirium at discharge: development and validation of a predictive model. Arch Intern Med. 2007;167(13):1406–1413.
- , . Delirium in vascular surgery. Eur J Vasc Endovasc Surg. 2007;34(2):131–134.
- , , , , , . Delirium in hospitalized older persons: outcomes and predictors. J Am Geriatr Soc. 1994;42(8):809–815.
- , , , , . A predictive model for delirium in hospitalized elderly medical patients based on admission characteristics. Ann Intern Med. 1993;119(6):474–481.
- , , , , , . Validation of a medical record‐based delirium risk assessment. J Am Geriatr Soc. 2011;59(suppl 2):S289–S294.
- , , , et al. Derivation and validation of a clinical prediction rule for delirium in patients admitted to a medical ward: an observational study. BMJ Open. 2012;2(5) pii: e001599.
- , , , et al. A clinical prediction rule for delirium after elective noncardiac surgery. JAMA. 1994;271(2):134–139.
- , , , , , . Prediction of postoperative delirium after abdominal surgery in the elderly. J Anesth. 2009;23(1):51–56.
- , , , et al. Derivation and validation of a preoperative prediction rule for delirium after cardiac surgery. Circulation. 2009;119(2):229–236.
- , , , et al. Development and validation of PRE‐DELIRIC (PREdiction of DELIRium in ICu patients) delirium prediction model for intensive care patients: observational multicentre study. BMJ. 2012;344:e420.
- , , , , , . Clarifying confusion: the confusion assessment method. A new method for detection of delirium. Ann Intern Med. 1990;113(12):941–948.
- , , . “Mini‐mental state”. A practical method for grading the cognitive state of patients for the clinician. J Psychiatr Res. 1975;12(3):189–198.
- . Wechsler Memory Scale‐III. New York, NY: Psychological Corp.; 1997.
- , , , , . The mini‐cog: a cognitive 'vital signs' measure for dementia screening in multi‐lingual elderly. Int J Geriatr Psychiatry. 2000;15(11):1021–1027.
- , . Functional evaluation: the Barthel index. Md State Med J. 1965;14:61–65.
- , , . The CAGE questionnaire: validation of a new alcoholism screening instrument. Am J Psychiatry. 1974;131(10):1121–1123.
- , , , , , . Is the NEI‐VFQ‐25 a useful tool in identifying visual impairment in an elderly population? BMC Ophthalmol. 2006;6:24.
- , , , et al. Validation of self‐reported hearing loss. The Blue Mountains Hearing Study. Int J Epidemiol. 2001;30(6):1371–1378.
- , , . Does this patient have hearing impairment? JAMA. 2006;295(4):416–428.
- , , , , , . Realizing the potential of clinical judgment: a real‐time strategy for predicting outcomes and cost for medical inpatients. Am J Med. 2000;109(3):189–195.
- , , , , , . Assessing illness severity: does clinical judgment work? J Chronic Dis. 1986;39(6):439–452.
- , , , , , . Prognostication in acutely admitted older patients by nurses and physicians. J Gen Intern Med. 2008;23(11):1883–1889.
- . The Confusion Assessment Method (CAM): Training Manual and Coding Guide. New Haven, CT: Yale University School of Medicine; 2003.
- , , , . Acute confusional states and dementia in the elderly: the role of dehydration/volume depletion, physical illness and age. Age Ageing. 1980;9(3):137–146.
- . A Wilcoxon‐type test for trend. Stat Med. 1985;4(1):87–90.
- , , , . Synopsis of the National Institute for Health and Clinical Excellence guideline for prevention of delirium. Ann Intern Med. 2011;154(11):746–751.
- , , , , . The Hospital Elder Life Program: a model of care to prevent cognitive and functional decline in older hospitalized patients. Hospital Elder Life Program. J Am Geriatr Soc. 2000;48(12):1697–1706.
- , , , , . A randomized trial of care in a hospital medical unit especially designed to improve the functional outcomes of acutely ill older patients. N Engl J Med. 1995;332(20):1338–1344.
Delirium is characterized by fluctuating disturbances in cognition and consciousness and is a common complication of hospitalization in medical and surgical patients. Studies estimate the prevalence of delirium in hospitalized patients[1] to be 14% to 56%, and up to 70% in critically ill elderly patients.[2] Estimates of total healthcare costs associated with delirium range from $38 to $152 billion per year in the United States.[3] Delirious patients are more likely to be discharged to a nursing home and have increased hospital mortality and longer lengths of stay.[4, 5, 6] Recent data suggest long‐term effects of delirium including cognitive impairments up to 1 year following the illness[7] and an increased likelihood of developing[8] or worsening dementia.[9]
It is estimated that one‐third of hospital‐acquired delirium cases could be prevented with appropriate interventions.[10] A prediction rule that easily and accurately identifies high‐risk patients upon admission could therefore have a substantial clinical impact. In addition, a prediction rule could be used to identify patients in whom new targeted interventions for delirium prevention could be investigated. A number of risk factors for delirium have been identified, including older age, preexisting cognitive dysfunction, vision and hearing impairment, severe illness, dehydration, electrolyte abnormalities, overmedication, and alcohol abuse.[11, 12, 13, 14, 15, 16] Existing prediction rules using various combinations of these measures have been limited by their complexity,[17] do not predict incident delirium,[18, 19] or are restricted to surgical[20, 21, 22] or intensive care[23] patients and therefore are not broadly applicable to the general medical population, which is particularly susceptible to developing delirium.
We conducted this study to develop a simple, efficient, and accurate prediction rule for hospital‐acquired delirium in adult medical inpatients assessed at the time of admission. Our a priori hypothesis was that a delirium prediction rule would consist of a combination of known risk factors and most likely incorporate old age, illness severity, and preexisting cognitive dysfunction.
METHODS
Design and Setting
This was a prospective cohort study with a derivation phase from May 2010 to November 2010 at 2 hospitals at the University of California, San Francisco (UCSF) (Moffitt‐Long and Mount Zion Hospitals) and a validation phase from October 2011 to March 2012 at the San Francisco Veterans Affairs Medical Center (SFVAMC).
Participants and Measurements
Subject identification, recruitment, and inclusion and exclusion criteria were identical for the derivation and validation cohorts. Subjects were identified by reviewing daily admission logs. All non‐intensive care unit patients aged 50 years or older admitted through the emergency department to the medicine, cardiology, or neurology services were screened for eligibility through chart review or in person within 24 hours of admission by a trained research assistant. One research assistant, a college graduate, conducted all screening for the derivation cohort, and 2 research assistants, 1 a fourth‐year medical student and the other a third‐year psychology graduate student, conducted screening for the validation cohort. In‐person screening included an assessment for delirium using the long version of the Confusion Assessment Method (CAM).[24] To minimize the possibility of enrolling delirious subjects, research assistants were instructed to notify the study supervisor (V.C.D.), a board‐certified neurologist, to discuss every case in which any yes checkbox was marked on the CAM score sheet. Subjects delirious upon initial evaluation, admitted for alcohol withdrawal, admitted for comfort care, who were aphasic or who could not speak English were excluded. For all patients, or if they were unable to provide consent, their surrogates provided written informed consent, and the study was approved by the institutional review boards at UCSF and SFVAMC.
In the derivation cohort, 1241 patients were screened, and 439 were eligible for enrollment. Of these, 180 declined, 50 were discharged prior to the first follow‐up visit, and 209 were included. In the validation cohort, 420 patients were screened, and 368 were eligible for enrollment. Of these, 144 declined, 59 were discharged prior to the first follow‐up visit, and 165 were included.
Baseline data regarding known delirium risk factors[11, 12, 13, 14, 15, 16] were collected from subjects in the derivation cohort. Cognitive performance was assessed with the Mini Mental Status Examination (MMSE),[25] forward digit span,[26] and clock draw.[27] Permission for administration of the MMSE was granted by Psychological Assessment Resources, Inc., and each administration was paid for. A structured interview was conducted with validated questions regarding visual and hearing impairment, pain, mobility, place of residence, and alcohol, tobacco, and drug use.[28, 29, 30, 31] A whisper test for hearing loss was performed.[32] Subjects' charts were reviewed for demographic, clinical, and laboratory data. Illness severity was assessed by asking each subject's nurse to rate their patient on a scale from not ill to mildly ill, moderately ill, severely ill, or moribund.[33] Each nurse was shown these 5 choices, but more specific definitions of what each level of illness severity meant were not provided. We chose this method to assess illness severity because this rating scale was incorporated into a previous validated and widely cited delirium prediction rule.[17] This illness severity scale has been validated as a predictor of outcomes and correlates with other measures of illness severity and comorbidity when graded by physicians.[33, 34] Nurse and physician ratings of illness severity have been shown to be comparable,[35] and therefore if the scale were incorporated into the prediction rule it would allow nurses to perform it independently. In the validation cohort, only data required to complete the baseline CAM and apply the prediction rule were collected.
Assessment of Outcomes
All subjects were assessed for delirium daily for 6 days after enrollment or until discharge, whichever came first. Follow‐up was limited to 6 days, based on the assumption that delirium occurring beyond 1 week is more likely due to events during the hospitalization as opposed to factors measurable at admission. Delirium was assessed using the short CAM, an internationally recognized and validated tool.[24] To complete the CAM during follow‐up visits, subjects and their nurses were interviewed using a written script, and an MMSE and forward digit span were performed.
Daily follow‐up assessments were performed by research assistants who were not blinded to the initial assessment but who, in the validation phase, were blinded to the prediction rule score. Some weekend follow‐ups were performed by postgraduate year 2, 3, or 4 neurology residents, or internal medicine faculty experienced in the assessment of delirium and blinded to both the initial assessment and prediction rule score. Neurology residents and internists read the CAM training manual and were educated in the administration and scoring of the CAM by 1 of the senior investigators (V.C.D.) prior to their first shift; these nonstudy personnel covered 17 of 189 days of follow‐up in the derivation cohort and 21 of 169 days of follow‐up in the validation cohort. To maximize sensitivity of delirium detection, for any change in cognition, MMSE score, or forward digit span compared to baseline, a board‐certified neurologist blinded to the initial assessment was notified to discuss the case and validate the diagnosis of delirium in person (derivation cohort) or over the phone (validation cohort). All research assistants were trained by a board‐certified neurologist (V.C.D.) in the administration and interpretation of the CAM using published methods prior to enrollment of any subjects.[36] Training included the performance of independent long‐version CAMs by the trainer and the trainee on a series of delirious and nondelirious patients until there was consistent agreement for each item on the CAM in 5 consecutive patients. In addition, a board‐certified neurologist supervised the first 5 administrations of the CAM performed by each research assistant.
Statistical Analysis
Sample size for the derivation cohort was based on the predicted ability to detect a difference in rates of delirium among those with and without cognitive impairment, the strongest risk factor for delirium. Using a [2] test with an of 0.05 and of 0.80, we estimated we would need to enroll 260 subjects, assuming a prevalence of cognitive dysfunction in our cohort of 10% and an estimated rate of delirium of 24% and 6% among those with and without cognitive dysfunction respectively.[14, 16, 17, 20] We were unable to reach enrollment targets because of a short funding period and slower than expected recruitment.
To construct the prediction rule in the derivation cohort, all variables were dichotomized. Age was dichotomized at 80 years because old age is a known risk factor for delirium, and only 1 of 46 subjects between the ages of 70 and 80 years became delirious in the derivation cohort. Components of the MMSE were dichotomized as correct/emncorrect, with a correct response requiring perfect performance based on expert consensus. For 3 subjects who would not attempt to spell world backward (2 in the derivation and 1 in the validation cohort), their score on serial 7s was used instead. The total MMSE score was not used because our objective was to develop a prediction rule using elements that could be assessed quickly in the fast‐paced environment of the hospital. Illness severity was dichotomized at moderate or worse/mild or better because there were only 15 subjects in the severe illness category, and the majority of delirium (22 outcomes) occurred in the moderate illness category. High blood urea nitrogen:creatinine ratio was defined as >18.[37]
The association between predictor variables and occurrence of delirium was analyzed using univariate logistic regression. A forward stepwise logistic regression was then performed using the variables associated with the outcome at a significance level of P<0.05 in univariate analysis. Variables were eligible for addition to the multivariable model if they were associated with the outcome at a significance level of <0.05. The 4 independent predictors thus identified were combined into a prediction rule by assigning each predictor 1 point if present. The performance of the prediction rule was assessed by using Cuzick's nonparametric test for a trend across groups ordered by score.[38]
The prediction rule was tested in the validation cohort using the nonparametric test for trend. Receiver operating characteristic (ROC) curves were compared between the derivation and validation cohorts. All statistical analysis was performed using Stata software (StataCorp, College Station, TX).
RESULTS
The derivation cohort consisted of elderly patients (mean age, 68.0811.96 years; interquartile range, 5096 years), and included more males than females (54.1% vs 45.9%). Subjects were predominantly white (73.7%) and lived at home (90%) (Table 1). The mean admission MMSE score was 27.0 (standard deviation [SD], 3.4; range, 730). Median follow‐up was 2 days (interquartile range, 13). Delirium developed in 12% (n=25) of the cohort.
| Derivation Cohort, N=209 | Validation Cohort, N=165 | |
|---|---|---|
| ||
| Gender, No. (%) | ||
| Male | 113 (54) | 157 (95) |
| Female | 96 (46) | 8 (4.8) |
| Race, No. (%) | ||
| White | 154 (74) | 125 (76) |
| African American | 34 (16) | 25 (15) |
| Asian | 21 (10.0) | 13 (7.9) |
| Native American | 0 | 2 (1.2) |
| Illness severity, No. (%) | ||
| Not ill | 1 (0.5) | 0 |
| Mildly ill | 49 (23) | 62 (38) |
| Moderately ill | 129 (62) | 86 (52) |
| Severely ill | 15 (7.2) | 17 (10) |
| Moribund | 0 | 0 |
| Living situation, No. (%) | ||
| Home | 188 (90) | 147 (89) |
| Assisted living | 11 (5.3) | 6 (3.6) |
| Hotel | 4 (1.9) | 5 (3.0) |
| SNF | 1 (0.5) | 3 (1.8) |
| Homeless | 4 (1.9) | 4 (2.4) |
| Developed delirium | 25 (12) | 14 (8.5) |
Univariate analysis of the derivation study identified 10 variables significantly associated (P<0.05) with delirium (Table 2). Predictors of delirium included abnormal scores on 4 subtests of the MMSE, low score on the Mini‐Cog, living in an assisted living or skilled nursing facility, moderate to severe illness, old age, a past history of dementia, and hearing loss as assessed by the whisper test. These predictors were then entered into a stepwise logistic regression analysis that identified 4 independent predictors of delirium (Table 3).
| Variable | No. (%) Without Delirium | No. (%) With Delirium | Odds Ratio | P Value | 95% Confidence Interval |
|---|---|---|---|---|---|
| |||||
| Age 80 years | 30 (16) | 13 (52) | 5.6 | <0.001 | 2.313.4 |
| Male sex | 99 (54) | 14 (56) | 1.1 | 0.84 | 0.52.5 |
| White race | 135 (73) | 19 (76) | 1.2 | 0.78 | 0.433.1 |
| Score <5 on date questions of MMSE | 37 (20) | 12 (48) | 3.7 | 0.003 | 1.68.7 |
| Score <5 on place questions of MMSE | 50 (27) | 14 (56) | 3.4 | 0.005 | 1.58.0 |
| Score <3 on MMSE recall | 89 (48) | 18 (72) | 2.7 | 0.03 | 1.16.9 |
| Score <5 on MMSE W‐O‐R‐L‐D backward | 37 (20) | 13 (52) | 4.3 | 0.001 | 1.810.2 |
| Score 0 on MMSE pentagon copy, n=203 | 53 (30) | 12 (48) | 2.2 | 0.07 | 0.935.1 |
| Score 0 on clock draw, n=203 | 70 (39) | 15 (60) | 2.3 | 0.05 | 0.985.4 |
| MiniCog score 02, n=203[27] | 46 (26) | 12 (48) | 2.7 | 0.03 | 1.16.2 |
| Self‐rated vision fair, poor, or very poor | 55 (30) | 8 (32) | 1.1 | 0.83 | 0.452.7 |
| Endorses hearing loss | 89 (48) | 12 (48) | 0.99 | 0.97 | 0.432.3 |
| Uses hearing aid | 19 (10) | 2 (8) | 0.76 | 0.72 | 0.173.5 |
| Fails whisper test in either ear | 39 (21) | 10 (40) | 2.5 | 0.04 | 1.05.9 |
| Prior episode of delirium per patient or informant | 70 (38) | 13 (52) | 1.8 | 0.19 | 0.764.1 |
| Dementia in past medical history | 3 (2) | 3 (12) | 8.2 | 0.01 | 1.643.3 |
| Depression in past medical history | 16 (9) | 1 (4) | 0.44 | 0.43 | 0.063.5 |
| Lives in assisted living or SNF | 8 (4) | 4 (16) | 4.2 | 0.03 | 1.215.1 |
| Endorses pain | 82 (45) | 7 (28) | 0.48 | 0.12 | 0.191.2 |
| Less than independent for transfers | 11 (6) | 3 (12) | 2.1 | 0.27 | 0.568.3 |
| Less than independent for mobility on a level surface | 36 (20) | 7 (28) | 1.6 | 0.33 | 0.624.1 |
| Score of 24 on CAGE questionnaire[29] | 5 (3) | 0 (0) | No outcomes | ||
| Drinks any alcohol | 84 (46) | 10 (40) | 0.79 | 0.60 | 0.341.9 |
| Current smoker | 20 (11) | 2 (8) | 0.71 | 0.66 | 0.164.1 |
| Uses illicit drugs | 13 (7) | 2 (8) | 1.2 | 0.83 | 0.255.6 |
| Moderately or severely ill on nursing assessment, n=194 | 121 (71) | 23 (96) | 9.3 | 0.031 | 1.270.9 |
| Fever | 8 (4) | 0 (0) | No outcomes | ||
| Serum sodium <134mmol/L | 38 (21) | 3 (12) | 0.52 | 0.31 | 0.151.8 |
| WBC count>10109/L, n=208 | 57 (31) | 6 (24) | 0.70 | 0.47 | 0.261.8 |
| AST>41 U/L, n=131 | 27 (23) | 2 (15) | 0.61 | 0.54 | 0.132.9 |
| BUN:Cr>18, n=208 | 66 (36) | 13 (52) | 1.9 | 0.13 | 0.834.5 |
| Infection as admission diagnosis | 28 (15) | 4 (16) | 1.1 | 0.92 | 0.343.3 |
| Variable | Odds Ratio | 95% Confidence Interval | P Value | Points Toward AWOL Score |
|---|---|---|---|---|
| Age 80 years | 5.7 | 2.115.6 | 0.001 | 1 |
| Unable to correctly spell world backward | 3.5 | 1.39.6 | 0.01 | 1 |
| Not oriented to city, state, county, hospital name, and floor | 2.9 | 1.17.9 | 0.03 | 1 |
| Nursing illness severity assessment of moderately ill, severely ill, or moribund (as opposed to not ill or mildly ill) | 10.5 | 1.386.9 | 0.03 | 1 |
These 4 independent predictors were assigned 1 point each if present to create a prediction rule with a range of possible scores from 0 to 4. There was a significant trend predicting higher rates of delirium with higher scores, with no subjects who scored 0 becoming delirious, compared to 40% of those subjects scoring 3 or 4 (P for trend<0.001) (Table 4).
| Derivation Cohorta | Validation Cohort | Combined Cohorts | ||||
|---|---|---|---|---|---|---|
| AWOL Score | Not Delirious | Delirious | Not Delirious | Delirious | Not Delirious | Delirious |
| ||||||
| 0 | 26 (100%) | 0 (0%) | 24 (96%) | 1 (4%) | 49 (98%) | 1 (2%) |
| 1 | 86 (95%) | 5 (5%) | 57 (97%) | 2 (3%) | 136 (96%) | 5 (4%) |
| 2 | 41 (85%) | 7 (15%) | 44 (90%) | 5 (10%) | 92 (86%) | 15 (14%) |
| 3 | 17 (74%) | 6 (26%) | 22 (79%) | 6 (21%) | 40 (80%) | 10 (20%) |
| 4 | 0 (0%) | 6 (100%) | 4 (100%) | 0 (0%) | 4 (36%) | 7 (64%) |
| Total | 170 | 24 | 151 | 14 | 321 | 38 |
| P<0.001 | P=0.025 | P<0.001 | ||||
The validation cohort consisted of adults with a mean age of 70.7210.6 years, (interquartile range, 5194 years), who were predominantly white (75.8%) and overwhelmingly male (95.2%) (Table 1). The mean admission MMSE score was 26.75 (SD, 2.8; range, 1730). Median follow‐up was 2 days (interquartile range, 15). Delirium developed in 8.5% (n=14) of the cohort. In the validation cohort, 4% of subjects with a score of 0 became delirious, whereas 19% of those scoring 3 or 4 became delirious (P for trend 0.025) (Table 4).
ROC curves were compared for the derivation and validation cohorts. The area under the ROC curve for the derivation cohort (0.81, 95% confidence interval [CI]: 0.720.90) was slightly better than that in the validation cohort (0.69, 95% CI: 0.540.83), but the difference did not reach statistical significance (P=0.14) (Figure 1).
DISCUSSION
We derived and validated a prediction rule to assess the risk of developing delirium in hospitalized adult medical patients. Four variables easily assessed on admission in a screen lasting less than 2 minutes were independently associated with the development of delirium. The prediction rule can be remembered with the following mnemonic: AWOL (Age80 years; unable to spell World backward; not fully Oriented to place; and moderate or severe iLlness severity).
It is estimated up to a third of hospital acquired delirium cases can be prevented.[10] Recent guidelines recommend the use of a multicomponent intervention to prevent delirium and provide evidence that such a strategy would be cost‐effective.[39] Nevertheless, such interventions are resource intense, requiring specialized nurse training and staffing[40] and have not been widely implemented. Acute care for the elderly units, where interventions to prevent delirium might logically be implemented, also require physical remodeling to provide carpeted hallways, handrails, and elevated toilet seats and door levers.[41] A method of risk stratification to identify the patients who would benefit most from resource‐intensive prevention strategies would be valuable.
The AWOL tool may provide a practical alternative to existing delirium prediction rules for adult medical inpatients. Because it can be completed by a nurse in <2 minutes, the AWOL tool may be easier to apply and disseminate than a previously described score relying on the MMSE, Acute Physiology and Chronic Health Evaluation scores, and measured visual acuity.[17] Two other tools, 1 based on chart abstraction[18] and the other based on clinical variables measured at admission,[19] are similarly easy to apply but only predict prevalent and not incident delirium, making them less clinically useful.
This study's strengths include its prospective cohort design and the derivation and validation being performed in different hospitals. The derivation cohort consisted of patients admitted to a tertiary care academic medical center or an affiliated hospital where routine mixed gender general medical patients are treated, whereas validation was performed at the SFVAMC, where patients are predominantly older men with a high incidence of vascular risk factors. The outcome was assessed on a daily basis, and the likelihood any cases were missed was low. Although there is some potential for bias because the outcome was assessed by a research assistant not blinded to baseline characteristics, this was mitigated by having each outcome validated by a blinded neurologist and in the validation cohort having the research assistant blinded to the AWOL score. Other strengths are the broad inclusion criteria, with both middle‐aged and elderly patients having a wide range of medical and neurological conditions, allowing for wide application of the results. Although many studies of delirium focus on patients over age 70 years, we chose to include patients aged 50 years or older because hospital‐acquired delirium still occurs in this age group (17 of 195 [8%] patients aged 5069 years became delirious in this study), and risk factors such as severe illness and cognitive dysfunction are likely to be predictors of delirium even at younger ages. Additionally, the inclusion of nurses' clinical judgment to assess illness severity using a straightforward rating scale allows bedside nurses to readily administer the prediction rule in practice.[34]
This study has several potential limitations. The number of outcomes in the derivation cohort was small compared to the number of predictors chosen for the prediction rule. This could potentially have led to overfitting the model in the derivation cohort and thus an overly optimistic estimation of the model's performance. In the validation cohort, the area under the ROC curve was lower than in the derivation cohort, and although the difference did not reach statistical significance, this may have been due to the small sample size. In addition, none of the 4 subjects with an AWOL score of 4 became delirious, potentially reflecting poor calibration of the prediction rule. However, the trend of higher rates of delirium among subjects with higher AWOL scores still reached statistical significance, and the prediction rule demonstrated good discrimination between patients at high and low risk for developing delirium.
To test whether a better prediction tool could be derived from our data, we combined the derivation and validation cohorts and repeated a stepwise multivariable logistic regression with the same variables used for derivation of the AWOL tool (with the exception of the whisper test of hearing and a past medical history of dementia, because these data were not collected in the validation cohort). This model produced the same 4 independent predictors of delirium used in the AWOL tool. We then used bootstrapping to internally validate the prediction rule, suggesting that the predictors in the AWOL tool were the best fit for the available data. However, given the small number of outcomes in our study, the AWOL tool may benefit from further validation in a larger independent cohort to more precisely calibrate the number of expected outcomes with each score.
Although the majority of medical inpatients were eligible for enrollment in our study, some populations were excluded, and our results may not generalize to these populations. Non‐English speaking patients were excluded to preserve the validity of our study instruments. In addition, patients with profound aphasia or an admission diagnosis of alcohol withdrawal were excluded. Patients discharged on the first day of their hospitalization were excluded either because they were discharged prior to screening or prior to their first follow‐up visit. Therefore, our results may only be valid in patients who remained in the hospital for over 24 hours. In addition, because we only included medical patients, our results cannot necessarily be generalized to the surgical population.
Finally, parts of the prediction rule (orientation and spelling world backward) are also components of the CAM and were used in the assessment of the outcome, and this may introduce a potential tautology: if patients are disoriented or have poor attention because they cannot spell world backward at admission, they already have fulfilled part of the criteria for delirium. However, a diagnosis of delirium using the CAM involves a comprehensive patient and caregiver interview, and in addition to poor attention, requires the presence of an acute change in mental status and disorganized thinking or altered level of consciousness. Therefore, it is possible, and common, for patients to be disoriented to place and/or unable to spell world backward, yet not be delirious, and predicting a subsequent change in cognition during the hospitalization is still clinically important. It is possible the AWOL tool works by identifying patients with impaired attention and subclinical delirium, but one could argue this makes a strong case for its validity because these patients especially should be triaged to an inpatient unit that specializes in delirium prevention. It is also possible the cognitive tasks that are part of the AWOL tool detect preexisting cognitive impairment, which is in turn a major risk factor for delirium.
Recognizing and classifying the risk of delirium during hospitalization is imperative, considering the illness' significant contribution to healthcare costs, morbidity, and mortality. The cost‐effectiveness of proven interventions to detect and prevent delirium could be magnified with focused implementation in those patients at highest risk.[39, 40, 41] Further research is required to determine whether the combination of delirium prediction rules such as those developed here and prevention strategies will result in decreased rates of delirium and economic savings for the healthcare system.
Acknowledgments
The following University of California, San Francisco neurology residents provided follow‐up of study subjects on weekends and were financially compensated: Amar Dhand, MD, DPhil; Tim West, MD; Sarah Shalev, MD; Karen DaSilva, MD; Mark Burish, MD, PhD; Maggie Waung, MD, PhD; Raquel Gardner, MD; Molly Burnett, MD; Adam Ziemann, MD, PhD; Kathryn Kvam, MD; Neel Singhal, MD, PhD; James Orengo, MD, PhD; Kelly Mills, MD; and Joanna Hellmuth, MD, MHS. The authors are grateful to Dr. Douglas Bauer for assisting with the study design.
Disclosures
Drs. Douglas, Hessler, Dhaliwal, Betjemann, Lucatorto, Johnston, Josephson, and Ms. Fukuda and Ms. Alameddine have no conflicts of interest or financial disclosures. This research was made possible by the Ruth E. Raskin Fund and a UCSF Dean's Research Scholarship. These funding agencies had no role in the design and conduct of the study; collection, management, analysis, and interpretation of the data; and preparation, review, or approval of the manuscript.
- , , . Occurrence and outcome of delirium in medical in‐patients: a systematic literature review. Age Ageing. 2006;35(4):350–364.
- , , , , , . Delirium in the intensive care unit: occurrence and clinical course in older patients. J Am Geriatr Soc. 2003;51(5):591–598.
- , , , , . One‐year health care costs associated with delirium in the elderly population. Arch Intern Med. 2008;168(1):27–32.
- , , , , . Does delirium contribute to poor hospital outcomes? A three‐site epidemiologic study. J Gen Intern Med. 1998;13(4):234–242.
- , , , , , . Delirium duration and mortality in lightly sedated, mechanically ventilated intensive care patients. Crit Care Med. 2010;38(12):2311–2318.
- , , , et al. Delirium epidemiology in critical care (DECCA): an international study. Crit Care. 2010;14(6):R210.
- , , , et al. Delirium as a predictor of long‐term cognitive impairment in survivors of critical illness. Crit Care Med. 2010;38(7):1513–1520.
- , , , , , . Delirium in elderly patients and the risk of postdischarge mortality, institutionalization, and dementia: a meta‐analysis. JAMA. 2010;304(4):443–451.
- , , , et al. Adverse outcomes after hospitalization and delirium in persons with Alzheimer disease. Ann Intern Med. 2012;156(12):848–856.
- , , , et al. A multicomponent intervention to prevent delirium in hospitalized older patients. N Engl J Med. 1999;340(9):669–676.
- , , , et al. Simple cognitive testing (Mini‐Cog) predicts in‐hospital delirium in the elderly. J Am Geriatr Soc. 2007;55(2):314–316.
- , , . A prospective study of delirium in hospitalized elderly. JAMA. 1990;263(8):1097–1101.
- , . Precipitating factors for delirium in hospitalized elderly persons. Predictive model and interrelationship with baseline vulnerability. JAMA. 1996;275(11):852–857.
- , , , , , . Risk factors for delirium at discharge: development and validation of a predictive model. Arch Intern Med. 2007;167(13):1406–1413.
- , . Delirium in vascular surgery. Eur J Vasc Endovasc Surg. 2007;34(2):131–134.
- , , , , , . Delirium in hospitalized older persons: outcomes and predictors. J Am Geriatr Soc. 1994;42(8):809–815.
- , , , , . A predictive model for delirium in hospitalized elderly medical patients based on admission characteristics. Ann Intern Med. 1993;119(6):474–481.
- , , , , , . Validation of a medical record‐based delirium risk assessment. J Am Geriatr Soc. 2011;59(suppl 2):S289–S294.
- , , , et al. Derivation and validation of a clinical prediction rule for delirium in patients admitted to a medical ward: an observational study. BMJ Open. 2012;2(5) pii: e001599.
- , , , et al. A clinical prediction rule for delirium after elective noncardiac surgery. JAMA. 1994;271(2):134–139.
- , , , , , . Prediction of postoperative delirium after abdominal surgery in the elderly. J Anesth. 2009;23(1):51–56.
- , , , et al. Derivation and validation of a preoperative prediction rule for delirium after cardiac surgery. Circulation. 2009;119(2):229–236.
- , , , et al. Development and validation of PRE‐DELIRIC (PREdiction of DELIRium in ICu patients) delirium prediction model for intensive care patients: observational multicentre study. BMJ. 2012;344:e420.
- , , , , , . Clarifying confusion: the confusion assessment method. A new method for detection of delirium. Ann Intern Med. 1990;113(12):941–948.
- , , . “Mini‐mental state”. A practical method for grading the cognitive state of patients for the clinician. J Psychiatr Res. 1975;12(3):189–198.
- . Wechsler Memory Scale‐III. New York, NY: Psychological Corp.; 1997.
- , , , , . The mini‐cog: a cognitive 'vital signs' measure for dementia screening in multi‐lingual elderly. Int J Geriatr Psychiatry. 2000;15(11):1021–1027.
- , . Functional evaluation: the Barthel index. Md State Med J. 1965;14:61–65.
- , , . The CAGE questionnaire: validation of a new alcoholism screening instrument. Am J Psychiatry. 1974;131(10):1121–1123.
- , , , , , . Is the NEI‐VFQ‐25 a useful tool in identifying visual impairment in an elderly population? BMC Ophthalmol. 2006;6:24.
- , , , et al. Validation of self‐reported hearing loss. The Blue Mountains Hearing Study. Int J Epidemiol. 2001;30(6):1371–1378.
- , , . Does this patient have hearing impairment? JAMA. 2006;295(4):416–428.
- , , , , , . Realizing the potential of clinical judgment: a real‐time strategy for predicting outcomes and cost for medical inpatients. Am J Med. 2000;109(3):189–195.
- , , , , , . Assessing illness severity: does clinical judgment work? J Chronic Dis. 1986;39(6):439–452.
- , , , , , . Prognostication in acutely admitted older patients by nurses and physicians. J Gen Intern Med. 2008;23(11):1883–1889.
- . The Confusion Assessment Method (CAM): Training Manual and Coding Guide. New Haven, CT: Yale University School of Medicine; 2003.
- , , , . Acute confusional states and dementia in the elderly: the role of dehydration/volume depletion, physical illness and age. Age Ageing. 1980;9(3):137–146.
- . A Wilcoxon‐type test for trend. Stat Med. 1985;4(1):87–90.
- , , , . Synopsis of the National Institute for Health and Clinical Excellence guideline for prevention of delirium. Ann Intern Med. 2011;154(11):746–751.
- , , , , . The Hospital Elder Life Program: a model of care to prevent cognitive and functional decline in older hospitalized patients. Hospital Elder Life Program. J Am Geriatr Soc. 2000;48(12):1697–1706.
- , , , , . A randomized trial of care in a hospital medical unit especially designed to improve the functional outcomes of acutely ill older patients. N Engl J Med. 1995;332(20):1338–1344.
Copyright © 2013 Society of Hospital Medicine
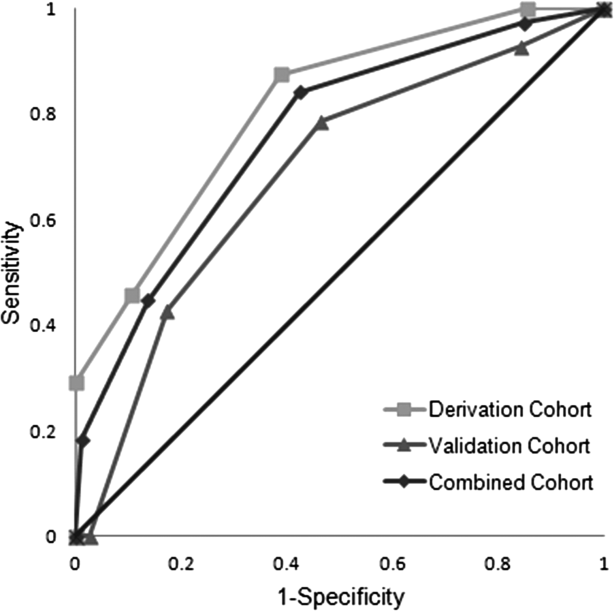
Losing a feisty – but grateful – patient
I’d known Jerry for over a year. When I first met him it was because he had gotten admitted with fevers and an elevation in his erythrocyte sedimentation rate. In the absence of an obvious infectious cause, I was called to see him.
He was such a character. His intelligence was evident. The day that I met him he told me that he was a retired journalist, and that he planned to write a book. His subject was to be one of the presidents, as he had a real interest in history. I particularly enjoyed hearing his "This I Believe" essay on Rhode Island’s National Public Radio about how people these days get so attached to material things, and how far removed this reality is from how he grew up.
He was feisty and opinionated. He, like many other elderly men, thought he knew best, and told everyone – doctors, nurses, his wife – how to do their jobs. He fired his primary care doctor because the doctor told him he couldn’t drive anymore. He stopped his Coumadin because he established, "after applying the scientific method" (i.e., having rechallenged himself with it), that it caused severe pruritis that he just was not willing to put up with.
In the winter of 2012, he developed what seemed to be new-onset Raynaud’s, coincident with a worsening of his thrombocytopenia and anemia. His blood pressure was too low for him to tolerate a calcium channel blocker. I suggested sildenafil, but it was not until mid-June that he came to me asking to be put on it because the condition had progressed quite rapidly, he had developed ulcerations, and he was in a lot of pain. By then we knew about the non-Hodgkin’s lymphoma on top of his preexisting myelodysplastic syndrome, and he was about to get a second opinion about getting a second bone-marrow biopsy at Dana-Farber Cancer Institute.
After the inevitable battle for insurance coverage, we managed to get the sildenafil approved for him, and it made such a huge difference that on July 26, he wrote me, by snail mail, a letter of gratitude: "The lesions are slowly vanishing, the ailing fingernails are taking deeper breaths and thickening, the fingertips are getting firmer. Your compassion, skill, and determination to aid your patients have defeated dis-ease." No doubt he really meant dis-ease, as he repeated the unusual formulation later on. He had such a way with words.
"I looked forward to another winter here with horror. But, thanks to your determination to help ... I am canceling my plans to escape to Florida."
He ended the letter with an invitation to take me to my favorite dim sum restaurant in Providence that I had recommended to him and that he liked as much as I did. He planned on taking me there in mid-August. "I don’t believe that Hippocrates would scorn such an invitation. Let me show off my fingers!"
This was not the first time that he’d invited me to dim sum, but it was the first time that I actually considered accepting the offer, having been granted imaginary permission by Hippocrates.
Jerry passed away on Aug. 1. I was too late for dim sum.
"My soul is from elsewhere, I am sure of that. And I intend to end up there." –Rumi
Dr. Chan practices rheumatology in Pawtucket, R.I.

The new trainee curriculum arrives
Much anticipated by many, exciting to the tech-savvy among us, and unbeknownst to others, yet equally relevant to all: The new curriculum is here. Whether you are a trainee, an educator, or a thoracic surgeon interested in the future of our specialty, the unveiling of the new curriculum is of key significance.
In 1992, at the Joint Conference on Graduate Education in Thoracic Surgery, significant emphasis was placed upon curricular change for thoracic surgical education. In response, the Thoracic Surgery Directors Association (TSDA) initiated the comprehensive thoracic surgery curriculum project in order to develop a consensus as to the content that ought to be learned during thoracic surgical training. Published in 1994, and available online, the TSDA Curriculum was intended to serve as a study guide to individual trainees and a useful resource for Program Directors. While of enormous utility over the last 2 decades, the curriculum is getting a makeover.

Being released this July is a brand-new curriculum, with updated topics and an excitingly novel platform, as a collaborative project from several organizations committed to thoracic surgical education. The Joint Council on Thoracic Surgery Education (JCTSE) has been working closely with the TSDA, with significant input from the American Board of Thoracic Surgery (ABTS), the Society of Thoracic Surgeons (STS), and the Residency Review Committee (RRC) for Thoracic Surgery. Dr. Ara Vaporciyan, Program Director at the University of Texas MD Anderson Cancer Center and 2013 Secretary/Treasurer of the TSDA, has been a key player in the development of the new curriculum.
When asked about the impetus for developing a new curriculum, Dr. Vaporciyan acknowledges that the old curriculum was an enormous advantage when first introduced, but that, now, it is somewhat outdated, and, further, new technology allows us to deliver the content better and more efficiently. Further, Dr. Vaporciyan highlights the valuable aspect of the new curriculum that links its content to expectations of the ABTS for board certification and the requirements of the Accreditation Council for Graduate Medical Education (ACGME) Milestones project.
Similar to the old curriculum, the basic architecture of the new curriculum contains 88-90 separate topics. However, within the new curriculum, the topics have been selected to cover each element of the published learning objectives provided by the ABTS.
Specific topics were identified by appointed section editors (Cardiac: Drs. James Fann and Craig Baker, Thoracic: DRs. Stephen Yang and Ara Vaporciyan, Congenital: Drs. Ram Subramanyan and Winfield Wells). Approximately 20 topic editors from all over the country have helped populate the new curriculum with content, and have additionally provided some input toward the division of topics.
For many, the most exciting feature of the new curriculum relates to the way that the educational materials will be delivered. Using WebBrain software (TheBrain, Los Angeles) for content management, all topics are organized like a mind map. For example, on the main tree, one can click on Thoracic Surgery, then neoplasm of the lung, which then explodes into three related topics: medical knowledge, patient care, and technical skills, which each branch out further. As explained by Dr. Vaporciyan, "the learning objectives of the ABTS provide the structure of the tree – its trunk and main branches – while the content components, provided by the topic editors, serve as the leaves on the ends of the branches."
So what exactly makes up those leaves at the end of the branches? The multi-media material is 100% pre-existing, coming from six different textbooks, up-to-date literature, online presentations created by the TSDA, and societal guidelines. In addition to the WebBrain content management system, the new curriculum utilizes a Moodle-based (Moodle Pty. Ltd., Perth, Australia) platform for organizing specific lessons plans and weekly curricular goals. Moodle (modular object-oriented dynamic learning environment) is an e-learning software platform, also known as a virtual learning environment.
With features such as assignment submission, quiz completion, discussion forums, file download capabilities, and opportunities for instructors to track individual trainee use, the potential opportunities for future growth are enormous. Within the new TSDA curriculum, trainees will receive a weekly email (as they have with the previous version of the curriculum). This email will direct them to a Moodle course for that week, such as "cardiac disease 1," which will provide to direct links within the WebBrain to all of the topics expected to be covered that week, ultimately providing access to the relevant multi-media materials. Once one has accessed the WebBrain, he or she can surf anywhere within the content tree.
The curriculum will be released in two phases. Phase I entails releasing the content which has been populated onto the WebBrain, utilizing Moodle as the access point. Phase II, which is expected to occur over the coming year, will include a more robust Moodle site. These courses will be fleshed out to each include a multiple-choice quiz with feedback, a wiki page, opportunities for commentary, and a means of gathering feedback from end-users regarding the curriculum. Access to these courses will be free of charge to thoracic surgical residents in the United States and Canada, as well as to program coordinators and faculty. Graduating residents will have access for 1 additional year in order to use the curriculum as a tool to prepare for Boards.
Dr. Edward Verrier, JCTSE Surgical Director of Education, explains that "the curriculum revision is a number of years in conception, preparation, organization, and now implementation. It is the combined effort of a number of dedicated educators and societies with some financial support from industry."
Referencing Salman Kahn in The One World Schoolhouse: Education Reimagined, Dr. Verrier continues: "We believe that this educational tool, using both a learning management and content management electronic based platform, has the potential to ‘flip the classroom.’ With work hour restrictions for residents, a constantly increasing body of knowledge, and the challenges of teaching in the operating room, we believe the new Thoracic Surgery Curriculum has the potential to transform our current approach to surgical education."
So what does this mean for trainees? As stated by Dr. Vaporciyan, "the biggest benefit to the trainees is that, with this content and related quizzes, individuals will have the ability to assess their own needs, have immediate access to relevant content that is free of charge, and, importantly, it is the ABTS intent to ultimately derive the examination material from this new electronic curriculum." Yes, it’s true. The board has agreed that the new curriculum will serve as a template of the content for both the written and oral examinations, making this curriculum the ideal study source for trainees. Dr. John Calhoon, chair of the ABTS, reports that "it is our goal to make sure that we draw questions in the future from the content that is called for in our outline and encompassed by the efforts of this new curriculum’s editors." (And did I mention that it’s free and immediately accessible on the Internet?)
And what about for the educators out there – what does this mean for you? Vaporciyan highlights three key advantages for the teachers: 1) the curriculum is completely malleable, so you can take whatever topic you want your learners to focus upon, and you can add to it or separate topics in any way, such as rotation preparation or linear knowledge acquisition; 2) through learner management aspects of Moodle, you can track all of your learners’ progress; 3) the curriculum is linked to Milestones, which should dramatically assist with meeting this requirement of the ACGME.
As mentioned by Dr. Vaporciyan, the Milestones Project is an important recent endeavor of the ACGME, mandating that all specialty groups develop outcome-based goals for resident performance within the six domains of clinical competence. The milestones will be used by the ACGME to demonstrate accountability of effectiveness of education within ACGME-accredited programs, and, looking ahead, resident performance on milestones will become a source of normative data for the RRC to use in assessing residency programs and facilitating improvements. Linking the new curriculum to milestones will render it a great tool to program directors in ACGME-accredited programs. As explained by Dr. Calhoon, "the RRC is working with the Milestones effort to align the individual curricular modules so that residency training programs will find further synergy and utility in adapting or frankly using the curriculum ‘right off the shelf.’"
When asked about the new curriculum, President of the TSDA Dr. David Fullerton shares with us that "along with the other organizations within our specialty, the TSDA is committed to the education of our residents. The TSDA feels that the consolidation of our specialty’s curricular efforts in this way is a significant advance in thoracic surgical education." Further, Dr. Fullerton acknowledges that the new curriculum "will afford our residents immediate electronic access to important educational materials and will be flexible enough for adaption in individual programs." With gratitude on behalf of the TSDA, Dr. Fullerton congratulates all of the individuals who have contributed to making the Thoracic Surgery Curriculum a reality.
Clearly, this new curriculum has much to offer, for both the teacher and the student. It will be of significant interest to track use and observe associated relationships with subsequent board examination success.
In anticipation of an Aug. 1 launch, notifications regarding accessing the site were provided to residents and program directors via email throughout the month of July. More information on the new curriculum, as well as an introductory video, is found at www.tsda.org/education/thoracic-surgery-curricula.
And we will continue to follow and discuss the new curriculum in these pages of the Residents’ Corner.
Much anticipated by many, exciting to the tech-savvy among us, and unbeknownst to others, yet equally relevant to all: The new curriculum is here. Whether you are a trainee, an educator, or a thoracic surgeon interested in the future of our specialty, the unveiling of the new curriculum is of key significance.
In 1992, at the Joint Conference on Graduate Education in Thoracic Surgery, significant emphasis was placed upon curricular change for thoracic surgical education. In response, the Thoracic Surgery Directors Association (TSDA) initiated the comprehensive thoracic surgery curriculum project in order to develop a consensus as to the content that ought to be learned during thoracic surgical training. Published in 1994, and available online, the TSDA Curriculum was intended to serve as a study guide to individual trainees and a useful resource for Program Directors. While of enormous utility over the last 2 decades, the curriculum is getting a makeover.
Being released this July is a brand-new curriculum, with updated topics and an excitingly novel platform, as a collaborative project from several organizations committed to thoracic surgical education. The Joint Council on Thoracic Surgery Education (JCTSE) has been working closely with the TSDA, with significant input from the American Board of Thoracic Surgery (ABTS), the Society of Thoracic Surgeons (STS), and the Residency Review Committee (RRC) for Thoracic Surgery. Dr. Ara Vaporciyan, Program Director at the University of Texas MD Anderson Cancer Center and 2013 Secretary/Treasurer of the TSDA, has been a key player in the development of the new curriculum.
When asked about the impetus for developing a new curriculum, Dr. Vaporciyan acknowledges that the old curriculum was an enormous advantage when first introduced, but that, now, it is somewhat outdated, and, further, new technology allows us to deliver the content better and more efficiently. Further, Dr. Vaporciyan highlights the valuable aspect of the new curriculum that links its content to expectations of the ABTS for board certification and the requirements of the Accreditation Council for Graduate Medical Education (ACGME) Milestones project.
Similar to the old curriculum, the basic architecture of the new curriculum contains 88-90 separate topics. However, within the new curriculum, the topics have been selected to cover each element of the published learning objectives provided by the ABTS.
Specific topics were identified by appointed section editors (Cardiac: Drs. James Fann and Craig Baker, Thoracic: DRs. Stephen Yang and Ara Vaporciyan, Congenital: Drs. Ram Subramanyan and Winfield Wells). Approximately 20 topic editors from all over the country have helped populate the new curriculum with content, and have additionally provided some input toward the division of topics.
For many, the most exciting feature of the new curriculum relates to the way that the educational materials will be delivered. Using WebBrain software (TheBrain, Los Angeles) for content management, all topics are organized like a mind map. For example, on the main tree, one can click on Thoracic Surgery, then neoplasm of the lung, which then explodes into three related topics: medical knowledge, patient care, and technical skills, which each branch out further. As explained by Dr. Vaporciyan, "the learning objectives of the ABTS provide the structure of the tree – its trunk and main branches – while the content components, provided by the topic editors, serve as the leaves on the ends of the branches."
So what exactly makes up those leaves at the end of the branches? The multi-media material is 100% pre-existing, coming from six different textbooks, up-to-date literature, online presentations created by the TSDA, and societal guidelines. In addition to the WebBrain content management system, the new curriculum utilizes a Moodle-based (Moodle Pty. Ltd., Perth, Australia) platform for organizing specific lessons plans and weekly curricular goals. Moodle (modular object-oriented dynamic learning environment) is an e-learning software platform, also known as a virtual learning environment.
With features such as assignment submission, quiz completion, discussion forums, file download capabilities, and opportunities for instructors to track individual trainee use, the potential opportunities for future growth are enormous. Within the new TSDA curriculum, trainees will receive a weekly email (as they have with the previous version of the curriculum). This email will direct them to a Moodle course for that week, such as "cardiac disease 1," which will provide to direct links within the WebBrain to all of the topics expected to be covered that week, ultimately providing access to the relevant multi-media materials. Once one has accessed the WebBrain, he or she can surf anywhere within the content tree.
The curriculum will be released in two phases. Phase I entails releasing the content which has been populated onto the WebBrain, utilizing Moodle as the access point. Phase II, which is expected to occur over the coming year, will include a more robust Moodle site. These courses will be fleshed out to each include a multiple-choice quiz with feedback, a wiki page, opportunities for commentary, and a means of gathering feedback from end-users regarding the curriculum. Access to these courses will be free of charge to thoracic surgical residents in the United States and Canada, as well as to program coordinators and faculty. Graduating residents will have access for 1 additional year in order to use the curriculum as a tool to prepare for Boards.
Dr. Edward Verrier, JCTSE Surgical Director of Education, explains that "the curriculum revision is a number of years in conception, preparation, organization, and now implementation. It is the combined effort of a number of dedicated educators and societies with some financial support from industry."
Referencing Salman Kahn in The One World Schoolhouse: Education Reimagined, Dr. Verrier continues: "We believe that this educational tool, using both a learning management and content management electronic based platform, has the potential to ‘flip the classroom.’ With work hour restrictions for residents, a constantly increasing body of knowledge, and the challenges of teaching in the operating room, we believe the new Thoracic Surgery Curriculum has the potential to transform our current approach to surgical education."
So what does this mean for trainees? As stated by Dr. Vaporciyan, "the biggest benefit to the trainees is that, with this content and related quizzes, individuals will have the ability to assess their own needs, have immediate access to relevant content that is free of charge, and, importantly, it is the ABTS intent to ultimately derive the examination material from this new electronic curriculum." Yes, it’s true. The board has agreed that the new curriculum will serve as a template of the content for both the written and oral examinations, making this curriculum the ideal study source for trainees. Dr. John Calhoon, chair of the ABTS, reports that "it is our goal to make sure that we draw questions in the future from the content that is called for in our outline and encompassed by the efforts of this new curriculum’s editors." (And did I mention that it’s free and immediately accessible on the Internet?)
And what about for the educators out there – what does this mean for you? Vaporciyan highlights three key advantages for the teachers: 1) the curriculum is completely malleable, so you can take whatever topic you want your learners to focus upon, and you can add to it or separate topics in any way, such as rotation preparation or linear knowledge acquisition; 2) through learner management aspects of Moodle, you can track all of your learners’ progress; 3) the curriculum is linked to Milestones, which should dramatically assist with meeting this requirement of the ACGME.
As mentioned by Dr. Vaporciyan, the Milestones Project is an important recent endeavor of the ACGME, mandating that all specialty groups develop outcome-based goals for resident performance within the six domains of clinical competence. The milestones will be used by the ACGME to demonstrate accountability of effectiveness of education within ACGME-accredited programs, and, looking ahead, resident performance on milestones will become a source of normative data for the RRC to use in assessing residency programs and facilitating improvements. Linking the new curriculum to milestones will render it a great tool to program directors in ACGME-accredited programs. As explained by Dr. Calhoon, "the RRC is working with the Milestones effort to align the individual curricular modules so that residency training programs will find further synergy and utility in adapting or frankly using the curriculum ‘right off the shelf.’"
When asked about the new curriculum, President of the TSDA Dr. David Fullerton shares with us that "along with the other organizations within our specialty, the TSDA is committed to the education of our residents. The TSDA feels that the consolidation of our specialty’s curricular efforts in this way is a significant advance in thoracic surgical education." Further, Dr. Fullerton acknowledges that the new curriculum "will afford our residents immediate electronic access to important educational materials and will be flexible enough for adaption in individual programs." With gratitude on behalf of the TSDA, Dr. Fullerton congratulates all of the individuals who have contributed to making the Thoracic Surgery Curriculum a reality.
Clearly, this new curriculum has much to offer, for both the teacher and the student. It will be of significant interest to track use and observe associated relationships with subsequent board examination success.
In anticipation of an Aug. 1 launch, notifications regarding accessing the site were provided to residents and program directors via email throughout the month of July. More information on the new curriculum, as well as an introductory video, is found at www.tsda.org/education/thoracic-surgery-curricula.
And we will continue to follow and discuss the new curriculum in these pages of the Residents’ Corner.

Current recs for JE-VC extended
Japanese encephalitis virus is a leading cause of encephalitis in Asia. The disease is mosquito borne where humans are incidental hosts who do not develop high-enough bloodstream concentrations to infect feeding mosquitoes. Culex tritaeniorhynchus mosquitos, an evening- and nighttime-biting mosquito, is the most important vector for transmission to humans.
Japanese encephalitis (JE) occurs primarily in rural agricultural areas, specifically in areas of rice production using flood irrigation. Although primarily rural, these ecologic conditions can be found near urban areas. Virus transmission is seasonal, with peak incidence in summer and fall. JE occurs throughout most of Asia and parts of the Western Pacific. The largest numbers of cases have been among people traveling to Thailand, followed by China, Indonesia, and the Philippines.
JE is primarily a disease of children in endemic countries, with annual incidences of 5-50 cases per 100,000 children. However, as adult travelers are both greater in number and lack protective antibody, they represent the majority of travel-acquired cases. Between 1973 and 2012, 65 cases of travel-associated JE among persons from nonendemic areas were reported in the literature. There was a median of 1 case per year, with 6 (9%) in children under 17 years of age. Among the six pediatric cases, the median age was 9 years, with a range of 1-11 years. Cases occurred most commonly between June and August, although they were reported year-round.

Symptomatic disease is often severe; however, the majority of cases are asymptomatic. Current estimates are 68,000 cases annually, with case fatality rates of 20%-30%. Thirty percent to 50% of survivors have significant neurologic, cognitive, or behavioral sequelae.
JE-VC, a formalin-inactivated vaccine derived from an attenuated virus strain and propagated in Vero cells, was licensed for use in children beginning at 2 months of age in May 2013. This is the only JE vaccine currently licensed and available in the United States. The JE-VC vaccine, manufactured as IXIARO, was licensed for use in adults in the United States, Europe, and Australia in 2009. The primary immunization series is two doses administered intramuscularly at 0 and 28 days.
The Centers for Disease Control and Prevention Advisory Committee on Immunization Practices (ACIP) reviewed the relevant data for a June 2013 meeting. The working group concluded that the overall risk of JE for most travelers to Asia is very low, but that the risk varies based on destination, duration, season, and activities. Prolonged travel in rural areas with active JE virus transmission may confer risks to travelers that are similar to risks in susceptible resident populations. Shorter-term travelers may still be at risk if their itinerary includes outdoor or nighttime exposure in rural areas during periods of active transmission. Short-term travel restricted to major urban areas confers minimal risk of JE.
ACIP recommendations for adults 17 years of age and older were approved in June 2009, and a booster dose recommendation was approved in February 2011. Recommendations state that health providers who are considering the use of JE vaccines for travelers must weigh the risk of travel-associated JE with the benefits and potential risks of the JE vaccine.
JE is a severe disease with substantial morbidity and mortality, and there is no specific treatment. A safe and effective vaccine is available; however, the vaccine is relatively expensive and the possibility of rare, serious adverse events cannot be excluded. The 2009 and 2011 recommendations for adults included the following:
• Travelers to JE-endemic countries should be advised of the risks of JE disease and the importance of measures to reduce mosquito bites.
• JE vaccine is recommended for travelers who plan to spend a month or longer in endemic areas during the JE virus transmission season.
• JE vaccine should be considered for short-term travelers to endemic areas if they will travel outside of an urban area, and if their activities will increase the risk of JE virus exposure.
• JE vaccine is not recommended for short-term travelers whose visit will be restricted to urban areas or times outside of a well-defined JE virus transmission season.
• If it has been 1 year since the primary series, a booster dose may be given prior to potential JE virus exposure.
• Data on the need for and timing of additional booster doses are not available.
A recommendation to expand the recommended use of JE-VC to children aged 2 months was approved by ACIP in June 2013. Their recommendation was based on the data demonstrating a high rate of seroconversion in children following the two-dose primary series, low rates of serious or systemic adverse events, and the lack of therapy for a serious disease.
In summary, JE-VC is recommended for travelers who plan to spend a month or longer in endemic areas during the JE virus transmission season. This includes long-term travelers, recurrent travelers, or expatriates who will be based in urban areas but are likely to visit endemic rural or agricultural areas during a high-risk season; the vaccine also should be considered for short-term travelers to rural endemic areas during virus transmission season, as well when there are outbreaks.
Dr. Pelton is chief of pediatric infectious disease and also is the coordinator of the maternal-child HIV program at Boston Medical Center. Dr. Pelton said he has attended and received honoraria for Novartis advisory board meetings on vaccines, although JE-VC has not been discussed. E-mail him at [email protected].
Japanese encephalitis (JE) occurs primarily in rural agricultural areas, specifically in areas of rice production using flood irrigation. Although primarily rural, these ecologic conditions can be found near urban areas. Virus transmission is seasonal, with peak incidence in summer and fall. JE occurs throughout most of Asia and parts of the Western Pacific. The largest numbers of cases have been among people traveling to Thailand, followed by China, Indonesia, and the Philippines.
Japanese encephalitis virus is a leading cause of encephalitis in Asia. The disease is mosquito borne where humans are incidental hosts who do not develop high-enough bloodstream concentrations to infect feeding mosquitoes. Culex tritaeniorhynchus mosquitos, an evening- and nighttime-biting mosquito, is the most important vector for transmission to humans.
Japanese encephalitis (JE) occurs primarily in rural agricultural areas, specifically in areas of rice production using flood irrigation. Although primarily rural, these ecologic conditions can be found near urban areas. Virus transmission is seasonal, with peak incidence in summer and fall. JE occurs throughout most of Asia and parts of the Western Pacific. The largest numbers of cases have been among people traveling to Thailand, followed by China, Indonesia, and the Philippines.
JE is primarily a disease of children in endemic countries, with annual incidences of 5-50 cases per 100,000 children. However, as adult travelers are both greater in number and lack protective antibody, they represent the majority of travel-acquired cases. Between 1973 and 2012, 65 cases of travel-associated JE among persons from nonendemic areas were reported in the literature. There was a median of 1 case per year, with 6 (9%) in children under 17 years of age. Among the six pediatric cases, the median age was 9 years, with a range of 1-11 years. Cases occurred most commonly between June and August, although they were reported year-round.
Symptomatic disease is often severe; however, the majority of cases are asymptomatic. Current estimates are 68,000 cases annually, with case fatality rates of 20%-30%. Thirty percent to 50% of survivors have significant neurologic, cognitive, or behavioral sequelae.
JE-VC, a formalin-inactivated vaccine derived from an attenuated virus strain and propagated in Vero cells, was licensed for use in children beginning at 2 months of age in May 2013. This is the only JE vaccine currently licensed and available in the United States. The JE-VC vaccine, manufactured as IXIARO, was licensed for use in adults in the United States, Europe, and Australia in 2009. The primary immunization series is two doses administered intramuscularly at 0 and 28 days.
The Centers for Disease Control and Prevention Advisory Committee on Immunization Practices (ACIP) reviewed the relevant data for a June 2013 meeting. The working group concluded that the overall risk of JE for most travelers to Asia is very low, but that the risk varies based on destination, duration, season, and activities. Prolonged travel in rural areas with active JE virus transmission may confer risks to travelers that are similar to risks in susceptible resident populations. Shorter-term travelers may still be at risk if their itinerary includes outdoor or nighttime exposure in rural areas during periods of active transmission. Short-term travel restricted to major urban areas confers minimal risk of JE.
ACIP recommendations for adults 17 years of age and older were approved in June 2009, and a booster dose recommendation was approved in February 2011. Recommendations state that health providers who are considering the use of JE vaccines for travelers must weigh the risk of travel-associated JE with the benefits and potential risks of the JE vaccine.
JE is a severe disease with substantial morbidity and mortality, and there is no specific treatment. A safe and effective vaccine is available; however, the vaccine is relatively expensive and the possibility of rare, serious adverse events cannot be excluded. The 2009 and 2011 recommendations for adults included the following:
• Travelers to JE-endemic countries should be advised of the risks of JE disease and the importance of measures to reduce mosquito bites.
• JE vaccine is recommended for travelers who plan to spend a month or longer in endemic areas during the JE virus transmission season.
• JE vaccine should be considered for short-term travelers to endemic areas if they will travel outside of an urban area, and if their activities will increase the risk of JE virus exposure.
• JE vaccine is not recommended for short-term travelers whose visit will be restricted to urban areas or times outside of a well-defined JE virus transmission season.
• If it has been 1 year since the primary series, a booster dose may be given prior to potential JE virus exposure.
• Data on the need for and timing of additional booster doses are not available.
A recommendation to expand the recommended use of JE-VC to children aged 2 months was approved by ACIP in June 2013. Their recommendation was based on the data demonstrating a high rate of seroconversion in children following the two-dose primary series, low rates of serious or systemic adverse events, and the lack of therapy for a serious disease.
In summary, JE-VC is recommended for travelers who plan to spend a month or longer in endemic areas during the JE virus transmission season. This includes long-term travelers, recurrent travelers, or expatriates who will be based in urban areas but are likely to visit endemic rural or agricultural areas during a high-risk season; the vaccine also should be considered for short-term travelers to rural endemic areas during virus transmission season, as well when there are outbreaks.
Dr. Pelton is chief of pediatric infectious disease and also is the coordinator of the maternal-child HIV program at Boston Medical Center. Dr. Pelton said he has attended and received honoraria for Novartis advisory board meetings on vaccines, although JE-VC has not been discussed. E-mail him at [email protected].
Japanese encephalitis (JE) occurs primarily in rural agricultural areas, specifically in areas of rice production using flood irrigation. Although primarily rural, these ecologic conditions can be found near urban areas. Virus transmission is seasonal, with peak incidence in summer and fall. JE occurs throughout most of Asia and parts of the Western Pacific. The largest numbers of cases have been among people traveling to Thailand, followed by China, Indonesia, and the Philippines.
Japanese encephalitis (JE) occurs primarily in rural agricultural areas, specifically in areas of rice production using flood irrigation. Although primarily rural, these ecologic conditions can be found near urban areas. Virus transmission is seasonal, with peak incidence in summer and fall. JE occurs throughout most of Asia and parts of the Western Pacific. The largest numbers of cases have been among people traveling to Thailand, followed by China, Indonesia, and the Philippines.

Health IT coordinator moving on
Upset about the federal government’s meaningful use standards? Don’t take your complaints to Dr. Farzad Mostashari. He’s stepping down from his post as national coordinator for health information technology sometime this fall.
His departure comes as physicians and hospitals are moving toward adoption of Stage 2 of meaningful use, part of the Medicare Electronic Health Record (EHR) incentive program. Dr. Mostashari also has been called to Capitol Hill in recent weeks to field questions from lawmakers on why it is taking so long to make EHR systems talk to one another.
In an e-mail to agency staff on Aug. 6, Health and Human Services Secretary Kathleen Sebelius praised Dr. Mostashari for his work in linking the meaningful use of EHRs to population health goals and laying a "strong foundation" for increasing the interoperability of health records.
Dr. Mostashari, who became national coordinator in 2011, will stay on in his current post for a little while as HHS officials search for a replacement. As for his plans after leaving HHS, Dr. Mostashari said that he’s not sure.
"It is difficult for me to announce that I am leaving," he wrote in an e-mail to staff at the Office of the National Coordinator of Health Information Technology. "I don’t know what I will be doing after I leave public service, but be assured that I will be by your side as we continue to battle for healthcare transformation, cheering you on."
–By Mary Ellen Schneider
On Twitter @MaryEllenNY
