User login
Workflow Interruptions Threaten Patient Safety, Hospitalists' Job Satisfaction


When I visit hospitalist programs, one of the things I am most interested in learning about is the degree to which the hospitalists enjoy their work and why. On a recent visit, in my usual meeting with the hospitalist group, we talked a lot about what it is like to be a hospitalist. When I asked them what the greatest threat to their job satisfaction was, there was a chorus of consistency in their answers: interruptions. The hospitalists were deeply frustrated by minute-to-minute intrusions into their workflow. The emergency department, nurses, pharmacy, the admitting department, the lab, radiology—you name it, everyone wants a piece of them.
Constant interruptions are a career satisfaction issue for hospitalists. But for patients, the interruptions represent a safety and quality of care issue. Why?
The Myth of Multi-tasking
Some of us take pride in our ability to multi-task. Others freely admit they aren’t very good at it. In any case, we know through cognitive psychology that the brain cannot multi-task, at least in the realm of conscious work. (The brain, of course, carries out basic, life-sustaining functions while we are doing other work cognitively.) The brain is actually a “sequential processor,” and multi-tasking actually is “task-switching.” Those of us who “multi-task” well are able to switch tasks easily and effectively.
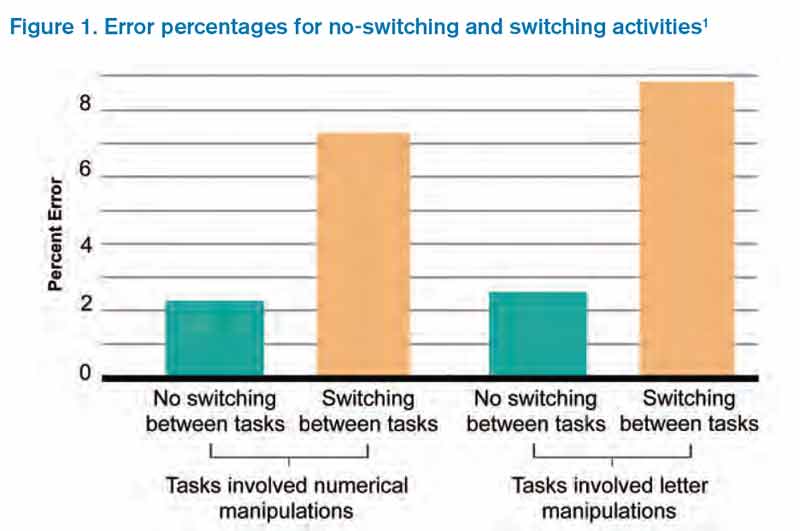
But, task switching comes at a cost. When we switch tasks, we are prone to errors in the performance of those tasks. Two psychologists, Rogers and Monsell, demonstrated this in a study that looked at error rates when subjects performed tasks involving numerical or letter manipulations.1 The tasks involved classifying either the digit member of a pair of characters as even/odd or the letter member as consonant/vowel. When subjects performed the tasks while switching among multiple tasks, the error rate was fourfold the rate with no task switching (see Figure 1).1 These findings have been replicated since the original study. Further, there is now well-developed literature devoted to interruptions and patient safety.
It Takes Time
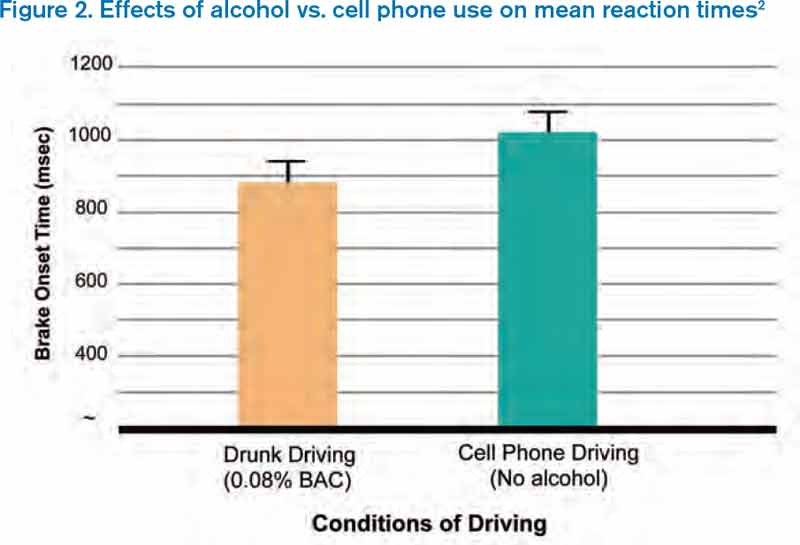
We also know that switching between tasks takes time. Why? Because changing one’s attention from one subject to another involves neurologic processes that are not instantaneous. In a simulated driving study comparing mean reaction times between intoxicated subjects (blood alcohol 0.08%) and those talking on a cell phone, Strayer and Drews found the mean time to brake onset was significantly slower in the cell phone group than in the drunk driving group, presumably because cell phone users had to switch tasks.2
How Can We Tame Interruptions?
I submit that we need to be realistic about our ability to control the number of interruptions hospitalists experience in a given workday. One approach is to identify “high stakes moments” that are protected from excessive interruptions. Taking an example from aviation, airplane takeoffs and landings are “no interruption” zones, meaning that no needless talking or tasking is allowed in the cockpit during these tasks. Potential “no interruption” zones in hospital medicine might include times when hospitalists are developing an assessment and plan, engaged in complex decision-making, or performing medication reconciliation.
But is it realistic to think that we can cordon off hospitalists during these tasks?
Another approach is to establish practices that may decrease interruptions. Interruptions likely are reduced by:
- Having unit-based hospitalist staffing;
- Holding multidisciplinary rounds;
- Training nurses to batch pages;
- Conducting structured evening and night rounds on all nursing units for non-urgent matters; and
- Developing paging “levels” so that a receiving physician knows if a call back is needed and, if so, if it is urgent or not.
In talking to hospitalists who cite interruptions as job dissatisfiers, it occurs to me that anything that erodes career engagement also threatens patient safety. If we could figure out how to control interruptions, we would kill two birds with one stone.
Dr. Whitcomb is Chief Medical Officer of Remedy Partners. He is co-founder and past president of SHM. Email him at [email protected].
References
When I visit hospitalist programs, one of the things I am most interested in learning about is the degree to which the hospitalists enjoy their work and why. On a recent visit, in my usual meeting with the hospitalist group, we talked a lot about what it is like to be a hospitalist. When I asked them what the greatest threat to their job satisfaction was, there was a chorus of consistency in their answers: interruptions. The hospitalists were deeply frustrated by minute-to-minute intrusions into their workflow. The emergency department, nurses, pharmacy, the admitting department, the lab, radiology—you name it, everyone wants a piece of them.
Constant interruptions are a career satisfaction issue for hospitalists. But for patients, the interruptions represent a safety and quality of care issue. Why?
The Myth of Multi-tasking
Some of us take pride in our ability to multi-task. Others freely admit they aren’t very good at it. In any case, we know through cognitive psychology that the brain cannot multi-task, at least in the realm of conscious work. (The brain, of course, carries out basic, life-sustaining functions while we are doing other work cognitively.) The brain is actually a “sequential processor,” and multi-tasking actually is “task-switching.” Those of us who “multi-task” well are able to switch tasks easily and effectively.
But, task switching comes at a cost. When we switch tasks, we are prone to errors in the performance of those tasks. Two psychologists, Rogers and Monsell, demonstrated this in a study that looked at error rates when subjects performed tasks involving numerical or letter manipulations.1 The tasks involved classifying either the digit member of a pair of characters as even/odd or the letter member as consonant/vowel. When subjects performed the tasks while switching among multiple tasks, the error rate was fourfold the rate with no task switching (see Figure 1).1 These findings have been replicated since the original study. Further, there is now well-developed literature devoted to interruptions and patient safety.
It Takes Time
We also know that switching between tasks takes time. Why? Because changing one’s attention from one subject to another involves neurologic processes that are not instantaneous. In a simulated driving study comparing mean reaction times between intoxicated subjects (blood alcohol 0.08%) and those talking on a cell phone, Strayer and Drews found the mean time to brake onset was significantly slower in the cell phone group than in the drunk driving group, presumably because cell phone users had to switch tasks.2
How Can We Tame Interruptions?
I submit that we need to be realistic about our ability to control the number of interruptions hospitalists experience in a given workday. One approach is to identify “high stakes moments” that are protected from excessive interruptions. Taking an example from aviation, airplane takeoffs and landings are “no interruption” zones, meaning that no needless talking or tasking is allowed in the cockpit during these tasks. Potential “no interruption” zones in hospital medicine might include times when hospitalists are developing an assessment and plan, engaged in complex decision-making, or performing medication reconciliation.
But is it realistic to think that we can cordon off hospitalists during these tasks?
Another approach is to establish practices that may decrease interruptions. Interruptions likely are reduced by:
- Having unit-based hospitalist staffing;
- Holding multidisciplinary rounds;
- Training nurses to batch pages;
- Conducting structured evening and night rounds on all nursing units for non-urgent matters; and
- Developing paging “levels” so that a receiving physician knows if a call back is needed and, if so, if it is urgent or not.
In talking to hospitalists who cite interruptions as job dissatisfiers, it occurs to me that anything that erodes career engagement also threatens patient safety. If we could figure out how to control interruptions, we would kill two birds with one stone.
Dr. Whitcomb is Chief Medical Officer of Remedy Partners. He is co-founder and past president of SHM. Email him at [email protected].
References
Hospitalist Anand Kartha Tackles Array of Hospital Medicine Duties

He doesn’t own a single Apple product. He hasn’t had a chance but can’t wait to watch “Zero Dark Thirty,” the docudrama that details the black ops mission to kill Osama bin Laden. And he doesn’t know what he’d do if he wasn’t a hospitalist.
A well-rounded hospitalist, that is.
Anand Kartha, MD, MS, is as engaged as hospital-based physicians come, working in the academic, research, community, and Veterans Affairs settings.
He studied at the University of Bombay in his native India, completing a four-year residency there before working as a resident and chief resident at the University of Pittsburgh Medical Center Mercy. He went on to complete a general medicine fellowship at Boston University and, in 2005, earned a Master of Science in Health Services Research at Boston University.
Currently, he is an academic hospitalist at the Boston VA and associate chief of general internal medicine. He is an assistant professor of medicine at Boston University School of Medicine and a lecturer in medicine at Harvard Medical School.
Dr. Kartha has been published a half dozen times and presented scientific abstract posters at HM12 in San Diego, HM10 in Washington, D.C., and HM09 in Chicago. He’s on the patient safety, systems redesign, professional standards, and peer review committees at the VA Boston Healthcare System. In 2007, he received the David Littmann Award for Excellence in Patient Care and Education from VA Boston and, in 2011, received the Robert Dawson Evans Faculty Special Recognition Teaching Award from Boston University.
“I spend about 15% to 20% of my time in research and 20% of my time in education, both focused on quality and patient safety,” says Dr. Kartha, one of nine new members of Team Hospitalist, the volunteer editorial advisory group for The Hospitalist. “For example, I am part of a national study to look at the quality of inpatient medicine care in the VA. I started and run a curriculum/rotation for medicine residents on quality and safety. I have held a number of leadership roles, like associate chief of medicine for quality and performance. I also enjoy working with system engineers on a number of QI projects.”

–Dr. Kartha
Question: Why did you choose a career in medicine?
A: Peer pressure; an interest in biology; desire to make a direct difference in people’s lives.
Q: When did you decide to become a hospitalist?
A: About 10 years ago. My research, clinical, and educational goals all overlapped in the inpatient arena and it was a natural progression.
Q: What do you like most about working as a hospitalist?
A: Working as a team and teaching residents and students are both very rewarding. As an academic hospitalist, I have flexible work hours that give me time to pursue both clinical and other opportunities too.
Q: What’s the best advice you ever received?
A: Don’t be the first to adopt a new treatment, but don’t be the last.
Q: What’s the biggest change you’ve seen in hospital medicine in your career?
A: Explosive growth. I never anticipated it would get to be so big, so fast.
Q: What is your biggest professional challenge?
A: Finding adequate mentorship and statistical support to do research and publish papers.
Q: What is your biggest professional reward?
A: Seeing my patients get better, watching my students get excited by medicine, and the success of my mentees.
Q: When you aren’t working, what is important to you?
A: Like most people, my family and health.
Q: What’s next professionally?
A: I have considered academic and medical industry leadership roles, but I see myself probably spending more time formally in inpatient clinical education.
Q: If you weren’t a doctor, what would you be doing right now?
A: I couldn’t do anything else. No skills, no interest—and I love what I do.
Q: What’s the best book you’ve read recently? Why?
A: “Sweet Tooth” by Ian McEwan. Pure entertainment.
Richard Quinn is a freelance writer in New Jersey.
He doesn’t own a single Apple product. He hasn’t had a chance but can’t wait to watch “Zero Dark Thirty,” the docudrama that details the black ops mission to kill Osama bin Laden. And he doesn’t know what he’d do if he wasn’t a hospitalist.
A well-rounded hospitalist, that is.
Anand Kartha, MD, MS, is as engaged as hospital-based physicians come, working in the academic, research, community, and Veterans Affairs settings.
He studied at the University of Bombay in his native India, completing a four-year residency there before working as a resident and chief resident at the University of Pittsburgh Medical Center Mercy. He went on to complete a general medicine fellowship at Boston University and, in 2005, earned a Master of Science in Health Services Research at Boston University.
Currently, he is an academic hospitalist at the Boston VA and associate chief of general internal medicine. He is an assistant professor of medicine at Boston University School of Medicine and a lecturer in medicine at Harvard Medical School.
Dr. Kartha has been published a half dozen times and presented scientific abstract posters at HM12 in San Diego, HM10 in Washington, D.C., and HM09 in Chicago. He’s on the patient safety, systems redesign, professional standards, and peer review committees at the VA Boston Healthcare System. In 2007, he received the David Littmann Award for Excellence in Patient Care and Education from VA Boston and, in 2011, received the Robert Dawson Evans Faculty Special Recognition Teaching Award from Boston University.
“I spend about 15% to 20% of my time in research and 20% of my time in education, both focused on quality and patient safety,” says Dr. Kartha, one of nine new members of Team Hospitalist, the volunteer editorial advisory group for The Hospitalist. “For example, I am part of a national study to look at the quality of inpatient medicine care in the VA. I started and run a curriculum/rotation for medicine residents on quality and safety. I have held a number of leadership roles, like associate chief of medicine for quality and performance. I also enjoy working with system engineers on a number of QI projects.”
–Dr. Kartha
Question: Why did you choose a career in medicine?
A: Peer pressure; an interest in biology; desire to make a direct difference in people’s lives.
Q: When did you decide to become a hospitalist?
A: About 10 years ago. My research, clinical, and educational goals all overlapped in the inpatient arena and it was a natural progression.
Q: What do you like most about working as a hospitalist?
A: Working as a team and teaching residents and students are both very rewarding. As an academic hospitalist, I have flexible work hours that give me time to pursue both clinical and other opportunities too.
Q: What’s the best advice you ever received?
A: Don’t be the first to adopt a new treatment, but don’t be the last.
Q: What’s the biggest change you’ve seen in hospital medicine in your career?
A: Explosive growth. I never anticipated it would get to be so big, so fast.
Q: What is your biggest professional challenge?
A: Finding adequate mentorship and statistical support to do research and publish papers.
Q: What is your biggest professional reward?
A: Seeing my patients get better, watching my students get excited by medicine, and the success of my mentees.
Q: When you aren’t working, what is important to you?
A: Like most people, my family and health.
Q: What’s next professionally?
A: I have considered academic and medical industry leadership roles, but I see myself probably spending more time formally in inpatient clinical education.
Q: If you weren’t a doctor, what would you be doing right now?
A: I couldn’t do anything else. No skills, no interest—and I love what I do.
Q: What’s the best book you’ve read recently? Why?
A: “Sweet Tooth” by Ian McEwan. Pure entertainment.
Richard Quinn is a freelance writer in New Jersey.
Society of Hospital Medicine (SHM) Epitomizes Professional Diversity

I just got back from a trip to SHM headquarters in Philadelphia, and all I can say is “wow.” I was visiting there for a meeting with the staff, many SHM members and committee leaders, and the SHM board of directors. The first day we all went into a big, modern, beautiful room at SHM headquarters—there must have been more than 100 people—and we went around the room and introduced ourselves. The diversity of the staff that support our society, and the diversity of the members there, was truly breathtaking. What I saw was a microcosm of our society and our specialty.
Looking around the room, it was easy to see some aspects of our diverse organization: both genders and a variety of ethnicities and age groups were well represented. These traditional measures of diversity are critical to a healthy environment, in my opinion, and the data bear out the idea that a diverse workforce can reduce turnover and be more creative and qualified.1,2 Our diversity is not an accident. It is part of a larger, deliberate strategy by SHM to be “the home” for healthcare professionals who provide hospital-based patient care. SHM embraces diversity, whether it’s skin deep or deeply cognitive.
Although we are continually working to enrich the traditional aspects of diversity, we are also very hard at work to make SHM a place of professional diversity.
Open and Inclusive
Over the past several years, SHM has worked hard to be openly inclusive. Many of the committees and sections within the society have been developed specifically to embrace important aspects of hospital medicine that have special or common interests, characteristics, or needs. Examples include the international section, med-peds section, administrators’ committee, and the nurse practitioner and physician assistant committee. These venues allow individuals under a Big Tent to find others with similar interests or training, so that they can address unique aspects of hospital medicine as it relates directly to them. SHM’s virtual world is following our committee and section structure, which has some of the most actively growing HMXchange communities coming from the “administrators” community and the “NP/PA” community.
SHM has put its money where its mouth is, dedicating significant resources for educational programs that will help benefit professionals with a variety of backgrounds. Some are focused on the special needs of our diverse physician population, including the Academic Hospitalist Academy, the Quality and Safety Educators Academy, and the Pediatric Hospital Medicine annual meeting (through a partnership with the American Academy of Pediatrics, the AAP Section on Hospital Medicine, and the Academic Pediatric Association). Other events are focused specifically on helping our non-physician colleagues, like the boot camp that is presented in collaboration with the American Academy of Physician Assistants and American Association of Nurse Practitioners. The SHM Leadership Academies attract a venerable alphabet soup of professional designations, including many MDs and DOs, of course, but also increasing numbers of PAs and NPs, a growing number of administrators, and now even a few ED and OB docs! Now that’s a Big Tent.
My understanding is that these events are always popular and often sold out.
Maybe the most powerful evidence that our Big Tent philosophy is working is found in the relationships SHM has forged with other hospital-based specialties, like obstetrics, neurology, and surgery. The president of the Society of OB/GYN Hospitalists (societyofobgynhospitalists.com) has attended the SHM annual meeting and at least one of the Leadership Academies. Although “traditional” hospitalists like me may not be able to help in the OR or birthing suite, we have a lot of experience in quality improvement, leadership, and, of course, addressing the needs of a new and growing professional segment. The emergence and growth of these “specialty hospitalists” offers a unique opportunity for traditional hospitalists to partner with our subspecialty colleagues in a new way, so that together we can continue to improve patient care within the hospital across multiple disciplines.
What’s Ahead?
Based on the data I recently saw while at SHM headquarters, the Big Tent philosophy is a measurable success. Membership for NPs, PAs, and administrators is growing, with nearly 200 new members in those categories combined. Incredibly, we have ED physicians joining our organization—albeit, at a number dwarfed by internists—and the relationships with the specialty hospitalists are moving forward in a meaningful way. Looking at committees and committee chairs, there is plenty of ethnic, professional, and gender diversity.
What does all of this focus outside of internal medicine and physician groups mean for us internists? Will we be left behind? Fret not. Physicians make up more than 85% of our 12,000-plus members, with internists outnumbering—by a huge number—all of the other segments of our society combined. There is no Big Tent so large that physicians, or even internists, will ever be in jeopardy. We occupy plenty of space under this Big Tent and still have lots of room to spare for our colleagues. In welcoming others, we all strengthen our own standing, by elevating the entire field.
As a terrific mentor once said, a rising tide floats all boats. And the way to raise the tide of hospital medicine can be through partnerships whose gravity is a strong pull on the hospital medicine tide, as the moon pulls the ocean’s tides.
One area in which our society plans to place more effort in expanding the Big Tent is with trainees. Students and housestaff are one of the smallest groups in our organization, with the smallest growth. Those statistics are cause for concern. The need for future hospitalist growth, both in numbers and skill set, makes attracting this segment of paramount importance, in my view.
Fortunately, SHM is developing a strategy to make our society a valuable home to trainees. I have touched on those strategies previously, including a Physicians in Training Committee, free membership for students, $100 memberships for housestaff, and our “1,000 Challenge” to recruit 1,000 students and housestaff in the coming months.
In Sum
I am a firm believer in professional and personal diversity. I am proud to work in a society that also embraces this philosophy, places real value on it, and works hard to be inclusive. So, the next time you meet an NP, PA, student, or even a hospital-based OB physician, bring them under the SHM Big Tent, and encourage them to join us in making the hospital world a better place. They, we, and our patients will be better off for it.
Dr. Howell is president of SHM, chief of the division of hospital medicine at Johns Hopkins Bayview in Baltimore, and spends a significant part of his time and research on hospital operations. Email questions or comments to [email protected].
References
- Egan ME. Global diversity and inclusion: Fostering innovation through a diverse workforce. Forbes Insights. Forbes website. Available at: http://images.forbes.com/forbesinsights/StudyPDFs/Innovation_Through_Diversity.pdf. Accessed October 23, 2013.
- Kerby S, Burns C. The top 10 economic facts of diversity in the workplace. Center for American Progress website. Available at: http://www.americanprogress.org/issues/labor/news/2012/07/12/11900/the-top-10-economic-facts-of-diversity-in-the-workplace. Accessed October 23, 2013.
Hospital Costs for Inpatients with Septicemia Total $20.3 Billion in 2011
Total annual cost of hospital care for septicemia (excluding patients in labor) in U.S. hospitals in 2011.
The figure represents 1.094 million discharges. It’s the first among 20 big-ticket medical conditions listed in an August 2013 Agency for Healthcare Research and Quality Statistical Brief, highlighted in Becker’s Hospital Review.3,4
Other high-cost conditions on the list were osteoarthritis ($14.8 billion; 964,000 discharges); complications of device, implement, or graft (12.9 billion; 699,000 discharges); and general childbirth (12.4 billion; 3,819,000).
References
- Chang W, Maynard G, Clay B. Implementation of a computerized COPD inpatient pathway and transition pathway [abstract]. J Hosp Med. 2013;8 Suppl 1:709.
- Schmitt S, McQuillen DP, Nahass R, et al. Infectious diseases specialty intervention is associated with decreased mortality and lower healthcare costs [published online ahead of print September 25, 2013]. Clin Infect Dis.
- Torio CM, Andrews RM. National inpatient hospital costs: the most expensive conditions by payer, 2011. Healthcare Cost and Utilization Project Statistical Brief #160. Available at: http://www.hcup-us.ahrq.gov/reports/statbriefs/sb160.jsp. Accessed October 26, 2013.
- Herman B. Top 20 most expensive inpatient conditions. Becker’s Hospital Review. Oct. 9, 2013. Available at: http://www.beckershospitalreview.com/racs-/-icd-9-/-icd-10/top-20-most-expensive-inpatient-conditions.html. Accessed October 26, 2013.
Infectious Disease Specialists Improve Patient Outcomes
A first-of-its-kind study of the impact of infectious disease (ID) physician specialists on outcomes for patients hospitalized with severe infections found that such patients are 9% less likely to die in the hospital and 12% less likely to die after discharge if they are seen by an ID specialist for evidence-based recommendations on diagnosis and management.2 The impact is more pronounced if they are seen by the specialist within 48 hours of hospital admission.
–Daniel McQuillen, MD
Researchers from Avalere Health and the Infectious Diseases Society of America (www.idsociety.org) examined fee-for-service Medicare claims from 2008 and 2009 for matched cohorts of more than 100,00 hospitalized patients with at least one of 11 common but serious infections who had interactions with ID specialists and 170,000 who did not. Although it is sometimes assumed that involving medical specialty consultants adds to costs, this study found that hospital and ICU lengths of stay were shorter and 30-day readmissions were reduced, says co-author Daniel McQuillen, MD, an ID specialist at Lahey Hospital and Medical Center in Burlington, Mass. Medicare charges and payments were not significantly different.
“We interact really well with thehospitalist group here,” Dr. McQuillen says. “We try to reinforce with our hospitalist group that our preference is to get involved early. If you do that, we’re very good at shepherding the patient through the transitions-of-care experience.
Post-discharge, the patient sees me in my office within a week, and I manage the handoff to the IV therapy service.”
Larry Beresford is a freelance writer in San Francisco, Calif.
References
- Chang W, Maynard G, Clay B. Implementation of a computerized COPD inpatient pathway and transition pathway [abstract]. J Hosp Med. 2013;8 Suppl 1:709.
- Schmitt S, McQuillen DP, Nahass R, et al. Infectious diseases specialty intervention is associated with decreased mortality and lower healthcare costs [published online ahead of print September 25, 2013]. Clin Infect Dis.
- Torio CM, Andrews RM. National inpatient hospital costs: the most expensive conditions by payer, 2011. Healthcare Cost and Utilization Project Statistical Brief #160. Available at: http://www.hcup-us.ahrq.gov/reports/statbriefs/sb160.jsp. Accessed October 26, 2013.
- Herman B. Top 20 most expensive inpatient conditions. Becker’s Hospital Review. Oct. 9, 2013. Available at: http://www.beckershospitalreview.com/racs-/-icd-9-/-icd-10/top-20-most-expensive-inpatient-conditions.html. Accessed October 26, 2013.
Multidisciplinary Approach Developed for COPD Pathway Patients

Quality Improvement
A computerized pathway for managing patients with chronic obstructive pulmonary disease (COPD), described in a Research, Innovations, and Clinical Vignettes poster/abstract presented at HM13, brings together evidence-based computerized physician order entry order sets for managing COPD with links to pulmonology and respiratory therapy protocols, and with established care transitions processes at the University of California at San Diego.1
“When I started this journey, examining how we were doing in adhering to national and international guidelines for COPD care, it turned out we were not doing such a great job,” says lead author Weijen Chang, MD, SFHM, FAAP, who works as a med-peds hospitalist at UCSD and is pediatric editor of The Hospitalist. “We were providing ideal care as defined in the guidelines only about 60 percent of the time.”
Dr. Chang found that UCSD pulmonologists were simultaneously working on their own QI project, so they combined forces around a COPD Inpatient Care Workgroup comprising hospitalists, pulmonologists, respiratory therapists, pharmacists, and information system specialists. The group developed a COPD Longitudinal Inpatient Pathway and Transition Pathway (CLIPT) addressing appropriate referrals for subspecialist care and rehabilitation in and out of the hospital.
The key was not just to create order sets for optimal COPD care, but also to improve access, continuity of care, and post-discharge follow-up through the pathway, which is available for initiation in the ED, at or after admission, or at discharge, Dr. Chang explains. Transition nurse specialists trained as part of a separate initiative at the medical center provide COPD case management. The group is exploring the use of respiratory therapists to actively case-manage COPD patients going home. Patients are connected with a COPD discharge clinic staffed part-time by a UCSD pulmonologist.
According to the abstract, the CLIPT pathway was initiated in 46% of patients admitted with acute exacerbations of COPD. Dr. Chang says further study is needed to assess outcomes during and after hospitalization.
More ideas on enhancing hospital care for the COPD population in order to manage their high risk of readmissions was presented at the recent COPD and Readmissions Summit sponsored by the COPD Foundation (www.copdfoundation.org) in October in Washington, D.C.
References
- Chang W, Maynard G, Clay B. Implementation of a computerized COPD inpatient pathway and transition pathway [abstract]. J Hosp Med. 2013;8 Suppl 1:709.
- Schmitt S, McQuillen DP, Nahass R, et al. Infectious diseases specialty intervention is associated with decreased mortality and lower healthcare costs [published online ahead of print September 25, 2013]. Clin Infect Dis.
- Torio CM, Andrews RM. National inpatient hospital costs: the most expensive conditions by payer, 2011. Healthcare Cost and Utilization Project Statistical Brief #160. Available at: http://www.hcup-us.ahrq.gov/reports/statbriefs/sb160.jsp. Accessed October 26, 2013.
- Herman B. Top 20 most expensive inpatient conditions. Becker’s Hospital Review. Oct. 9, 2013. Available at: http://www.beckershospitalreview.com/racs-/-icd-9-/-icd-10/top-20-most-expensive-inpatient-conditions.html. Accessed October 26, 2013.
Hospitalist Physician Assistants Can Apply for Hospital Medicine Credentials in 2014
The National Commission on Certification of Physician Assistants (NCCPA), the organization responsible for credentialing PAs, recently announced an opportunity for certified physician assistants (PA-C) to obtain a Certificate of Added Qualifications (CAQ) in Hospital Medicine. An examination for this voluntary credential will be given for the first time in September 2014.
In the meantime, eligible PAs can register for the process and start gathering the prerequisites, which include 3,000 hours of work in hospital medicine, 150 credits of HM-relevant continuing medical education, and a supervising physician’s sign-off on their ability to perform 10 procedures and patient care requirements derived from SHM’s core competencies (http://www.hospitalmedicine.org/Content/NavigationMenu/Education/CoreCurriculum/Core_Competencies.htm).
–Zachary Hartsell, PA-C
NCCPA, which estimates that 3,000 PAs currently work in hospital medicine, certifies PAs in general medical knowledge and experience and has implemented five specialized CAQs.
Zachary Hartsell, PA-C, who has 12 years of experience and directs PA services at Wake Forest Baptist Medical Center in Winston-Salem, N.C., is one of the question writers for the upcoming CAQ-HM exam. “I also look forward to taking the exam,” he says. “As a hospitalist PA, this is one way to show my hospital-based skills and expertise.”
Hartsell expects the qualification to become an important consideration in hiring PAs for jobs in hospital settings.
“As an administrator, it represents to me that this person has specific skills,” he says. But he emphasizes that the new voluntary qualification should not be viewed as locking PAs into a single setting or specialization. “Our certifying exam as PAs is based on general medicine, and PAs have to keep up general medicine skills to pass that exam every six years,” he notes.
For information about the HM CAQ, visit www.nccpa.net/HospitalMedicine.
Larry Beresford is a freelance writer in San Francisco, Calif.
References
- Chang W, Maynard G, Clay B. Implementation of a computerized COPD inpatient pathway and transition pathway [abstract]. J Hosp Med. 2013;8 Suppl 1:709.
- Schmitt S, McQuillen DP, Nahass R, et al. Infectious diseases specialty intervention is associated with decreased mortality and lower healthcare costs [published online ahead of print September 25, 2013]. Clin Infect Dis.
- Torio CM, Andrews RM. National inpatient hospital costs: the most expensive conditions by payer, 2011. Healthcare Cost and Utilization Project Statistical Brief #160. Available at: http://www.hcup-us.ahrq.gov/reports/statbriefs/sb160.jsp. Accessed October 26, 2013.
- Herman B. Top 20 most expensive inpatient conditions. Becker’s Hospital Review. Oct. 9, 2013. Available at: http://www.beckershospitalreview.com/racs-/-icd-9-/-icd-10/top-20-most-expensive-inpatient-conditions.html. Accessed October 26, 2013.
When Should Antiplatelet Agents and Anticoagulants Be Restarted after Gastrointestinal Bleed?

Source: Adapted from Douketis JD, Spyropoulos AC, Spencer FA, et al. Perioperative management of antithrombotic therapy: Antithrombotic Therapy and Prevention of Thrombosis, 9th ed: American College of Chest Physicians Evidence-Based Clinical Practice Guidelines. Chest. 2012;141(2 Suppl):e326S-350S.
Two Cases
A 76-year-old female with a history of hypertension, diabetes, atrial fibrillation, and diverticulosis is admitted with acute onset of dizziness and several episodes of bright red blood per rectum. Her labs show a new anemia at hemoglobin level 6.9 g/dL and an international normalized ratio (INR) of 2.7. She is transfused several units of packed red blood cells and fresh frozen plasma without further bleeding. She undergoes an esophagogastroduodenoscopy (EGD) and colonoscopy, which are notable only for extensive diverticulosis. In preparing the discharge medication reconciliation, you are uncertain what to do with the patient’s anticoagulation.
An 85-year-old male with coronary artery disease status post-percutaneous coronary intervention, with placement of a drug-eluting stent several years prior, is admitted with multiple weeks of epigastric discomfort and acute onset of hematemesis. His laboratory tests are notable for a new anemia at hemoglobin level 6.5 g/dL. Urgent EGD demonstrates a bleeding ulcer, which is cauterized. He is started on a proton-pump inhibitor (PPI). He inquires as to when he can restart his home medications, including aspirin.
Overview
Gastrointestinal (GI) bleeding is a serious complication of anticoagulant and antiplatelet therapy. Risks for GI bleeding include older age, history of peptic ulcer disease, NSAID or steroid use, and the use of antiplatelet or anticoagulation therapy. The estimated incidence of GI bleeding in the general population is 48 to 160 cases (upper GI) and 21 cases (lower GI) per 1,000 adults per year, with a case-mortality rate between 5% and 14%.1
Although there is consensus on ceasing anticoagulant and antiplatelet agents during an acute GI bleed, debate remains over the appropriate approach to restarting these agents.
Anticoagulant Resumption
A recent study published in Archives of Internal Medicine supports a quick resumption of anticoagulation following a GI bleed.2 Although previous studies on restarting anticoagulants were small and demonstrated mixed results, this retrospective cohort study examined more than 442 warfarin-associated GI bleeds. After adjusting for various clinical indicators (e.g. clinical seriousness of bleeding, requirement of transfusions), the investigators found that the decision not to resume warfarin within 90 days of an initial GI hemorrhage was associated with an increased risk of thrombosis and death. Of note, in those patients restarted on warfarin, the mean time to medication initiation was four days following the initial GI bleed. In those not restarted on warfarin, the earliest incidence of thrombosis was documented at eight days following cessation of anticoagulation.2
Though its clinical implications are limited by the retrospective design, this study is helpful in guiding management decisions. Randomized control trials and society recommendations on this topic are lacking, so the decision to resume anticoagulants rests on patient-specific estimates of the risk of recurrent bleeding and the benefits of resuming anticoagulants.
In identifying those patients most likely to benefit from restarting anticoagulation, the risk of thromboembolism should be determined using an established risk stratification framework, such as Antithrombotic Therapy and Prevention of Thrombosis, 9th edition (see Table 1).3 According to the guidelines, patients at highest risk of thromboembolism (in the absence of anticoagulation) are those with:
- mitral valve prostheses;
- atrial fibrillation with a CHADS2 score of five to six or cerebrovascular accidents (CVA) within the last three months; and/or
- venous thromboembolism (VTE) within the last three months or history of severe thrombophilia.
Patients at the lowest risk of thromboembolism are those with:
- mechanical aortic prostheses with no other stroke risk factors;
- atrial fibrillation with a CHADS2 score of zero to two; and/or
- a single VTE that occurred >12 months prior.
There are several approaches to identifying patients at greatest risk for bleeding. Location-specific modeling for upper GI bleeds (e.g. Rockall score) and lower GI bleeds (e.g. BLEED score) focus on the clinical presentation and/or endoscopic findings. General hemorrhage risk scores (e.g. HAS-BLED, ATRIA) focus on medical comorbidities. While easy to use, the predictive value of such scores as part of anticoagulation resumption after a GI hemorrhage remains uncertain.
Based on the above methods of risk stratification, patients at higher risk of thromboembolism and lower risk of bleeding will likely benefit from waiting only a short time interval before restarting anticoagulation. Based on the trial conducted by Witt and colleagues, anticoagulation typically can be reinitiated within four days of obtaining hemostatic and hemodynamic stability.2 Conversely, those at highest risk of bleeding and lower risk of thromboembolism will benefit from a delayed resumption of anticoagulation. Involvement of a specialist, such as a gastroenterologist, could help further clarify the risk of rebleeding.
The ideal approach for patients with a high risk of both bleeding and thromboembolism remains uncertain. Such cases highlight the need for an informed discussion with the patient and any involved caregivers, as well as involvement of inpatient subspecialists and outpatient longitudinal providers.
There remains a lack of evidence on the best method to restart anticoagulation. Based on small and retrospective trials, we recommend restarting warfarin at the patient’s previous home dose. The duration of inpatient monitoring following warfarin initiation should be individualized, but warfarin is not expected to impair coagulation for four to six days after initiation.
Little data is available with respect to the role of novel oral anticoagulants after a GI bleed. Given the lack of reversing agents for these drugs, we recommend exercising caution in populations with a high risk of rebleeding. Theoretically, given that these agents reach peak effect faster than warfarin, waiting an additional four days after the time frame recommended for starting warfarin is a prudent resumption strategy for novel oral anticoagulants.
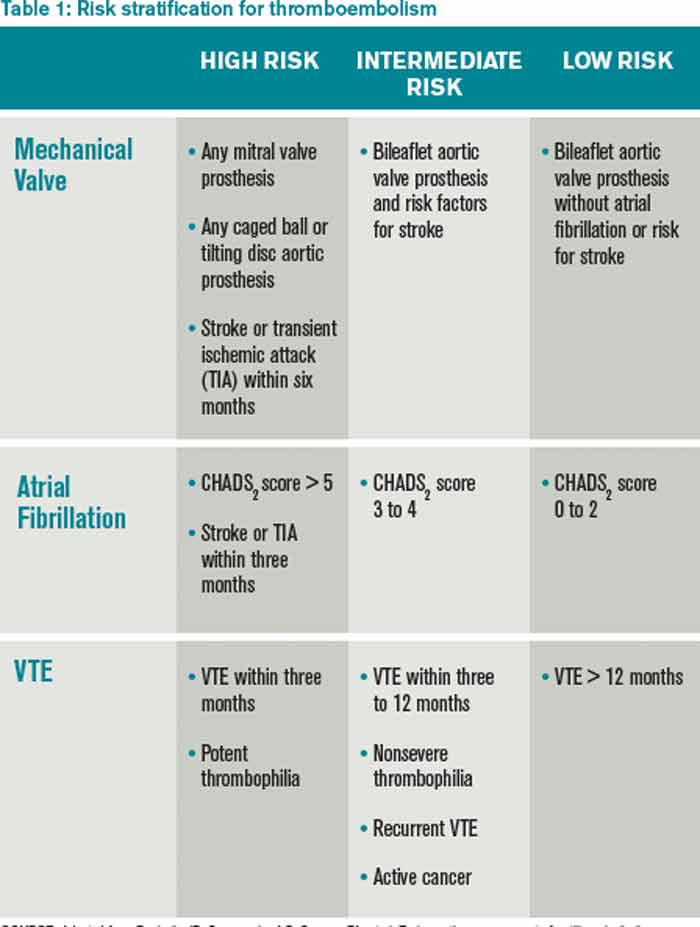
Source: Adapted from Douketis JD, Spyropoulos AC, Spencer FA, et al. Perioperative management of antithrombotic therapy: Antithrombotic Therapy and Prevention of Thrombosis, 9th ed: American College of Chest Physicians Evidence-Based Clinical Practice Guidelines. Chest. 2012;141(2 Suppl):e326S-350S.
Resumption of Antiplatelet Agents
The decision to resume antiplatelet therapy should also be highly individualized. In addition to weighing the risk of bleeding (as described in the previous section), the physician must also estimate the benefits of antiplatelet therapy in decreasing the risk of cardiovascular events.
In low-risk patients on antiplatelet therapy (i.e., for primary cardiovascular prevention) reinitiation after a bleeding episode can be reasonably delayed, because the risk of rebleeding likely outweighs the potential benefit of restarting therapy.
For patients who are at intermediate risk (i.e., those on antiplatelet agents for secondary prevention of cardiovascular disease), emerging evidence argues for early reinstitution after a GI bleed. In a trial published in Annals of Internal Medicine, Sung and colleagues randomized 156 patients to aspirin or placebo therapy immediately following endoscopically obtained hemostasis for peptic ulcer bleeding.4 All patients received PPIs. There was no significant difference in bleeding rates between the two groups, but delayed resumption of aspirin was associated with a significant increase in all-cause mortality.
Two recent meta-analyses provide further insight into the risks of withholding aspirin therapy. The first, which included 50,279 patients on aspirin for secondary prevention, found that aspirin non-adherence or withdrawal after a GI bleed was associated with a three-fold higher risk of major adverse cardiac events.5 Cardiac event rates were highest in the subgroup of patients with a history of prior percutaneous coronary stenting.
A second meta-analysis evaluated patients who had aspirin held perioperatively. In a population of patients on aspirin for secondary prevention, the mean time after withholding aspirin was 8.5 days to coronary events, 14.3 days to cerebrovascular events, and 25.8 days to peripheral arterial events.6 Events occurred as early as five days after withdrawal of aspirin.
Patients with recent intracoronary stenting are at highest risk of thrombosis. In patients with a bare metal stent placed within six weeks, or a drug-eluting stent placed within six months, every effort should be made to minimize interruptions of dual antiplatelet therapy.
Based on the data presented above, for patients at intermediate and/or high risk of adverse cardiac events, we recommend reinstitution of aspirin as soon as possible following a GI hemorrhage, preferably within five days. PPI co-therapy is a mainstay for secondary prevention of upper GI bleeding in patients on antiplatelet therapy. Current research and guidelines have not addressed specifically the role of withholding and reinitiating aspirin in lower GI bleeding, non-peptic ulcer, or upper-GI bleeding, however, a similar strategy is likely appropriate. As with the decision for restarting anticoagulants, discussion with relevant specialists is essential to best define the risk of re-bleeding.
Back to the Cases
Given her CHADS2 score of three, the patient with a diverticular bleed has a 9.6% annual risk of stroke if she does not resume anticoagulation. Using the HAS-BLED and ATRIA scores, this patient has 2.6% to 5.8% annual risk of hemorrhage. We recommend resuming warfarin anticoagulation therapy within four days of achieving hemostasis.
For the patient with coronary artery disease with remote drug-eluting stent placement and upper GI bleed, evidence supports early resumption of appropriate antiplatelet therapy following endoscopic therapy and hemostasis. We recommend resuming aspirin during the current hospitalization and concomitant treatment with a PPI indefinitely.
Bottom Line
Following a GI bleed, the risks and benefits of restarting anticoagulant and antiplatelet agents need to be carefully considered. In patients on oral anticoagulants at high risk for thromboembolism and low risk for rebleeding, consider restarting anticoagulation within four to five days. Patients on antiplatelet agents for secondary prevention should have the medication restarted during hospitalization after endoscopically obtained hemostasis of a peptic ulcer.
In all cases, hospitalists should engage the patient, gastroenterologist, and outpatient provider to best determine when resumption of anticoagulant and/or antiplatelet agents should occur.
Dr. Allen-Dicker is a hospitalist and clinical instructor at Mount Sinai Medical Center in New York City. Dr. Briones is director of perioperative services in the division of hospital medicine and an assistant professor; Dr. Berman is a hospitalist and a clinical instructor, and Dr. Dunn is a professor of medicine and chief of the division of hospital medicine, all at Mount Sinai Medical Center.
References
- Barkun AN, Bardou M, Kuipers EJ, et al. International consensus recommendations on the management of patients with nonvariceal upper gastrointestinal bleeding. Ann Intern Med. 2010;152(2):101-113.
- Witt DM, Delate T, Garcia DA, et al. Risk of thromboembolism, recurrent hemorrhage, and death after warfarin therapy interruption for gastrointestinal tract bleeding. Arch Intern Med. 2012;172(19):1484-1491.
- Douketis JD, Spyropoulos AC, Spencer FA, et al. Perioperative management of antithrombotic therapy: Antithrombotic Therapy and Prevention of Thrombosis, 9th ed: American College of Chest Physicians Evidence-Based Clinical Practice Guidelines. Chest. 2012;141(2 Suppl):e326S-350S.
- Sung JJ, Lau JY, Ching JY, et al. Continuation of low-dose aspirin therapy in peptic ulcer bleeding: A randomized trial. Ann Intern Med. 2010;152(1):1-9.
- Biondi-Zoccai GG, Lotrionte M, Agostoni P, et al. A systematic review and meta-analysis on the hazards of discontinuing or not adhering to aspirin among 50,279 patients at risk for coronary artery disease. Eur Heart J. 2006;27(22):2667-2674.
- Burger W, Chemnitius JM, Kneissl GD, Rücker G. Low-dose aspirin for secondary cardiovascular prevention – cardiovascular risks after its perioperative withdrawal versus bleeding risks with its continuation – review and meta-analysis. J Intern Med. 2005;257(5):399-414.
Source: Adapted from Douketis JD, Spyropoulos AC, Spencer FA, et al. Perioperative management of antithrombotic therapy: Antithrombotic Therapy and Prevention of Thrombosis, 9th ed: American College of Chest Physicians Evidence-Based Clinical Practice Guidelines. Chest. 2012;141(2 Suppl):e326S-350S.
Two Cases
A 76-year-old female with a history of hypertension, diabetes, atrial fibrillation, and diverticulosis is admitted with acute onset of dizziness and several episodes of bright red blood per rectum. Her labs show a new anemia at hemoglobin level 6.9 g/dL and an international normalized ratio (INR) of 2.7. She is transfused several units of packed red blood cells and fresh frozen plasma without further bleeding. She undergoes an esophagogastroduodenoscopy (EGD) and colonoscopy, which are notable only for extensive diverticulosis. In preparing the discharge medication reconciliation, you are uncertain what to do with the patient’s anticoagulation.
An 85-year-old male with coronary artery disease status post-percutaneous coronary intervention, with placement of a drug-eluting stent several years prior, is admitted with multiple weeks of epigastric discomfort and acute onset of hematemesis. His laboratory tests are notable for a new anemia at hemoglobin level 6.5 g/dL. Urgent EGD demonstrates a bleeding ulcer, which is cauterized. He is started on a proton-pump inhibitor (PPI). He inquires as to when he can restart his home medications, including aspirin.
Overview
Gastrointestinal (GI) bleeding is a serious complication of anticoagulant and antiplatelet therapy. Risks for GI bleeding include older age, history of peptic ulcer disease, NSAID or steroid use, and the use of antiplatelet or anticoagulation therapy. The estimated incidence of GI bleeding in the general population is 48 to 160 cases (upper GI) and 21 cases (lower GI) per 1,000 adults per year, with a case-mortality rate between 5% and 14%.1
Although there is consensus on ceasing anticoagulant and antiplatelet agents during an acute GI bleed, debate remains over the appropriate approach to restarting these agents.
Anticoagulant Resumption
A recent study published in Archives of Internal Medicine supports a quick resumption of anticoagulation following a GI bleed.2 Although previous studies on restarting anticoagulants were small and demonstrated mixed results, this retrospective cohort study examined more than 442 warfarin-associated GI bleeds. After adjusting for various clinical indicators (e.g. clinical seriousness of bleeding, requirement of transfusions), the investigators found that the decision not to resume warfarin within 90 days of an initial GI hemorrhage was associated with an increased risk of thrombosis and death. Of note, in those patients restarted on warfarin, the mean time to medication initiation was four days following the initial GI bleed. In those not restarted on warfarin, the earliest incidence of thrombosis was documented at eight days following cessation of anticoagulation.2
Though its clinical implications are limited by the retrospective design, this study is helpful in guiding management decisions. Randomized control trials and society recommendations on this topic are lacking, so the decision to resume anticoagulants rests on patient-specific estimates of the risk of recurrent bleeding and the benefits of resuming anticoagulants.
In identifying those patients most likely to benefit from restarting anticoagulation, the risk of thromboembolism should be determined using an established risk stratification framework, such as Antithrombotic Therapy and Prevention of Thrombosis, 9th edition (see Table 1).3 According to the guidelines, patients at highest risk of thromboembolism (in the absence of anticoagulation) are those with:
- mitral valve prostheses;
- atrial fibrillation with a CHADS2 score of five to six or cerebrovascular accidents (CVA) within the last three months; and/or
- venous thromboembolism (VTE) within the last three months or history of severe thrombophilia.
Patients at the lowest risk of thromboembolism are those with:
- mechanical aortic prostheses with no other stroke risk factors;
- atrial fibrillation with a CHADS2 score of zero to two; and/or
- a single VTE that occurred >12 months prior.
There are several approaches to identifying patients at greatest risk for bleeding. Location-specific modeling for upper GI bleeds (e.g. Rockall score) and lower GI bleeds (e.g. BLEED score) focus on the clinical presentation and/or endoscopic findings. General hemorrhage risk scores (e.g. HAS-BLED, ATRIA) focus on medical comorbidities. While easy to use, the predictive value of such scores as part of anticoagulation resumption after a GI hemorrhage remains uncertain.
Based on the above methods of risk stratification, patients at higher risk of thromboembolism and lower risk of bleeding will likely benefit from waiting only a short time interval before restarting anticoagulation. Based on the trial conducted by Witt and colleagues, anticoagulation typically can be reinitiated within four days of obtaining hemostatic and hemodynamic stability.2 Conversely, those at highest risk of bleeding and lower risk of thromboembolism will benefit from a delayed resumption of anticoagulation. Involvement of a specialist, such as a gastroenterologist, could help further clarify the risk of rebleeding.
The ideal approach for patients with a high risk of both bleeding and thromboembolism remains uncertain. Such cases highlight the need for an informed discussion with the patient and any involved caregivers, as well as involvement of inpatient subspecialists and outpatient longitudinal providers.
There remains a lack of evidence on the best method to restart anticoagulation. Based on small and retrospective trials, we recommend restarting warfarin at the patient’s previous home dose. The duration of inpatient monitoring following warfarin initiation should be individualized, but warfarin is not expected to impair coagulation for four to six days after initiation.
Little data is available with respect to the role of novel oral anticoagulants after a GI bleed. Given the lack of reversing agents for these drugs, we recommend exercising caution in populations with a high risk of rebleeding. Theoretically, given that these agents reach peak effect faster than warfarin, waiting an additional four days after the time frame recommended for starting warfarin is a prudent resumption strategy for novel oral anticoagulants.
Source: Adapted from Douketis JD, Spyropoulos AC, Spencer FA, et al. Perioperative management of antithrombotic therapy: Antithrombotic Therapy and Prevention of Thrombosis, 9th ed: American College of Chest Physicians Evidence-Based Clinical Practice Guidelines. Chest. 2012;141(2 Suppl):e326S-350S.
Resumption of Antiplatelet Agents
The decision to resume antiplatelet therapy should also be highly individualized. In addition to weighing the risk of bleeding (as described in the previous section), the physician must also estimate the benefits of antiplatelet therapy in decreasing the risk of cardiovascular events.
In low-risk patients on antiplatelet therapy (i.e., for primary cardiovascular prevention) reinitiation after a bleeding episode can be reasonably delayed, because the risk of rebleeding likely outweighs the potential benefit of restarting therapy.
For patients who are at intermediate risk (i.e., those on antiplatelet agents for secondary prevention of cardiovascular disease), emerging evidence argues for early reinstitution after a GI bleed. In a trial published in Annals of Internal Medicine, Sung and colleagues randomized 156 patients to aspirin or placebo therapy immediately following endoscopically obtained hemostasis for peptic ulcer bleeding.4 All patients received PPIs. There was no significant difference in bleeding rates between the two groups, but delayed resumption of aspirin was associated with a significant increase in all-cause mortality.
Two recent meta-analyses provide further insight into the risks of withholding aspirin therapy. The first, which included 50,279 patients on aspirin for secondary prevention, found that aspirin non-adherence or withdrawal after a GI bleed was associated with a three-fold higher risk of major adverse cardiac events.5 Cardiac event rates were highest in the subgroup of patients with a history of prior percutaneous coronary stenting.
A second meta-analysis evaluated patients who had aspirin held perioperatively. In a population of patients on aspirin for secondary prevention, the mean time after withholding aspirin was 8.5 days to coronary events, 14.3 days to cerebrovascular events, and 25.8 days to peripheral arterial events.6 Events occurred as early as five days after withdrawal of aspirin.
Patients with recent intracoronary stenting are at highest risk of thrombosis. In patients with a bare metal stent placed within six weeks, or a drug-eluting stent placed within six months, every effort should be made to minimize interruptions of dual antiplatelet therapy.
Based on the data presented above, for patients at intermediate and/or high risk of adverse cardiac events, we recommend reinstitution of aspirin as soon as possible following a GI hemorrhage, preferably within five days. PPI co-therapy is a mainstay for secondary prevention of upper GI bleeding in patients on antiplatelet therapy. Current research and guidelines have not addressed specifically the role of withholding and reinitiating aspirin in lower GI bleeding, non-peptic ulcer, or upper-GI bleeding, however, a similar strategy is likely appropriate. As with the decision for restarting anticoagulants, discussion with relevant specialists is essential to best define the risk of re-bleeding.
Back to the Cases
Given her CHADS2 score of three, the patient with a diverticular bleed has a 9.6% annual risk of stroke if she does not resume anticoagulation. Using the HAS-BLED and ATRIA scores, this patient has 2.6% to 5.8% annual risk of hemorrhage. We recommend resuming warfarin anticoagulation therapy within four days of achieving hemostasis.
For the patient with coronary artery disease with remote drug-eluting stent placement and upper GI bleed, evidence supports early resumption of appropriate antiplatelet therapy following endoscopic therapy and hemostasis. We recommend resuming aspirin during the current hospitalization and concomitant treatment with a PPI indefinitely.
Bottom Line
Following a GI bleed, the risks and benefits of restarting anticoagulant and antiplatelet agents need to be carefully considered. In patients on oral anticoagulants at high risk for thromboembolism and low risk for rebleeding, consider restarting anticoagulation within four to five days. Patients on antiplatelet agents for secondary prevention should have the medication restarted during hospitalization after endoscopically obtained hemostasis of a peptic ulcer.
In all cases, hospitalists should engage the patient, gastroenterologist, and outpatient provider to best determine when resumption of anticoagulant and/or antiplatelet agents should occur.
Dr. Allen-Dicker is a hospitalist and clinical instructor at Mount Sinai Medical Center in New York City. Dr. Briones is director of perioperative services in the division of hospital medicine and an assistant professor; Dr. Berman is a hospitalist and a clinical instructor, and Dr. Dunn is a professor of medicine and chief of the division of hospital medicine, all at Mount Sinai Medical Center.
References
- Barkun AN, Bardou M, Kuipers EJ, et al. International consensus recommendations on the management of patients with nonvariceal upper gastrointestinal bleeding. Ann Intern Med. 2010;152(2):101-113.
- Witt DM, Delate T, Garcia DA, et al. Risk of thromboembolism, recurrent hemorrhage, and death after warfarin therapy interruption for gastrointestinal tract bleeding. Arch Intern Med. 2012;172(19):1484-1491.
- Douketis JD, Spyropoulos AC, Spencer FA, et al. Perioperative management of antithrombotic therapy: Antithrombotic Therapy and Prevention of Thrombosis, 9th ed: American College of Chest Physicians Evidence-Based Clinical Practice Guidelines. Chest. 2012;141(2 Suppl):e326S-350S.
- Sung JJ, Lau JY, Ching JY, et al. Continuation of low-dose aspirin therapy in peptic ulcer bleeding: A randomized trial. Ann Intern Med. 2010;152(1):1-9.
- Biondi-Zoccai GG, Lotrionte M, Agostoni P, et al. A systematic review and meta-analysis on the hazards of discontinuing or not adhering to aspirin among 50,279 patients at risk for coronary artery disease. Eur Heart J. 2006;27(22):2667-2674.
- Burger W, Chemnitius JM, Kneissl GD, Rücker G. Low-dose aspirin for secondary cardiovascular prevention – cardiovascular risks after its perioperative withdrawal versus bleeding risks with its continuation – review and meta-analysis. J Intern Med. 2005;257(5):399-414.
Oseltamivir for Healthy Pediatric Inpatients with Influenza Unlikely to Yield Measurable Benefit

Clinical question: What is the benefit of oseltamivir treatment to previously healthy children hospitalized with confirmed influenza infection?
Background: Influenza is generally a mild, self-limited infection that affects all ages but can lead to more serious illness. During the 2012-2013 season, laboratory-confirmed influenza in children zero to four years was associated with a hospitalization rate of 66.4 per 100,000 and 164 pediatric deaths. Currently, the American Academy of Pediatrics and the CDC recommend treatment with either oseltamivir or zanamivir for children hospitalized with influenza. However, despite the recommendations, data are limited regarding the benefits resulting from treating otherwise healthy children hospitalized with influenza.
Study design: Multi-center retrospective study.
Setting: Ten public hospitals in Madrid, Spain, between September 2010 and June 2012.
Synopsis: Researchers identified children ≤14 years admitted to participating hospitals by positive testing with either rapid diagnostic testing or polymerase chain reaction assay of nasal washings. Patients at high risk of serious disease were excluded, including those with chronic disease, immunodeficiency, prematurity (less than 32 weeks gestation), age less than six months at admission, nosocomial infection, and those requiring ICU-level care upon admission. Patients with asthma were included. Decision to treat with oseltamivir was determined by hospital guidelines, with some hospitals treating all hospitalized children with confirmed influenza and others only treating patients with risk factors for severe disease. In addition, only children who had manifested symptoms within 48 hours of admission were included.
Of the 287 children included in the final analysis, 93 were treated with oseltamivir (32%). There were no significant differences between treatment and non-treatment groups in duration of fever, duration of hypoxia, length of stay, or rates of ICU transfer. In addition, the lack of differences in outcomes persisted after subgroup analysis of patients less than one year old.
Bottom line: Treatment with oseltamivir of otherwise healthy children hospitalized with influenza not requiring ICU care is unlikely to yield measurable benefit.
Citation: Bueno M, Calvo C, Mendez-Echevarría A, et al. Oseltamivir treatment for influenza in hospitalized children without underlying diseases. Pediatr Infect Dis J. 2013;32(10):1066-1069.
Reviewed by Pediatric Editor Weijen Chang, MD, SFHM, FAAP, associate clinical professor of medicine and pediatrics at the University of California at San Diego School of Medicine, and a hospitalist at both UCSD Medical Center and Rady Children’s Hospital.
Reviews of Research on Haloperidol and ICU Delirium, Proton Pump Inhibitors, Thrombolytics and Stroke

In This Edition
Literature At A Glance
A guide to this month’s studies
- Intravenous haloperidol does not prevent ICU delirium
- Predicting delirium risk in hospitalized adults
- Oral PPIs as effective as IV PPIs in peptic ulcer bleeding
- Probiotic benefit questioned in the elderly
- Colchicine and NSAID better than NSAID alone for acute pericarditis
- Improvement needed in patient understanding at hospital discharge
- Effectiveness of a multihospital effort to reduce rehospitalization
- Hospitals profit from preventing surgical site infections
- Prothrombin complex concentrate safer than fresh frozen plasma in rapidly reversing INR
- Hospital-acquired anemia associated with higher mortality, increased LOS
- Thrombolytics and stroke: the faster the better
Intravenous Haloperidol Does Not Prevent ICU Delirium
Clinical question: Can haloperidol reduce delirium in critically ill patients if initiated early in ICU stay?
Background: Prior studies suggest antipsychotics reduce intensity and duration of delirium in hospitalized patients. Evidence is mixed for preventing delirium. A trial of risperidone demonstrated delirium rate reduction in coronary artery bypass grafting (CABG) patients, but another trial of haloperidol in hip surgery patients failed to prevent onset of delirium. There is little evidence on antipsychotics in ICU delirium.
Study design: Randomized, double-blinded, placebo-controlled trial.
Setting: Single, adult ICU in England.
Synopsis: The study randomized 142 critically ill patients to receive 2.5 mg of intravenous haloperidol versus placebo every eight hours for up to 14 days. There was no significant difference between groups in the total time spent free of delirium or coma. Limitations include the use of open-label haloperidol in 21% of the placebo group patients. More sedation but less agitation was seen with the use of haloperidol, which also prolonged QTc. No severe adverse effects were observed.
This study supports the idea that scheduled antipsychotics should not be used to reduce ICU delirium. Addressing modifiable risk factors and using dexmedetomidine rather than lorazepam for sedation in the ICU continue to be first-line strategies to lower delirium rates.
Bottom line: Prophylactic haloperidol should not be used to prevent ICU delirium.
Citation: Page VJ, Ely EW, Gates S, et al. Effect of intravenous haloperidol on the duration of delirium and coma in critically ill patients (Hope-ICU): a randomized, double-blind, placebo-controlled trial. Lancet Respir Med. 2013;1(7):515-523.
Predicting Delirium Risk in Hospitalized Adults
Clinical question: Can a simple tool be developed and used for predicting delirium in hospitalized adults?
Background: Delirium is a common condition that results in higher mortality, longer length of stays, and higher probability of discharge to nursing home. Current delirium prediction tools are complicated, or restricted to surgical or critically ill patients.
Study design: Prospective cohort study, with separate derivation and validation cohorts.
Setting: Two academic hospitals and a VA hospital in San Francisco.
Synopsis: Investigators enrolled 374 hospitalized patients who were more than 50 years of age and not delirious at time of admission (209 patients in the derivation and 165 in the validation). The authors identified four predictors of delirium: Age >80; failure to spell “World” backwards; disOrientation to place; and higher nurse-rated iLlness severity (AWOL). The authors found that rates of delirium increased with increasing number of predictors (with zero predictors, 2% developed delirium; one predictor, 4%; two predictors, 14%; three predictors, 20%; four predictors, 64%).
These predictors are similar to other previously identified risk factors, as well as to prediction tools that are in use for surgical patients. However, this tool is quick and can be completed by nursing staff, so it may have a role to play in helping triage patients to units more specialized in preventing delirium.
Bottom line: The AWOL prediction tool is simple to use, broadly applicable, and adds another tool to the literature to determine delirium risk.
Citation: Douglas VC, Hessler CS, Dhaliwal G, et al. The AWOL tool: derivation and validation of a delirium prediction rule. J Hosp Med. 2013;8(9);493-499.
Oral Proton Pump Inhibitors (PPIs) as Effective as IV PPIs in Peptic Ulcer Bleeding
Clinical question: In patients with peptic ulcer bleeding, are oral PPIs of equal benefit to intravenous PPIs?
Background: PPI therapy has been shown in several studies to reduce re-bleeding risk in patients when used adjunctively for peptic ulcer bleeding. In spite of this data, there is still uncertainty about the optimal dose and route of administration.
Study design: Meta-analysis of prospective, randomized control trials.
Setting: OVID database search in June 2012.
Synopsis: A literature search identified six prospective, randomized control trials. Overall, 615 patients were included across the six trials. No significant difference in risk of re-bleeding was discovered between the two groups (8.6% oral vs. 9.3% IV, RR: 0.92, 95% CI: 0.56-1.5). Length of hospital stay was statistically significantly lower for oral PPIs (-0.74 day, 95% CI: -1.10 to -0.39 day).
Because these findings are based on a meta-analysis of studies with notable flaws—including lack of blinding—it is difficult to draw any definitive conclusions from this data. Hospitalists should use care before changing their practice patterns, given the risk of bias and need for further study.
Bottom line: Oral PPIs may reduce hospital length of stay without an increased risk of re-bleeding; however, further study with a well-powered, double-blind, randomized control trial is necessary.
Citation: Tsoi KK, Hirai HW, Sung JJ. Meta-analysis: comparison of oral vs. intravenous proton pump inhibitors in patients with peptic ulcer bleeding. Aliment Pharmacol Ther. 2013;38(7):721-728.
Probiotic Benefit Questioned in the Elderly
Clinical question: Do probiotics prevent antibiotic-associated diarrhea (AAD) in patients 65 and older?
Background: Individual studies using different protocols to assess the efficacy of probiotics in preventing AAD, including Clostridium difficile-associated diarrhea (CDAD), suggest a decreased incidence of AAD when taking probiotics. Meta-analysis of this data also suggests that probiotics are effective in prevention of AAD; however, these results are undermined by the high heterogeneity of the studies included.
Study Design: Randomized, double-blind, placebo-controlled trial.
Setting: Multicenter trial in the United Kingdom.
Synopsis: Nearly 3,000 patients ages 65 years and older who had received one or more antibiotics within seven days were randomized to receive placebo or high-dose probiotics for 21 days. After recruitment, the patients were assessed for AAD up to eight weeks and CDAD up to 12 weeks. Results did not demonstrate a reduction of AAD or CDAD in patients taking probiotics. AAD occurred in 10.8% of patients taking the probiotic and 10.4% of patients taking placebo (95% confidence interval 0.83-1.32). CDAD occurred in 0.8% of patients taking the probiotic and 1.2% of patients taking placebo (95% confidence interval 0.34-1.47).
Based on the results of this double-blind, placebo-controlled trial, there is insufficient evidence to support initiation of probiotics for the prevention of AAD and CDAD in patients 65 years and older. Future studies utilizing standardized protocols against specific antibiotics, along with improved understanding of the underlying mechanisms of AAD prevention, are needed.
Bottom line: High-dose probiotics (lactobacillus acidophilus and bifidobacterium bifidum) do not prevent AAD in elderly patients.
Citation: Allen S, Wareham K, Wang D, et al. Lactobacilli and bifidobacteria in the prevention of antibiotic-associated diarrhoea and Clostridium difficile diarrhoea in older inpatients (PLACIDE): a randomised, double-blind, placebo-controlled, multicentre trial. Lancet. 2013;382(9900):1249-1257.
Colchicine and NSAID Better than NSAID Alone for Acute Pericarditis
Clinical question: Is colchicine safe, effective, and able to prevent recurrence in acute pericarditis?
Background: Colchicine is effective for the treatment of recurrent pericarditis. More recent open-label trials have established its role in acute pericarditis when combined with conventional NSAID therapy. However, a definitive randomized control trial has not been performed to establish colchicine’s role in acute pericarditis.
Study design: Double-blinded, randomized, controlled trial.
Setting: Multicenter in Northern Italy.
Synopsis: Investigators randomized 240 patients to receive either colchicine or placebo in addition to standard therapy of either aspirin or ibuprofen. Incessant or recurrent pericarditis occurred in 16.7% of patients treated with colchicine versus 37.5% in patients receiving placebo (RR 0.56; 95% CI 0.30-0.72; P<0.001). The number needed to treat to prevent one episode of incessant or recurrent pericarditis was four. Colchicine therapy also reduced the frequency of symptom persistence at 72 hours, number of recurrences per patient, rate of hospitalization, and the rate of readmission within one week.
It should be noted that the study excluded the following groups: patients with an elevated troponin, elevated transaminases (>1.5 upper limit of normal), and serum creatinine >2.5.
Bottom line: In addition to conventional therapy, colchicine reduces incessant or recurrent pericarditis in patients with a first episode of acute pericarditis.
Citation: Imazio M, Brucato A, Cemin R, et al. A randomized trial of colchicine for acute pericarditis. N Engl J Med. 2013;369(16):1522-1528.
Improvement Needed in Patient Understanding at Hospital Discharge
Clinical question: How well do older patients with heart failure, pneumonia, or acute coronary syndrome understand their diagnosis and post-discharge follow-up plans compared with medical record data?
Background: As hospitals across the country work on preventing 30-day readmissions, more attention has been given to assessing the quality of discharge processes; few evaluations have been conducted from a patient-centered perspective.
Study Design: Prospective, observational cohort study.
Setting: An urban, academic medical center.
Synopsis: This study evaluated the quality of the discharge process among 377 hospitalized patients >65 years old. Medical record data were compared with patient responses during a telephone interview within one week of discharge. By medical records, every patient received discharge instructions that in 97% of cases included discharge diagnosis, activity instructions, follow-up physician information, and warning signs. The authors determined that discharge diagnosis was not written in lay terms 26% of the time. By patient report, 90% expressed that they understood their discharge diagnosis, yet only around 60% fully understood their diagnosis as it was written in the medical record. Although about half of patients reported having a follow-up appointment upon discharge, only about a third of patients had a documented follow-up appointment in the medical record.
Bottom line: Multiple discrepancies were identified between medical record review and patients’ understanding of their discharge diagnosis and plans. Improvements in discharge processes (such as making follow-up appointments) and in patient education (such as increased use of layperson language) are needed.
Citation: Horwitz LI, Moriarty JP, Chen C, et al. Quality of discharge practices and patient understanding at an academic medical center [published online ahead of print August 19, 2013]. JAMA Intern Med.
Effectiveness of a Multihospital Effort to Reduce Rehospitalization
Clinical question: Does Project BOOST reduce 30-day rehospitalization for hospitals participating in a quality improvement collaborative?
Background: With the advent of penalties for hospitals with excessive 30-day readmissions among Medicare beneficiaries, hospitals nationwide are attempting to reduce 30-day readmission rates. Few interventions aimed at reducing 30-day hospital readmissions have been effective, and successful interventions have limited generalizability.
Study design: Semi-controlled, pre-post study.
Setting: Volunteer sample of acute care pilot units within a nationally representative sample of 11 academic and non-academic hospitals.
Synopsis: The 11 hospitals enrolled in this quality improvement collaborative planned and implemented Project BOOST tools over 12 months with support from an external quality improvement mentor. Each hospital tailored the BOOST tools that they implemented based on a needs assessment. Reporting of clinical outcome data was voluntary; administrative sources at each hospital provided these data. Although 30 hospitals participated in this collaborative, only 11 hospitals reported data for this analysis.
Average 30-day rehospitalization rates among BOOST units fell from pre- to post-implementation (14.7% to 12.7%, P=0.010); 30-day rehospitalization rates among control units did not change during this same time period (14.1% to 14.0%, respectively, P=0.831).
Bottom line: Although the 11 hospitals in this collaborative found reduced 30-day readmissions in association with BOOST implementation, this finding may be biased due to voluntary reporting of data and improvements at one hospital driving the overall effect of the intervention. More rigorous evaluation of Project BOOST is needed.
Citation: Hansen LO, Greewald JL, Budnitz T, et al. Project BOOST: Effectiveness of a multihospital effort to reduce rehospitalization. J Hosp Med. 2013;8(8):421-427.
Hospitals Profit from Preventing Surgical Site Infections
Clinical question: Does quality improvement, in this case preventing surgical site infections (SSIs), necessarily lead to improvement in hospital profit?
Background: It’s clear that preventing SSIs benefits patients and saves money for health insurance providers, but it’s unclear what financial impact SSIs have on hospitals and how best to calculate it. This quantification is needed for cost-benefit analyses of interventions designed to prevent SSIs.
Study design: Retrospective study.
Setting: Four Johns Hopkins-affiliated, tertiary care hospitals.
Synopsis: This retrospective study included all patients admitted to or having certain surgical procedures at four Johns Hopkins-affiliated hospitals between Jan. 1, 2007, and Dec. 31, 2010. Patients were first stratified by complexity, and then those who had a SSI (618) were compared to those without SSIs (399,627 admissions and 25,849 surgeries) for differences in daily hospital charges, length of stay, 30-day readmission rates, and hospital profit.
Although daily charges were essentially the same between the groups, patients with SSIs had almost double the mean length of stay than patients without SSIs. SSI patients also had a drastically higher 30-day readmission rate.
The authors propose equations to determine the change in hospital profit due to a single SSI and calculated that preventing one SSI led to an increase in hospital profit between $4,147 and $22,239. These numbers haven’t included the cost of a SSI prevention program, and the limitations in applying these numbers to all hospitals include widely varying hospital costs and differing ability to fill empty beds.
Bottom line: In these four tertiary care hospitals, each SSI prevented could increase hospital profit by thousands of dollars, as well as significantly decrease length of stay and 30-day readmission rates.
Citation: Shepard J, Ward W, Milstone A, et al. Financial impact of surgical site infections on hospitals: the hospital management perspective. JAMA Surg. 2013;148(10):907-914.
Prothrombin Complex Concentrate Is Safer than Fresh Frozen Plasma in Rapidly Reversing INR
Clinical question: Is prothrombin complex concentrate (PCC) safer and more effective than fresh frozen plasma (FFP) in reversing international normalized ratio (INR)?
Background: In Canada, PCC has become the standard of care over FFP for reversal of critical INR due to decreased time of administration, faster preparation, lack of allergic reactions, and small volume. Few studies compare these two products in their adverse effects, time to INR reversal, length of stay, and blood transfusion requirements.
Study design: Retrospective cohort study.
Setting: Two tertiary care EDs in Canada.
Synopsis: Health records of adult patients with an INR ≥1.8 who received FFP over a two-year period prior to PCC introduction (n=149) were compared to those who received PCC in the two years after PCC introduction (n=165). Total serious adverse events, which include mortality, myocardial infarction, and heart failure, were higher in the FFP group (19.5% versus 9.7%, P=0.0164). Heart failure exacerbations, time to reversal of INR, and units of blood transfused were increased in the FFP group. There was no difference in thromboembolic events or in length of stay.
Due to this study’s retrospective nature, there were issues with documentation of INR measurements, so true rapidity of INR reversal is unknown. In the United States, the FDA only recently approved PCC for use, so availability might be limited.
Bottom line: Prothrombin complex concentrate is an effective and fast alternative to FFP for reversal of critical INR levels.
Citation: Hickey M, Gatien M, Taljaard M, Aujnarain A, Giulivi A, Perry JJ. Outcomes of urgent warfarin reversal with frozen plasma versus prothombin complex concentrate in the emergency department. Circulation. 2013;128(4):360-364.
Hospital-Acquired Anemia Associated with Higher Mortality, Increased LOS
Clinical question: What is the prevalence of hospital-acquired anemia (HAA), and does it lead to increased mortality and resource utilization?
Background: HAA is a multifactorial care-based problem that occurs as a result of hemodilution, phlebotomy, blood loss from procedures, and impaired erythropoiesis. In the general hospital population, very little is known about HAA prevalence or whether HAA is associated with increased mortality, greater length of stay (LOS), or higher costs.
Study design: Retrospective cohort study.
Setting: Large academic health system in Ohio.
Synopsis: Using administrative data and electronic health record data, an analysis of 188,447 hospitalizations showed that HAA prevalence was 74%. Worsening HAA was correlated to an increase in mortality, so that the odds ratio of mortality with moderate anemia (Hgb between >9 and ≤11) was 1.51 (95% confidence interval 1.33-1.71, P<0.001) and severe anemia (Hgb ≤9) was 3.28 (95% confidence interval 2.90-3.72, P<0.001). Increased degree of HAA was correlated to increasing LOS (up to 1.88 extra days for patients with severe anemia) and higher hospital costs.
Because this is a retrospective observational study, no true causal relationship can be discerned from this study. However, the body of evidence linking iatrogenic causes of anemia to negative outcomes is compelling. Hospitalists should attempt to limit blood loss through judicious use of phlebotomy and procedures in their patients, so as to avoid anemia and subsequent unnecessary transfusions.
Bottom line: Hospital-acquired anemia is associated with higher mortality, LOS, and hospital costs in all hospitalized patients.
Citation: Koch CG, Li L, Sun Z, et al. Hospital-acquired anemia: prevalence, outcomes, and healthcare implications. J Hosp Med. 2013;8(9):506-512.
Thrombolytics and Stroke: The Faster the Better
Clinical question: Does time from ischemic stroke onset to treatment with intravenous thrombolysis make a difference?
Background: Previous studies have shown that “time is brain.” Quicker treatment with intravenous thrombolysis improves outcomes. Multicenter comparison of very early treatment (i.e., <90 minutes) to a later onset to treatment has not been done.
Study design: Observational study.
Setting: Patient information from 1998 to 2012 from 10 European stroke centers.
Synopsis: A total of 6,856 patients were included, of which 19% received thrombolysis in <90 minutes. None of the patients received endovascular treatment for stroke. Modified Rankin score, a functional assessment, was used to determine outcome. A score of 0 or 1, an “excellent” outcome, was seen more often in patients with a moderate severity stroke (NIH stroke scale of 7-12) who received thrombolysis in <90 minutes, but not in other groups. Thrombolysis in <90 minutes was associated with fewer intracerebral hemorrhages (ICH), but symptomatic ICH was not statistically significantly different. Mortality at three months was not different in the two time groups.
Limitations to this study included an unknown presumed cause of stroke in more than a quarter of patients. Deviations from acute stroke protocols are not described. This study adds to the body of literature supporting the early use of intravenous thrombolysis in eligible acute stroke patients.
Bottom line: Expedient treatment with intravenous thrombolysis should occur in acute stroke patients.
Citation: Strbian D, Ringleb P, Michel P, et al. Ultra-early intravenous stroke thrombolysis: do all patients benefit similarly? Stroke. 2013;44(10):2913-2916.