User login
Abrupt onset of abdominal pain
Six days after being discharged from the hospital for treatment of acute pericarditis, a 49-year-old man came to our clinic for a follow-up appointment. The patient still had midsternal chest discomfort and dyspnea. He also reported new epigastric abdominal pain, which had begun 2 days earlier. The patient’s wife indicated that he’d had a low-grade fever since discharge, but the patient denied any chills, hematemesis, melanotic stools, diarrhea, or constipation. The patient’s medical history was significant for gastroesophageal reflux, hyperlipidemia, osteoarthritis, sleep apnea, and obesity. Along with newly prescribed indomethacin for the pericarditis (50 mg tid), he was also taking simvastatin. In addition, he occasionally took ibuprofen (800 mg/d) for osteoarthritis of his knee.
WHAT IS YOUR DIAGNOSIS?
HOW WOULD YOU TREAT THIS PATIENT?
Diagnosis: Duodenal perforation caused by indomethacin
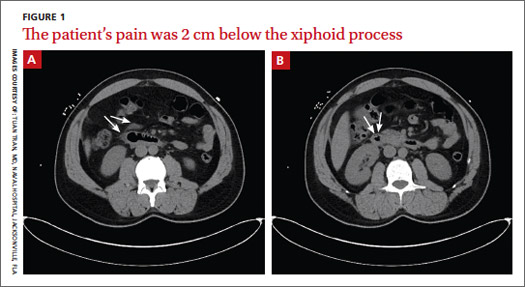
The CT scans revealed inflammation (arrows, FIGURE 1A) and thickening of the second and third portion of the duodenum and the pres- ence of extraluminal air at the site of the perforation (arrows, FIGURE 1B). There was also free fluid along the right paracolic gutter and into the pelvis. We diagnosed a small intestinal perforation in this patient, which was likely caused by a nonsteroidal anti-inflammatory drug (NSAID)-induced ulcer.
How NSAIDs affect the GI tract
NSAIDs inhibit cyclooxygenase (COX), the enzyme responsible for prostaglandin production. Specifically, the COX-1 enzyme is responsible for the production of prostaglandins in the gastrointestinal (GI) tract. Prostaglandins play an important role in protecting the GI mucosa. By inhibiting the synthesis of prostaglandins, the permeability of the GI tract is increased and the natural protective barrier of the mucosa is destroyed.1
Gastroduodenal damage is a well-known adverse effect of NSAIDs. Ulcers have been noted on upper endoscopy in regular NSAID users, and the risk of developing a symptomatic ulcer and complications increases with every year of regular NSAID use.2 Ulcers in the GI tract can be complicated by perforation.1
Patients will complain of sudden onset abdominal pain
Important clues in the patient history for a perforated GI tract include sudden onset of severe abdominal pain that may present initially as epigastric pain and progress to generalized abdominal pain that may radiate to one or both shoulders.3 Physical exam findings for a perforated GI tract may include abdominal tenderness and rigid abdomen; fever and tachycardia may also be present.3 Concern for possible abdominal perforation should be evaluated with a complete blood count, basic metabolic panel, and radiographic studies.3
The differential diagnosis of epigastric abdominal pain includes: pancreatitis, gastritis, gastric/duodenal ulcer, and obstruction. Elevated serum lipase levels or CT findings of pancreatic inflammation assist in the diagnosis of pancreatitis. Upper endoscopy is key to identifying cases of gastritis and ulcers in the GI tract. And an abdominal radiograph that shows dilated loops of bowel will confirm suspicions of obstruction.
Stabilize the patientAcute management of GI perforation begins with stabilizing the patient and determining the need for surgical intervention or medical management. Should a patient have a persistent air leak, surgery is the mainstay of treatment.3 If the perforation has healed, the patient should be medically managed.
Therapy may require placing a nasogastric tube and holding any oral intake until abdominal pain and perforation resolves. Medications in the acute treatment should include proton pump inhibitors (PPIs) and antibiotics. Antibiotics should cover for gram-negative enteric bacteria and anaerobes.
How to prevent NSAID-induced injury.
PPIs used with nonselective NSAIDs appear to reduce the likelihood of gastric ulceration.4 Similarly, H2-receptor antagonists (H2RA) also inhibit gastric acid secretion, and high doses of them significantly reduce the incidence of gastric ulcers.4 However, standard doses of HRAs have not been shown to be effective in reducing the risk of NSAID-induced gastric ulcers.4 Misoprostol, a synthetic prostaglandin E1 analogue that inhibits gastric secretion and protects the gastric mucosa is also an option; it has been used in combination with nonselective NSAIDs to counteract the increase in GI permeability.4
What about using COX-2 inhibitors instead? The COX-2 inhibitors have a lower risk of gastrointestinal tract injury.2 Gastric ulcers, GI bleeding, and complications from ulcers have been shown to be less common with COX-2 NSAIDs compared with nonselective NSAIDs.5 A review of the literature suggests that for patients with previous GI bleeding, COX-2 inhibitors are comparable to an NSAID paired with a PPI in preventing GI bleeding; pairing a COX-2 inhibitor with a PPI, however, appears to provide the greatest defense.2,4
Consider preventive steps. Patients at risk for complications are likely to benefit from the simultaneous use of prophylactic agents with NSAID therapy. Risk factors for NSAID-related GI complications include: a previous GI event; older age; simultaneous use of anticoagulants, corticosteroids, or other NSAIDs (including low-dose aspirin); high-dose NSAID therapy; and chronic debilitating disorders (especially cardiovascular disease).6
Our patient improved with medical management
Our patient was evaluated by general surgery during his hospital admission, but because he was stable—with a healing duodenal perforation—we opted to manage him medically. We started him on esomeprazole (40 mg bid) along with ciprofloxacin (500 mg bid) and metronidazole (500 mg tid) for the microperforation of the duodenum. The patient was also scheduled for an outpatient endoscopic evaluation.
1. Park SC, Chun HJ, Kang CD, et al. Prevention and management of non-steroidal anti-inflammatory drugs-induced small intestinal injury. World J Gastroenterol. 2011;17:4647-4653.
2. Ng SC, Chan F. NSAID-induced gastrointestinal and car- diovascular injury. Curr Opin Gastroenterol. 2010;26: 611-617.
3. Lawrence PF, Bell RM, TM, et al. Essentials of General Surgery. 4th ed. Baltimore, MD: Lipincott Williams & Wilkins; 2006. 4. Hooper, L, Brown TJ, Elliott R, et al. The effectiveness of five strategies for the prevention of gastrointestinal toxicity in-duced by non-steroidal anti-inflammatory drugs: systematic review. BMJ. 2004;329:948.
5. Rostom A, Muir K, Dube C, et al. Prevention of NSAID-related upper gastrointestinal toxicity: a meta-analysis of traditional NSAIDs with gastroprotection and COX-2-inhibitors. Drug Healthc Patient Saf. 2009;1:47-71.
6. Lanza FL, Chan FK, Quigley EM; Practice Parameters Committee of the American College of Gatroenterology. Guidelines for prevention of NSAID-related ulcer complications. Am J Gas- troenterol. 2009;104:728-738.
Six days after being discharged from the hospital for treatment of acute pericarditis, a 49-year-old man came to our clinic for a follow-up appointment. The patient still had midsternal chest discomfort and dyspnea. He also reported new epigastric abdominal pain, which had begun 2 days earlier. The patient’s wife indicated that he’d had a low-grade fever since discharge, but the patient denied any chills, hematemesis, melanotic stools, diarrhea, or constipation. The patient’s medical history was significant for gastroesophageal reflux, hyperlipidemia, osteoarthritis, sleep apnea, and obesity. Along with newly prescribed indomethacin for the pericarditis (50 mg tid), he was also taking simvastatin. In addition, he occasionally took ibuprofen (800 mg/d) for osteoarthritis of his knee.
WHAT IS YOUR DIAGNOSIS?
HOW WOULD YOU TREAT THIS PATIENT?
Diagnosis: Duodenal perforation caused by indomethacin
The CT scans revealed inflammation (arrows, FIGURE 1A) and thickening of the second and third portion of the duodenum and the pres- ence of extraluminal air at the site of the perforation (arrows, FIGURE 1B). There was also free fluid along the right paracolic gutter and into the pelvis. We diagnosed a small intestinal perforation in this patient, which was likely caused by a nonsteroidal anti-inflammatory drug (NSAID)-induced ulcer.
How NSAIDs affect the GI tract
NSAIDs inhibit cyclooxygenase (COX), the enzyme responsible for prostaglandin production. Specifically, the COX-1 enzyme is responsible for the production of prostaglandins in the gastrointestinal (GI) tract. Prostaglandins play an important role in protecting the GI mucosa. By inhibiting the synthesis of prostaglandins, the permeability of the GI tract is increased and the natural protective barrier of the mucosa is destroyed.1
Gastroduodenal damage is a well-known adverse effect of NSAIDs. Ulcers have been noted on upper endoscopy in regular NSAID users, and the risk of developing a symptomatic ulcer and complications increases with every year of regular NSAID use.2 Ulcers in the GI tract can be complicated by perforation.1
Patients will complain of sudden onset abdominal pain
Important clues in the patient history for a perforated GI tract include sudden onset of severe abdominal pain that may present initially as epigastric pain and progress to generalized abdominal pain that may radiate to one or both shoulders.3 Physical exam findings for a perforated GI tract may include abdominal tenderness and rigid abdomen; fever and tachycardia may also be present.3 Concern for possible abdominal perforation should be evaluated with a complete blood count, basic metabolic panel, and radiographic studies.3
The differential diagnosis of epigastric abdominal pain includes: pancreatitis, gastritis, gastric/duodenal ulcer, and obstruction. Elevated serum lipase levels or CT findings of pancreatic inflammation assist in the diagnosis of pancreatitis. Upper endoscopy is key to identifying cases of gastritis and ulcers in the GI tract. And an abdominal radiograph that shows dilated loops of bowel will confirm suspicions of obstruction.
Stabilize the patientAcute management of GI perforation begins with stabilizing the patient and determining the need for surgical intervention or medical management. Should a patient have a persistent air leak, surgery is the mainstay of treatment.3 If the perforation has healed, the patient should be medically managed.
Therapy may require placing a nasogastric tube and holding any oral intake until abdominal pain and perforation resolves. Medications in the acute treatment should include proton pump inhibitors (PPIs) and antibiotics. Antibiotics should cover for gram-negative enteric bacteria and anaerobes.
How to prevent NSAID-induced injury.
PPIs used with nonselective NSAIDs appear to reduce the likelihood of gastric ulceration.4 Similarly, H2-receptor antagonists (H2RA) also inhibit gastric acid secretion, and high doses of them significantly reduce the incidence of gastric ulcers.4 However, standard doses of HRAs have not been shown to be effective in reducing the risk of NSAID-induced gastric ulcers.4 Misoprostol, a synthetic prostaglandin E1 analogue that inhibits gastric secretion and protects the gastric mucosa is also an option; it has been used in combination with nonselective NSAIDs to counteract the increase in GI permeability.4
What about using COX-2 inhibitors instead? The COX-2 inhibitors have a lower risk of gastrointestinal tract injury.2 Gastric ulcers, GI bleeding, and complications from ulcers have been shown to be less common with COX-2 NSAIDs compared with nonselective NSAIDs.5 A review of the literature suggests that for patients with previous GI bleeding, COX-2 inhibitors are comparable to an NSAID paired with a PPI in preventing GI bleeding; pairing a COX-2 inhibitor with a PPI, however, appears to provide the greatest defense.2,4
Consider preventive steps. Patients at risk for complications are likely to benefit from the simultaneous use of prophylactic agents with NSAID therapy. Risk factors for NSAID-related GI complications include: a previous GI event; older age; simultaneous use of anticoagulants, corticosteroids, or other NSAIDs (including low-dose aspirin); high-dose NSAID therapy; and chronic debilitating disorders (especially cardiovascular disease).6
Our patient improved with medical management
Our patient was evaluated by general surgery during his hospital admission, but because he was stable—with a healing duodenal perforation—we opted to manage him medically. We started him on esomeprazole (40 mg bid) along with ciprofloxacin (500 mg bid) and metronidazole (500 mg tid) for the microperforation of the duodenum. The patient was also scheduled for an outpatient endoscopic evaluation.
1. Park SC, Chun HJ, Kang CD, et al. Prevention and management of non-steroidal anti-inflammatory drugs-induced small intestinal injury. World J Gastroenterol. 2011;17:4647-4653.
2. Ng SC, Chan F. NSAID-induced gastrointestinal and car- diovascular injury. Curr Opin Gastroenterol. 2010;26: 611-617.
3. Lawrence PF, Bell RM, TM, et al. Essentials of General Surgery. 4th ed. Baltimore, MD: Lipincott Williams & Wilkins; 2006. 4. Hooper, L, Brown TJ, Elliott R, et al. The effectiveness of five strategies for the prevention of gastrointestinal toxicity in-duced by non-steroidal anti-inflammatory drugs: systematic review. BMJ. 2004;329:948.
5. Rostom A, Muir K, Dube C, et al. Prevention of NSAID-related upper gastrointestinal toxicity: a meta-analysis of traditional NSAIDs with gastroprotection and COX-2-inhibitors. Drug Healthc Patient Saf. 2009;1:47-71.
6. Lanza FL, Chan FK, Quigley EM; Practice Parameters Committee of the American College of Gatroenterology. Guidelines for prevention of NSAID-related ulcer complications. Am J Gas- troenterol. 2009;104:728-738.
ONLINE EXCLUSIVE
Enter text here
Enter text here
Enter text here
Hospitalist Group Tackles Palliative Care; National Chain Explores Opportunities
At the Kaiser Permanente Medical Center in San Rafael, Calif., the 20 members of the hospitalist group were encouraged to study together in preparation for the October 2012 HPM boards. The group undertook weekly study sessions for the five months leading up to the exam. Sixteen hospitalists sat for the exam, along with oncologists, nephrologists, pulmonologists, and primary care physicians from the medical center.
All passed.
“For years, our hospitalist group has been doing actual rounding with the palliative care team on their own patients,” says Shideh Shadan, MD, the hospitalist group leader. “Everyone was on board with palliative care. It is now part of our daily care, and all we had to do was to sit down and study for the exam.”
Most of Kaiser’s HMO medical centers have designated interdisciplinary palliative care consultation teams. The one at San Rafael includes nurses, social workers, chaplains, and a part-time physician who is a hospitalist, Clay Angel, MD. Dr. Angel agrees that a cultural transformation has come about at Kaiser San Rafael through this collaboration. The two services are separate but closely connected.
“In hospital medicine, if you keep farming out what you do to specialists—if you’re not embracing palliative care as a hospitalist—you lose part of your practice,” he says.
Dr. Shadan says the study group “helped us to be more cohesive and more comfortable going to each other to ask for help. Palliative care is part of what we do—part of hospital medicine and of providing good care.”
Meanwhile, North Hollywood, Calif.-based IPC The Hospitalist Company, which is well-established in post-acute and long-term-care settings beyond the hospital walls, is now starting to explore palliative care approaches at the local level in a few of its 35 markets. Heather Zinzella-Cox, MD, who was part of a panel presentation on palliative care at HM13, is hospitalist practice group leader for IPC-Delaware. She also works part time as an associate medical director for a community hospice and helped to develop an inpatient palliative care team at a local community hospital.
“For me, as a post-acute hospitalist, every patient I see, I think about whether palliative care might benefit them,” says Dr. Zinzella-Cox, who is board certified in pain and in hospice and palliative medicine.
She says hospitalists need tools for identifying appropriate palliative care patients, along with training for how to communicate with them around goals of care, including simple language to help cue these conversations. She notes a “significant voltage drop” in information at the time of discharge, and the most careful discharge plans can fall apart in a hurry after the patient goes home.
IPC’s national practice group does not have a current policy or initiative for palliative care; however, there may be opportunities for further integrating palliative care with hospital medicine, says hospitalist Thomas Mathew, MD.
Larry Beresford is a freelance writer in San Francisco.
Two Major Studies Show Benefits of CAUTI Reduction Measures
Conscientious handling of urinary catheters is one of the main responsibilities hospitalists have in caring for patients with urological disorders—and, of course, anyone else with a urinary catheter.
Treatment of patients with urological disorders often involves special circumstances requiring physician discretion when deciding whether to remove a catheter or leave it in—removing it too soon could cause problems far worse than an infection. But two compelling studies, nationwide in scope, point to the benefits of systems that help ensure prompt removal of urinary catheters when appropriate.
One, published in 2010, was a review of interventional studies that used reminders to physicians or nurses that a urinary catheter was in use or stop orders to trigger catheter removal in hospitalized adults.
Researchers found that the rate of catheter-associated urinary tract infections, measured as episodes per 1,000 catheter-days, was reduced by 52% (P<0.001) with use of a reminder or stop order. The average duration of catheterization decreased by 37%. That amounted to 2.61 fewer days of catheterization per patient in the intervention compared to control groups.
In a 2013 study published in JAMA Internal Medicine, researchers surveyed infection prevention specialists at a sample of hospitals across the U.S.—and at all hospitals in Michigan, home to a statewide CAUTI-prevention initiative started in 2007. They asked about CAUTI prevention practices and standardized infection ratios on CAUTI.
Michigan hospitals, compared with those elsewhere in the U.S., more frequently participated in collaboratives to reduce healthcare-associated infection—94% to 67%. They also used bladder scanners to measure bladder volume more frequently (53% to 39%), along with catheter reminders or stop orders and/or nurse-initiated discontinuation (44% to 23%).
CAUTI rates in the state of Michigan saw a 25% reduction, significantly greater than the 6% decrease observed in the rest of the U.S.
Sanjay Saint, MD, MPH, a hospitalist and professor of internal medicine at the University of Michigan, says the study verifies how important it is for hospitalists to remove urinary catheters early.
"The data will set us free," he says. "It’s probably better to remove a few of these catheters prematurely and then have to reinsert them than keep all catheters in long past their due date." TH
Tom Collins is a freelance author in South Florida.
Geisinger Hospitalist, Chief Quality Officer Discusses Issues
Click here to listen to excerpts of our interview with John Bulger, DO, FACP, SFHM, hospitalist and chief quality officer at Geisinger Health System in Pennsylvania.
Click here to listen to excerpts of our interview with John Bulger, DO, FACP, SFHM, hospitalist and chief quality officer at Geisinger Health System in Pennsylvania.
Click here to listen to excerpts of our interview with John Bulger, DO, FACP, SFHM, hospitalist and chief quality officer at Geisinger Health System in Pennsylvania.
American Academy of Hospice and Palliative Medicine EVP Explains Hospitalists' Important Role in End-of-Life Planning
Click here for excerpts of our interview with Porter Storey, MD, executive vice president of the American Academy of Hospice and Palliative Medicine.
Click here for excerpts of our interview with Porter Storey, MD, executive vice president of the American Academy of Hospice and Palliative Medicine.
Click here for excerpts of our interview with Porter Storey, MD, executive vice president of the American Academy of Hospice and Palliative Medicine.
What To Do When the Hospitalist Group Leader Refuses to See Patients

My hospitalist group, which has nine employees, is hospital-employed in a small Midwest town. We use the traditional seven-on and seven-off rotation and hire locum tenens to fill schedule gaps, as we have a couple of MDs who recently left the group. A few of us are concerned because our “boss,” who controls the schedule, does not put himself in rotation regularly. Instead, he puts locum or part-timers on the schedule, even on weeks when he is available. We all know that the hospital is paying him extra to take care of administrative work, and that it costs more for the hospital to pay part-time/locums. In your experience, is this a common occurrence? Should we be upset? Lastly, should we bring this issue to administration, because many of us think that they are not aware this is happening.
–Mismatched in the Midwest
Dr. Hospitalist responds:
Opinions vary when it comes to the amount of clinical time hospitalist leaders should devote to their groups. As we have become more involved in the administrative aspects of the hospital, there are increasing demands placed on directors. Along with increased administrative demands comes the desire of many of these physician-leaders to remain adept in the practice of hospital medicine. Without a strong clinical connection and familiarity with what the others experience day to day, the group leader risks losing credibility and whatever leverage the title might offer.
Many groups have devised formulas based on the number of members in the group to help them derive a “fair” amount of administrative time to allow the director. For example, for every five full-time equivalents (FTEs) on staff, the director receives 0.1 FTE in admin time; so, for a group of 25 members, the director would get 0.5 admin time. The remainder of time would be clinical, but again, how that clinical time is managed is also highly variable.
This seems like a reasonable formula to me, because those with larger programs will have larger hospitals, more people to manage, and more personalities to deal with. The potential rewards and job satisfaction are also greater. (Another potential scheduling issue: Does the group leader “fall right into” the rotation or only work the services with light census or teaching services in an academic institution?)
Some groups that work the traditional seven-on/seven-off schedule have allowed the hospitalist physician-leader to work Monday through Friday and carry a smaller census (10-12). This allows the leader to be in the hospital during those critical times when most administrative duties are fulfilled, while also allowing for a mechanism to place overflow patients on those high census days—as long as it is a rare occurrence. He or she should also occasionally work all the different shifts (nocturnist, admitter, teams, and so on) to best understand the group’s opportunities for improvement and its challenges.
There are likely as many iterations of how to devise a fair division of time as there are hospitalist groups, but, most importantly, the days of getting someone to volunteer to be a hospitalist director without some form of compensation are long gone. In most programs, the job has become much more complex.
Many believe it is a conflict of interest for the group leader to prepare the schedule. There is too much room for perceived favoritism or mistreatment by the members when the schedule doesn’t work in everyone’s favor (which it never will). There are proprietary programs on the market that allow for easy and reliable scheduling; they also remove the potential for bias. In a group as small as yours, an astute administrative assistant or associate director can be entrusted with the schedule.
With regard to speaking up, you say a “few” in your group are concerned, so I assume more than one but still a small number of your group has expressed some dissatisfaction. There may be other members with similar sentiments, so it is important to have a discussion with all the group members and solicit their opinions. Instead of approaching the administrators with your concerns, I suggest you and your colleagues have an open and candid discussion with your group leader. After the discussion, if you still remain dissatisfied with the director’s level of clinical involvement, you are left with several choices:
- Approach hospital administration and see if they approve of how your director is carrying out his clinical responsibilities. Be prepared for the director to find out.
- Continue to do your job and let this issue rest.
- Start looking for another job. If the situation really bothers you, I favor the latter!
Do you have a problem or concern that you’d like Dr. Hospitalist to address? Email your questions to [email protected].
Get Ready for Transition to ICD-10 Medical Coding

By now, I’m sure you’re knowledgeable about things like healthcare exchanges and other parts of the Accountable Care Act, the increasing number of metrics within hospital value-based purchasing, the physician value-based payment modifier, the physician quality reporting system (PQRS), how to use your hospital’s new EHR efficiently, the new “two-midnight rule” to determine inpatient vs. observation status, and so on.
You’re to be commended if you’re staying on top of all these things and have effective plans in place to ensure good performance on each. And if you haven’t already, you should add at least one more important issue to this list—the transition to ICD-10 coding on Oct. 1, 2014.
An Overview
ICD stands for International Classification of Diseases, and the U.S. has been using the 9th revision (ICD-9) since 1978. ICD-9 is now significantly out of step with current medical knowledge and has run out of codes in some disease sections (“chapters”). This might mean, for example, that new codes for heart diseases would be assigned to the chapter for eye disease, because the former is full.
ICD-10 provides a way to fix these problems and, through more specific coding of diseases, should be able to yield more useful “big data” to measure things like safety and efficacy of care and more accurately identify diagnosis trends and epidemics. And, in theory, it could reduce the number of rejected billing claims, though I’m waiting to see if that happens. I worry that even after fixing all the initial bugs related to the ICD-10 transition, we will see more claim rejections than we experience today.
ICD codes can be thought of as diagnosis codes. CPT codes (Current Procedural Terminology) are an entirely separate set of codes that we use to report the work we do for the purposes of billing. We need to be familiar with both, but it is the ICD codes that are changing.
ICD-10 Basics and Trivia
The World Health Organization issued the ICD-10 in 1994, and it is already in use in many countries. Like some other countries, the U.S. made modifications to the WHO’s original code set, so we refer to ICD-10-CM (Clinical Modification), which contains diagnosis codes. The National Center for Health Statistics, a department of the CDC, is responsible for these modifications.
The WHO version of ICD-10 doesn’t have any procedure codes, so CMS developed ICD-10-PCS (Procedure Coding System) to report procedures, such as surgeries, done in U.S. hospitals. Most hospitalists won’t use these procedure codes often.

Table 1 (left) compares ICD-10-CM to ICD-9-CM. Most of the additional codes in the new version simply add information regarding whether the diagnosis is on the left or right of the body, acute or chronic, or an initial or subsequent visit for the condition. But the standard structure for each code had to be modified significantly to capture this additional information. Some highlights of the seven-character code structure are:
- Characters 1–3: category; first digit always a letter, second digit always a number, all other digits can be either; not case sensitive;
- Characters 4–6: etiology, anatomic site, severity, or other clinical detail; for example, 1=right, 2=left, 3-bilateral, and 0 or 9=unspecified; and
- Character 7: extension (i.e., A=initial encounter, D=subsequent encounter, S=sequelae).
- A placeholder “x” is used as needed to fill in empty characters to ensure that the seventh character stays in the seventh position. For example, T79.1xxA equates to “fat embolism, initial encounter.” (Note that the “dummy” characters could create problems for some IT systems.)
An example of more information contained in additional characters:
- S52=fracture of forearm.
- S52.5=fracture of lower end of radius.
- S52.52=torus fracture of lower end of radius.
- S52.521=torus fracture of lower end of right radius.
- S52.521A=torus fracture of lower end of right radius, initial encounter for closed fracture.
Compared to its predecessor, ICD-10 expands use of combination codes. These are single codes that can be used to classify either two diagnoses, a diagnosis with an associated secondary process, or a diagnosis with an associated complication. For example, rather than reporting acute cor pulmonale and septic pulmonary embolism separately, ICD-10 allows use of the code I26.01: septic pulmonary embolism with acute cor pulmonale.
Resources
In addition to resources on the SHM website, both the American Medical Association (www.ama-assn.org, search “ICD-10”) and the Centers for Medicare and Medicaid Services (www.cms.gov/icd10) have very informative microsites offering detailed ICD-10 information. Much of the information in this column, including the examples above, comes from those sites.
What to Expect
Your hospital and your employer are probably already working in earnest to prepare for the change. In some cases, hospitalists are actively involved in these preparations, but in most cases they will simply wait for an organization to notify them that they should begin training to understand the new coding system. Experts say that most physicians will need two to four hours of training on ICD-10, but because we use a universe of diagnosis codes that is much larger than many specialties, I wonder if hospitalists may need additional training.
Like nearly all the programs I listed at the beginning, the transition to ICD-10 has me concerned. Managing it poorly could mean significant loss in hospital and physician professional fee revenue, as well as lots of tedious and time-consuming work. So, doing it right is important. But, it is also important to do well on all the programs I listed at the beginning of this column, and many others, and there is a limit to just how much we can do effectively as individuals.
Collectively, these programs risk taking too much time and too many brain cells away from keeping up with clinical medicine. So, I wonder if, for many of us, ICD-10 will serve as a tipping point that results in physicians hiring professional coders to choose our diagnosis codes and CPT codes rather than doing it ourselves.
As with EHRs, ICD-10 is said to have many benefits. But the introduction of EHRs in many hospitals had the unintended effect of significantly reducing the number of doctors who were willing to serve as admitting and attending physicians; instead, many chose to refer to hospitalists. In a similar way, ICD-10 might lead many organizations to relieve physicians of the responsibility of looking up and entering codes for each patient, leaving them with more time and energy to be clinicians. We’ll have to wait and see.
Dr. Nelson has been a practicing hospitalist since 1988. He is co-founder and past president of SHM, and principal in Nelson Flores Hospital Medicine Consultants. He is co-director for SHM’s “Best Practices in Managing a Hospital Medicine Program” course. Write to him at [email protected].
By now, I’m sure you’re knowledgeable about things like healthcare exchanges and other parts of the Accountable Care Act, the increasing number of metrics within hospital value-based purchasing, the physician value-based payment modifier, the physician quality reporting system (PQRS), how to use your hospital’s new EHR efficiently, the new “two-midnight rule” to determine inpatient vs. observation status, and so on.
You’re to be commended if you’re staying on top of all these things and have effective plans in place to ensure good performance on each. And if you haven’t already, you should add at least one more important issue to this list—the transition to ICD-10 coding on Oct. 1, 2014.
An Overview
ICD stands for International Classification of Diseases, and the U.S. has been using the 9th revision (ICD-9) since 1978. ICD-9 is now significantly out of step with current medical knowledge and has run out of codes in some disease sections (“chapters”). This might mean, for example, that new codes for heart diseases would be assigned to the chapter for eye disease, because the former is full.
ICD-10 provides a way to fix these problems and, through more specific coding of diseases, should be able to yield more useful “big data” to measure things like safety and efficacy of care and more accurately identify diagnosis trends and epidemics. And, in theory, it could reduce the number of rejected billing claims, though I’m waiting to see if that happens. I worry that even after fixing all the initial bugs related to the ICD-10 transition, we will see more claim rejections than we experience today.
ICD codes can be thought of as diagnosis codes. CPT codes (Current Procedural Terminology) are an entirely separate set of codes that we use to report the work we do for the purposes of billing. We need to be familiar with both, but it is the ICD codes that are changing.
ICD-10 Basics and Trivia
The World Health Organization issued the ICD-10 in 1994, and it is already in use in many countries. Like some other countries, the U.S. made modifications to the WHO’s original code set, so we refer to ICD-10-CM (Clinical Modification), which contains diagnosis codes. The National Center for Health Statistics, a department of the CDC, is responsible for these modifications.
The WHO version of ICD-10 doesn’t have any procedure codes, so CMS developed ICD-10-PCS (Procedure Coding System) to report procedures, such as surgeries, done in U.S. hospitals. Most hospitalists won’t use these procedure codes often.
Table 1 (left) compares ICD-10-CM to ICD-9-CM. Most of the additional codes in the new version simply add information regarding whether the diagnosis is on the left or right of the body, acute or chronic, or an initial or subsequent visit for the condition. But the standard structure for each code had to be modified significantly to capture this additional information. Some highlights of the seven-character code structure are:
- Characters 1–3: category; first digit always a letter, second digit always a number, all other digits can be either; not case sensitive;
- Characters 4–6: etiology, anatomic site, severity, or other clinical detail; for example, 1=right, 2=left, 3-bilateral, and 0 or 9=unspecified; and
- Character 7: extension (i.e., A=initial encounter, D=subsequent encounter, S=sequelae).
- A placeholder “x” is used as needed to fill in empty characters to ensure that the seventh character stays in the seventh position. For example, T79.1xxA equates to “fat embolism, initial encounter.” (Note that the “dummy” characters could create problems for some IT systems.)
An example of more information contained in additional characters:
- S52=fracture of forearm.
- S52.5=fracture of lower end of radius.
- S52.52=torus fracture of lower end of radius.
- S52.521=torus fracture of lower end of right radius.
- S52.521A=torus fracture of lower end of right radius, initial encounter for closed fracture.
Compared to its predecessor, ICD-10 expands use of combination codes. These are single codes that can be used to classify either two diagnoses, a diagnosis with an associated secondary process, or a diagnosis with an associated complication. For example, rather than reporting acute cor pulmonale and septic pulmonary embolism separately, ICD-10 allows use of the code I26.01: septic pulmonary embolism with acute cor pulmonale.
Resources
In addition to resources on the SHM website, both the American Medical Association (www.ama-assn.org, search “ICD-10”) and the Centers for Medicare and Medicaid Services (www.cms.gov/icd10) have very informative microsites offering detailed ICD-10 information. Much of the information in this column, including the examples above, comes from those sites.
What to Expect
Your hospital and your employer are probably already working in earnest to prepare for the change. In some cases, hospitalists are actively involved in these preparations, but in most cases they will simply wait for an organization to notify them that they should begin training to understand the new coding system. Experts say that most physicians will need two to four hours of training on ICD-10, but because we use a universe of diagnosis codes that is much larger than many specialties, I wonder if hospitalists may need additional training.
Like nearly all the programs I listed at the beginning, the transition to ICD-10 has me concerned. Managing it poorly could mean significant loss in hospital and physician professional fee revenue, as well as lots of tedious and time-consuming work. So, doing it right is important. But, it is also important to do well on all the programs I listed at the beginning of this column, and many others, and there is a limit to just how much we can do effectively as individuals.
Collectively, these programs risk taking too much time and too many brain cells away from keeping up with clinical medicine. So, I wonder if, for many of us, ICD-10 will serve as a tipping point that results in physicians hiring professional coders to choose our diagnosis codes and CPT codes rather than doing it ourselves.
As with EHRs, ICD-10 is said to have many benefits. But the introduction of EHRs in many hospitals had the unintended effect of significantly reducing the number of doctors who were willing to serve as admitting and attending physicians; instead, many chose to refer to hospitalists. In a similar way, ICD-10 might lead many organizations to relieve physicians of the responsibility of looking up and entering codes for each patient, leaving them with more time and energy to be clinicians. We’ll have to wait and see.
Dr. Nelson has been a practicing hospitalist since 1988. He is co-founder and past president of SHM, and principal in Nelson Flores Hospital Medicine Consultants. He is co-director for SHM’s “Best Practices in Managing a Hospital Medicine Program” course. Write to him at [email protected].
Six Interventions To Radically Improve the U.S. Healthcare System

We talk a lot about value in healthcare these days. Most everyone in healthcare knows the infamous quality/cost equation: the lower the cost and the higher the quality, the higher the value. Seems like a pretty straightforward equation; there aren’t even any coefficients, factorials, exponents, or square roots. Just two simple terms: quality and cost. How complicated could that possibly be?
The problem with the value equation is not its complexity on paper but the reinforcing barriers in our healthcare system that have made it impossible to improve the value equation on a large scale. Despite millions of hard-working, well-intentioned people in the healthcare industry, quality continues to be variable at best, and cost continues to rise. Healthcare currently consumes nearly 18% of the U.S. gross domestic product, threatening other aspects of the American economy, notably education and other federally subsidized programs.
A series of articles published between The New England Journal of Medicine and the Harvard Business Review aims to discover and suggest solutions to the issues currently ailing the U.S. healthcare system.1 The first installment focused on how to improve value on a large scale. The authors discuss the major barriers to realizing the value equation, along with some propositions for overcoming these barriers on a large scale.2 Although all six barriers are extremely difficult to surmount, the authors argue that because they are all mutually reinforcing in the current state, all will need to be addressed swiftly, tenaciously, and simultaneously.
Outlined here is a summary of the proposed interventions, and how these can and will affect hospitalists.
1
Providers need to organize themselves around what patients need, instead of around what providers do and how they are reimbursed. This will entail a shift from individual, discrete services to comprehensive, patient-focused care of medical conditions. The authors term these “Integrated Practice Units (IPU),” in which an entire team of providers organize themselves around the patient’s disease and provide comprehensive care across the range of the severity of the disease and the locations in which that disease is best served.
For hospitalists, working in multidisciplinary teams will come as second nature, but this also will require hospitalists to enhance the flexibility with which they see the patients and provide services exactly as the patients need, rather than based on arbitrary schedules and conveniences. Many hospitalists are already involved in comprehensive specialty care of high-volume surgical conditions, such as total hip and total knee patients, who usually come with a relatively predictable set of co-morbid conditions, such as hypertension, diabetes, rheumatologic disease, or sickle cell anemia. The literature has clearly established the fact that high-volume specialty care centers can and do deliver higher value care (higher quality at lower cost), compared to lower volume, less “well-oiled” centers.
2
Providers need transparent and readily available information on quality and cost to move the value equation. As we all know, you can’t improve what you don’t measure. Hospitalists need to work collaboratively with their hospital systems to collect and widely report on quality and cost metrics for the patients they serve. These quality metrics should not only focus on those process and outcome measures that must currently be reported (internally or externally); hospitalists should seek out the metrics that really matter to patients, such as achieving functional status (ambulating, eating, being pain free), shortening recovery time (getting back to work, playing with the grandchildren), and sustaining recovery for as long as possible (relapse, readmission, reoperation).
Hospitalists should embrace the transparency of these metrics and encourage attribution of the metrics to individual providers or provider groups. Metric transparency stimulates rapid improvements and fosters goal alignment. Measurement and reporting of cost is absolutely essential in moving the value equation. Hospitalists should advocate for widespread transparency of the costs of tests, products, supplies, and manpower, and these should be freely and openly shared with patients and their families, to engage them in discussions about value.
3
Reimbursement for services should reflect the actual cost of the service and should be bundled. Many hospitalists are likely already involved in some demonstration projects around bundled payments for care across a continuum. Many CMS demonstration projects have focused on high-volume, predictable conditions (total hip arthroplasty, for instance) or high-volume, less predictable but costly conditions (such as congestive heart failure or COPD). Some large employers also are contracting with high volume hospitals to perform semi-elective procedures such as coronary artery bypass grafting, and sending their employees out of state to these centers of excellence. Most hospitalists are already at least conceptually comfortable with being held accountable for the cost and quality of certain patient types, including reducing unnecessary variation and spending and avoiding preventable complications.
4
Care should be integrated into a smaller number of large delivery systems, instead of a large number of small, “do-it-all” systems. These large systems have to actually work for the good of the patients, integrating their care and not just providing duplicate services in each location. Each center should be able to deliver excellent care in some conditions, not adequate care in all conditions. The more complicated, complex care should be delivered in tertiary care centers, and the more predictable, less heterogeneous care conditions should be addressed in lower-cost, community settings. Integrated systems can direct the right patients to the right location, to enhance both quality and cost.
5
On a related thread, healthcare systems need to focus patients on getting the right care in the right location and teach them to be less concerned about geography. In the days when hospital length of stays were routinely in the double digits, patients naturally opted to receive any and all care in a location close to their home and family. But now that hospital stays are generally in single digits, proximity to home is less important than good value of care, and healthcare systems need to steer patients to the best care delivery site, even if it is not near their homes. Some large employers have started reimbursing patients and their families for the cost associated with traveling to the correct site of care. With the availability of easy, low-cost travel options, this can and should be feasible for most patients and their families.
6
Information technology systems need to enable patient-centered care. Although this seemed to be the premise of EHRs, in reality, most have focused on enhancing billing, revenue, and documentation, rather than closely tracking the health, wellness, outcomes, and cost of individual patients throughout the care continuum. In the healthcare system of the future, the patient-centered EHR has to be readily accessible to all care providers, as well as to the patients themselves; it has to be easy to input and extract data; and it has to use common definitions for data.
Hospitalists would welcome such EHRs and should work tirelessly to achieve them within the healthcare system.
Conclusion
Although no single suggestion is wholly unappealing to the field of hospital medicine, accomplishing all of these quickly and simultaneously will be extremely challenging. It will take tremendous leadership and a bit of faith in the end goal. But the status quo is not an option, and current healthcare spending threatens the American Dream. Hospitalists can—and should—be pivotal in leading, or at least cooperating in, the achievement of this future-state, high-value healthcare system.
Dr. Scheurer is a hospitalist and chief quality officer at the Medical University of South Carolina in Charleston. She is physician editor of The Hospitalist. Email her at [email protected].
References
Large Hospital Systems, Physician Groups Most Likely to Form Accountable Care Organizations

The environment that breeds the formation of accountable care organizations (ACOs) includes large integrated hospital systems, primary care physicians (PCPs) practicing in large groups, and a greater fraction of hospital risk sharing, according to a Health Affairs report (http://content.healthaffairs.org/content/32/10/1781.abstract).
In other words, institutions and areas that have begun embracing risk-based or population-based payment models are more likely to spur the formation of ACOs, which have similar risk-reward payment structures.
For hospitalists, knowing the conditions that help foster ACOs may be an important first step in pushing for development and continued growth, says Ron Greeno, MD, FCCP, MHM, SHM Public Policy Committee chair and chief medical officer of Cogent HMG in Brentwood, Tenn.
It’s a shift in mindset for sure, says the report’s lead author.
“The traditional model is pretty much fill your beds with high-paying patients. An ACO is really a different kind of concept,” says David Auerbach, MS, PhD, of Boston-based RAND Corporation. “A hospital that doesn’t have any experience thinking in a different way is going to find it hard to accommodate the ACO payment model. But hospitals that do…probably have staff that have thought about this and already started to move down the path to thinking about ways to reduce their costs.”
Regional Variance
Dr. Auerbach, a policy researcher and affiliate faculty member at Pardee RAND Graduate School, says further work needs to be done to identify “key regional factors” that induce certain physicians and hospitals to launch ACOs. His paper, “Accountable Care Organization Formation Is Associated with Integrated Systems but Not High Medical Spending,” found wide disparities in ACO formation; the model is popular in the Northeast and Midwest regions but scarcely found in the Northwest.
—Ron Greeno, MD, FCCP, MHM, SHM’s Public Policy Committee chair, chief medical officer, Cogent HMG, Brentwood, Tenn.
The authors reviewed 32 Medicare Pioneer ACOs, 116 Medicare Shared Savings Program ACOs, and 77 private-market entities very similar to ACOs. The study’s multiple-regression analysis found that in the 31 regions with at least 20% of Medicare fee-for-service beneficiaries in an ACO, more than half of hospitals had a joint venture with doctors or physician groups and were affiliated with a health system. In so-called “low-ACO areas,” that percentage hovered around 30% to 40%.
And while much of the policy discussion focuses on whether ACOs can rein in healthcare spending in some of the markets where care costs the most, the study reported “no strong pattern in the relationship between ACO penetration and Medicare spending or spending growth.”
Uncertain Upside
Dr. Auerbach says that while the results of his paper did not surprise him, he hopes hospitalists and others use them educationally.
“We might think about there being demand from people in other areas that might say, ‘I want to be a part of that too. Why aren’t there any ACOs that I can be in?’” he adds. “And so a study like this says, ‘Here are some of the things that seem to be important.’ If there’s not this kind of infrastructure in your area, as a policy maker, you could go and say, ‘Let’s try and give a boost to some of these factors or proxies for these things.’”
Part of that review would include looking at those areas that saw higher rates of physician-institution consolidation and figuring out what the motivations were. Typically, the impetus of forming larger groups is partly explained by a desire to negotiate with insurers and get better deals, Dr. Auerbach says. But with more coordinated care comes a more efficient system that can offset those lower rates.
“I think right now most policymakers are not sure if the upside is better than the downside,” he adds. “I think the answer, personally, is not to try to break up providers and do a lot of anti-trust activity. We need to understand whether, and how much, integrated groups are able to use market power to charge higher prices. And, if they do, there may be other ways to combat that problem while keeping the groups intact.”
Rethinking Reimbursement
Dr. Greeno says growing pains are inevitable along the way, particularly because the move to the ACO payment model is a seismic shift for a healthcare industry that has traditionally been based on a fee-for-service model.
“How we pay for healthcare in this country is going to be completely flipped on its head,” he says. “Part of the goal, of course, is better outcomes for patients. But it’s also cost efficiency. In the meantime, the entire system for 100 years has been paying for production.”
Dr. Greeno compares it to the shift that was the managed-care movement. Moving forward, the shift will create winners and losers and most likely will result in massive consolidation of healthcare organizations—from nearly 700 today to what Dr. Greeno believes may be 50 to 70 mega-providers.
“It’s basically what happened when HMOs started paying capitated payments to physician groups,” he says. “The groups then had X amount of dollars to care for their patient population, and if they couldn’t make that work, they went out of business or were acquired by more successful groups. If they could make it work, then they survived. It’s the exact same thing. It’s not quite as dramatic, as it is not going to happen overnight, but that’s where it’s heading.
“And instead of occurring in pockets around the country like in Southern California and Minneapolis, it’s going to be nationwide, and the world’s largest insurance company, which is Medicare, is driving it.”
Dr. Auerbach notes that while the disruption already has caused some groups to drop out of the ACO programs, he does not see that as a precursor to more organizations turning away from the program, particularly as it is among the key planks of the general healthcare reform movement.
“It is part of a larger wave that really is changing the way we do healthcare,” he says. “I think that as [ACOs] grow...people are going to say that this is becoming something like the dominant form of delivering healthcare.”
Richard Quinn is a freelance writer in New Jersey.