User login
Survey quantifies impact of drug shortages

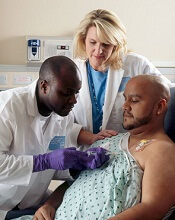
Credit: Rhoda Baer
Drug shortages remain a serious problem for patient safety, according to a small survey of US pharmacy directors.
Of the nearly 200 directors, 49% said patients received suboptimal treatment as a result of drug shortages.
Fifty-five percent of respondents reported medication errors resulting from shortages. And 45% reported adverse events due to drug shortages, including a small number of disabling events and deaths.
These results appear in the Journal of Managed Care Pharmacy.
“Drug shortages are the first thing I think about when I get up in the morning, and it is the last thing on my mind when I go to bed at night,” said study author Gary Fennessy, of Northwestern Memorial HealthCare in Chicago, Illinois.
“This is not a problem that is going to go away on its own. Healthcare leaders must not lose sight of it as a major contributor to patient harm or consider its adverse effects inevitable.”
With this in mind, Fennessy and his colleagues sent an electronic survey on drug shortages to 1516 directors of pharmacy.
The survey asked respondents to include information on patient demographics, patient complaints, adverse events, medication errors, patient outcomes, and institutional costs related to drug shortages.
Only 193 pharmacy directors responded. The majority were from acute care institutions serving less than 100 patients. The locations were divided evenly among suburban, urban, and rural institutions.
The medications most commonly reported to be in short supply were analgesics/anesthetics (n=176, 92%), anti-emetics (n=171, 89%), and electrolytes/total parenteral nutrition (n=162, 84%).
Respondents said drug shortages contributed to a variety of issues, including medication errors (such as giving the wrong dose, the wrong drug, or the wrong frequency).
Fifty-three percent of respondents reported 1 to 10 medication errors resulting from drug shortages. And 2% reported more than 30 medication errors.
Eighty-five percent of respondents said patients had to use alternative medications due to drug shortages, 71% said patients’ experienced delays in treatment, and 49% said patients received suboptimal treatment.
Thirty-three percent of respondents said drug shortages resulted in an increased stay in the hospital, 16% said drug shortages caused treatment failure, and 12% said shortages caused hospital readmission.
Forty-one percent of respondents reported 1 to 5 possible or probable adverse events related to drug shortages, and 3% reported more than 15 adverse events.
One percent of respondents reported 1 to 5 patient deaths resulting from drug shortages, 2% reported a disabling adverse event in 1 to 5 patients, and 19% reported adverse events requiring intervention in 1 to 5 patients.
Fifty respondents provided numbers on their estimated costs resulting from drug shortages. And 73% of these individuals calculated costs greater than $100,000.
Thirty-eight percent of respondents said their organization had received at least 1 patient complaint related to drug shortages. And of those respondents reporting the actual number of patient complaints, 18% reported more than 10 complaints.
“This survey is the first that we are aware of to describe the effects that drug shortages have on patient complaints,” said study author Despina Kotis, PharmD, also of Northwestern Memorial HealthCare.
“It clearly shows that patients are aware these shortages are happening, and they are upset that their care is being adversely affected by them.” ![]()
MCL-1 proves critical in MYC-driven lymphomas

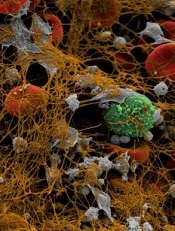
Walter and Eliza Hall Institute
Results of preclinical research suggest the prosurvival protein MCL-1 is the BCL-2 family member most important for the growth and survival of MYC-driven lymphomas.
Investigators found that MYC-driven lymphoma growth in mice and human cell lines was significantly more dependent upon MCL-1 than BCL-XL.
And mutations in p53 could diminish but not counteract this dependency.
The team described this research is Genes & Development.
The work built on more than 3 decades of research into how MYC drives cancer development, according to study author Gemma Kelly, PhD, of the Walter and Eliza Hall Institute in Victoria, Australia.
“For many years, we have known that proteins from the BCL-2 protein family enhance cell survival and cooperate with MYC to accelerate the development of cancer,” she said. “Until now, it was not known which specific BCL-2 family protein was most important for the survival and growth of MYC-driven cancers.”
To investigate, Dr Kelly and her colleagues first generated mice in which they could delete Mcl-1 or Bcl-x in c-MYC-driven lymphoma cells.
The researchers found that homozygous loss of Bcl-x slightly impaired lymphoma growth. Four percent of Bcl-x-deleted mice had complete lymphoma regression. The rest experienced a modest delay in tumor expansion and slightly prolonged survival compared to controls (P=0.0367).
On the other hand, homozygous Mcl-1 deletion prompted complete lymphoma regression in 30% of mice, and it significantly improved overall survival compared to controls (P<0.0001). Even heterozygous Mcl-1 deletion substantially impaired lymphoma growth.
The investigators also conducted experiments on human Burkitt lymphoma cell lines. And they found evidence suggesting the survival and growth of Burkitt lymphoma cells is largely dependent on MCL-1. In fact, sustained growth and survival may not depend on BCL-XL at all.
Finally, the researchers investigated the role p53 mutations play in MCL-1 dependency. The results showed that mutations in p53 can reduce but not ablate lymphomas’ dependency on MCL-1.
These findings suggest MCL-1 could be an attractive therapeutic target for MYC-driven cancers, the investigators said, particularly because the loss of a single Mcl-1 allele is well-tolerated in healthy tissues.
“Anticancer agents that target the protein BCL-2, which is closely related to MCL-1, are already showing promise in clinical trials . . . ,” said study author Andreas Strasser, PhD, of the Walter and Eliza Hall Institute.
“We are hopeful that inhibitors of MCL-1 will soon become available for clinical testing. We will be very interested in determining whether these compounds could be used to treat MYC-driven cancers.” ![]()
Leukemia is leading cause of cancer death among young Americans
receiving chemotherapy
Credit: Rhoda Baer
Leukemia is the leading cause of cancer death in the US for men under 40 and women aged 20 and younger, according to a report by the American Cancer Society.
Non-Hodgkin lymphoma (NHL) is also among the 5 leading causes of cancer death for men under 40 and for women age 80 and older.
These data appear in “Cancer Statistics, 2014,” a report published in CA: A Cancer Journal for Clinicians.
The report includes statistics on cancer incidence and death from 1975 to 2010, as well as projections for 2014.
In the latest data (from 2010), NHL was the fifth leading cause of cancer death for men under 20 and for women over 79. It was the fourth leading cause of cancer death for men ages 20 to 39.
And leukemia was the third leading cause of cancer death for women ages 20 to 39, in addition to being the leading cause of cancer death for women under 21 and men under 40.
However, of all cancer types, leukemia and NHL have seen the largest improvements in survival, according to data comparing 5-year survival rates between 1975-1977 and 2003-2009.
Five-year survival rates for leukemia were 34% for 1975-1977 and 59% for 2003-2009 (P<0.05). For NHL, 5-year survival rates were 47% for 1975-1977 and 71% for 2003-2009 (P<0.05).
Projections for 2014
The report authors took past data into account to make estimates on cancer incidence and death for 2014. They projected that 1,665,540 patients will be diagnosed with cancer this year, and 585,720 patients will die of cancer.
Roughly 79,990 patients will be diagnosed with lymphoma—9190 with Hodgkin lymphoma and 70,800 with NHL. Approximately 18,990 patients will die of NHL, and 1180 will die of Hodgkin lymphoma.
There will be 24,050 new cases of myeloma in 2014 and 11,090 myeloma deaths, the authors said.
This year will see 52,380 patients diagnosed with leukemias—6020 with acute lymphocytic leukemia (ALL), 15,720 with chronic lymphocytic leukemia (CLL), 18,860 with acute myeloid leukemia (AML), 5980 with chronic myeloid leukemia (CML), and 5800 with other types of leukemia.
And there will be 24,090 leukemia deaths—1440 from ALL, 4600 from CLL, 10,460 from AML, 810 from CML, and 6780 from other leukemias.
For more information, see the complete report. ![]()
Team identifies highly mutagenic compounds

Credit: Heather Luis
Researchers say they have discovered compounds that are hundreds of times more mutagenic than known carcinogens.
These compounds are produced by certain types of chemical reactions, such as those found in vehicle exhaust or the reactions that take place when meat is grilled over a flame.
The discovery of these compounds raises additional concerns about the health impacts of heavily polluted urban air and dietary exposure to carcinogens, according to the researchers.
Their findings were published in Environmental Science and Technology.
“Some of the compounds that we’ve discovered are far more mutagenic than we previously understood and may exist in the environment as a result of heavy air pollution from vehicles or some types of food preparation,” said Staci Simonich, PhD, of Oregon State University College of Agricultural Sciences.
“We don’t know at this point what levels may be present and will explore that in continued research.”
The parent compounds involved in this research are polycyclic aromatic hydrocarbons (PAHs), which are formed naturally as the result of almost any type of combustion.
Many PAHs, such as benzo[a]pyrene, have been shown to induce leukemias, lymphomas, and other cancers. PAHs are now believed to be more of a health concern than we thought in the past and are the subject of extensive research around the world.
PAHs can become even more of a problem when they chemically interact with nitrogen to become nitrated (NPAHs), according to scientists.
The newly discovered compounds are NPAHs that were unknown to this point. The researchers found the direct mutagenicity of the NPAHs with 1 nitrogen group can be 6 to 432 times more than the parent compound. NPAHs based on 2 nitrogen groups can be 272 to 467 times more mutagenic.
And the team said the mutagenic assays they used may actually have understated the increase in toxicity. It could be even higher. ![]()
Chemo patients may have higher VTE risk than trials suggest
Credit: Andre E.X. Brown
A large-scale analysis assessing the real-world risk of venous thromboembolism (VTE) among chemotherapy patients showed a greater occurrence of VTE than that identified in clinical trials.
The data also revealed a progressively increased risk during the year following treatment initiation.
The study, published in The Oncologist, showed that outpatients receiving chemotherapy were at high risk of both VTE and major bleeding complications.
The risks were particularly high for patients with pancreas, stomach, and lung cancer.
Gary H. Lyman, MD, of the Duke University School of Medicine in Durham, North Carolina, and his colleagues conducted this research, analyzing data from the United States IMPACT healthcare claims database.
Their sample included 27,479 patients with solid tumor malignancies who had undergone chemotherapy. The researchers retrospectively evaluated the patients’ VTE risk, as well as their risk of bleeding and the economic burden borne by the patient as a result of the disease.
The team used 3 definitions of VTE. Definition A included patients who had 1 or more VTE claim. Definition B included patients with 2 or more VTE claims 30 days or more apart, 1 inpatient claim, or 1 outpatient claim in which they received an anticoagulant within 90 days.
Definition C excluded from definition B any VTE events within 90 days of any major or invasive surgery. Codes relating to esophageal, renal, and uterine cancer were excluded.
VTE risk
The risk of VTE increased over time, with a greater percentage of patients developing the complication at 12 months after initiation of chemotherapy than at 3.5 months. This held true across the 3 definitions of VTE considered.
According to definition A, the overall VTE incidence was 7.3% (4.6%-11.6%) at 3.5 months and 13.5% (9.8%-21.3%) at a year.
Rates of VTE were similar according to definitions B and C. At 3.5 months, the rates were 3.4%-9.6% and 3.2%-8.7%, respectively. At 12 months, they were 7.1%-17.7% and 6.7%-16.6%, respectively.
According to definition A, VTE was most frequently observed in cancers of the pancreas (11.6%), lung (8.5%), and stomach (8.3%).
Major bleeding
Patients with VTE had a higher risk of major bleeding events in the year following chemotherapy initiation.
Individuals receiving outpatient chemotherapy who developed VTE according to definition A at 3.5 months had a higher risk for major bleeding complications within 3.5 months than patients who were not receiving outpatient chemotherapy—11.0% and 3.8%, respectively.
The incidence of major bleeding within 12 months after the index date was 19.8% in patients with VTE (according to definition A) and 9.6% in patients without VTE.
Healthcare costs
While the baseline healthcare costs of patients who would develop VTE were comparable to those of patients who would not, the costs soared for VTE patients over the year following chemotherapy initiation.
On average, in the first 12 months after the index date, patients with VTE had $110,719 worth of healthcare costs, compared with $76,804 for patients without VTE. This difference was primarily accounted for by VTE-related inpatient, outpatient, and emergency room expenses.
Claims data vs trial data
The researchers noted that the incidence of VTE reported in this study is inconsistent with data previously reported in randomized clinical trials, which may be due to the selection of lower-risk patients for participation in these studies.
“Importantly, this observational study suggests that the observed rates of symptomatic VTE in real-world practice are considerably greater than reported in patients eligible for randomized clinical trials,” Dr Lyman said.
“Clinical oncologists need to be aware of the increased risk of this serious complication of cancer and cancer treatment, and, when the risk is sufficiently great, and the balance of benefits and harms acceptable, oncologists should consider prophylactic anticoagulation.”
Dr Lyman and his colleagues hypothesized that there is a definable, high-risk cohort of patients who would benefit from thromboprophylaxis.
And the scope of this risk warrants consideration for the use of treatments such as low- and ultra-low-molecular-weight heparins, which recent studies have found to be safe and effective thromboprophylaxis for chemotherapy patients. ![]()
Patients' Point of View on Informed Consent: A Prospective Study in Carpal Tunnel Surgery
US health spending growth slowed in 2012

Credit: Petr Kratochvil
In 2012, overall US health expenditures grew slower than the economy as a whole, according to a report by the Centers for Medicare & Medicaid Services (CMS).
US health spending grew at an annual rate of 3.7% in 2012, to reach $2.8 trillion, or $8915 per person. The rate of growth was 3.9%, and reached $2.7 trillion, in 2011.
Health spending as a share of gross domestic product also fell slightly, from 17.3% in 2011 to 17.2% in 2012.
According to the report, this low growth was driven by slower growth in expenditures on prescription drugs, nursing homes, private health insurance, and Medicare.
On the other hand, growth accelerated for hospital expenditures, physician and clinical services, home healthcare, Medicaid, and out-of-pocket spending.
An article summarizing these findings appears in the January issue of Health Affairs. The full report is available on the CMS National Health Expenditures website.
Areas of slow growth
Medicare spending growth increased by 4.8% in 2012, to reach $572.5 billion, but this was a slight slowdown compared to the 5.0% growth seen in 2011. Medicare expenditures represented 20% of national health spending in 2012.
Retail prescription drug spending also slowed in 2012, growing 0.4%, compared to 2.5% in 2011. This was the result of numerous drugs losing their patent protection, which lead to increased sales of lower-cost generics.
Private health insurance spending increased 3.2% in 2012, compared to 3.4% growth in 2011. The net cost ratio for private health insurance—the difference between premiums and benefits as a share of premiums—was 12.0% in 2012 and 12.4% in 2011.
Spending for freestanding nursing care facilities and continuing-care retirement communities increased by 1.6% in 2012, down from 4.3% growth in 2011, due to a one-time Medicare rate adjustment for skilled nursing facilities.
Accelerated spending
Total Medicaid spending grew 3.3% in 2012, to reach $421.2 billion, an increase over the 2.4% growth seen in 2011. Federal Medicaid expenditures decreased 4.2% in 2012, while state and local Medicaid expenditures grew 15.0%—a result of the expiration of enhanced federal aid to states in the middle of 2011.
Hospital spending increased 4.9% in 2012, up from the 3.5% growth seen in 2011. The accelerated growth in 2012 was influenced by a growth in prices, as well as increased use and intensity of services. Growth in spending from Medicare, Medicaid, and private health insurance hospital spending all accelerated in 2012 compared to 2011.
Spending on home healthcare increased 5.1% in 2012, up from 4.1% growth in 2011. Medicare and Medicaid spending accounted for about 81% of total home healthcare spending in 2012. Medicare spending grew at a faster rate in 2012, but Medicaid spending slowed.
Physician and clinical services spending grew 4.6% in 2012, compared to 4.1% growth in 2011.
Although the growth in prices slowed slightly in 2012, non-price factors such as the use and intensity of services increased faster in 2012.
Out-of-pocket spending increased 3.8% in 2012, to $328.2 billion, up from 3.5% growth in 2011. According to CMS, this reflects higher cost-sharing and increased enrollment in consumer-directed health plans. ![]()
Internists may be ill-equipped to care for childhood cancer survivors

Credit: CDC
A survey of general internists suggests a few obstacles may prevent these physicians from providing optimal care for childhood cancer survivors.
Most of the internists surveyed were unfamiliar with surveillance guidelines, felt “somewhat uncomfortable” caring for childhood cancer survivors, and would prefer to follow patients in collaboration with a cancer center.
Nevertheless, about half of the survey respondents had recently cared for at least 1 childhood cancer survivor.
And a majority of these physicians said they never received a summary of their patients’ cancer treatment.
Eugene Suh, MD, of Loyola University Medical Center in Maywood, Illinois, and his colleagues reported these findings in Annals of Internal Medicine.
The researchers surveyed 1110 general internists, gauging their care preferences, comfort levels with caring for childhood cancer survivors, and knowledge of surveillance guidelines.
Only 36.9% of respondents said they were “somewhat comfortable” or “comfortable” caring for survivors of Hodgkin lymphoma. Twenty-seven percent felt the same about survivors of acute lymphoblastic leukemia. And 25% felt that way about osteosarcoma survivors.
In all, 51.1% of respondents had cared for at least 1 childhood cancer survivor in the 5 years preceding the survey. But 72% of these physicians had never received treatment summaries for these patients.
Eighty-four percent of respondents said they would prefer to treat childhood cancer survivors in collaboration with a physician based at a cancer center or a long-term follow-up clinic. And 10.5% said they would refer survivors to a cancer center-based physician, long-term follow-up clinic, or another primary care physician.
Only 12% of respondents said they felt at least “somewhat familiar” with surveillance guidelines. And the internists’ responses to a vignette case supported this answer.
The survey included questions about surveillance for a hypothetical 16-year-old Hodgkin lymphoma survivor who had received mantle radiation and anthracycline chemotherapy.
Ninety-one percent of respondents failed to recommend appropriate breast cancer surveillance for this patient, 85% did not recommend appropriate cardiac surveillance, and 24% failed to recommend appropriate thyroid surveillance.
Dr Suh and his colleagues said these results suggest a need for improved education among general internists but also the need for better collaboration between oncologists and primary care physicians.
A related editorial includes suggestions for educational initiatives. ![]()
Credit: CDC
A survey of general internists suggests a few obstacles may prevent these physicians from providing optimal care for childhood cancer survivors.
Most of the internists surveyed were unfamiliar with surveillance guidelines, felt “somewhat uncomfortable” caring for childhood cancer survivors, and would prefer to follow patients in collaboration with a cancer center.
Nevertheless, about half of the survey respondents had recently cared for at least 1 childhood cancer survivor.
And a majority of these physicians said they never received a summary of their patients’ cancer treatment.
Eugene Suh, MD, of Loyola University Medical Center in Maywood, Illinois, and his colleagues reported these findings in Annals of Internal Medicine.
The researchers surveyed 1110 general internists, gauging their care preferences, comfort levels with caring for childhood cancer survivors, and knowledge of surveillance guidelines.
Only 36.9% of respondents said they were “somewhat comfortable” or “comfortable” caring for survivors of Hodgkin lymphoma. Twenty-seven percent felt the same about survivors of acute lymphoblastic leukemia. And 25% felt that way about osteosarcoma survivors.
In all, 51.1% of respondents had cared for at least 1 childhood cancer survivor in the 5 years preceding the survey. But 72% of these physicians had never received treatment summaries for these patients.
Eighty-four percent of respondents said they would prefer to treat childhood cancer survivors in collaboration with a physician based at a cancer center or a long-term follow-up clinic. And 10.5% said they would refer survivors to a cancer center-based physician, long-term follow-up clinic, or another primary care physician.
Only 12% of respondents said they felt at least “somewhat familiar” with surveillance guidelines. And the internists’ responses to a vignette case supported this answer.
The survey included questions about surveillance for a hypothetical 16-year-old Hodgkin lymphoma survivor who had received mantle radiation and anthracycline chemotherapy.
Ninety-one percent of respondents failed to recommend appropriate breast cancer surveillance for this patient, 85% did not recommend appropriate cardiac surveillance, and 24% failed to recommend appropriate thyroid surveillance.
Dr Suh and his colleagues said these results suggest a need for improved education among general internists but also the need for better collaboration between oncologists and primary care physicians.
A related editorial includes suggestions for educational initiatives.
Out-of-pocket costs hinder adherence to imatinib

Credit: CDC
When their share of prescription costs becomes too high, many patients with chronic myeloid leukemia (CML) will skip doses of imatinib or stop taking the drug entirely, new research suggests.
In a study of about 1500 patients, the median co-payment for an imatinib prescription was about $30 per fill, but the range was $0 to $4792.
Patients with higher co-payments were 70% more likely than their peers to stop taking imatinib and 42% more likely to skip doses of the drug.
Stacie B. Dusetzina, PhD, of the University of North Carolina at Chapel Hill, and her colleagues conducted this research and described the results in the Journal of Clinical Oncology.
Co-payment requirements vary
The researchers analyzed health plan claims from privately insured adults (ages 18 to 64) from 2002 to 2011. The data included 1541 CML patients beginning treatment with imatinib.
For the whole study period, the mean co-payment was $108 for a 30-day supply of imatinib. Patients in the lowest 25th percentile paid a mean of $17, and patients in the upper 75th percentile paid a mean of $53.
As expected, monthly co-payments increased over time. They averaged $55 in 2002 and $145 in 2011, with 6.4% of patients paying more than $500 a month.
Dr Dusetzina noted that the data only included patients on employer-based insurance plans, and most individuals had low out-of-pocket costs.
“We studied people who are part of large employer groups, so their insurance is probably more generous than someone who is buying insurance on a private market that does not have a lot of negotiating power,” she said.
Costs correlate with adherence
In the first 180 days of treatment, 30% of patients with higher co-payments were non-adherent to imatinib treatment, compared to 21% of patients with lower co-payments. Non-adherence was defined as having less than 80% of days with imatinib available.
Seventeen percent of patients with higher co-payments discontinued taking imatinib, compared to 10% of patients with lower co-payments. Discontinuation was defined as having a gap of more than 60 days after the exhaustion of imatinib therapy.
These data did not include patients who could not begin taking imatinib due to costs. Therefore, Dr Dusetzina said this study likely underestimates the effects of drug costs on treatment adherence.
“If you went to the pharmacy to obtain your prescription, and they said it was $5000, and you walked away because you couldn’t afford to pay, you’re not in the data,” she said. “We could only study individuals who filled at least one prescription.”
Dr Dusetzina also said these findings have implications beyond imatinib and CML. Many new treatments for rare conditions can cost insurers and patients more than $100,000 year.
“Our results are particularly relevant for specialty pharmaceutical products—those that cost over $10,000 a month,” she said.
“However, the lessons learned likely relate to any pharmaceutical product that has high out-of-pocket costs. It is important that we identify strategies to make effective but expensive medications more affordable to patients.”
Promoting gender equity at scientific meetings

Credit: Darren Baker
Women are underrepresented among speakers at scientific meetings, but a new study has revealed a way to address this deficit.
An analysis of 460 scientific sessions showed that including at least 1 woman on a convening committee can increase the proportion of female speakers by as much as 86%.
And it significantly reduced the likelihood that a session would have an all-male list of speakers.
Arturo Casadevall, MD, PhD, of the Albert Einstein College of Medicine in the Bronx, New York, and Jo Handelsman, PhD, of Yale University in New Haven, Connecticut, recounted these discoveries in mBio.
The pair had analyzed data from 2 large meetings sponsored by the American Society for Microbiology—the General Meeting (GM) and the Interscience Conference on Antimicrobial Agents and Chemotherapy (ICAAC).
The data included 1845 speakers at 460 sessions from the annual meetings in 2011, 2012, and 2013.
The researchers classified sessions according to whether they had been convened by 2 men, a man and a woman, or 2 women, then tallied the gender representation among speakers for each symposium.
Despite differences in the operating procedures for the 2 meetings, the results for the GMs and ICAAC meetings closely paralleled one another. For both, there was a positive correlation between the participation of women as session conveners and participation by female scientists in those sessions.
At the 3 GMs, 104 sessions were convened by all-male teams, and 112 sessions had at least 1 female convener.
Sessions convened by 2 men had an average of 25% female speakers. And sessions including at least 1 female convener had an average of 43% female speakers, for a 72% increase in women speakers.
On average, 30% of GM sessions had all-male speakers if the conveners were both males. But 8.9% of the convener teams containing at least 1 woman had an all-male list of speakers (P=0.0002).
At the 3 ICAAC meetings, 145 sessions were convened by male-only teams, and 99 had at least 1 female convener.
Including at least 1 woman in the convening team increased the proportion of female speakers by 74%. Including a women also significantly reduced the number of sessions with all-male speakers (P=0.0042).
Dr Casadeveall cautioned that this study revealed correlations, not proof of causation. And further research is needed to explain why the presence of a woman on a convening committee is correlated with increased numbers of female speakers.
But the data suggest that involving women as conveners could have a significant effect on the gender distribution of the speakers and promote gender equity.
“Meeting program committees could carefully consider the gender composition of those assigned to pull together scientific sessions,” Dr Casadevall said, “and make efforts to involve women scientists as conveners for sessions and symposia.”