User login
Product Update
EASIER COLORECTAL CANCER SCREENING
Cologuard® from Exact Sciences is a new, FDA-approved, noninvasive stool DNA screening test for colorectal cancer. Cologuard has been proven to find 92% of colorectal cancers in average risk patients with 87% specificity. Available by prescription for people aged 50 years and older who are at average risk for colorectal cancer, Cologuard does not require medication, dietary restrictions, or prior bowel preparation.
FOR MORE INFORMATION, VISIT www.exactsciences.com
FRONT-CLOSURE SURGICAL BRA
Elizabeth Pink Surgical Bra™ from BFFL Co allows for mild compression and stretch, with a Velcro front closure and adjustable, padded shoulder straps. The pink bra has patent-pending side-drain openings to accommodate JP drain exit placement. JP drain bulbs can be attached to a loop and ring, eliminating the need for wearing a pouch or fanny pack during recovery.
FOR MORE INFORMATION, VISIT http://bfflco.com/
16-POCKET LAB COATS FOR MEN AND WOMEN
SCOTTeVEST has a new line of SeV lab coats styled for men and women with 16 pockets to carry medical devices and personal electronics. Some pockets are hidden for added security. The exterior white fabric is stain- and water-resistant and can be laundered and sanitized.
FOR MORE INFORMATION, VISIT www.scottevest.com
LAPAROSCOPIC SMOKE EVACUATION SYSTEM
The Plume-Away® Smoke Evacuation System is now available to clinical users, reports CooperSurgical. The passive, disposable, multi-stage system traps smoke, particulates, and aerosolized pathogens while an activated charcoal membrane absorbs odors and chemical toxins. CooperSurgical claims the system removes 99.999% of 0.01 μm particles from surgical procedure sites, while the air-flow rate remains steady.
FOR MORE INFORMATION, VISIT www.CooperSurgical.com
NEW BABY BOTTLE DESIGN PREVENTS COLIC
Difrax claims the design of its S-Bottles allows the baby to swallow less air and therefore have less trouble with burping, vomiting, colic, and earache. When the bottle is being used, the teat is constantly filled with liquid and a valve in the bottle’s base prevents vacuum suction. A bottle warmer is available.
FOR MORE INFORMATION, VISIT www.difraxusa.com
HOME-USE CONCEPTION ASSISTANCE DEVICE
Rinovum Women’s Health announced that The Stork® OTC, a conception-assistance device, is now available without a prescription in stores and online. Rinovum claims that The Stork OTC is a safe, easy way to perform cervical cap insemination at home, without drugs or invasive procedures.
FOR MORE INFORMATION, VISIT www.storkotc.com
MEASURE LIPIDS & GLUCOSE IN 2 MINUTES
The LipidPlus® Lipid Profile and Glucose Measuring System from JANT Pharmacal Corporation uses a single test strip to measure total cholesterol, high-density lipoprotein (HDL), triglycerides, and to calculate low-density lipoprotein (LDL) with results in 2 minutes. Lipid and glucose test strips do not require refrigeration, and require a small blood sample. The system includes an analyzer that can store up to 200 results.
FOR MORE INFORMATION, VISIT www.lipidplus.com
ENCOURAGING BREAST SELF-EXAM
Circuelle™ Breast Ritual Crème is intended for use during twice-monthly breast self-examinations in the shower or bath. Circuelle claims that the lotion’s texture enables a woman’s fingertips to glide across her breast and underarm areas so she will notice something different, such as thickened skin, a lump, or change in the nipple. The moisturizing cream is paraben-, phthalate-, and petroleum-free, with organically derived ingredients including evening primrose oil, green tea extract, vitamins D and E, and essential oils. Circuelle also offers a Guide to Breast Self-Examination and tips to reduce the risk of breast cancer on its Web site.
FOR MORE INFORMATION, VISIT www.circuelle.com
RF DETECTION SYSTEM FOR L&D UNITS
RF Surgical Systems says it designed the RF Assure Delivery System for the labor and delivery (L&D) environment to locate and prevent the loss of sponges, towels, and gauze during vaginal delivery. After birth, a clinician uses the Verisphere sensor to scan the mother’s pelvic area and L&D room to obtain an accurate count of radio-frequency (RF) tag-embedded items.
FOR MORE INFORMATION, VISIT www.rfsurg.com
NEW WEB SITE FOR FERTILITY RESOURCES
Advanced Reproductive Care Inc. offers a full suite of products, services, and resources for infertility through its new Web site. There, patients can access a nationwide network of fertility services, from fertility treatment package options and payment plans to articles, newsletters, and informational videos addressing common questions and treatment options.
FOR MORE INFORMATION, VISIT www.arcfertility.com
EXCHANGE DATA USING PATIENTGRAPH
CareConnectors™ says that its PatientGraph™ software enables patients and health-care providers and enterprises to exchange traditional and nontraditional health-care data in a secure, HIPAA-compliant system. The 3-component platform allows trusted parties (including patients) to share information with authorized providers, devices, and services; provides programming interfaces to aid workflow; and offers software development kits to allow customization.
FOR MORE INFORMATION, VISIT www.careconnectors.com
Preventing, treating HBV reactivation during immunosuppressive therapy
Patients who are to undergo immunosuppressive therapy but are at high risk for reactivation of hepatitis B infection should receive antiviral prophylaxis, rather than being monitored for reactivation and treated only if it develops, according to a new guideline published online in Gastroenterology.
The American Gastroenterological Association conducted a rigorous review of the available evidence and compiled seven recommendations to guide clinicians and researchers in preventing HBV reactivation before patients initiate immunosuppressive therapy and in treating reactivated HBV if it arises during immunosuppressive therapy. “Despite the large number of published studies, in most cases our recommendations are weak because either (1) the quality of the available data and/or the baseline risk of HBV reactivation is low or uncertain, and/or (2) the balance of risks and benefits for a particular strategy does not overwhelmingly support its use,” said Dr. K. Rajender Reddy, lead writer of the guideline and professor of gastroenterology and hepatology at the University of Pennsylvania, Philadelphia, and his associates.

In contrast, the data supporting the recommendation to provide prophylaxis for high-risk patients are moderately robust, so that recommendation is strong, they noted.
Patients’ level of risk is based on their HBV serologic status and the type of immunosuppression they require. For example, patients are considered at high risk for HBV reactivation if they are hepatitis B surface antigen (HBsAg) positive/anti–hepatitis B core (HBc) positive or are HBsAg negative/anti-HBc positive and are to be treated with B-cell–depleting agents such as rituximab or ofatumumab. Also at high risk are HBsAg-positive/anti-HBc–positive patients to be treated with anthracycline derivatives such as doxorubicin or epirubicin, and HBsAg-positive/anti-HBc–positive patients to be treated with moderate- or high-dose corticosteroids for 4 weeks or longer.
In these high-risk patients, antiviral prophylaxis is definitely warranted, and it should extend for at least 6 months after the immunosuppressive therapy is completed, according to the guideline. In contrast, antiviral prophylaxis is “suggested” for moderate-risk patients, but those who place a higher value on avoiding antivirals and a lower value on avoiding HBV reactivation “may reasonably select no prophylaxis over antiviral prophylaxis,” Dr. Reddy and his associates said.
In contrast, routine antiviral prophylaxis is not recommended for patients undergoing immunosuppressive therapy who are at low risk for HBV reactivation.
Other recommendations in the new guideline concern which antiviral agents are preferred in different situations. The AGA strongly recommends antivirals that have a high barrier to resistance, in preference to lamivudine, in most patients. But it acknowledges that the evidence comparing various antivirals is weak, and that the drugs vary considerably in price. “Patients who put a higher value on cost and a lower value on avoiding the potentially small risk of resistance development may reasonably select the least expensive antiviral hepatitis B medication over more expensive antiviral drugs with a higher barrier to resistance,” Dr. Reddy and his associates said (Gastroenterol. 2014 [doi:10.1053/j.gastro.2014.10.039]).
The evidence regarding patient monitoring for HBV reactivation instead of prophylaxis is so sparse that the AGA makes no recommendation for or against this strategy at present. Most studies of the issue are of poor quality, use different definitions of HBV reactivation, have inconsistent reporting of patient outcomes, and disagree about the best methods and frequency of HBV DNA monitoring. Moreover, frequent monitoring requires “considerable” personnel resources, and the methods used in clinical studies may not even be adaptable to real world practice, the investigators said.
Patients who are to undergo immunosuppressive therapy but are at high risk for reactivation of hepatitis B infection should receive antiviral prophylaxis, rather than being monitored for reactivation and treated only if it develops, according to a new guideline published online in Gastroenterology.
The American Gastroenterological Association conducted a rigorous review of the available evidence and compiled seven recommendations to guide clinicians and researchers in preventing HBV reactivation before patients initiate immunosuppressive therapy and in treating reactivated HBV if it arises during immunosuppressive therapy. “Despite the large number of published studies, in most cases our recommendations are weak because either (1) the quality of the available data and/or the baseline risk of HBV reactivation is low or uncertain, and/or (2) the balance of risks and benefits for a particular strategy does not overwhelmingly support its use,” said Dr. K. Rajender Reddy, lead writer of the guideline and professor of gastroenterology and hepatology at the University of Pennsylvania, Philadelphia, and his associates.
In contrast, the data supporting the recommendation to provide prophylaxis for high-risk patients are moderately robust, so that recommendation is strong, they noted.
Patients’ level of risk is based on their HBV serologic status and the type of immunosuppression they require. For example, patients are considered at high risk for HBV reactivation if they are hepatitis B surface antigen (HBsAg) positive/anti–hepatitis B core (HBc) positive or are HBsAg negative/anti-HBc positive and are to be treated with B-cell–depleting agents such as rituximab or ofatumumab. Also at high risk are HBsAg-positive/anti-HBc–positive patients to be treated with anthracycline derivatives such as doxorubicin or epirubicin, and HBsAg-positive/anti-HBc–positive patients to be treated with moderate- or high-dose corticosteroids for 4 weeks or longer.
In these high-risk patients, antiviral prophylaxis is definitely warranted, and it should extend for at least 6 months after the immunosuppressive therapy is completed, according to the guideline. In contrast, antiviral prophylaxis is “suggested” for moderate-risk patients, but those who place a higher value on avoiding antivirals and a lower value on avoiding HBV reactivation “may reasonably select no prophylaxis over antiviral prophylaxis,” Dr. Reddy and his associates said.
In contrast, routine antiviral prophylaxis is not recommended for patients undergoing immunosuppressive therapy who are at low risk for HBV reactivation.
Other recommendations in the new guideline concern which antiviral agents are preferred in different situations. The AGA strongly recommends antivirals that have a high barrier to resistance, in preference to lamivudine, in most patients. But it acknowledges that the evidence comparing various antivirals is weak, and that the drugs vary considerably in price. “Patients who put a higher value on cost and a lower value on avoiding the potentially small risk of resistance development may reasonably select the least expensive antiviral hepatitis B medication over more expensive antiviral drugs with a higher barrier to resistance,” Dr. Reddy and his associates said (Gastroenterol. 2014 [doi:10.1053/j.gastro.2014.10.039]).
The evidence regarding patient monitoring for HBV reactivation instead of prophylaxis is so sparse that the AGA makes no recommendation for or against this strategy at present. Most studies of the issue are of poor quality, use different definitions of HBV reactivation, have inconsistent reporting of patient outcomes, and disagree about the best methods and frequency of HBV DNA monitoring. Moreover, frequent monitoring requires “considerable” personnel resources, and the methods used in clinical studies may not even be adaptable to real world practice, the investigators said.
FROM GASTROENTEROLOGY
Key clinical point: The American Gastroenterological Association published a guideline for preventing the reactivation of HBV in patients who need immunosuppressive therapy and for treating reactivated HBV when it develops in patients undergoing immunosuppression.
Major finding: Robust evidence supports the recommendation that antiviral prophylaxis is warranted in patients at high risk for HBV reactivation, “suggested” for patients at moderate risk, and not recommended for patients at low risk.
Data source: A rigorous review and summary of the available evidence regarding prevention and treatment of HBV reactivation, and a compilation of recommendations for clinicians and researchers.
Disclosures: Dr. Reddy and his associates’ disclosure statements are available at the American Gastroenterological Association, Bethesda, Md. .

Hemorrhagic Bullous Lesions Due to Bacillus cereus in a Cirrhotic Patient
To the Editor:
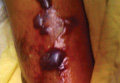
A 42-year-old man with hypertension, hypothyroidism, and alcohol-related cirrhosis was admitted for evaluation of rapidly deteriorating mental status. He was referred from a rehabilitation facility where he had been admitted 4 days earlier after a hospitalization for hepatorenal syndrome and pneumonia. He was alert and ambulating until the day of the current admission. On arrival he was hypotensive(54/42 mm Hg); hypothermic (35°C, rectally); and unresponsive, except to painful stimuli. Jaundice, hepatosplenomegaly, ascites, and bilateral lower extremity edema were noted. There were multiple tense and flaccid bullous lesions containing serosanguineous fluid over both tibias and calves, without crepitus (Figure 1).

|

|
|
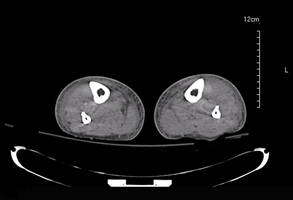
Laboratory test results revealed leukocytosis (total leukocytes, 10,900/mm3 [reference range, 4500–10,800/mm3), hypoglycemia (glucose, <20 mg/dL [reference range, 74–106 mg/dL]), renal insufficiency (serum creatinine, 2.5 mg/dL [reference range, 0.66–1.25 mg/dL]), metabolic acidosis (pH, 7.1 [reference range, 7.35–7.45]; bicarbonate, 13 mmol/L [reference range, 22–30 mmol/L]; lactic acid, 11.9 mmol/L [reference range, 0.7–2.1 mmol/L]), liver dysfunction (aspartate aminotransferase, 576 IU/L [reference range, 15–46 IU/L]), and coagulopathy with evidence of diffuse intravascular coagulation (total platelets, 75,000/mm3 [reference range, 150,000–450,000/mm3]; international normalized ratio, 9.5 [reference range, 0.8–1.2]; partial thromboplastin time, 108 seconds [reference range 23.0–35.0 seconds]; fibrinogen, 145 mg/dL [reference range, 228–501 mg/dL]; D-dimer, >20 µg/mL [reference range, 0.01–0.58 μg/mL]). Computed tomography of the pelvis and legs showed ascites, extensive subcutaneous edema, and cutaneous blisterlike lesions superior to the level of the ankles bilaterally. No gas, foreign bodies, collections, asymmetric facial thickening, or evidence of infection across tissue planes was present (Figures 2 and 3).
Specimens of blood and aspirates from the bullae at multiple lower leg sites were sent for microbiologic evaluation. The blood specimens were inoculated at bedside into aerobic and anaerobic blood culture bottles and incubated in an automated blood culture system. The aspirate samples were inoculated to trypticase soy agar with 5% sheep blood, Columbia-nalidixic acid agar, chocolate agar, MacConkey agar, and thioglycollate broth, which were incubated at 37ºC in air supplemented with 5% CO2, and to CDC anaerobic blood agar, which was incubated under anaerobic conditions. Gram-stained smears of the aspirates from the bullae demonstrated few granulocytes and numerous large gram-positive bacilli (Figure 4). By the next day, growth of large gram-positive bacilli was detected in both aerobic and anaerobic blood culture bottles and in pure culture from all the bullae samples. The bacterial colonies on sheep blood agar were opaque and white-gray in color, with a rough surface, undulate margins, and surrounding β hemolysis. The isolate was a motile, catalase-positive, arginine-positive, salicin-positive, lecithinase-positive, and penicillin-resistant organism that was identified as Bacillus cereus.
Antimicrobial susceptibility testing for B cereus has not been standardized, but evaluation by broth microdilution suggested decreased susceptibility to penicillin (minimum inhibitory concentration [MIC], 2 µg/mL) and clindamycin (MIC, 2 µg/mL), but retained susceptibility to ciprofloxacin (MIC, ≤0.25 µg/mL), tetracycline (MIC, ≤1 µg/mL), rifampin (MIC, ≤1 µg/mL), and vancomycin (MIC, ≤2 µg/mL).
The patient was admitted to the intensive care unit and was treated initially with fluid resuscitation; transfusions; ventilatory support; and intravenous vancomycin, clindamycin, and imipenem. This regimen was changed to vancomycin and ciprofloxacin when culture and susceptibility results became available to complete a 14-day course. Signs of sepsis resolved and the mental status and skin lesions improved. Ultimately, the patient died due to complications of hepatic failure.
Bacillus cereus is a rod-shaped, gram-positive, facultative, aerobic organism that is widely distributed in the environment.1 Spore formation makes B cereus resistant to most physical and chemical disinfection methods; as a consequence, it is a frequent contaminant in materials (eg, plants, dust, soil, sediment), foodstuffs, and clinical specimens.1
Traditionally considered in the context of foodborne illness, B cereus is recognized increasingly as a cause of systemic and local infections in both immunosuppressed and immunocompetent patients. Nongastrointestinal infections reported include fulminant bacteremia, pneumonia, meningitis, brain abscesses, endophthalmitis, necrotizing fasciitis, and central line catheter–related and cutaneous infections.1,2

Cutaneous lesions may have a variety of forms and appearance at initial presentation, including small papules or vesicles that progress into a rapidly spreading cellulitis1,2 with a characteristic serosanguineous draining fluid,2 single necrotic bullae,3 and gas-gangrenelike infections with extensive soft tissue involvement resembling clostridial myonecrosis.1,4 Single or multiple papulovesicular lesions can even mimic cutaneous anthrax.1-4 Necrotic or hemorrhagic bullous lesions,3 such as those observed in our patient, are rare.
Exposed areas such as extremities and digits are most often affected, presumably due to entrance of spores from soil, water, decaying organic material, or fomites through skin microabrasions or trauma-induced wounds.1 Once in the tissue, the crystalline surface protein layer (S-layer) of the bacilli promotes adhesion to human epithelial cells and neutrophils,5 followed by release of virulence factors including proteases, collagenases, lecithinaselike enzymes, necrotizing exotoxinlike hemolysins, phospholipases, and most importantly a dermonecrotic vascular permeability factor.1,5 Toxins produced by B cereus are similar to those closely related to Bacillus anthracis, the agent of anthrax.1,2
When large gram-positive bacilli are observed in tissue or wound specimens, initial therapy should address both aerobic (Bacillus species) and anaerobic (Clostridium species) organisms.1,4,6 Once B cereus is recovered, treatment should rely on susceptibility testing of the isolate. Bacillus cereus produces ß-lactamase, thus penicillin and cephalosporin should be avoided.1 Vancomycin, clindamycin, aminoglycosides, and fluoroquinolones are the drugs of choice.1,3,4,6 Daptomycin and linezolid also are active in vitro,1 but clinical experience with these agents is limited. Necrotic infection or deep tissue involvement requires surgical intervention.
Numerous other organisms can cause cellulitis and soft tissue infections with hemorrhagic bullae.1,3,6 Streptococci, particularly Streptococcus pyogenes, and occasionally staphylococci are the primary consideration in normal hosts without trauma.3,6 In immunocompromised patients, including those with cirrhosis, diabetes mellitus, and malignancy, Clostridium perfringens and gram-negative organisms such as Escherichia coli, other enteric bacteria including Pseudomonas aeruginosa, Aeromonas, and halophilic Vibrio species are more frequent.3,6
We describe a patient with underlying cirrhosis who developed bilateral lower extremity hemorrhagic bullous lesions and sepsis due to infection with B cereus, an emerging cause of serious infections in patients with underlying immunocompromising conditions such as cirrhosis, diabetes mellitus, and malignancy. Hemorrhagic bullae in immunocompromised patients are associated with sepsis and rapidly progressive illness, and rapid treatment is essential. Bacillus cereus should be included as a consideration in the differential diagnosis and management of patients presenting with bullous cellulitis and sepsis.
1. Bottone EJ. Bacillus cereus, a volatile human pathogen. Clin Microbiol Rev. 2010;23:382-398.
2. Henrickson KJ. A second species of bacillus causing primary cutaneous disease. Int J Dermatol. 1990;29:19-20.
3. Liu BM, Hsiao CT, Chung KJ, et al. Hemorrhagic bullae represent an ominous sign for cirrhotic patients [published online ahead of print November 5, 2007]. J Emer Med. 2008;34:277-281.
4. Meredith FT, Fowler VG, Gautier M, et al. Bacillus cereus necrotizing cellulitis mimicking clostridial myonecrosis: case report and review of the literature. Scand J Infect Dis. 1997;29:528-529.
5. Kotiranta A, Lounatmaa K, Haapasalo M. Epidemiology and pathogenesis of Bacillus cereus infections. Microbes Infect. 2000;2:189-198.
6. Lee CC, Chi CH, Lee NY, et al. Necrotizing fasciitis in patients with liver cirrhosis: predominance of monomicrobial gram-negative bacillary infections [published online ahead of print July 23, 2008]. Diagn Microbiol Infect Dis. 2008;62:219-225.
To the Editor:
A 42-year-old man with hypertension, hypothyroidism, and alcohol-related cirrhosis was admitted for evaluation of rapidly deteriorating mental status. He was referred from a rehabilitation facility where he had been admitted 4 days earlier after a hospitalization for hepatorenal syndrome and pneumonia. He was alert and ambulating until the day of the current admission. On arrival he was hypotensive(54/42 mm Hg); hypothermic (35°C, rectally); and unresponsive, except to painful stimuli. Jaundice, hepatosplenomegaly, ascites, and bilateral lower extremity edema were noted. There were multiple tense and flaccid bullous lesions containing serosanguineous fluid over both tibias and calves, without crepitus (Figure 1).
|
|
|
|
|
|
Laboratory test results revealed leukocytosis (total leukocytes, 10,900/mm3 [reference range, 4500–10,800/mm3), hypoglycemia (glucose, <20 mg/dL [reference range, 74–106 mg/dL]), renal insufficiency (serum creatinine, 2.5 mg/dL [reference range, 0.66–1.25 mg/dL]), metabolic acidosis (pH, 7.1 [reference range, 7.35–7.45]; bicarbonate, 13 mmol/L [reference range, 22–30 mmol/L]; lactic acid, 11.9 mmol/L [reference range, 0.7–2.1 mmol/L]), liver dysfunction (aspartate aminotransferase, 576 IU/L [reference range, 15–46 IU/L]), and coagulopathy with evidence of diffuse intravascular coagulation (total platelets, 75,000/mm3 [reference range, 150,000–450,000/mm3]; international normalized ratio, 9.5 [reference range, 0.8–1.2]; partial thromboplastin time, 108 seconds [reference range 23.0–35.0 seconds]; fibrinogen, 145 mg/dL [reference range, 228–501 mg/dL]; D-dimer, >20 µg/mL [reference range, 0.01–0.58 μg/mL]). Computed tomography of the pelvis and legs showed ascites, extensive subcutaneous edema, and cutaneous blisterlike lesions superior to the level of the ankles bilaterally. No gas, foreign bodies, collections, asymmetric facial thickening, or evidence of infection across tissue planes was present (Figures 2 and 3).
Specimens of blood and aspirates from the bullae at multiple lower leg sites were sent for microbiologic evaluation. The blood specimens were inoculated at bedside into aerobic and anaerobic blood culture bottles and incubated in an automated blood culture system. The aspirate samples were inoculated to trypticase soy agar with 5% sheep blood, Columbia-nalidixic acid agar, chocolate agar, MacConkey agar, and thioglycollate broth, which were incubated at 37ºC in air supplemented with 5% CO2, and to CDC anaerobic blood agar, which was incubated under anaerobic conditions. Gram-stained smears of the aspirates from the bullae demonstrated few granulocytes and numerous large gram-positive bacilli (Figure 4). By the next day, growth of large gram-positive bacilli was detected in both aerobic and anaerobic blood culture bottles and in pure culture from all the bullae samples. The bacterial colonies on sheep blood agar were opaque and white-gray in color, with a rough surface, undulate margins, and surrounding β hemolysis. The isolate was a motile, catalase-positive, arginine-positive, salicin-positive, lecithinase-positive, and penicillin-resistant organism that was identified as Bacillus cereus.
Antimicrobial susceptibility testing for B cereus has not been standardized, but evaluation by broth microdilution suggested decreased susceptibility to penicillin (minimum inhibitory concentration [MIC], 2 µg/mL) and clindamycin (MIC, 2 µg/mL), but retained susceptibility to ciprofloxacin (MIC, ≤0.25 µg/mL), tetracycline (MIC, ≤1 µg/mL), rifampin (MIC, ≤1 µg/mL), and vancomycin (MIC, ≤2 µg/mL).
The patient was admitted to the intensive care unit and was treated initially with fluid resuscitation; transfusions; ventilatory support; and intravenous vancomycin, clindamycin, and imipenem. This regimen was changed to vancomycin and ciprofloxacin when culture and susceptibility results became available to complete a 14-day course. Signs of sepsis resolved and the mental status and skin lesions improved. Ultimately, the patient died due to complications of hepatic failure.
Bacillus cereus is a rod-shaped, gram-positive, facultative, aerobic organism that is widely distributed in the environment.1 Spore formation makes B cereus resistant to most physical and chemical disinfection methods; as a consequence, it is a frequent contaminant in materials (eg, plants, dust, soil, sediment), foodstuffs, and clinical specimens.1
Traditionally considered in the context of foodborne illness, B cereus is recognized increasingly as a cause of systemic and local infections in both immunosuppressed and immunocompetent patients. Nongastrointestinal infections reported include fulminant bacteremia, pneumonia, meningitis, brain abscesses, endophthalmitis, necrotizing fasciitis, and central line catheter–related and cutaneous infections.1,2
Cutaneous lesions may have a variety of forms and appearance at initial presentation, including small papules or vesicles that progress into a rapidly spreading cellulitis1,2 with a characteristic serosanguineous draining fluid,2 single necrotic bullae,3 and gas-gangrenelike infections with extensive soft tissue involvement resembling clostridial myonecrosis.1,4 Single or multiple papulovesicular lesions can even mimic cutaneous anthrax.1-4 Necrotic or hemorrhagic bullous lesions,3 such as those observed in our patient, are rare.
Exposed areas such as extremities and digits are most often affected, presumably due to entrance of spores from soil, water, decaying organic material, or fomites through skin microabrasions or trauma-induced wounds.1 Once in the tissue, the crystalline surface protein layer (S-layer) of the bacilli promotes adhesion to human epithelial cells and neutrophils,5 followed by release of virulence factors including proteases, collagenases, lecithinaselike enzymes, necrotizing exotoxinlike hemolysins, phospholipases, and most importantly a dermonecrotic vascular permeability factor.1,5 Toxins produced by B cereus are similar to those closely related to Bacillus anthracis, the agent of anthrax.1,2
When large gram-positive bacilli are observed in tissue or wound specimens, initial therapy should address both aerobic (Bacillus species) and anaerobic (Clostridium species) organisms.1,4,6 Once B cereus is recovered, treatment should rely on susceptibility testing of the isolate. Bacillus cereus produces ß-lactamase, thus penicillin and cephalosporin should be avoided.1 Vancomycin, clindamycin, aminoglycosides, and fluoroquinolones are the drugs of choice.1,3,4,6 Daptomycin and linezolid also are active in vitro,1 but clinical experience with these agents is limited. Necrotic infection or deep tissue involvement requires surgical intervention.
Numerous other organisms can cause cellulitis and soft tissue infections with hemorrhagic bullae.1,3,6 Streptococci, particularly Streptococcus pyogenes, and occasionally staphylococci are the primary consideration in normal hosts without trauma.3,6 In immunocompromised patients, including those with cirrhosis, diabetes mellitus, and malignancy, Clostridium perfringens and gram-negative organisms such as Escherichia coli, other enteric bacteria including Pseudomonas aeruginosa, Aeromonas, and halophilic Vibrio species are more frequent.3,6
We describe a patient with underlying cirrhosis who developed bilateral lower extremity hemorrhagic bullous lesions and sepsis due to infection with B cereus, an emerging cause of serious infections in patients with underlying immunocompromising conditions such as cirrhosis, diabetes mellitus, and malignancy. Hemorrhagic bullae in immunocompromised patients are associated with sepsis and rapidly progressive illness, and rapid treatment is essential. Bacillus cereus should be included as a consideration in the differential diagnosis and management of patients presenting with bullous cellulitis and sepsis.
1. Bottone EJ. Bacillus cereus, a volatile human pathogen. Clin Microbiol Rev. 2010;23:382-398.
2. Henrickson KJ. A second species of bacillus causing primary cutaneous disease. Int J Dermatol. 1990;29:19-20.
3. Liu BM, Hsiao CT, Chung KJ, et al. Hemorrhagic bullae represent an ominous sign for cirrhotic patients [published online ahead of print November 5, 2007]. J Emer Med. 2008;34:277-281.
4. Meredith FT, Fowler VG, Gautier M, et al. Bacillus cereus necrotizing cellulitis mimicking clostridial myonecrosis: case report and review of the literature. Scand J Infect Dis. 1997;29:528-529.
5. Kotiranta A, Lounatmaa K, Haapasalo M. Epidemiology and pathogenesis of Bacillus cereus infections. Microbes Infect. 2000;2:189-198.
6. Lee CC, Chi CH, Lee NY, et al. Necrotizing fasciitis in patients with liver cirrhosis: predominance of monomicrobial gram-negative bacillary infections [published online ahead of print July 23, 2008]. Diagn Microbiol Infect Dis. 2008;62:219-225.
LISTEN NOW: Bob Wachter discusses ACOs, managed care, and his new book


Polypharmacy linked to increased AFib bleeding
CHICAGO – Atrial fibrillation patients treated with an anticoagulant plus four or more other medications had significantly more bleeding complications than did those on fewer medications in a retrospective study.
“This is the first study examining polypharmacy in patients with nonvalvular atrial fibrillation,” Dr. Jonathan P. Piccini said at the American Heart Association Scientific Sessions. The main consequence is, “We should do everything we can to reduce the number of medications a patient receives,” he said.

His exploratory, retrospective analysis of data from more than 14,000 patients enrolled in an anticoagulant treatment trial showed that atrial fibrillation patients on an oral anticoagulant and taking a total of 10 or more medications concurrently had a 46% increased rate of a major bleed or clinically relevant nonmajor bleed. Patients taking five to nine medications had a 17% increased rate for this primary bleeding endpoint. Both increases were statistically significant, reported Dr. Piccini, a cardiologist at Duke University in Durham, N.C. Major bleeds alone were 90% higher in patients on at least 10 drugs and 47% higher in patients on 5-9 total drugs, compared with those on 4 or fewer, also statistically significant differences.
“Increasing medication use was associated with an increased risk of bleeding but not stroke,” he said. In addition, because the data came from a large trial that had compared the new oral anticoagulant rivaroxaban (Xarelto) with warfarin, the analysis was able to show that this polypharmacy effect was similar regardless of which anticoagulant patients took.
Polypharmacy was common among the 14,264 patients (average age, 73 years) enrolled in the trial, as 51% were on 5-9 drugs and 13% were on 10 or more drugs, with a minority of 36% forming the comparator group taking 4 or fewer medications.
The analysis used data collected from 14,264 patients enrolled in the ROCKET AF (Rivaroxaban Once Daily Oral Direct Factor Xa Inhibition Compared With Vitamin K Antagonism for Prevention of Stroke and Embolism Trial in Atrial Fibrillation) trial, which was designed as a pivotal trial comparing the safety and efficacy of the new oral anticoagulant rivaroxaban with warfarin for stroke prevention in patients with nonvalvular atrial fibrillation (N. Engl. J. Med. 2011;365:883-91). Dr. Piccini and his associates assessed various measures of bleeding as well as strokes, vascular deaths, and all-cause deaths in the patients by their number of concomitant medications based on data collected at baseline when patients entered the trial. The relative hazard rates the investigators calculated were adjusted for all “clinically important covariates,” but Dr. Piccini acknowledged that residual confounding accounted for by the adjustments likely remained.
All-cause death was also significantly increased in patients taking at least 10 (a 43% increase) or 5-9 drugs (a 25% increase), compared with patients on 4 or fewer drugs. But the rate of stroke or nonstroke embolism was not significantly increased among patients on five or more drugs. The combined rate of stroke, nonstroke embolism, and vascular death was a statistically significant 25% higher in patients on at least 10 drugs, compared with those on 4 or fewer drugs, but there was no significant increase in patients on 5-9 drugs.
The link between higher numbers of concomitant medications and an increased bleeding rate likely has two explanations, Dr. Piccini said. It could happen because the drugs themselves promote bleeding, and because the need to prescribe multiple drugs is a marker for patients who are sicker and have more comorbidities and a higher underlying risk of bleeding.
ROCKET AF was sponsored by Janssen and Bayer. Dr. Piccini has been a consultant to and has received research funding from Janssen, Bayer, and several other companies.
On Twitter @mitchelzoler
The message to physicians should be to assess patients at regular intervals to make sure they really still need all their medications, and try to reduce the number whenever possible.
One of the dangers in using a new oral anticoagulant is that patients are often also taking drugs that inhibit CYP3A4 enzymes, P-glycoprotein, or both. Among patients in Dr. Piccini’s study, 19% of those on 5-9 drugs and 26% of those on 10 or more were on at least one drug that inhibited P-glycoprotein and on at least one drug that was a CYP3A4 inhibitor. The list Dr. Piccini presented of the drugs patients received that fell in this category included amiodarone, diltiazem, verapamil, and erythromycin.
Also, these patients can be on other antithrombotic or antiplatelet drugs. We regularly assess patients’ coagulation status when they are on warfarin, but not when they are on rivaroxaban or another new oral anticoagulant. If you have patients on 10 or more drugs you need to be careful, and must also determine whether they can come off any of the drugs. You need to ask yourself, “What can I stop?” This is particularly true for patients also on aspirin, a thienopyridine, or a nonsteroidal anti-inflammatory drug, which all increase bleeding risk.
Dr. Jeffrey Weitz is professor of medicine and director of the Juravinski Hospital and Cancer Centre of McMaster University in Hamilton, Ont. He has been an adviser or consultant to Janssen, Bayer, and several drug manufacturers. He made these comments in an interview.
CHICAGO – Atrial fibrillation patients treated with an anticoagulant plus four or more other medications had significantly more bleeding complications than did those on fewer medications in a retrospective study.
“This is the first study examining polypharmacy in patients with nonvalvular atrial fibrillation,” Dr. Jonathan P. Piccini said at the American Heart Association Scientific Sessions. The main consequence is, “We should do everything we can to reduce the number of medications a patient receives,” he said.
His exploratory, retrospective analysis of data from more than 14,000 patients enrolled in an anticoagulant treatment trial showed that atrial fibrillation patients on an oral anticoagulant and taking a total of 10 or more medications concurrently had a 46% increased rate of a major bleed or clinically relevant nonmajor bleed. Patients taking five to nine medications had a 17% increased rate for this primary bleeding endpoint. Both increases were statistically significant, reported Dr. Piccini, a cardiologist at Duke University in Durham, N.C. Major bleeds alone were 90% higher in patients on at least 10 drugs and 47% higher in patients on 5-9 total drugs, compared with those on 4 or fewer, also statistically significant differences.
“Increasing medication use was associated with an increased risk of bleeding but not stroke,” he said. In addition, because the data came from a large trial that had compared the new oral anticoagulant rivaroxaban (Xarelto) with warfarin, the analysis was able to show that this polypharmacy effect was similar regardless of which anticoagulant patients took.
Polypharmacy was common among the 14,264 patients (average age, 73 years) enrolled in the trial, as 51% were on 5-9 drugs and 13% were on 10 or more drugs, with a minority of 36% forming the comparator group taking 4 or fewer medications.
The analysis used data collected from 14,264 patients enrolled in the ROCKET AF (Rivaroxaban Once Daily Oral Direct Factor Xa Inhibition Compared With Vitamin K Antagonism for Prevention of Stroke and Embolism Trial in Atrial Fibrillation) trial, which was designed as a pivotal trial comparing the safety and efficacy of the new oral anticoagulant rivaroxaban with warfarin for stroke prevention in patients with nonvalvular atrial fibrillation (N. Engl. J. Med. 2011;365:883-91). Dr. Piccini and his associates assessed various measures of bleeding as well as strokes, vascular deaths, and all-cause deaths in the patients by their number of concomitant medications based on data collected at baseline when patients entered the trial. The relative hazard rates the investigators calculated were adjusted for all “clinically important covariates,” but Dr. Piccini acknowledged that residual confounding accounted for by the adjustments likely remained.
All-cause death was also significantly increased in patients taking at least 10 (a 43% increase) or 5-9 drugs (a 25% increase), compared with patients on 4 or fewer drugs. But the rate of stroke or nonstroke embolism was not significantly increased among patients on five or more drugs. The combined rate of stroke, nonstroke embolism, and vascular death was a statistically significant 25% higher in patients on at least 10 drugs, compared with those on 4 or fewer drugs, but there was no significant increase in patients on 5-9 drugs.
The link between higher numbers of concomitant medications and an increased bleeding rate likely has two explanations, Dr. Piccini said. It could happen because the drugs themselves promote bleeding, and because the need to prescribe multiple drugs is a marker for patients who are sicker and have more comorbidities and a higher underlying risk of bleeding.
ROCKET AF was sponsored by Janssen and Bayer. Dr. Piccini has been a consultant to and has received research funding from Janssen, Bayer, and several other companies.
On Twitter @mitchelzoler
AT THE AHA SCIENTIFIC SESSIONS
Key clinical point: Among atrial fibrillation patients on an oral anticoagulant, those on at least four other medications concurrently had a significantly increased bleeding rate, compared with those on three or fewer.
Major finding: Patients on 5-9 drugs had 17% more bleeds, and those on 10 or more drugs had 46% more bleeds, than patients on fewer drugs.
Data source: A retrospective analysis of 14,264 patients enrolled in the ROCKET AF trial.
Disclosures: ROCKET AF was sponsored by Janssen and Bayer. Dr. Piccini has been a consultant to and has received research funding from Janssen, Bayer, and several other companies.
Consider graded exercise before medications for postural orthostatic tachycardia syndrome
SCOTTSDALE, ARIZ. – Exercise is a cornerstone of treating postural orthostatic tachycardia syndrome, according to Dr. Deborah Tepper.
“Exercise training is really the hot new way to treat this disorder. It’s been found to be very effective,” she said at a symposium sponsored by the American Headache Society.
Postural orthostatic tachycardia syndrome (POTS) is an autonomic disorder that causes symptoms resembling panic attacks, said Dr. Tepper, who is an internist at the Cleveland Clinic Neurological Center for Pain. Patients may report syncope, dizziness, palpitations, rapid or irregular breathing, fatigue, and chest pain, she said. But to be diagnosed with POTS, they must have an increase of at least 30 beats per minute within 10 minutes of standing or with the 60-degree tilt table test. Patients aged 12-19 years must have an increase in heart rate of at least 40 beats per minute. Blood pressure may drop or stay the same, but will not fall to the extent seen in orthostatic hypotension (that is, a systolic drop of 20 mm Hg or a diastolic fall of at least 10 mm Hg), Dr. Tepper noted.

Deconditioning, chronic fatigue, anxiety, dehydration, and various medications increase the frequency and severity of POTS-related symptoms, Dr. Tepper said. Patients sometimes severely restrict exercise in an effort to control symptoms, but lying on the couch or going to bed “is the worst thing you can do with POTS,” she said. Instead, patients should start a graded exercise program by swimming or exercising in recumbent or seated positions. Exercise training increases the aldosterone-to-renin ratio, can reduce migraine, improves overall health and stamina, supports independent functioning, and can help restore the sleep-wake cycle.
Increasing salt and fluid intake and wearing compression socks also can improve symptoms – often to the extent that patients will not need new medications. But this conservative approach is inadequate in patients with risky occupations and is less effective when patients have frequent episodes of syncope, Dr. Tepper said.
“Beta-blockers remain an option if salts, fluids, and patient education are not enough,” she added.
Beta-blockers inhibit epinephrine release and therefore can improve the migraine and anxiety symptoms that can occur in patients with POTS, although they should not be used in patients with asthma, Dr. Tepper emphasized.
Medications such as fludrocortisone and midodrine should be reserved for patients with recurrent or resistant symptoms, according to Dr. Tepper. “Midodrine can be helpful in some people, although the evidence overall rates it as low to moderate,” she said. Midodrine is a direct vasoconstrictor and alpha-adrenergic agonist that increases vasomotor tone, but also can exacerbate headaches and may cause supine hypertension, urinary retention, and insomnia, she noted. Fludrocortisone increases plasma volume, but worsens migraine, increases fluid retention, and cannot be used in diabetic patients, she said.
Clinicians should refer patients for a cardiology evaluation if they do not improve or have risk factors such as a history of cardiac disease or a family history of sudden cardiac death, chest pain, a QRS interval of more than 120 ms, a corrected QT interval of more than 450 ms or less than 300 ms, or syncope with no warning or while lying down, Dr. Tepper said. She declared no conflicts of interest.
SCOTTSDALE, ARIZ. – Exercise is a cornerstone of treating postural orthostatic tachycardia syndrome, according to Dr. Deborah Tepper.
“Exercise training is really the hot new way to treat this disorder. It’s been found to be very effective,” she said at a symposium sponsored by the American Headache Society.
Postural orthostatic tachycardia syndrome (POTS) is an autonomic disorder that causes symptoms resembling panic attacks, said Dr. Tepper, who is an internist at the Cleveland Clinic Neurological Center for Pain. Patients may report syncope, dizziness, palpitations, rapid or irregular breathing, fatigue, and chest pain, she said. But to be diagnosed with POTS, they must have an increase of at least 30 beats per minute within 10 minutes of standing or with the 60-degree tilt table test. Patients aged 12-19 years must have an increase in heart rate of at least 40 beats per minute. Blood pressure may drop or stay the same, but will not fall to the extent seen in orthostatic hypotension (that is, a systolic drop of 20 mm Hg or a diastolic fall of at least 10 mm Hg), Dr. Tepper noted.
Deconditioning, chronic fatigue, anxiety, dehydration, and various medications increase the frequency and severity of POTS-related symptoms, Dr. Tepper said. Patients sometimes severely restrict exercise in an effort to control symptoms, but lying on the couch or going to bed “is the worst thing you can do with POTS,” she said. Instead, patients should start a graded exercise program by swimming or exercising in recumbent or seated positions. Exercise training increases the aldosterone-to-renin ratio, can reduce migraine, improves overall health and stamina, supports independent functioning, and can help restore the sleep-wake cycle.
Increasing salt and fluid intake and wearing compression socks also can improve symptoms – often to the extent that patients will not need new medications. But this conservative approach is inadequate in patients with risky occupations and is less effective when patients have frequent episodes of syncope, Dr. Tepper said.
“Beta-blockers remain an option if salts, fluids, and patient education are not enough,” she added.
Beta-blockers inhibit epinephrine release and therefore can improve the migraine and anxiety symptoms that can occur in patients with POTS, although they should not be used in patients with asthma, Dr. Tepper emphasized.
Medications such as fludrocortisone and midodrine should be reserved for patients with recurrent or resistant symptoms, according to Dr. Tepper. “Midodrine can be helpful in some people, although the evidence overall rates it as low to moderate,” she said. Midodrine is a direct vasoconstrictor and alpha-adrenergic agonist that increases vasomotor tone, but also can exacerbate headaches and may cause supine hypertension, urinary retention, and insomnia, she noted. Fludrocortisone increases plasma volume, but worsens migraine, increases fluid retention, and cannot be used in diabetic patients, she said.
Clinicians should refer patients for a cardiology evaluation if they do not improve or have risk factors such as a history of cardiac disease or a family history of sudden cardiac death, chest pain, a QRS interval of more than 120 ms, a corrected QT interval of more than 450 ms or less than 300 ms, or syncope with no warning or while lying down, Dr. Tepper said. She declared no conflicts of interest.

Surgery duration linked to VTE risk

Credit: Piotr Bodzek
New research suggests that, as the duration of surgery increases, so does the risk of venous thromboembolism (VTE).
Compared with a surgical procedure of average duration, patients who underwent the longest procedures had a 1.27-fold increase in the risk of developing a VTE.
In 3 of the most common procedures—gall bladder removal, appendectomy, and gastric bypass—surgery duration was a significant, independent risk factor for VTE.
Though these results suggest an association between surgical time and VTE, the researchers said they could not confirm a causal relationship.
John Y.S. Kim, MD, of Northwestern University’s Feinberg School of Medicine in Chicago, and his colleagues reported these findings in JAMA Surgery.
The researchers analyzed data from the American College of Surgeons National Surgical Quality Improvement Program to examine the association between surgical duration and the incidence of VTE.
The study included more than 1.4 million patients who had surgery under general anesthesia at 315 US hospitals from 2005 to 2011.
A total of 13,809 patients (0.96%) had a postoperative VTE, with 10,198 (0.71%) developing deep vein thrombosis and 4772 (0.33%) developing a pulmonary embolism.
The rates of each of these events consistently increased with the duration of the surgical procedure.
The researchers divided patients into 5 quintiles representing surgery duration. In the first quintile (representing the relatively shortest procedures), there were 2033 VTEs. This was followed by 2278 in the second quintile, 2478 in the third, 2960 in the fourth, and 4060 in the fifth.
Compared with the third quintile (which served as a reference), the odds ratio (OR) for developing VTE in the first quintile was 0.86 (P<0.01). In the second quintile, the OR was 0.98 (P=0.39). The fourth and fifth quintiles had ORs of 1.10 and 1.27, respectively (P<0.001 for both).
The association between VTE incidence and the longest procedures was significant in 82% of 1000 bootstrap samples. In this analysis, there was a significant association (P<0.001) between surgery duration and VTE for gynecologic, neurologic, otolaryngologic, urologic, and vascular procedures.
In each of the 3 most common procedures, surgery duration was a significant, independent risk factor for VTE. A 1-hour increase in surgical time carried an OR of 1.18 for gall bladder removal, 1.18
for appendectomy, and 1.26 for gastric bypass (P<0.05 for all).
The researchers said these results appear to validate the widely held, but not previously substantiated, belief that longer operations are associated with a higher risk of VTE. This information could help improve VTE risk modeling, enhance thromboprophylaxis guidelines, and better inform surgical decision making. ![]()
ASH adds practices to Choosing Wisely list

Credit: Rhoda Baer
The American Society of Hematology (ASH) has released a second list of 5 commonly used tests, treatments, and procedures that physicians and patients should question in certain circumstances.
The additional items join an initial list of practices released last year as part of the Choosing Wisely® campaign, an initiative of the ABIM Foundation that aims to prompt conversations between patients and physicians about the necessity and potential harm of certain procedures.
These new “practices to question” are also highlighted in a manuscript published in Blood, which further describes the methods for developing the list and the evidentiary basis of the recommendations.
The new recommendations include:
- Don’t treat with an anticoagulant for more than 3 months in a patient with a first venous thromboembolism occurring in the setting of a major transient risk factor.
- Don’t routinely transfuse patients with sickle cell disease for chronic anemia or uncomplicated pain crisis without an appropriate clinical indication.
- Don’t perform baseline or routine surveillance CT scans in patients with asymptomatic, early stage chronic lymphocytic leukemia.
- Don’t test or treat for suspected heparin-induced thrombocytopenia (HIT) in patients with a low pre-test probability of HIT.
- Don’t treat patients with immune thrombocytopenic purpura in the absence of bleeding or a very low platelet count.
The second Choosing Wisely list was developed using a rigorous evidence-based methodology that incorporated suggestions from ASH members and prioritized avoiding harm to patients above all other considerations.
“Unnecessary treatments or tests not only add waste to the healthcare system, but, in some cases, they also expose our patients to a risk of harm,” said Lisa Hicks, MD, of St Michael’s Hospital and the University of Toronto and chair of the ASH Choosing Wisely Task Force.
“ASH developed its second Choosing Wisely list to help hematologists manage the utilization and delivery of patient-care resources, and the society encourages hematologists to consider these recommendations in all facets of their work, including patient care, teaching, innovation, and research.”
The dominant guiding principle for ASH’s list is the concept of avoiding harm. The four other established guiding principles of ASH’s involvement in the Choosing Wisely campaign are strength of evidence, aggregate cost, frequency, and making recommendations within the purview of hematology. This year, the task force added a sixth overarching principle of potential impact in the field.
“Choosing Wisely set out to stimulate conversations about waste and overuse in our healthcare system,” said Richard J. Baron, MD, President and CEO of the ABIM Foundation.
“We’ve been fortunate to be joined in this effort by many dedicated partners—including ASH—who have committed to addressing unnecessary care in their specialty. ASH’s second Choosing Wisely list gives clinicians and patients a new and important tool to help inform their conversations about what care is best for the patient.” ![]()
FDA approves first anti-CD19 drug

Credit: NIAID
The US Food and Drug Administration (FDA) has granted accelerated approval for blinatumomab (Blincyto) to treat adults with relapsed or refractory Philadelphia chromosome-negative precursor B-cell acute lymphoblastic leukemia (ALL).
Blinatumomab is a bispecific T-cell engager (BiTE®) antibody construct designed to direct the body’s T cells against target cells expressing CD19, a protein found on the surface of B cells.
Blinatumomab is the first anti-CD19 drug to receive FDA approval. It will be available as a 35 mcg single-use vial.
“Immunotherapies, especially Blincyto with its unique mechanism of action, are particularly promising for patients with leukemia,” said Richard Pazdur, MD, director of the Office of Hematology and Oncology Products in the FDA’s Center for Drug Evaluation and Research.
“Recognizing the potential of this novel therapy, the FDA worked proactively with the sponsor under our breakthrough therapy designation program to facilitate the approval of this novel agent.”
Approval details
The FDA granted blinatumomab accelerated approval based on clinical data showing the drug has an effect on a surrogate endpoint reasonably likely to predict clinical benefit to patients.
Before granting the drug full approval, the FDA is requiring that blinatumomab’s manufacturer, Amgen, conduct a study to verify that the drug improves survival in patients with relapsed or refractory Philadelphia-negative precursor B-cell ALL.
Blinatumomab was approved with a boxed warning detailing the risk of cytokine release syndrome and neurological toxicities. The FDA also approved the drug with a Risk Evaluation and Mitigation Strategy, which consists of a communication plan to inform healthcare providers about the serious risks and the potential for preparation and administration errors.
Blinatumomab was approved more than 5 months ahead of the date the FDA was scheduled to complete review of the drug’s application (May 19, 2015).
The agency had granted blinatumomab breakthrough therapy designation, priority review, and orphan product designation because Amgen demonstrated through preliminary clinical evidence that the drug may offer a substantial improvement over available therapies.
That evidence came in the form of a phase 2 study, the results of which were presented at the 19th Congress of the European Hematology Association (EHA) in June.
Trial results
Researchers evaluated blinatumomab monotherapy in 189 patients with relapsed or refractory B-cell ALL and a median age of 39 (range, 18-79). The patients received blinatumomab by continuous intravenous infusion—4 weeks on and 2 weeks off—for up to 5 cycles.
Thirty-three percent of patients achieved a complete remission, and 9% achieved a complete remission with partial hematologic recovery. Seventy-one percent of these patients were negative for minimal residual disease.
The median relapse-free survival was 5.9 months.
Major toxicities were related to cytokine release syndrome, but cytopenias and central nervous system events were also common. The most frequent adverse events were pyrexia (59%), headache (35%), and febrile neutropenia (29%).
The most frequent grade 3 or higher adverse events were febrile neutropenia (26%), anemia (15%), and neutropenia (15%). Two percent of patients had grade 3 or higher cytokine release syndrome.
The most common grade 3 or higher nervous system events were headache (4%), encephalopathy (3%), and ataxia (2%). Three patients (2%) had grade 5 events considered treatment-related—2 with sepsis and 1 with Candida infection. ![]()
Hospitalists' Role in the Ebola Response
Concern and fear over an infection and how best to contain its spread is a well‐known storyline dating back centuries before the germ theory was hypothesized. During the Plague of Athens in the fourth century bc, upon noticing that physicians and caregivers of the sick were most at risk of dying, the Greek historian and philosopher Thucydides wrote that thwarting the disease likely required more practical measures than simple prayer to the gods.[1] To this day, the fears of contracting disease often outstripor worse, overrideour practical or scientific understanding.
Ebola has rekindled past concerns about disease transmission, whether real or imagined. In this article we will describe the history of Ebola outside the United States as well as recent events in US hospitals. We will review guidelines for how to prepare hospitals to treat potential Ebola patients and highlight the key role that hospitalists can have in ensuring the safety of their patients and coworkers. We will also describe the emerging role of global health hospitalists, whose numbers are growing and whose expertise is ideally suited to improving hospital care in developing countries.
EBOLA EPIDEMICS AND HEALTH EQUITY
In the first identified Ebola outbreak in 1976 in Zaire, now the Democratic Republic of the Congo, patients arrived at local hospitals with symptoms that resembled common endemic illnesses like malaria, typhoid, and yellow fever. The ensuing deaths of 11 of the 17 staff members at 1 hospital were only an introduction to the deadly consequences of Ebola and the necessity of vigilant infection control. Unfortunately, not much has changed with each subsequent outbreak; to this day the heralding of an Ebola outbreak denotes the death of healthcare workers. Since the discovery of the Ebola virus 38 years ago, there have been nearly 30 recorded Ebola outbreaks. The mortality rates of prior outbreaks range widely between 25% and 90%; reports of the current outbreak's mortality falls within that range, between 50% and 70%. It is important to note that despite this high mortality, there had been no more than 1600 Ebola deaths worldwide before the 2014 West African pandemic.[2] In comparison, the number of deaths in Guinea, Sierra Leone, and Liberia approaches 6000.[3]
Although these disturbing figures have fueled public fear and panic in the United States, we wonder how many of these deaths were actually preventable. At the epicenter of the current Ebola virus disease (EVD) outbreak are 3 countries especially vulnerable to epidemics, with armed conflict recently crippling the health systems that have now just started to rebuild. When Liberia emerged from its second civil war in 2003, they had barely 50 physicians caring for a country of nearly 4 million.[4] In contrast with the devastating death toll in Liberia, it perhaps should not come as a surprise that out of the 10 known cases of Ebola that were treated in the United States and caught early, none have resulted in death. With an advanced healthcare infrastructure in place, the mortality rate for EVD in the United States has been close to zero. Although the true unpreventable case fatality rate in West Africa is unknown, the positive outcomes in the United States cases illustrate that hospitals can treat EVD successfully, provided that they are well staffed, supplied, and prepared.
Furthermore, the stark difference in access to quality healthcare between nations suggests that combating the virus should not be our only concern. In fact, EVD itself is only an acute symptom of a much larger, chronic problem with the health systems in Guinea, Sierra Leone, and Liberia. Western countries must direct more resources and attention to improving the overall quality of care in these countries, for although the underlying inequities may be limited to places like Guinea, Liberia, and Sierra Leone, the resulting threat is a global one.
PREPARING FOR THE FIGHT AGAINST EBOLA IN THE UNITED STATES
On September 25, 2014, Thomas Eric Duncan presented to Texas Health Presbyterian Hospital with fever, abdominal pain, and headache 11 days after transporting a pregnant neighbor in his home country of Liberia who later died of EVD. Duncan was discharged from the emergency room without admission. Three days later, on September 28, 2014, an ambulance was called and transported him to Texas Health where he was admitted. He was isolated and the hospital followed existing Centers for Disease Control and Prevention (CDC) guidelines for infection control. He was confirmed to have EVD on September 30, 2014. He was cared for by the healthcare providers at Texas Health Presbyterian Hospital, but despite their care, his condition deteriorated. Eric Duncan died on October 8, 2014. About 120 healthcare workers came into contact with the patient. None of his 48 contacts prior to admission to the hospital contracted the disease. However, 2 nurses who cared for him during his admission developed symptoms and were confirmed to have Ebola. An alarm was sounded across the United States, awakening hospitals to the reality of their vulnerability and need for preparedness.[5]
For any healthcare worker treating EVD, whether working in a hospital here in the United States or an Ebola treatment unit (ETU) in West Africa, intensive training is necessary to keep oneself safe. Although infection control is not a novel concept, the stakes have undoubtedly been raised, as even the smallest misstep can be deadly when dealing with the Ebola virus. We were participants in a 3‐day infection control training program conducted by the CDC in Anniston, Alabama, which aimed to prepare healthcare workers to assist with the Ebola response in West Africa. Throughout the training, we repeatedly donned and doffed personal protective equipment (PPE), following protocols established by the World Health Organization and Doctors Without Borders (Mdecins Sans Frontires):
- Use a combination of contact, droplet, and standard precautions, ensuring no area of skin is left uncovered.
- Enter and exit with a buddy; inspect one another for breaches at each step of donning, caring for the patient, and doffing.
- Wash gloved hands with 0.5% chlorine bleach between tasks and patients.
- Exit at the slightest breach of infection protocol.
- Doff PPE per protocol and under supervision; take great care not to contaminate oneself.
Doffing is considered the most difficult and also the most important part, with 7 pieces to remove and no less than 20 steps to do so. After 3 full days of training, although we felt more confident with the carefully choreographed movements of donning and doffing, we were also more aware of the many opportunities during which a breach could occur. Despite our repeated practice, the training staff was firm in telling us that we were still not prepared to work in an ETU. We had only undergone what could be called a cold training. To work in the hot zone of the ETUs, it is essential to undergo additional mentorship and training once in the field. We believe a similar approach to extensive training should be employed for all healthcare workers on the front lines of an Ebola response, both in the United States and abroad.
Given the complexity of the infection control practices above, questions have appropriately been raised about US healthcare facilities' aptitude at providing care for patients with EVD. Although hospitals have historically been focal point(s) for dissemination of infection of Ebola, this does not have to be the case.[6] With appropriate preparedness, training, and understanding of facility limitations, hospitals can also be places of confidence and healing.
Both Emory University and the University of Nebraska have successfully treated multiple Ebola patients without incurring further transmission.[7, 8] Much of their success comes from the work of longitudinal teams that are trained in infectious disease response on a regular basis, despite the rare occurrence of a serious outbreak. When Emory scaled up this team upon receiving a confirmed EVD patient, new members were required to pass a proficiency test prior to providing care. Emory's strict adherence to infection control and advanced preparation serve as a model for other institutions.
It is important to recognize that not all hospitals should be fully equipped and staffed for safe care of a patient with EVD. Much like in cases of high‐level trauma, regional centers should be identified, prepared, and available to be called upon in a time of need (Figure 1). At the writing of this article, guidelines for hospitals are evolving; most states, with input from federal and local officials, are moving toward designating regional referral centers. Although the number of designated facilities and standards for each vary by state, general preparedness for care of a patient with suspected or confirmed EVD should include: (1) a designated and trained care team, (2) appropriate and vetted operational protocols, (3) an assigned isolation unit with adequate space for the necessary specialized precautions, (4) separate laboratory and diagnostic capabilities, and (5) a working waste management plan.[9] Although not all facilities throughout the United States will have the capability to care for a patient with EVD, all hospitals must have an action plan.

Triage is the first step; facilities should have well‐informed and trained staff prepared to perform assessments of potential cases safely (Figure 2). The ability to temporarily isolate and then efficiently transfer suspected or confirmed EVD patients to an appropriate facility also requires careful planning. Prompt identification, constant vigilance, and accurate histories all serve as stepping stones to a successful outcome and can protect employees and other patients in the process.
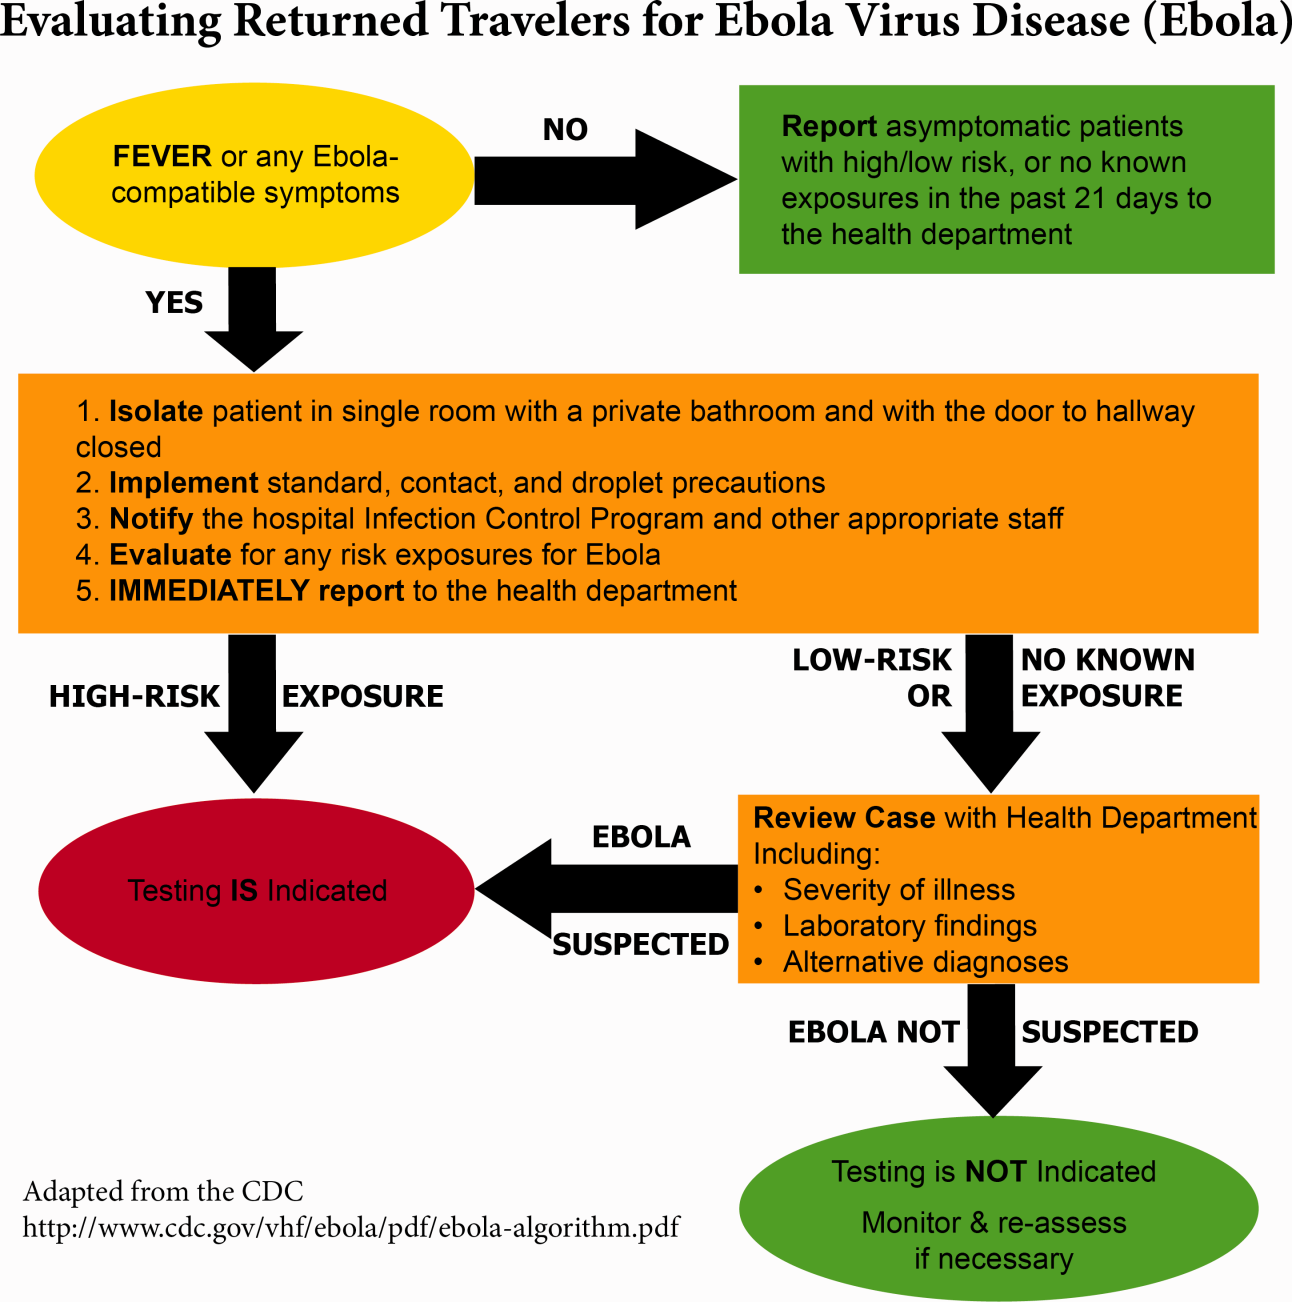
Within this proposed structure, hospitalists are uniquely equipped to play a leading role in EVD response. First, hospitalists are frequently responsible for interfacility transfer. Their intimate knowledge of this process and the collegiality they have fostered through its use are both assets in navigating the tiered referral system outlined above. Furthermore, as point people in the acute‐care setting who accept patients from emergency medicine colleagues, discuss cases with various consultants, and coordinate discharges with multidisciplinary teams on a daily basis, hospitalists have honed communication and leadership skills that are highly valuable in collaborative efforts. Finally, many hospitalists are also champions of quality and safety in their institutions. The focus on the process of continuous improvement is critical in the face of evolving challenges such as EVD.
GLOBAL HEALTH HOSPITALISTS
The Ebola outbreak is a global crisis that clearly illustrates the challenges of addressing highly infectious diseases in modern times. We have outlined the role of hospitalists and defined the steps toward adequate preparedness within our facilities. By following the measured and practical actions Thucydides advised, we can further strengthen our health systems and work toward the control of this outbreak in the United States. The important role of hospitalists can and should be extended to serve those in poor countries.
Over the last decade, health systems strengthening, health workforce training, and patient safety have come to the forefront of global health priorities, the same priorities that are also at the forefront of many hospitalists' aspirations. Shoeb et al. recently conducted a survey of global health hospitalists. They found that within the framework of global health, hospitalists are uniquely positioned to contribute to this growing field, particularly in areas such as quality improvement, safety, systems thinking, and medical education, all strengths of the hospital medicine model that could be translated to resource‐limited settings.[10]
We believe that hospitalists, with their unique positions and skills, are natural and necessary agents of action in this time of need. Our ultimate aim is for hospitalists to become actively engaged in addressing not only the current Ebola outbreak, but also the extreme inequity of healthcare globallyan inequity that lies at the heart of the current devastation in West Africa. We call upon hospital medicine leaders, from division chiefs to chairs of medicine to chief medical officers to support, encourage, and incentivize their staff and faculty to join the ranks of global health hospitalists as they work to both end gross inequities in healthcare abroad and protect our patients and ourselves back home.
Acknowledgements
The authors are grateful for Brett Lewis' assistance in the preparation of this article.
Disclosure
Nothing to report.
- . Infection control throughout history. Lancet Infect Dis. 2014;14(4):280.
- , . Ebola then and now. N Engl J Med. 2014;371:1663–1666.
- World Health Organization. Ebola response roadmap—situation report. Available at: http://www.who.int/csr/disease/ebola/situation‐reports/en/. Accessed November 2014.
- , . Effect of civil war on medical education in Liberia. Int J Emerg Med. 2011;4:6.
- , . Is the U.S. prepared for an Ebola outbreak? New York Times. October 10, 2014. Available at: http://www.nytimes.com/interactive/2014/10/09/us/is-the-us-prepared-for-an-ebola-outbreak.html?module=Search61(6):997–1003.
- . With good hospital practices, Emory rises to Ebola challenge. Kaiser Health News. U.S. News 8(3):162–163.
Concern and fear over an infection and how best to contain its spread is a well‐known storyline dating back centuries before the germ theory was hypothesized. During the Plague of Athens in the fourth century bc, upon noticing that physicians and caregivers of the sick were most at risk of dying, the Greek historian and philosopher Thucydides wrote that thwarting the disease likely required more practical measures than simple prayer to the gods.[1] To this day, the fears of contracting disease often outstripor worse, overrideour practical or scientific understanding.
Ebola has rekindled past concerns about disease transmission, whether real or imagined. In this article we will describe the history of Ebola outside the United States as well as recent events in US hospitals. We will review guidelines for how to prepare hospitals to treat potential Ebola patients and highlight the key role that hospitalists can have in ensuring the safety of their patients and coworkers. We will also describe the emerging role of global health hospitalists, whose numbers are growing and whose expertise is ideally suited to improving hospital care in developing countries.
EBOLA EPIDEMICS AND HEALTH EQUITY
In the first identified Ebola outbreak in 1976 in Zaire, now the Democratic Republic of the Congo, patients arrived at local hospitals with symptoms that resembled common endemic illnesses like malaria, typhoid, and yellow fever. The ensuing deaths of 11 of the 17 staff members at 1 hospital were only an introduction to the deadly consequences of Ebola and the necessity of vigilant infection control. Unfortunately, not much has changed with each subsequent outbreak; to this day the heralding of an Ebola outbreak denotes the death of healthcare workers. Since the discovery of the Ebola virus 38 years ago, there have been nearly 30 recorded Ebola outbreaks. The mortality rates of prior outbreaks range widely between 25% and 90%; reports of the current outbreak's mortality falls within that range, between 50% and 70%. It is important to note that despite this high mortality, there had been no more than 1600 Ebola deaths worldwide before the 2014 West African pandemic.[2] In comparison, the number of deaths in Guinea, Sierra Leone, and Liberia approaches 6000.[3]
Although these disturbing figures have fueled public fear and panic in the United States, we wonder how many of these deaths were actually preventable. At the epicenter of the current Ebola virus disease (EVD) outbreak are 3 countries especially vulnerable to epidemics, with armed conflict recently crippling the health systems that have now just started to rebuild. When Liberia emerged from its second civil war in 2003, they had barely 50 physicians caring for a country of nearly 4 million.[4] In contrast with the devastating death toll in Liberia, it perhaps should not come as a surprise that out of the 10 known cases of Ebola that were treated in the United States and caught early, none have resulted in death. With an advanced healthcare infrastructure in place, the mortality rate for EVD in the United States has been close to zero. Although the true unpreventable case fatality rate in West Africa is unknown, the positive outcomes in the United States cases illustrate that hospitals can treat EVD successfully, provided that they are well staffed, supplied, and prepared.
Furthermore, the stark difference in access to quality healthcare between nations suggests that combating the virus should not be our only concern. In fact, EVD itself is only an acute symptom of a much larger, chronic problem with the health systems in Guinea, Sierra Leone, and Liberia. Western countries must direct more resources and attention to improving the overall quality of care in these countries, for although the underlying inequities may be limited to places like Guinea, Liberia, and Sierra Leone, the resulting threat is a global one.
PREPARING FOR THE FIGHT AGAINST EBOLA IN THE UNITED STATES
On September 25, 2014, Thomas Eric Duncan presented to Texas Health Presbyterian Hospital with fever, abdominal pain, and headache 11 days after transporting a pregnant neighbor in his home country of Liberia who later died of EVD. Duncan was discharged from the emergency room without admission. Three days later, on September 28, 2014, an ambulance was called and transported him to Texas Health where he was admitted. He was isolated and the hospital followed existing Centers for Disease Control and Prevention (CDC) guidelines for infection control. He was confirmed to have EVD on September 30, 2014. He was cared for by the healthcare providers at Texas Health Presbyterian Hospital, but despite their care, his condition deteriorated. Eric Duncan died on October 8, 2014. About 120 healthcare workers came into contact with the patient. None of his 48 contacts prior to admission to the hospital contracted the disease. However, 2 nurses who cared for him during his admission developed symptoms and were confirmed to have Ebola. An alarm was sounded across the United States, awakening hospitals to the reality of their vulnerability and need for preparedness.[5]
For any healthcare worker treating EVD, whether working in a hospital here in the United States or an Ebola treatment unit (ETU) in West Africa, intensive training is necessary to keep oneself safe. Although infection control is not a novel concept, the stakes have undoubtedly been raised, as even the smallest misstep can be deadly when dealing with the Ebola virus. We were participants in a 3‐day infection control training program conducted by the CDC in Anniston, Alabama, which aimed to prepare healthcare workers to assist with the Ebola response in West Africa. Throughout the training, we repeatedly donned and doffed personal protective equipment (PPE), following protocols established by the World Health Organization and Doctors Without Borders (Mdecins Sans Frontires):
- Use a combination of contact, droplet, and standard precautions, ensuring no area of skin is left uncovered.
- Enter and exit with a buddy; inspect one another for breaches at each step of donning, caring for the patient, and doffing.
- Wash gloved hands with 0.5% chlorine bleach between tasks and patients.
- Exit at the slightest breach of infection protocol.
- Doff PPE per protocol and under supervision; take great care not to contaminate oneself.
Doffing is considered the most difficult and also the most important part, with 7 pieces to remove and no less than 20 steps to do so. After 3 full days of training, although we felt more confident with the carefully choreographed movements of donning and doffing, we were also more aware of the many opportunities during which a breach could occur. Despite our repeated practice, the training staff was firm in telling us that we were still not prepared to work in an ETU. We had only undergone what could be called a cold training. To work in the hot zone of the ETUs, it is essential to undergo additional mentorship and training once in the field. We believe a similar approach to extensive training should be employed for all healthcare workers on the front lines of an Ebola response, both in the United States and abroad.
Given the complexity of the infection control practices above, questions have appropriately been raised about US healthcare facilities' aptitude at providing care for patients with EVD. Although hospitals have historically been focal point(s) for dissemination of infection of Ebola, this does not have to be the case.[6] With appropriate preparedness, training, and understanding of facility limitations, hospitals can also be places of confidence and healing.
Both Emory University and the University of Nebraska have successfully treated multiple Ebola patients without incurring further transmission.[7, 8] Much of their success comes from the work of longitudinal teams that are trained in infectious disease response on a regular basis, despite the rare occurrence of a serious outbreak. When Emory scaled up this team upon receiving a confirmed EVD patient, new members were required to pass a proficiency test prior to providing care. Emory's strict adherence to infection control and advanced preparation serve as a model for other institutions.
It is important to recognize that not all hospitals should be fully equipped and staffed for safe care of a patient with EVD. Much like in cases of high‐level trauma, regional centers should be identified, prepared, and available to be called upon in a time of need (Figure 1). At the writing of this article, guidelines for hospitals are evolving; most states, with input from federal and local officials, are moving toward designating regional referral centers. Although the number of designated facilities and standards for each vary by state, general preparedness for care of a patient with suspected or confirmed EVD should include: (1) a designated and trained care team, (2) appropriate and vetted operational protocols, (3) an assigned isolation unit with adequate space for the necessary specialized precautions, (4) separate laboratory and diagnostic capabilities, and (5) a working waste management plan.[9] Although not all facilities throughout the United States will have the capability to care for a patient with EVD, all hospitals must have an action plan.
Triage is the first step; facilities should have well‐informed and trained staff prepared to perform assessments of potential cases safely (Figure 2). The ability to temporarily isolate and then efficiently transfer suspected or confirmed EVD patients to an appropriate facility also requires careful planning. Prompt identification, constant vigilance, and accurate histories all serve as stepping stones to a successful outcome and can protect employees and other patients in the process.
Within this proposed structure, hospitalists are uniquely equipped to play a leading role in EVD response. First, hospitalists are frequently responsible for interfacility transfer. Their intimate knowledge of this process and the collegiality they have fostered through its use are both assets in navigating the tiered referral system outlined above. Furthermore, as point people in the acute‐care setting who accept patients from emergency medicine colleagues, discuss cases with various consultants, and coordinate discharges with multidisciplinary teams on a daily basis, hospitalists have honed communication and leadership skills that are highly valuable in collaborative efforts. Finally, many hospitalists are also champions of quality and safety in their institutions. The focus on the process of continuous improvement is critical in the face of evolving challenges such as EVD.
GLOBAL HEALTH HOSPITALISTS
The Ebola outbreak is a global crisis that clearly illustrates the challenges of addressing highly infectious diseases in modern times. We have outlined the role of hospitalists and defined the steps toward adequate preparedness within our facilities. By following the measured and practical actions Thucydides advised, we can further strengthen our health systems and work toward the control of this outbreak in the United States. The important role of hospitalists can and should be extended to serve those in poor countries.
Over the last decade, health systems strengthening, health workforce training, and patient safety have come to the forefront of global health priorities, the same priorities that are also at the forefront of many hospitalists' aspirations. Shoeb et al. recently conducted a survey of global health hospitalists. They found that within the framework of global health, hospitalists are uniquely positioned to contribute to this growing field, particularly in areas such as quality improvement, safety, systems thinking, and medical education, all strengths of the hospital medicine model that could be translated to resource‐limited settings.[10]
We believe that hospitalists, with their unique positions and skills, are natural and necessary agents of action in this time of need. Our ultimate aim is for hospitalists to become actively engaged in addressing not only the current Ebola outbreak, but also the extreme inequity of healthcare globallyan inequity that lies at the heart of the current devastation in West Africa. We call upon hospital medicine leaders, from division chiefs to chairs of medicine to chief medical officers to support, encourage, and incentivize their staff and faculty to join the ranks of global health hospitalists as they work to both end gross inequities in healthcare abroad and protect our patients and ourselves back home.
Acknowledgements
The authors are grateful for Brett Lewis' assistance in the preparation of this article.
Disclosure
Nothing to report.
- . Infection control throughout history. Lancet Infect Dis. 2014;14(4):280.
- , . Ebola then and now. N Engl J Med. 2014;371:1663–1666.
- World Health Organization. Ebola response roadmap—situation report. Available at: http://www.who.int/csr/disease/ebola/situation‐reports/en/. Accessed November 2014.
- , . Effect of civil war on medical education in Liberia. Int J Emerg Med. 2011;4:6.
- , . Is the U.S. prepared for an Ebola outbreak? New York Times. October 10, 2014. Available at: http://www.nytimes.com/interactive/2014/10/09/us/is-the-us-prepared-for-an-ebola-outbreak.html?module=Search61(6):997–1003.
- . With good hospital practices, Emory rises to Ebola challenge. Kaiser Health News. U.S. News 8(3):162–163.
© 2014 Society of Hospital Medicine
