User login
First randomized evidence for kinase inhibitor use in AML

Photo courtesy of ASH
SAN FRANCISCO—Researchers have presented the first randomized evidence that kinase inhibitors are effective in the treatment of acute myeloid leukemia
(AML).
The multikinase inhibitor sorafenib improved event-free and relapse-free survival in younger patients.
“Interestingly, at this point in time, we can see no clear overall survival benefit for patients treated in the sorafenib arm,” said trial investigator Christoph Röllig, MD, of the Universitätsklinikum Dresden in Germany.
Dr Röllig, representing the Study Alliance Leukemia, presented data on sorafenib from the SORAML trial during the plenary session of the 2014 ASH Annual Meeting (abstract 6). Some funding for this trial was provided by Bayer Healthcare, the company developing sorafenib.
Dr Röllig explained that support for sorafenib’s clinical efficacy in AML was based primarily on case series and a few early phase clinical and nonrandomized
trials.
An earlier randomized study with sorafenib in older AML patients showed no beneficial antileukemic effect with the addition of the agent, and the treatment was associated with significant morbidity.
However, because the biology of AML and drug tolerance are different in younger people, the Study Alliance Leukemia decided to test the drug in a younger
patient population.
They randomized 276 newly diagnosed AML patients aged 60 years or younger to receive 2 cycles of induction chemotherapy with an anthracycline and cytarabine plus either sorafenib or placebo.
The sorafenib dose was 800 mg per day orally. All patients received at least one dose of study medication, forming the statistical analysis set.
Once in complete remission, intermediate-risk patients with a family donor and high-risk patients with a matched donor went on to stem cell transplant.
All other patients proceeded to high-dose cytarabine-based consolidation treatment plus sorafenib or placebo followed by 1 year of maintenance treatment with sorafenib or placebo.
The primary endpoint was event-free survival (EFS). An event was defined as primary treatment failure, relapse, or death.
Patients in each arm were a median age of 50 years, 17% were FLT3-ITD positive, and 33% were NPM1 mutated.
The complete response (CR) rate was 60% in the sorafenib arm and 59% in the placebo arm. Patients with FLT3-ITD mutation achieved a 57% CR rate with sorafenib and a 52% CR rate with placebo.
After a median follow-up of 3 years, investigators observed “significant prolongation of event-free survival in the sorafenib arm,” Dr Röllig said.
Patients on the sorafenib arm had a median EFS of 40% compared with 22% on the placebo arm, or 21 months compared with 9 months (P=0.013).
Patients were censored at the time of transplant. However, uncensored results were very similar, Dr Röllig noted, “with an even greater advantage for sorafenib.”
Fifty-six percent of sorafenib-treated patients were relapse-free and alive after 3 years, compared with 38% of patients on placebo (P=0.017).
The 3-year overall survival was 63% in the sorafenib arm and 56% in the placebo arm (P=0.382).
An exploratory analysis of FLT3-ITD patients revealed that 1-year EFS for sorafenib-treated patients was 54%, and, for placebo-treated patients, it was 50%.
“The reasons for potential efficacy of sorafenib in this mainly FLT3-ITD-negative population must remain speculative,” Dr Röllig said. “We can speculate that the inhibition of other kinases apart from FLT3 might be responsible for the efficacy of this drug in this patient population.”
Sorafenib significantly increased the risk of grade 3 or greater hand-foot syndrome (P<0.001), diarrhea (P=0.001), bleeding (P=0.016), rash (P=0.045), liver toxicity (P=0.048), and fever (P=0.035).
Dr Röllig indicated a confirmatory trial would be desirable in order to establish sorafenib in the AML treatment armamentarium. ![]()
Antibody shows activity in relapsed/refractory NHL
SAN FRANCISCO—The anti-CD19 antibody M0R208 has demonstrated encouraging single-agent activity in patients with relapsed or refractory non-Hodgkin lymphoma (NHL), according to a presenter at the 2014 ASH Annual Meeting.
“It is encouraging to see results in an NHL study that selects a different target than CD20,” said Kristie Blum, MD, of The Ohio State University in Columbus.
“In particular, it is good to see activity in elderly large-cell lymphoma patients.”
MOR208 is an Fc-engineered humanized monoclonal antibody that targets the CD19 antigen.
“It possesses significantly enhanced antibody-dependent cell-mediated cytotoxicity, a key mechanism for tumor cell killing,” Dr Blum explained. “We have seen previous responses in diffuse large B-cell lymphoma (DLBCL) and follicular lymphoma (FL).”
In fact, MOR208 recently received fast-track designation from the US Food and Drug Administration to treat DLBCL.
At ASH, Dr Blum reported on a non-randomized, phase 2a study designed to assess the efficacy and safety of single-agent MOR208 in adults with relapsed or refractory NHL (abstract 3089). The trial was sponsored by MorphoSys AG, the company developing MOR208.
The study included 89 patients—35 with DLBCL, 31 with FL, 12 with mantle cell lymphoma (MCL), and 11 with other indolent NHLs (iNHLs). The patients had a median age of 67 years, were previously treated with rituximab, and were not candidates for high-dose therapy with stem cell support.
The patients were treated over 56 days. MOR208 was given intravenously at 12 mg/kg as 8 weekly doses on days 1, 8, 15, and 22 of each cycle. Patients with at least stable disease continued treatment for another cycle.
After completing 12 weekly doses of treatment, responding patients received maintenance MOR208 every 2 or 4 weeks, depending on the investigator’s decision, until progression.
The results showed overall response rates of 26% for DLBCL patients, 23% for FL patients, and 36% in iNHL patients. No MCL patients responded.
There were 2 complete responses in the DLBCL cohort and 1 complete response each in the FL and iNHL cohorts. Response duration reached 13.8 months.
The drug was well-tolerated with an acceptable toxicity profile, Dr Blum said. The most frequently reported treatment-emergent adverse events of any grade were thrombocytopenia, anemia, and neutropenia, all at 9%.
Infusion-related reactions were reported in 9% of patients and were typically grade 1 or 2. There have been no treatment-related deaths.
Protocols are being developed for trials that combine MOR208 with other anti-lymphoma therapies, with plans to open phase 1/2 trials by mid-2015.
“We plan to take the drug forward in combination with bendamustine or lenalidomide plus rituximab,” Dr Blum said. “By adding the drug into a bendamustine-rituximab combination, we will hit 2 different targets and may see synergistic cell killing.” ![]()
FDA approves drug for HCM
The US Food and Drug Administration (FDA) has approved denosumab (XGEVA) to treat hypercalcemia of malignancy (HCM) that is refractory to bisphosphonate therapy.
HCM results from cancer-driven increases in bone resorption. If left untreated, the condition can lead to renal failure, progressive mental impairment, coma, and death.
Denosumab works by binding to RANK ligand, a protein essential for the formation, function, and survival of osteoclasts.
The drug prevents RANK ligand from activating its receptor, RANK, on the surface of osteoclasts, thereby decreasing bone destruction and calcium release.
Denosumab previously received FDA approval to treat giant cell tumor of the bone and for the prevention of skeletal-related events in patients with bone metastases from solid tumors.
The FDA’s approval of denosumab for HCM is based on positive results from an open-label, single-arm study, which enrolled 33 patients with advanced cancer and persistent hypercalcemia after recent bisphosphonate treatment.
The primary endpoint was the proportion of patients with a response, defined as albumin-corrected serum calcium (CSC) < 11.5 mg/dL (2.9 mmol/L; adverse events grade < 1) within 10 days of the first dose of denosumab.
Secondary endpoints included the proportion of patients who experienced a complete response (defined as CSC < 10.8 mg/dL [2.7 mmol/L]) by day 10, time to response, and response duration (defined as the number of days from the first occurrence of CSC < 11.5 mg/dL).
The primary endpoint was met. At day 10, the response rate was 63.6%. Likewise, the overall complete response rate was 63.6%. The estimated median time to response was 9 days, and the median duration of response was 104 days.
The most common adverse events were nausea, dyspnea, decreased appetite, headache, peripheral edema, vomiting, anemia, constipation, and diarrhea.
Potential safety risks
Patients with HCM should receive 120 mg of denosumab as a subcutaneous injection every 4 weeks with additional doses of 120 mg on days 8 and 15 of the first month of therapy.
Pre-existing hypocalcemia must be corrected prior to initiating denosumab therapy. The drug can cause severe, symptomatic hypocalcemia, and fatal cases have been reported.
Physicians should monitor patients’ calcium levels and administer calcium, magnesium, and vitamin D as necessary. Levels should be monitored more frequently when denosumab is given with other drugs that can lower calcium levels. Patients should be advised to contact a healthcare professional if they experience symptoms of hypocalcemia.
Osteonecrosis of the jaw can occur in patients receiving denosumab. Patients who are suspected of having or who develop osteonecrosis of the jaw while on treatment should receive care by a dentist or an oral surgeon.
Atypical femoral fracture has been reported with denosumab, so patients should be advised to report new or unusual thigh, hip, or groin pain. Patients presenting with an atypical femur fracture should be assessed for signs of fracture in the contralateral limb. Physicians should consider interrupting denosumab pending a risk/benefit assessment.
Denosumab can cause fetal harm when administered to a pregnant woman. Physicians should advise females of reproductive potential to use highly effective contraception during therapy and for at least 5 months after the last dose of denosumab.
Amgen, the company developing denosumab, markets the drug as both XGEVA and Prolia (for different indications). Patients receiving XGEVA should not take Prolia.
For more information on denosumab (XGEVA), visit www.xgeva.com. ![]()
Combo may enhance spleen reductions in MF

the 2014 ASH Annual Meeting
SAN FRANCISCO—Combination therapy with ruxolitinib and panobinostat shows signs of efficacy in myelofibrosis (MF), according to research
presented at the 2014 ASH Annual Meeting.
“Targeting multiple components of the JAK/STAT pathway, as well as parallel signaling pathways that may also be involved in the pathogenesis of myelofibrosis, has the potential to have a synergistic therapeutic effect on the underlying disease,” said Jean-Jacques Kiladjian MD, PhD, of the Hôpital Saint-Louis and Université Paris Diderot in Paris, France.
Ruxolitinib, a potent JAK1/JAK2 inhibitor, demonstrated rapid and durable reductions in splenomegaly and MF-related symptoms, improved quality of life, and provided a survival advantage in the phase 3 COMFORT studies.
Panobinostat, a potent oral pan-deacetylase inhibitor, reduced spleen size, symptoms, and JAK2V617F allele burden in patients with MF in phase 1 and phase 2 studies.
The combination of ruxolitinib and panobinostat demonstrated synergistic anti-MF activity in a phase 1b study.
At ASH, Dr Kiladjian presented updated results from the expansion phase of this trial (abstract 711). This study was sponsored by Novartis, the company developing ruxolitinib.
The treatment schedule was ruxolitinib at 5 mg to 15 mg twice daily and panobinostat at 10 mg to 25 mg once daily 3 times per week on days 2, 4, and 6 every other week in a 28-day cycle.
A dose-escalation phase included 38 patients with a median age of 63 years, and an expansion phase included 23 patients with a median age of 67 years.
The recommended phase 2 dose was 15 mg of ruxolitinib twice daily and 25 mg of panobinostat twice weekly, every other week.
“Changes in spleen size were seen in the escalation phase, even at low doses,” Dr Kiladjian said. “Some patients completely eliminated splenomegaly.”
The expansion phase showed similar results. At 24 weeks, more than 85% of patients had a 50% or greater reduction in splenomegaly. Some 59% of patients achieved a 50% or greater reduction in palpable spleen length.
“We saw some JAK2 inhibition and reduction in bone marrow fibrosis, as well as significant reduction in several cytokines related to inflammation,” Dr Kiladjian said.
The most common hematologic adverse events were anemia and thrombocytopenia. There were few neutropenias.
“We saw quite remarkably stable levels of hemoglobin and platelets,” Dr Kiladjian said.
Non-hematologic adverse events were primarily gastrointestinal toxicity associated with panobinostat, including grade 3 or 4 diarrhea and asthenia.
“The rates of adverse events observed in this trial are in line with the expected and known adverse events of these 2 agents when used as monotherapies,” Dr Kiladjian said.
“The combination of ruxolitinib and panobinostat was well-tolerated and resulted in substantial reductions in splenomegaly. Most patients treated at the [recommended phase 2 dose] of combination therapy achieved a spleen response.”
Dr Kiladjian therefore encouraged further exploration of this “favorable” combination. ![]()
Osteoporosis medication use down in older women
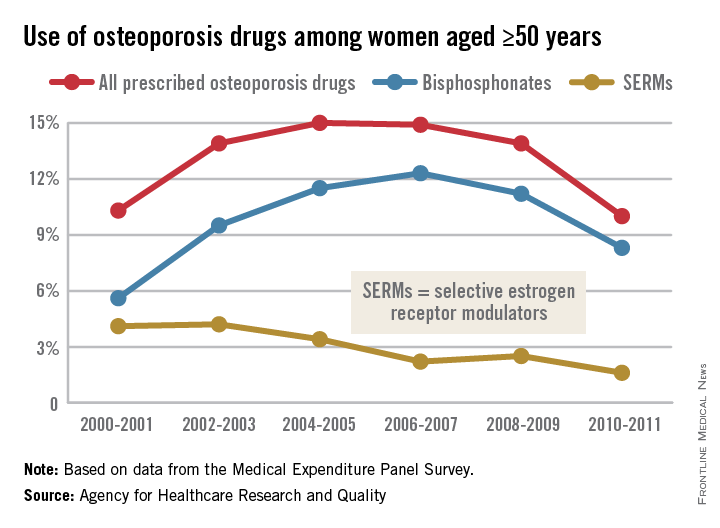
Even as the number of women aged 50 years and older continues to rise, the percentage who are taking osteoporosis medications has fallen by one-third since 2004-2005, the Agency for Healthcare Research and Quality reported.
In 2004-2005, 15% of all women aged 50 years and over were using some form of prescribed osteoporosis drug, but that number had dropped to 10% by 2010-2011, according to data from the Medical Expenditure Panel Survey. The total number of women aged 50 and older increased from 47.8 million to 55.2 million over that same time period.

In 2010-2011, 8.3% of all women aged at least 50 years were using bisphosphonates, down from a high of 12.3% in 2006-2007 but up from 5.6% in 2000-2001. Use of the next most popular form of osteoporosis medication, the selective estrogen receptor modulators (SERMS), declined from 4.2% of all older women in 2002-2003 to 1.6% in 2010-2011, the AHRQ said.
Data for denosumab (Prolia), a fully human monoclonal antibody drug approved for the treatment of osteoporosis, were not available in the MEPS during the analysis period.
Even as the number of women aged 50 years and older continues to rise, the percentage who are taking osteoporosis medications has fallen by one-third since 2004-2005, the Agency for Healthcare Research and Quality reported.
In 2004-2005, 15% of all women aged 50 years and over were using some form of prescribed osteoporosis drug, but that number had dropped to 10% by 2010-2011, according to data from the Medical Expenditure Panel Survey. The total number of women aged 50 and older increased from 47.8 million to 55.2 million over that same time period.
In 2010-2011, 8.3% of all women aged at least 50 years were using bisphosphonates, down from a high of 12.3% in 2006-2007 but up from 5.6% in 2000-2001. Use of the next most popular form of osteoporosis medication, the selective estrogen receptor modulators (SERMS), declined from 4.2% of all older women in 2002-2003 to 1.6% in 2010-2011, the AHRQ said.
Data for denosumab (Prolia), a fully human monoclonal antibody drug approved for the treatment of osteoporosis, were not available in the MEPS during the analysis period.
The Spectrum of Pigmented Purpuric Dermatosis and Mycosis Fungoides: Atypical T-Cell Dyscrasia
Case Report
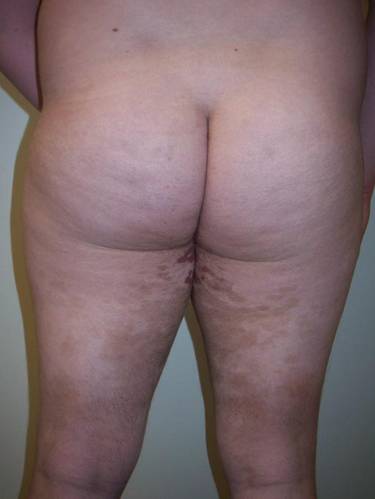
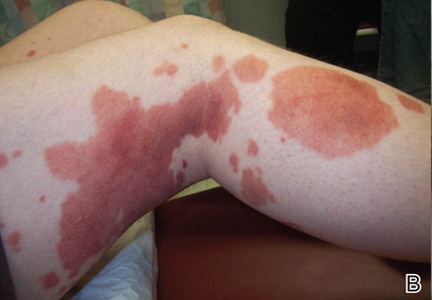
A healthy 17-year-old adolescent boy with an unremarkable medical history presented with an asymptomatic fixed rash on the abdomen, buttocks, and legs. The rash initially developed in a small area on the right leg 2 years prior and had slowly progressed. He was not currently taking any medications and did not participate in intense physical activity. Multiple biopsies had previously been performed by an outside physician, the most recent one demonstrating an interface and superficial perivascular lymphocytic infiltrate with extravasated red blood cells consistent with pigmented purpura. He did not respond to treatment with intralesional corticosteroids, high-potency topical steroids, or high-dose oral prednisone.
Clinical examination revealed multiple annular purpuric patches on the abdomen, buttocks, and legs that covered approximately 20% of the body surface area (Figure 1). Over several follow-up visits, a few of the lesions evolved from patches to thin plaques. There was no adenopathy or hepatosplenomegaly. Three additional biopsies taken over the next 4 months demonstrated a mixture of small mature lymphocytes with some atypical lymphocytes in the dermis and epidermis exhibiting diminished CD7 staining and lymphocytes lining up at the dermoepidermal junction. T-cell receptor g gene rearrangements demonstrated the same clonal population in all 3 specimens. The patient was diagnosed with stage IB mycosis fungoides (MF) of the pigmented purpura–like variant. Marked improvement of the lesions was noted after 6 weeks of psoralen plus UVA therapy 3 times weekly (Figure 2). Treatment was continued for 6 months but was discontinued due to the international shortage of methoxsalen. Two months after discontinuation, most of the lesions had completely resolved (Figure 3).
|


Comment
Mycoses fungoides is a rare cutaneous lymphoma that affects approximately 2000 patients in the United States.1 Only 5% of all cases are known to occur in the first 2 decades of life,2 and even fewer cases pre-sent with pigmented purpura, usually of the lichenoid variant.3 Although the patches and plaques of MF can masquerade as many other dermatoses (eg, dermatophytosis, psoriasis, dermatitis), there have been few reports of patients presenting with lesions with the clinical appearance of pigmented purpuric dermatosis (PPD).4 As with the many cases of early MF, which are histologically indistinguishable from dermatitis, the pigmented purpura–like variant of MF initially may have the histologic appearance of pigmented purpura and generally evolves to the histologic appearance of MF over time.
Similar to our case, there have been reports of clinical and histologic diagnosis of PPD preceding the histologic diagnosis of MF. In a small cohort study of 3 young men, Barnhill and Braverman5 first demonstrated the progression of PPD to MF over a 12-year period. The age of onset ranged from 14 to 30 years, with a mean age of 24.3 years. Biopsies in all 3 patients were consistent with PPD for many years prior to the diagnosis of MF, with an average length of time to diagnosis of 8.4 years. Atypical from most cases of PPD, the patients in this study demonstrated extensive involvement of the trunk, arms, and legs.5 It has been suggested that atypical PPD is a variant of PPD that evolves into MF over many years; however, we believe that PPD is a variant of MF, similar to the way an indolent dermatitis may evolve to classical MF over time. If characterized by a T-cell clone, this period preceding the diagnosis of cutaneous T-cell lymphoma could be characterized as a cutaneous T-cell lymphoid dyscrasia.
Guitart and Magro6 noted multiple chronic conditions that are associated with T-cell clones, including PPD. These conditions occurred without a known trigger, were unresponsive to topical therapies, and often did not meet diagnostic criteria for MF. The investigators felt the criteria that may indicate a cutaneous T-cell lymphoid dyscrasia include widespread distribution, lymphocytic infiltrate, diminished CD7 and CD62L expression, and clonality. Lymphocytes may be small without notable atypia.6
In a study of 43 patients with PPD, Magro et al3 found monoclonality and diminished CD7 expression in 18 participants, correlating with large surface area involvement. Approximately 40% of patients had histologic findings consistent with MF, suggesting that T-cell gene rearrangement studies should be obtained for prognostic evaluation in patients with widespread disease.3

| 
|
To facilitate proper patient care, histopathology and molecular markers should be evaluated in conjunction with the clinical picture. A considerable increase in the size of the body surface area affected by purpuric patches combined with the presence of poikilodermatous changes and pruritus as well as disease lasting longer than 1 year should prompt an increased clinical suspicion of MF in patients with PPD.4,5 Histologically, the presence of Pautrier microabscesses, large cerebriform lymphocytes, and intraepidermal lymphocytic atypia extending beyond the dermis also would support a diagnosis of MF.3 Given the morphologic appearance and distribution of the lesions in our patient combined with epidermotropism, diminished CD7 expression, and monoclonality seen on pathology, we favored a diagnosis of MF. It would not be unreasonable to call this clonal variant of PPD a T-cell lymphoid dyscrasia. We appreciate that both PPD and MF will respond to phototherapy.7
Conclusion
We propose that there is a spectrum of disease presenting as PPD or MF sitting at either end of that spectrum and an intermediate stage, where not all criteria for cutaneous lymphoma are met, characterized as cutaneous T-cell lymphoid dyscrasia. Until the potential for evolution of PPD to malignant disease is better understood, patients with unusual presentations of pigmented purpura should be further evaluated for MF.
1. Criscione VD, Weinstock MA. Incidence of cutaneous T-cell lymphoma in the United States, 1973-2002. Arch Dermatol. 2007;143:854-859.
2. Koch SE, Zackheim HS, Williams ML, et al. Mycosis fungoides beginning in childhood and adolescence. J Am Acad Dermatol. 1987;17:563-570.
3. Magro CM, Schaefer JT, Crowson AN, et al. Pigmented purpuric dermatosis: classification by phenotypic and molecular profiles. Am J Clin Pathol. 2007;128:218-229.
4. Hanna S, Walsh N, D’Intino Y, et al. Mycosis fungoides presenting as pigmented purpuric dermatitis. Pediatr Dermatol. 2006;23:350-354.
5. Barnhill RL, Braverman IM. Progression of pigmented purpura-like eruptions to mycosis fungoides: report of three cases. J Am Acad Dermatol. 1988;19(1, pt 1):25-31.
6. Guitart J, Magro C. Cutaneous T-cell lymphoid dyscrasia: a unifying term for idiopathic chronic dermatoses with persistent T-cell clones. Arch Dermatol. 2007;143:921-932.
7. Seckin D, Yazici Z, Senol A, et al. A case of Schamberg’s disease responding dramatically to PUVA treatment. Photodermatol Photoimmunol Photomed. 2008;24:95-96.
Case Report
A healthy 17-year-old adolescent boy with an unremarkable medical history presented with an asymptomatic fixed rash on the abdomen, buttocks, and legs. The rash initially developed in a small area on the right leg 2 years prior and had slowly progressed. He was not currently taking any medications and did not participate in intense physical activity. Multiple biopsies had previously been performed by an outside physician, the most recent one demonstrating an interface and superficial perivascular lymphocytic infiltrate with extravasated red blood cells consistent with pigmented purpura. He did not respond to treatment with intralesional corticosteroids, high-potency topical steroids, or high-dose oral prednisone.
Clinical examination revealed multiple annular purpuric patches on the abdomen, buttocks, and legs that covered approximately 20% of the body surface area (Figure 1). Over several follow-up visits, a few of the lesions evolved from patches to thin plaques. There was no adenopathy or hepatosplenomegaly. Three additional biopsies taken over the next 4 months demonstrated a mixture of small mature lymphocytes with some atypical lymphocytes in the dermis and epidermis exhibiting diminished CD7 staining and lymphocytes lining up at the dermoepidermal junction. T-cell receptor g gene rearrangements demonstrated the same clonal population in all 3 specimens. The patient was diagnosed with stage IB mycosis fungoides (MF) of the pigmented purpura–like variant. Marked improvement of the lesions was noted after 6 weeks of psoralen plus UVA therapy 3 times weekly (Figure 2). Treatment was continued for 6 months but was discontinued due to the international shortage of methoxsalen. Two months after discontinuation, most of the lesions had completely resolved (Figure 3).
|
Comment
Mycoses fungoides is a rare cutaneous lymphoma that affects approximately 2000 patients in the United States.1 Only 5% of all cases are known to occur in the first 2 decades of life,2 and even fewer cases pre-sent with pigmented purpura, usually of the lichenoid variant.3 Although the patches and plaques of MF can masquerade as many other dermatoses (eg, dermatophytosis, psoriasis, dermatitis), there have been few reports of patients presenting with lesions with the clinical appearance of pigmented purpuric dermatosis (PPD).4 As with the many cases of early MF, which are histologically indistinguishable from dermatitis, the pigmented purpura–like variant of MF initially may have the histologic appearance of pigmented purpura and generally evolves to the histologic appearance of MF over time.
Similar to our case, there have been reports of clinical and histologic diagnosis of PPD preceding the histologic diagnosis of MF. In a small cohort study of 3 young men, Barnhill and Braverman5 first demonstrated the progression of PPD to MF over a 12-year period. The age of onset ranged from 14 to 30 years, with a mean age of 24.3 years. Biopsies in all 3 patients were consistent with PPD for many years prior to the diagnosis of MF, with an average length of time to diagnosis of 8.4 years. Atypical from most cases of PPD, the patients in this study demonstrated extensive involvement of the trunk, arms, and legs.5 It has been suggested that atypical PPD is a variant of PPD that evolves into MF over many years; however, we believe that PPD is a variant of MF, similar to the way an indolent dermatitis may evolve to classical MF over time. If characterized by a T-cell clone, this period preceding the diagnosis of cutaneous T-cell lymphoma could be characterized as a cutaneous T-cell lymphoid dyscrasia.
Guitart and Magro6 noted multiple chronic conditions that are associated with T-cell clones, including PPD. These conditions occurred without a known trigger, were unresponsive to topical therapies, and often did not meet diagnostic criteria for MF. The investigators felt the criteria that may indicate a cutaneous T-cell lymphoid dyscrasia include widespread distribution, lymphocytic infiltrate, diminished CD7 and CD62L expression, and clonality. Lymphocytes may be small without notable atypia.6
In a study of 43 patients with PPD, Magro et al3 found monoclonality and diminished CD7 expression in 18 participants, correlating with large surface area involvement. Approximately 40% of patients had histologic findings consistent with MF, suggesting that T-cell gene rearrangement studies should be obtained for prognostic evaluation in patients with widespread disease.3
|
|
|
To facilitate proper patient care, histopathology and molecular markers should be evaluated in conjunction with the clinical picture. A considerable increase in the size of the body surface area affected by purpuric patches combined with the presence of poikilodermatous changes and pruritus as well as disease lasting longer than 1 year should prompt an increased clinical suspicion of MF in patients with PPD.4,5 Histologically, the presence of Pautrier microabscesses, large cerebriform lymphocytes, and intraepidermal lymphocytic atypia extending beyond the dermis also would support a diagnosis of MF.3 Given the morphologic appearance and distribution of the lesions in our patient combined with epidermotropism, diminished CD7 expression, and monoclonality seen on pathology, we favored a diagnosis of MF. It would not be unreasonable to call this clonal variant of PPD a T-cell lymphoid dyscrasia. We appreciate that both PPD and MF will respond to phototherapy.7
Conclusion
We propose that there is a spectrum of disease presenting as PPD or MF sitting at either end of that spectrum and an intermediate stage, where not all criteria for cutaneous lymphoma are met, characterized as cutaneous T-cell lymphoid dyscrasia. Until the potential for evolution of PPD to malignant disease is better understood, patients with unusual presentations of pigmented purpura should be further evaluated for MF.
1. Criscione VD, Weinstock MA. Incidence of cutaneous T-cell lymphoma in the United States, 1973-2002. Arch Dermatol. 2007;143:854-859.
2. Koch SE, Zackheim HS, Williams ML, et al. Mycosis fungoides beginning in childhood and adolescence. J Am Acad Dermatol. 1987;17:563-570.
3. Magro CM, Schaefer JT, Crowson AN, et al. Pigmented purpuric dermatosis: classification by phenotypic and molecular profiles. Am J Clin Pathol. 2007;128:218-229.
4. Hanna S, Walsh N, D’Intino Y, et al. Mycosis fungoides presenting as pigmented purpuric dermatitis. Pediatr Dermatol. 2006;23:350-354.
5. Barnhill RL, Braverman IM. Progression of pigmented purpura-like eruptions to mycosis fungoides: report of three cases. J Am Acad Dermatol. 1988;19(1, pt 1):25-31.
6. Guitart J, Magro C. Cutaneous T-cell lymphoid dyscrasia: a unifying term for idiopathic chronic dermatoses with persistent T-cell clones. Arch Dermatol. 2007;143:921-932.
7. Seckin D, Yazici Z, Senol A, et al. A case of Schamberg’s disease responding dramatically to PUVA treatment. Photodermatol Photoimmunol Photomed. 2008;24:95-96.
Practice Points
- Pigmented purpuric dermatosis may lie on a spectrum with mycosis fungoides (MF).
- Pigmented purpuric dermatosis of MF should be closely followed and likely treated as MF.
- Pigmented purpuric dermatosis may have T-cell gene rearrangements that may or may not be associated with MF.
Predictions for 2015
Last year, there were five predictions made that appeared to be on the money – but there is more to the story!
1. The approach to diagnosis and treatment of influenza was essential knowledge for clinicians. Last year, we started seeing influenza activity early – with disease confirmed in mid-November, peaking during the week ending December 28, 2013 and trending downward in early January 2014. Hospitalizations were most common in young and middle aged adults and the 2009 H1N1 virus predominated.

This year, again we are seeing influenza early – with nearly all states reporting at least sporadic and local activity, and several states (Alaska, Florida, Louisiana, Massachusetts, and Texas) reporting regional activity as of the week ending November 24, 2014. At my institution, we’ve already tested over 500 children and over 100 were positive – influenza A (H3N2) strains are predominating. That may be important for the two reasons you’ll read below.
2. Invasive staphylococcal disease caused by methicillin-susceptible Staphylococcus aureus (MSSA) was more common than methicillin-resistant Staphylococcus aureus (MRSA), as the national burden of MRSA disease decreased (JAMA 2014;311:1438-9). The rates of clindamycin resistance continue to be pretty steady at approximately 15%-18%, but higher for MSSA than for MRSA – a point that is important to consider when empirically treating suspected invasive staphylococcal infection.
3. Multidrug resistant uropathogens took an increasingly prominent role in 2014, requiring careful approach to diagnosis (every child treated for urinary tract infection should have an appropriately obtained urine culture with an identified pathogen) and treatment (the drug used should be based on antibiotic susceptibility testing results). Particularly concerning is the emergence of carbapenem-resistant Enterobacteriaceae, which cause infection more commonly in hospitalized patients, those with indwelling devices, and those who have received long courses of antibiotics.
4. It was an outbreak year for parechovirus (HPeV), a viral pathogen causing meningitis in very young infants. Such infants present with signs and symptoms of meningitis but rarely show CSF pleocytosis. Diagnosis relies on the detection of the virus by polymerase chain reaction testing in CSF – a test which is not routinely available in many laboratories. At my institution this season, we saw nearly as many cases of parechovirus meningitis (n = 43) as we saw cases of enterovirus meningitis (n = 63). The parechovirus virus we detected was HPeV type 3, which can cause particularly severe disease in neonates.
5. Data confirmed that making human papillomavirus (HPV) vaccine a standard recommendation increased vaccine uptake and coverage. In February of 2014, a “Dear Colleague” letter that was endorsed by six leading medical organizations encouraged providers to promote HPV vaccination by giving a strong recommendation, citing data based on research conducted by the Centers for Disease Control and Prevention. We still have a long way to go as HPV vaccine coverage for teens remains at 35% for the three-dose series while meningococcal and Tdap vaccine (both vaccines that generally receive a standard recommendation by physicians) coverage is at nearly 90%.
So for 2015, I’ll start the discussion by saying there are five major developments I did not see coming for this past year, but that will remain relevant for the year 2015!
1. In June of 2014, live attenuated influenza vaccine (LAIV) was announced by the Advisory Committee on Immunization Practices to be the preferred vaccine in children aged 2-8 years. The American Academy of Pediatrics followed with a recommendation that either inactivated influenza vaccine (IIV) or LAIV be used for children, including children aged 2-8 years – the key being to give the vaccine as soon as one had it available. What was not known then and I did not predict was that newer data would confirm that in children aged 2-8 years who received LAIV last year when 2009 H1N1 strains predominated, there was essentially no coverage against 2009 H1N1 virus. This was in contrast to data from the prior 2 years and is as yet unexplained. The AAP continues to recommend that either vaccine be given and all children be immunized. That may be especially important this year as the influenza season started early. Disease will likely have been widespread by Christmas in many parts of the United States, and it looks like influenza A H3N2 strains will be most commonly noted. So the good news for young children who received LAIV is that 2009 H1N1 strains so far have not been seen this year. The bad news is that there are two H3N2 strains circulating, and potentially only one will be covered by the 2014-2015 seasonal vaccine. Staffing your office and hospital for a likely high census respiratory viral season is going to be essential.
2. The largest U.S. outbreak ever of enterovirus (EV) D-68 respiratory infection occurred between August and October of 2014. This virus – which had been identified in 1962 but was rarely described over the next 36 years except in small clusters of disease – was reported in nearly every state and characterized by unusually severe respiratory tract infection. Many, but not all children, had a history of asthma or prior wheezing, and the clinical presentation was that of severe bronchospasm that was generally resistant to standard bronchodilator therapy. The spectrum of infection likely ranged from mild upper respiratory infection to severe bronchospasm with respiratory failure, and the burden of disease resulting in hospitalization was substantial at many children’s hospitals. The big question now is what will enterovirus season 2015 bring us? The good news here is that we now have a test to rapidly diagnose EV D-68, which will allow us to more clearly understand the burden of disease – and potentially to define antiviral treatment (none of the current antivirals is effective) and prevention (there is no vaccine against EV D-68).
3. The etiology of the neurologic illness, which appeared to mimic polio and presented during the same time frame during which EV D-68 was circulating, is as yet unknown. As of Nov. 26, 2014, the CDC has received reports of 90 children in 32 states who meet a case definition consistent with acute flaccid myelitis. While certain viruses – including West Nile virus, herpes virus, adenovirus, and certain enterovirus types (for example, enterovirus 71, and the classic being polio) – may cause acute flaccid paralysis and can be confirmed by detecting the virus in cerebrospinal fluid and stool, to date virus testing for all viruses, including EV D-68, has been negative in all of the patients reported. Hopefully, 2015 will be the year that will allow us to more clearly understand this neurologic illness – and this is important because so far most children have shown minimal recovery of function.
4. If you see a child (or adult) who recently traveled to the Caribbean and returns with fever, rash, and joint pain, especially with severe pain of the hands and feet, think chikungunya virus infection. As of the end of October 2014, local transmission had been identified in 37 countries or territories in the Caribbean (including Puerto Rico and the U.S. Virgin Islands), with a total of 780,206 suspected cases and over 15,000 confirmed cases reported from these areas. Consider this in contrast to the numbers from 2006 through 2011, when 117 cases of chikungunya fever were reported in returning travelers. As of Dec. 2, a total of 1,911 chikungunya virus disease cases have been reported to ArboNET from U.S. states. The mosquito that transmits chikungunya virus can bite in day and night, and prevention relies on appropriate use of mosquito repellents. Physicians should be prepared to discuss the risks of this virus with travelers who plan a trip to the Caribbean, especially those at high risk, including those with underlying medical conditions, preexisting arthritis diagnoses, and pregnant women (because of the potential risk to newborns whose mothers develop intrapartum infection).
5. And lastly, Ebola. While there were reports that Ebola virus disease had emerged in West Africa as early as December of 2013, the scope of the outbreak and extent of loss of human life has been unbelievably huge. Dr. Carrie Byington, who is the current chair of the AAP Committee on Infectious Diseases, wrote an article in AAP News in October 2014 describing the needs of children who have been impacted by Ebola virus disease (EVD). She noted that UNICEF estimated there were at that time, over 4,000 Ebola orphans in the countries most affected by EVD, including Sierra Leone, Liberia, and Guinea, and that these countries urgently needed medical infrastructure for treatment and prevention of this disease. It appears that at least two Ebola vaccines will be deployed in West Africa in 2015, and it is not a moment too soon. While cases in Liberia seemed to be decreasing, it looks like Sierra Leone cases continue to mount.
Dr. Jackson is chief of pediatric infectious diseases at Children’s Mercy Hospital, Kansas City, Mo., and professor of pediatrics at the University of Missouri–Kansas City. Dr. Jackson was a member of the AAP Committee on Infectious Diseases who wrote the AAP clinical report entitled “Guidance on Management of Asymptomatic Neonates Born to Women With Active Genital Herpes Lesions,” but said she had no other conflicts of interest to disclose. E-mail her at [email protected].
Last year, there were five predictions made that appeared to be on the money – but there is more to the story!
1. The approach to diagnosis and treatment of influenza was essential knowledge for clinicians. Last year, we started seeing influenza activity early – with disease confirmed in mid-November, peaking during the week ending December 28, 2013 and trending downward in early January 2014. Hospitalizations were most common in young and middle aged adults and the 2009 H1N1 virus predominated.
This year, again we are seeing influenza early – with nearly all states reporting at least sporadic and local activity, and several states (Alaska, Florida, Louisiana, Massachusetts, and Texas) reporting regional activity as of the week ending November 24, 2014. At my institution, we’ve already tested over 500 children and over 100 were positive – influenza A (H3N2) strains are predominating. That may be important for the two reasons you’ll read below.
2. Invasive staphylococcal disease caused by methicillin-susceptible Staphylococcus aureus (MSSA) was more common than methicillin-resistant Staphylococcus aureus (MRSA), as the national burden of MRSA disease decreased (JAMA 2014;311:1438-9). The rates of clindamycin resistance continue to be pretty steady at approximately 15%-18%, but higher for MSSA than for MRSA – a point that is important to consider when empirically treating suspected invasive staphylococcal infection.
3. Multidrug resistant uropathogens took an increasingly prominent role in 2014, requiring careful approach to diagnosis (every child treated for urinary tract infection should have an appropriately obtained urine culture with an identified pathogen) and treatment (the drug used should be based on antibiotic susceptibility testing results). Particularly concerning is the emergence of carbapenem-resistant Enterobacteriaceae, which cause infection more commonly in hospitalized patients, those with indwelling devices, and those who have received long courses of antibiotics.
4. It was an outbreak year for parechovirus (HPeV), a viral pathogen causing meningitis in very young infants. Such infants present with signs and symptoms of meningitis but rarely show CSF pleocytosis. Diagnosis relies on the detection of the virus by polymerase chain reaction testing in CSF – a test which is not routinely available in many laboratories. At my institution this season, we saw nearly as many cases of parechovirus meningitis (n = 43) as we saw cases of enterovirus meningitis (n = 63). The parechovirus virus we detected was HPeV type 3, which can cause particularly severe disease in neonates.
5. Data confirmed that making human papillomavirus (HPV) vaccine a standard recommendation increased vaccine uptake and coverage. In February of 2014, a “Dear Colleague” letter that was endorsed by six leading medical organizations encouraged providers to promote HPV vaccination by giving a strong recommendation, citing data based on research conducted by the Centers for Disease Control and Prevention. We still have a long way to go as HPV vaccine coverage for teens remains at 35% for the three-dose series while meningococcal and Tdap vaccine (both vaccines that generally receive a standard recommendation by physicians) coverage is at nearly 90%.
So for 2015, I’ll start the discussion by saying there are five major developments I did not see coming for this past year, but that will remain relevant for the year 2015!
1. In June of 2014, live attenuated influenza vaccine (LAIV) was announced by the Advisory Committee on Immunization Practices to be the preferred vaccine in children aged 2-8 years. The American Academy of Pediatrics followed with a recommendation that either inactivated influenza vaccine (IIV) or LAIV be used for children, including children aged 2-8 years – the key being to give the vaccine as soon as one had it available. What was not known then and I did not predict was that newer data would confirm that in children aged 2-8 years who received LAIV last year when 2009 H1N1 strains predominated, there was essentially no coverage against 2009 H1N1 virus. This was in contrast to data from the prior 2 years and is as yet unexplained. The AAP continues to recommend that either vaccine be given and all children be immunized. That may be especially important this year as the influenza season started early. Disease will likely have been widespread by Christmas in many parts of the United States, and it looks like influenza A H3N2 strains will be most commonly noted. So the good news for young children who received LAIV is that 2009 H1N1 strains so far have not been seen this year. The bad news is that there are two H3N2 strains circulating, and potentially only one will be covered by the 2014-2015 seasonal vaccine. Staffing your office and hospital for a likely high census respiratory viral season is going to be essential.
2. The largest U.S. outbreak ever of enterovirus (EV) D-68 respiratory infection occurred between August and October of 2014. This virus – which had been identified in 1962 but was rarely described over the next 36 years except in small clusters of disease – was reported in nearly every state and characterized by unusually severe respiratory tract infection. Many, but not all children, had a history of asthma or prior wheezing, and the clinical presentation was that of severe bronchospasm that was generally resistant to standard bronchodilator therapy. The spectrum of infection likely ranged from mild upper respiratory infection to severe bronchospasm with respiratory failure, and the burden of disease resulting in hospitalization was substantial at many children’s hospitals. The big question now is what will enterovirus season 2015 bring us? The good news here is that we now have a test to rapidly diagnose EV D-68, which will allow us to more clearly understand the burden of disease – and potentially to define antiviral treatment (none of the current antivirals is effective) and prevention (there is no vaccine against EV D-68).
3. The etiology of the neurologic illness, which appeared to mimic polio and presented during the same time frame during which EV D-68 was circulating, is as yet unknown. As of Nov. 26, 2014, the CDC has received reports of 90 children in 32 states who meet a case definition consistent with acute flaccid myelitis. While certain viruses – including West Nile virus, herpes virus, adenovirus, and certain enterovirus types (for example, enterovirus 71, and the classic being polio) – may cause acute flaccid paralysis and can be confirmed by detecting the virus in cerebrospinal fluid and stool, to date virus testing for all viruses, including EV D-68, has been negative in all of the patients reported. Hopefully, 2015 will be the year that will allow us to more clearly understand this neurologic illness – and this is important because so far most children have shown minimal recovery of function.
4. If you see a child (or adult) who recently traveled to the Caribbean and returns with fever, rash, and joint pain, especially with severe pain of the hands and feet, think chikungunya virus infection. As of the end of October 2014, local transmission had been identified in 37 countries or territories in the Caribbean (including Puerto Rico and the U.S. Virgin Islands), with a total of 780,206 suspected cases and over 15,000 confirmed cases reported from these areas. Consider this in contrast to the numbers from 2006 through 2011, when 117 cases of chikungunya fever were reported in returning travelers. As of Dec. 2, a total of 1,911 chikungunya virus disease cases have been reported to ArboNET from U.S. states. The mosquito that transmits chikungunya virus can bite in day and night, and prevention relies on appropriate use of mosquito repellents. Physicians should be prepared to discuss the risks of this virus with travelers who plan a trip to the Caribbean, especially those at high risk, including those with underlying medical conditions, preexisting arthritis diagnoses, and pregnant women (because of the potential risk to newborns whose mothers develop intrapartum infection).
5. And lastly, Ebola. While there were reports that Ebola virus disease had emerged in West Africa as early as December of 2013, the scope of the outbreak and extent of loss of human life has been unbelievably huge. Dr. Carrie Byington, who is the current chair of the AAP Committee on Infectious Diseases, wrote an article in AAP News in October 2014 describing the needs of children who have been impacted by Ebola virus disease (EVD). She noted that UNICEF estimated there were at that time, over 4,000 Ebola orphans in the countries most affected by EVD, including Sierra Leone, Liberia, and Guinea, and that these countries urgently needed medical infrastructure for treatment and prevention of this disease. It appears that at least two Ebola vaccines will be deployed in West Africa in 2015, and it is not a moment too soon. While cases in Liberia seemed to be decreasing, it looks like Sierra Leone cases continue to mount.
Dr. Jackson is chief of pediatric infectious diseases at Children’s Mercy Hospital, Kansas City, Mo., and professor of pediatrics at the University of Missouri–Kansas City. Dr. Jackson was a member of the AAP Committee on Infectious Diseases who wrote the AAP clinical report entitled “Guidance on Management of Asymptomatic Neonates Born to Women With Active Genital Herpes Lesions,” but said she had no other conflicts of interest to disclose. E-mail her at [email protected].

Implications of cholesterol guidelines for cardiology practices
CHICAGO – Cardiologists certainly have their work cut out in order to bring their patients into concordance with the 2013 American College of Cardiology/American Heart Association cholesterol guidelines, according to Dr. Thomas M. Maddox.
An analysis of nearly 1.2 million patients in U.S. outpatient cardiology practices showed that one in three who appeared to have an indication for statin therapy under the latest guidelines weren’t on a statin as of 2012. That constitutes a sizable “statin gap” that cardiologists need to address, he said at the American Heart Association scientific sessions.

Dr. Maddox presented an analysis of 1,174,535 adult patients under cardiologists’ care during 2008-2012 in more than 100 U.S. outpatient cardiology practices participating in the voluntary National Cardiovascular Data Registry’s Practice Innovation and Clinical Excellence Registry (NCDR PINNACLE). Under this national office-based quality improvement program sponsored by the ACC, patient electronic medical record (EMR) data gets uploaded to the registry nightly.
The 2013 ACC/AHA cholesterol guidelines in some ways greatly simplified patient management. The guidelines redefined the risk groups warranting treatment: basically, patients with known atherosclerotic cardiovascular disease (ASCVD), diabetes, an off-treatment LDL of 190 mg/dL or more, or a 10-year ASCVD risk of 7.5% or greater using the risk calculator incorporated in the guidelines (Circulation 2014; 129:S1-45). Also, physicians were advised to use fixed-dose statins and no longer to treat to an LDL target, thereby making repeated LDL testing unnecessary.
The purposes of this new NCDR PINNACLE study were to evaluate the potential impact of the new guidelines on current cardiology practice through an assessment of current treatment and testing patterns, and to make a determination of the scope of changes necessary under the 2013 guidelines, explained Dr. Maddox, a cardiologist at the Veterans Affairs Eastern Colorado Health Care System and the University of Colorado at Denver.
Under the new guidelines, 1,129,205 adult cardiology patients, or 96% of the study population, appeared to be candidates for statin therapy, most often because they had known ASCVD, as was the case in 88%, or diabetes without known ASCVD, accounting for another 6%.
Among the statin-eligible patients, 29% were not on any lipid-lowering therapy, and another 3% were on nonstatin lipid-lowering agents only, which is not recommended in the guidelines. Thus, 32% of the cardiologists’ patients for whom statin therapy appeared to be indicated under the 2013 guidelines weren’t on it.
In addition, 29% of statin-eligible patients were on combined lipid-lowering therapy with a statin plus a nonstatin, such as niacin, a fibrate, or ezetimibe. The guidelines don’t recommend the use of nonstatins because of the lack of evidence of clinical benefit, so cardiologists will want to reconsider their use of combination therapy in this sizable group. The major caveat here is that the guidelines are likely to be revised to embrace the selective use of a moderate-intensity statin plus ezetimibe on the basis of the positive findings of the IMPROVE-IT trial, also presented at the AHA meeting, Dr. Maddox noted.
The registry analysis also pointed to a need to reduce repeated LDL testing, which the guidelines characterize as costly, inconvenient, and unnecessary. Nearly 21% of subjects had at least two LDL assessments during the 4-year period, and 7% had more than four. And those figures probably underestimate the true rate of LDL testing, since many patients may have also had LDL measurements taken in primary care settings.
Several audience members rose to decry the one-in-three-patient statin gap as evidence of widespread substandard care by cardiologists, especially given that 28% of the patients with known ASCVD and 36% with diabetes were not receiving any lipid-lowering therapy, contrary to recommendations both in the current ACC/AHA guidelines and the guidelines in place in 2012. There is good evidence to show that putting such patients on statin therapy would result in roughly a 25% reduction in cardiovascular events.
But Dr. Maddox took a more sanguine view of the statin gap. Although it’s likely there is some heterogeneity in clinical practice that needs to be corrected, he cautioned that the limitations of an analysis based upon EMR data must be borne in mind. Some cardiologists probably didn’t record the use of statins at every visit, and they may not have always reliably documented patients’ intolerance of statins in the EMR.
The NCDR PINNACLE Registry is supported by the American College of Cardiology Foundation. Dr. Maddox reported having no relevant financial conflicts of interest.
CHICAGO – Cardiologists certainly have their work cut out in order to bring their patients into concordance with the 2013 American College of Cardiology/American Heart Association cholesterol guidelines, according to Dr. Thomas M. Maddox.
An analysis of nearly 1.2 million patients in U.S. outpatient cardiology practices showed that one in three who appeared to have an indication for statin therapy under the latest guidelines weren’t on a statin as of 2012. That constitutes a sizable “statin gap” that cardiologists need to address, he said at the American Heart Association scientific sessions.
Dr. Maddox presented an analysis of 1,174,535 adult patients under cardiologists’ care during 2008-2012 in more than 100 U.S. outpatient cardiology practices participating in the voluntary National Cardiovascular Data Registry’s Practice Innovation and Clinical Excellence Registry (NCDR PINNACLE). Under this national office-based quality improvement program sponsored by the ACC, patient electronic medical record (EMR) data gets uploaded to the registry nightly.
The 2013 ACC/AHA cholesterol guidelines in some ways greatly simplified patient management. The guidelines redefined the risk groups warranting treatment: basically, patients with known atherosclerotic cardiovascular disease (ASCVD), diabetes, an off-treatment LDL of 190 mg/dL or more, or a 10-year ASCVD risk of 7.5% or greater using the risk calculator incorporated in the guidelines (Circulation 2014; 129:S1-45). Also, physicians were advised to use fixed-dose statins and no longer to treat to an LDL target, thereby making repeated LDL testing unnecessary.
The purposes of this new NCDR PINNACLE study were to evaluate the potential impact of the new guidelines on current cardiology practice through an assessment of current treatment and testing patterns, and to make a determination of the scope of changes necessary under the 2013 guidelines, explained Dr. Maddox, a cardiologist at the Veterans Affairs Eastern Colorado Health Care System and the University of Colorado at Denver.
Under the new guidelines, 1,129,205 adult cardiology patients, or 96% of the study population, appeared to be candidates for statin therapy, most often because they had known ASCVD, as was the case in 88%, or diabetes without known ASCVD, accounting for another 6%.
Among the statin-eligible patients, 29% were not on any lipid-lowering therapy, and another 3% were on nonstatin lipid-lowering agents only, which is not recommended in the guidelines. Thus, 32% of the cardiologists’ patients for whom statin therapy appeared to be indicated under the 2013 guidelines weren’t on it.
In addition, 29% of statin-eligible patients were on combined lipid-lowering therapy with a statin plus a nonstatin, such as niacin, a fibrate, or ezetimibe. The guidelines don’t recommend the use of nonstatins because of the lack of evidence of clinical benefit, so cardiologists will want to reconsider their use of combination therapy in this sizable group. The major caveat here is that the guidelines are likely to be revised to embrace the selective use of a moderate-intensity statin plus ezetimibe on the basis of the positive findings of the IMPROVE-IT trial, also presented at the AHA meeting, Dr. Maddox noted.
The registry analysis also pointed to a need to reduce repeated LDL testing, which the guidelines characterize as costly, inconvenient, and unnecessary. Nearly 21% of subjects had at least two LDL assessments during the 4-year period, and 7% had more than four. And those figures probably underestimate the true rate of LDL testing, since many patients may have also had LDL measurements taken in primary care settings.
Several audience members rose to decry the one-in-three-patient statin gap as evidence of widespread substandard care by cardiologists, especially given that 28% of the patients with known ASCVD and 36% with diabetes were not receiving any lipid-lowering therapy, contrary to recommendations both in the current ACC/AHA guidelines and the guidelines in place in 2012. There is good evidence to show that putting such patients on statin therapy would result in roughly a 25% reduction in cardiovascular events.
But Dr. Maddox took a more sanguine view of the statin gap. Although it’s likely there is some heterogeneity in clinical practice that needs to be corrected, he cautioned that the limitations of an analysis based upon EMR data must be borne in mind. Some cardiologists probably didn’t record the use of statins at every visit, and they may not have always reliably documented patients’ intolerance of statins in the EMR.
The NCDR PINNACLE Registry is supported by the American College of Cardiology Foundation. Dr. Maddox reported having no relevant financial conflicts of interest.
AT THE AHA SCIENTIFIC SESSIONS
Key clinical point: As U.S. cardiologists increasingly “get with the guidelines” regarding cholesterol lowering, expect to see large increases in statin use, much less prescribing of nonstatin therapies, and a lot less repeat LDL testing.
Major finding: Nearly one in three U.S. patients under a cardiologist’s care who appear to have an indication for statin therapy under the 2013 ACC/AHA cholesterol guidelines weren’t on a statin as of 2012.
Data source: An analysis of nearly 1.2 million patients in an ongoing nationwide voluntary prospective registry aimed at improving the quality of cardiovascular care.
Disclosures: The NCDR PINNACLE Registry is supported by the American College of Cardiology Foundation. The presenter reported having no relevant financial conflicts.

No Survival Benefit With Early Goal-Directed Therapy for Septic Shock

For patients presenting with early septic shock, does early goal-directed therapy reduce mortality?
Bottom line
As compared with usual resuscitation care, early goal-directed therapy (EGDT) using central venous monitoring does not improve mortality in patients presenting to the emergency department with septic shock.
Reference
Study design
Randomized controlled trial (nonblinded); (LOE: 1b)
Setting
Inpatient (ICU only)
Synopsis
A recent trial showed that protocolized care using EGDT for the treatment of septic shock does not decrease mortality (N Engl J Med 2014;370:1683-1693). The current study supports these findings. Using concealed allocation, investigators randomized patients presenting to the emergency department with evidence of septic shock to either EGDT or usual care. For the EGDT group (n = 793), clinicians followed a 6-hour resuscitation protocol with central venous hemodynamic monitoring to guide the use of fluids, vasopressors, inotropes, and transfusions. For the usual care group (n = 798), care was at the discretion of the treating physicians, but central venous monitoring was not permitted during the 6-hour intervention. Analysis was by intention to treat and the 2 groups were similar at baseline. Additionally, adherence to the EGDT protocol was high and loss to follow-up was low. During the 6-hour resuscitation, patients in the EGDT group received a greater volume of intravenous fluids and were more likely to have received vasopressors (67% vs 58%), transfusions (14% vs 7%), or dobutamine (15% vs 3%). For the primary outcome of 90-day mortality, however, there was no significant difference detected between the 2 groups. Furthermore, there were no significant differences in the use of renal replacement therapy, in-hospital mortality, or length of hospital stay.
Dr. Kulkarni is an assistant professor of hospital medicine at Northwestern University in Chicago.

Most Common Dermatologic Conditions Encountered by Dermatologists and Nondermatologists
Skin diseases are highly prevalent in the United States, affecting an estimated 1 in 3 Americans at any given time.1,2 In 2009 the direct medical costs associated with skin-related diseases, including health services and prescriptions, was approximately $22 billion; the annual total economic burden was estimated to be closer to $96 billion when factoring in the cost of lost productivity and pay for symptom relief.3,4 Effective and efficient management of skin disease is essential to minimizing cost and morbidity. Nondermatologists traditionally have diagnosed the majority of skin diseases.5,6 In particular, primary care physicians commonly manage dermatologic conditions and often are the first health care providers to encounter patients presenting with skin problems. A predicted shortage of dermatologists will likely contribute to an increase in this trend.7,8 Therefore, it is important to adequately prepare nondermatologists to evaluate and treat the skin conditions that they are most likely to encounter in their scope of practice.
Residents, particularly in primary care specialties, often have opportunities to spend 2 to 4 weeks with a dermatologist to learn about skin diseases; however, the skin conditions most often encountered by dermatologists may differ from those most often encountered by physicians in other specialties. For instance, one study demonstrated a disparity between the most common skin problems seen by dermatologists and internists.9 These dissimilarities should be recognized and addressed in curriculum content. The purpose of this study was to identify and compare the 20 most common dermatologic conditions reported by dermatologists versus those reported by nondermatologists (ie, internists, pediatricians, family physicians, emergency medicine physicians, general surgeons, otolaryngologists) from 2001 to 2010. Data also were analyzed to determine the top 20 conditions referred to dermatologists by nondermatologists as a potential indicator for areas of further improvement within medical education. With this knowledge, we hope educational curricula and self-study can be modified to reflect the current epidemiology of cutaneous diseases, thereby improving patient care.
Methods
Data from 2001 to 2010 were extracted from the National Ambulatory Medical Care Survey (NAMCS), which is an ongoing survey conducted by the National Center for Health Statistics. The NAMCS collects descriptive data regarding ambulatory visits to nonfederal office-based physicians in the United States. Participating physicians are instructed to record information about patient visits for a 1-week period, including patient demographics, insurance status, reason for visit, diagnoses, procedures, therapeutics, and referrals made at that time. Data collected for the NAMCS are entered into a multistage probability sample to produce national estimates. Within dermatology, an average of 118 dermatologists are sampled each year, and over the last 10 years, participation rates have ranged from 47% to 77%.
International Classification of Diseases, Ninth Revision, Clinical Modification codes were identified to determine the diagnoses that could be classified as dermatologic conditions. Select infectious and neoplastic disorders of the skin and mucous membrane conditions were included as well as the codes for skin diseases. Nondermatologic diagnoses and V codes were not included in the study. Data for all providers were studied to identify outpatient visits associated with the primary diagnosis of a dermatologic condition. Minor diagnoses that were considered to be subsets of major diagnoses were combined to allow better analysis of the data. For example, all tinea infections (ie, dermatophytosis of various sites, dermatomycosis unspecified) were combined into 1 diagnosis referred to as tinea because the recognition and treatment of this disease does not vary tremendously by anatomic location. Visits to dermatologists that listed nonspecific diagnoses and codes (eg, other postsurgical status [V45.89], neoplasm of uncertain behavior site unspecified [238.9]) were assumed to be for dermatologic problems.
Sampling weights were applied to obtain estimates for the number of each diagnosis made nationally. All data analyses were performed using SAS software and linear regression models were generated using SAS PROC SURVEYREG.
Data were analyzed to determine the dermatologic conditions most commonly encountered by dermatologists and nondermatologists in emergency medicine, family medicine, general surgery, internal medicine, otolaryngology, and pediatrics; these specialties include physicians who are known to commonly diagnose and treat skin diseases.10 Data also were analyzed to determine the most common conditions referred to dermatologists for treatment by nondermatologists from the selected specialties. Permission to conduct this study was obtained from the Wake Forest University institutional review board (Winston-Salem, North Carolina).
Results
From 2001 to 2010, more than 700 million outpatient visits for skin-related problems were identified, with 676.3 million visits to dermatologists, emergency medicine physicians, family practitioners, general surgeons, internists, otolaryngologists, and pediatricians. More than half (52.9%) of all skin-related visits were addressed by nondermatologists during this time. Among nondermatologists, family practitioners encountered the greatest number of skin diseases (20.5%), followed by pediatricians (11.3%), internists (9.2%), general surgeons (3.4%), otolaryngologists (1.0%), and emergency medicine physicians (0.2%)(Table 1).
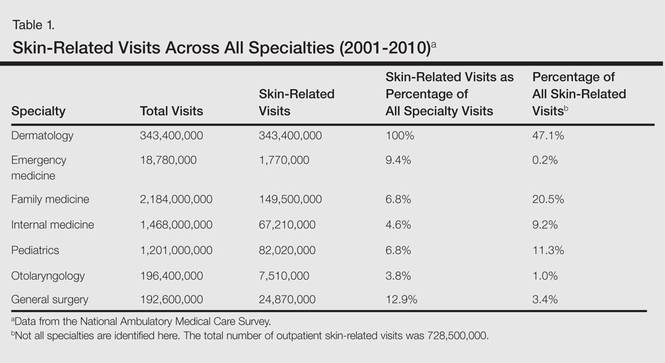
Benign tumors and acne were the most common cutaneous conditions referred to dermatologists by nondermatologists (10.6% and 10.1% of all dermatology referrals, respectively), followed by nonmelanoma skin cancers (9.7%), contact dermatitis (8.8%), and actinic keratosis (7.8%)(Table 2). The top 20 conditions referred to dermatologists accounted for 83.7% of all outpatient referrals to dermatologists.
Among the diseases most frequently reported by nondermatologists, contact dermatitis was the most common (12.0%), with twice the number of visits to nondermatologists for contact dermatitis than to dermatologists (51.6 million vs 25.3 million). In terms of disease categories, infectious skin diseases (ie, bacterial [cellulitis/abscess], viral [warts, herpesvirus], fungal [tinea] and yeast [candida] etiologies) were the most common dermatologic conditions reported by nondermatologists (Table 2).
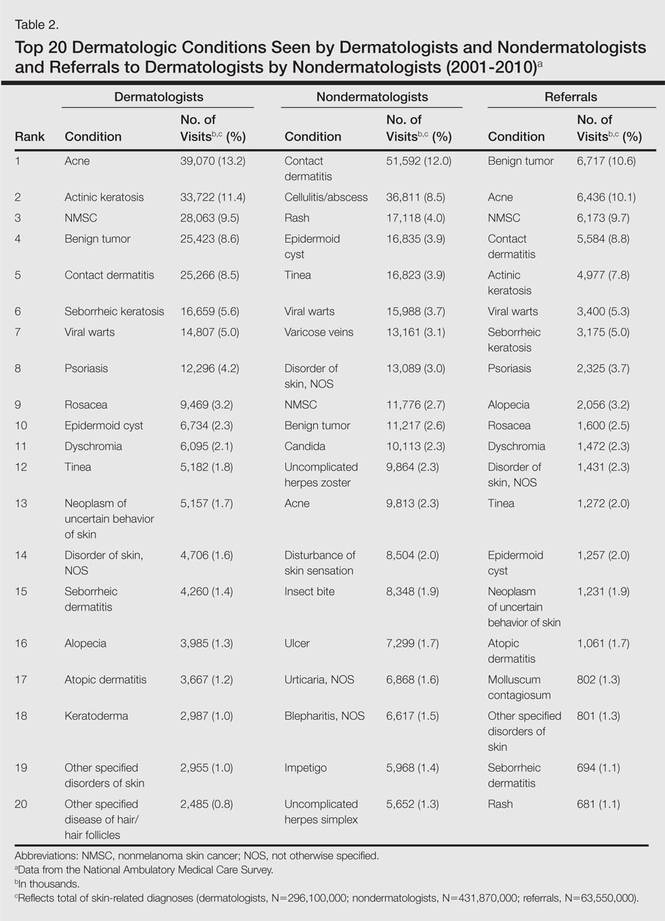
The top 20 dermatologic conditions reported by dermatologists accounted for 85.4% of all diagnoses made by dermatologists. Diseases that were among the top 20 conditions encountered by dermatologists but were not among the top 20 for nondermatologists included actinic keratosis, seborrheic keratosis, atopic dermatitis, psoriasis, alopecia, rosacea, dyschromia, seborrheic dermatitis, follicular disease, and neoplasm of uncertain behavior of skin. Additionally, 5 of the top 20 conditions encountered by dermatologists also were among the top 20 for only 1 individual nondermatologic specialty; these included atopic dermatitis (pediatrics), seborrheic dermatitis (pediatrics), psoriasis (internal medicine), rosacea (otolaryngology), and keratoderma (general surgery). Seborrheic dermatitis, psoriasis, and rosacea also were among the top 20 conditions most commonly referred to dermatologists for treatment by nondermatologists. Table 3 shows the top 20 dermatologic conditions encountered by nondermatologists by comparison.
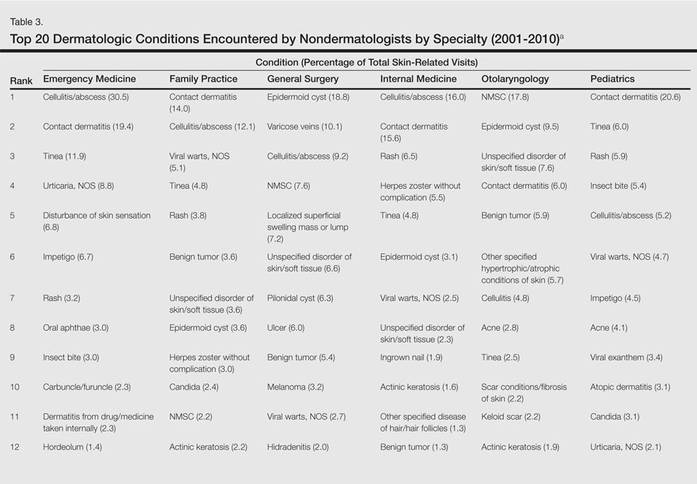
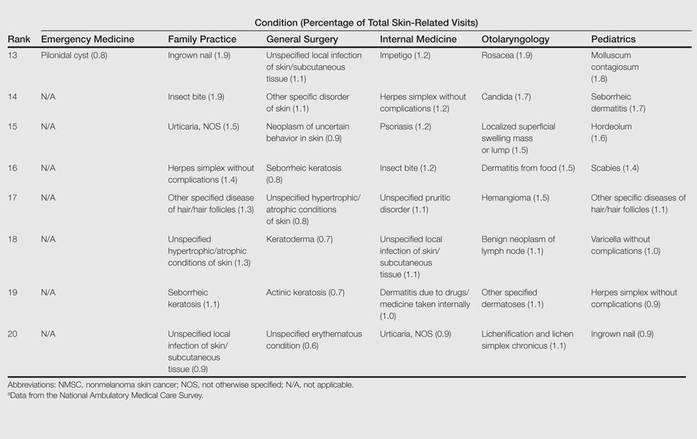
Comment
According to NAMCS data from 2001 to 2010, visits to nondermatologists accounted for more than half of total outpatient visits for cutaneous diseases in the United States, whereas visits to dermatologists accounted for 47.1%. These findings are consistent with historical data indicating that 30% to 40% of skin-related visits are to dermatologists, and the majority of patients with skin disease are diagnosed by nondermatologists.5,6
Past data indicate that most visits to dermatologists were for evaluation of acne, infections, psoriasis, and neoplasms, whereas most visits to nondermatologists were for evaluation of epidermoid cysts, impetigo, plant dermatitis, cellulitis, and diaper rash.9 Over the last 10 years, acne has been more commonly encountered by nondermatologists, especially pediatricians. Additionally, infectious etiologies have been seen in larger volume by nondermatologists.9 Together, infectious cutaneous conditions make up nearly one-fourth of dermatologic encounters by emergency medicine physicians, internists, and family practitioners but are not within the top 20 diagnoses referred to dermatologists, which suggests that uncomplicated cases of cellulitis, herpes zoster, and other skin-related infections are largely managed by nondermatologists.5,6 Contact dermatitis, often caused by specific allergens such as detergents, solvents, and topical products, was one of the most common reported dermatologic encounters among dermatologists and nondermatologists and also was the fourth most common condition referred to dermatologists by nondermatologists for treatment; however, there may be an element of overuse of the International Classification of Diseases, Ninth Revision code, as any presumed contact dermatitis of unspecified cause can be reported under 692.9 defined as contact dermatitis and other eczema, unspecified cause. The high rate of referrals to dermatologists by nondermatologists may be for patch testing and further management. Additionally, there are no specific codes for allergic or irritant dermatitis, thus these diseases may be lumped together.
Although nearly half of all dermatologic encounters were seen by nondermatologists, dermatologists see a much larger proportion of patients with skin disease than nondermatologists and nondermatologists often have limited exposure to the field of dermatology during residency training. Studies have demonstrated differences in the abilities of dermatologists and nondermatologists to correctly diagnose common cutaneous diseases, which unsurprisingly revealed greater diagnostic accuracy demonstrated by dermatologists.11-16 The increase in acne and skin-related infections reported by nondermatologists is consistent with possible efforts to increase formal training in frequently encountered skin diseases. In one study evaluating the impact of a formal 3-week dermatology curriculum on an internal medicine department, internists demonstrated 100% accuracy in the diagnosis of acne and herpes zoster in contrast to 29% for tinea and 12% for lichen planus.5,6
The current Accreditation Council for Graduate Medical Education guidelines place little emphasis on exposure to dermatology training during residency for internists and pediatricians, as this training is not a required component of these programs.17 Two core problems with current training regarding the evaluation and management of cutaneous disease are minimal exposure to dermatologic conditions in medical school and residency and lack of consensus on the core topics that should be taught to nondermatologists.18 Exposure to dermatologic conditions through rotations in medical school has been shown to increase residents’ self-reported confidence in diagnosing and treating alopecia, cutaneous drug eruptions, warts, acne, rosacea, nonmelanoma skin cancers, sun damage, psoriasis, seborrhea, atopic dermatitis, and contact dermatitis; however, the majority of primary care residents surveyed still felt that this exposure in medical school was inadequate.19
In creating a core curriculum for dermatology training for nondermatologists, it is important to consider the dermatologic conditions that are most frequently encountered by these specialties. Our study revealed that the most commonly encountered dermatologic conditions differ among dermatologists and nondermatologists, with a fair degree of variation even among individual specialties. Failure to recognize these discrepancies has likely contributed to the challenges faced by nondermatologists in the diagnosis and management of dermatologic disease. In this study, contact dermatitis, epidermoid cysts, and skin infections were the most common dermatologic conditions encountered by nondermatologists and also were among the top skin diseases referred to dermatologists by nondermatologists. This finding suggests that nondermatologists are able to identify these conditions but have a tendency to refer approximately 10% of these patients to dermatology for further management. Clinical evaluation and medical management of these cutaneous diseases may be an important area of focus for medical school curricula, as the treatment of these diseases is within the capabilities of the nondermatologist. For example, initial management of dermatitis requires determination of the type of dermatitis (ie, essential, contact, atopic, seborrheic, stasis) and selection of an appropriate topical steroid, with referral to a dermatologist needed for questionable or refractory cases. Although a curriculum cannot be built solely on a list of the top 20 diagnoses provided here, these data may serve as a preliminary platform for medical school dermatology curriculum design. The curriculum also should include serious skin diseases, such as melanoma and severe drug eruptions. Although these conditions are less commonly encountered by nondermatologists, missed diagnosis and/or improper management can be life threatening.
The use of NAMCS data presents a few limitations. For instance, these data only represent outpatient management of skin disease. There is the potential for misdiagnosis and coding errors by the reporting physicians. The volume of data (ie, billions of office visits) prevents verification of diagnostic accuracy. The coding system requires physicians to give a diagnosis but does not provide any means by which to determine the physician’s confidence in that diagnosis. There is no code for “uncertain” or “diagnosis not determined.” Additionally, an “unspecified” diagnosis may reflect uncertainty or may simply imply that no other code accurately described the condition. Despite these limitations, the NAMCS database is a large, nationally representative survey of actual patient visits and represents some of the best data available for a study such as ours.
Conclusion
This study provides an important analysis of the most common outpatient dermatologic conditions encountered by dermatologists and nondermatologists of various specialties and offers a foundation from which to construct curricula for dermatology training tailored to individual specialties based on their needs. In the future, identification of the most common inpatient dermatologic conditions managed by each specialty also may benefit curriculum design.
- Thorpe KE, Florence CS, Joski P. Which medical conditions account for the rise in health care spending? Health Aff (Millwood). 2004;(suppl web exclusives):W4-437-445.
- Johnson ML. Defining the burden of skin disease in the United States—a historical perspective. J Investig Dermatol Symp Proc. 2004;9:108-110.
- Agency for Healthcare Research and Quality. Medical expenditure panel survey. US Department of Health & Human Services Web site. http://meps.ahrq.gov. Accessed November 17, 2014.
- Bickers DR, Lim HW, Margolis D, et al. The burden of skin diseases: 2004 a joint project of the American Academy of Dermatology Association and the Society for Investigative Dermatology. J Am Acad Dermatol. 2006;55:490-500.
- Johnson ML. On teaching dermatology to nondermatologists. Arch Dermatol. 1994;130:850-852.
- Ramsay DL, Weary PE. Primary care in dermatology: whose role should it be? J Am Acad Dermatol. 1996;35:1005-1008.
- Kimball AB, Resneck JS Jr. The US dermatology workforce: a specialty remains in shortage. J Am Acad Dermatol. 2008;59:741-745.
- Resneck JS Jr, Kimball AB. Who else is providing care in dermatology practices? trends in the use of nonphysician clinicians. J Am Acad Dermatol. 2008;58:211-216.
- Feldman SR, Fleischer AB Jr, McConnell RC. Most common dermatologic problems identified by internists, 1990-1994. Arch Intern Med. 1998;158:726-730.
- Ahn CS, Davis SA, Debade TS, et al. Noncosmetic skin-related procedures performed in the United States: an analysis of national ambulatory medical care survey data from 1995 to 2010. Dermatol Surg. 2013;39:1912-1921.
- Antic M, Conen D, Itin PH. Teaching effects of dermatological consultations on nondermatologists in the field of internal medicine. a study of 1290 inpatients. Dermatology. 2004;208:32-37.
- Federman DG, Concato J, Kirsner RS. Comparison of dermatologic diagnoses by primary care practitioners and dermatologists. a review of the literature. Arch Fam Med. 1999;8:170-172.
- Fleischer AB Jr, Herbert CR, Feldman SR, et al. Diagnosis of skin disease by nondermatologists. Am J Manag Care. 2000;6:1149-1156.
- Kirsner RS, Federman DG. Lack of correlation between internists’ ability in dermatology and their patterns of treating patients with skin disease. Arch Dermatol. 1996;132:1043-1046.
- McCarthy GM, Lamb GC, Russell TJ, et al. Primary care-based dermatology practice: internists need more training. J Gen Intern Med. 1991;6:52-56.
- Sellheyer K, Bergfeld WF. A retrospective biopsy study of the clinical diagnostic accuracy of common skin diseases by different specialties compared with dermatology. J Am Acad Dermatol. 2005;52:823-830.
- Medical specialties. Accreditation Council for Graduate Medical Education Web site. http://www.acgme.org/acgmeweb/tabid/368ProgramandInstitutionalGuidelines/MedicalAccreditation.aspx. Accessed November 17, 2014.
- McCleskey PE, Gilson RT, DeVillez RL. Medical student core curriculum in dermatology survey. J Am Acad Dermatol. 2009;61:30-35.
- Hansra NK, O’Sullivan P, Chen CL, et al. Medical school dermatology curriculum: are we adequately preparing primary care physicians? J Am Acad Dermatol. 2009;61:23-29.
Skin diseases are highly prevalent in the United States, affecting an estimated 1 in 3 Americans at any given time.1,2 In 2009 the direct medical costs associated with skin-related diseases, including health services and prescriptions, was approximately $22 billion; the annual total economic burden was estimated to be closer to $96 billion when factoring in the cost of lost productivity and pay for symptom relief.3,4 Effective and efficient management of skin disease is essential to minimizing cost and morbidity. Nondermatologists traditionally have diagnosed the majority of skin diseases.5,6 In particular, primary care physicians commonly manage dermatologic conditions and often are the first health care providers to encounter patients presenting with skin problems. A predicted shortage of dermatologists will likely contribute to an increase in this trend.7,8 Therefore, it is important to adequately prepare nondermatologists to evaluate and treat the skin conditions that they are most likely to encounter in their scope of practice.
Residents, particularly in primary care specialties, often have opportunities to spend 2 to 4 weeks with a dermatologist to learn about skin diseases; however, the skin conditions most often encountered by dermatologists may differ from those most often encountered by physicians in other specialties. For instance, one study demonstrated a disparity between the most common skin problems seen by dermatologists and internists.9 These dissimilarities should be recognized and addressed in curriculum content. The purpose of this study was to identify and compare the 20 most common dermatologic conditions reported by dermatologists versus those reported by nondermatologists (ie, internists, pediatricians, family physicians, emergency medicine physicians, general surgeons, otolaryngologists) from 2001 to 2010. Data also were analyzed to determine the top 20 conditions referred to dermatologists by nondermatologists as a potential indicator for areas of further improvement within medical education. With this knowledge, we hope educational curricula and self-study can be modified to reflect the current epidemiology of cutaneous diseases, thereby improving patient care.
Methods
Data from 2001 to 2010 were extracted from the National Ambulatory Medical Care Survey (NAMCS), which is an ongoing survey conducted by the National Center for Health Statistics. The NAMCS collects descriptive data regarding ambulatory visits to nonfederal office-based physicians in the United States. Participating physicians are instructed to record information about patient visits for a 1-week period, including patient demographics, insurance status, reason for visit, diagnoses, procedures, therapeutics, and referrals made at that time. Data collected for the NAMCS are entered into a multistage probability sample to produce national estimates. Within dermatology, an average of 118 dermatologists are sampled each year, and over the last 10 years, participation rates have ranged from 47% to 77%.
International Classification of Diseases, Ninth Revision, Clinical Modification codes were identified to determine the diagnoses that could be classified as dermatologic conditions. Select infectious and neoplastic disorders of the skin and mucous membrane conditions were included as well as the codes for skin diseases. Nondermatologic diagnoses and V codes were not included in the study. Data for all providers were studied to identify outpatient visits associated with the primary diagnosis of a dermatologic condition. Minor diagnoses that were considered to be subsets of major diagnoses were combined to allow better analysis of the data. For example, all tinea infections (ie, dermatophytosis of various sites, dermatomycosis unspecified) were combined into 1 diagnosis referred to as tinea because the recognition and treatment of this disease does not vary tremendously by anatomic location. Visits to dermatologists that listed nonspecific diagnoses and codes (eg, other postsurgical status [V45.89], neoplasm of uncertain behavior site unspecified [238.9]) were assumed to be for dermatologic problems.
Sampling weights were applied to obtain estimates for the number of each diagnosis made nationally. All data analyses were performed using SAS software and linear regression models were generated using SAS PROC SURVEYREG.
Data were analyzed to determine the dermatologic conditions most commonly encountered by dermatologists and nondermatologists in emergency medicine, family medicine, general surgery, internal medicine, otolaryngology, and pediatrics; these specialties include physicians who are known to commonly diagnose and treat skin diseases.10 Data also were analyzed to determine the most common conditions referred to dermatologists for treatment by nondermatologists from the selected specialties. Permission to conduct this study was obtained from the Wake Forest University institutional review board (Winston-Salem, North Carolina).
Results
From 2001 to 2010, more than 700 million outpatient visits for skin-related problems were identified, with 676.3 million visits to dermatologists, emergency medicine physicians, family practitioners, general surgeons, internists, otolaryngologists, and pediatricians. More than half (52.9%) of all skin-related visits were addressed by nondermatologists during this time. Among nondermatologists, family practitioners encountered the greatest number of skin diseases (20.5%), followed by pediatricians (11.3%), internists (9.2%), general surgeons (3.4%), otolaryngologists (1.0%), and emergency medicine physicians (0.2%)(Table 1).
Benign tumors and acne were the most common cutaneous conditions referred to dermatologists by nondermatologists (10.6% and 10.1% of all dermatology referrals, respectively), followed by nonmelanoma skin cancers (9.7%), contact dermatitis (8.8%), and actinic keratosis (7.8%)(Table 2). The top 20 conditions referred to dermatologists accounted for 83.7% of all outpatient referrals to dermatologists.
Among the diseases most frequently reported by nondermatologists, contact dermatitis was the most common (12.0%), with twice the number of visits to nondermatologists for contact dermatitis than to dermatologists (51.6 million vs 25.3 million). In terms of disease categories, infectious skin diseases (ie, bacterial [cellulitis/abscess], viral [warts, herpesvirus], fungal [tinea] and yeast [candida] etiologies) were the most common dermatologic conditions reported by nondermatologists (Table 2).
The top 20 dermatologic conditions reported by dermatologists accounted for 85.4% of all diagnoses made by dermatologists. Diseases that were among the top 20 conditions encountered by dermatologists but were not among the top 20 for nondermatologists included actinic keratosis, seborrheic keratosis, atopic dermatitis, psoriasis, alopecia, rosacea, dyschromia, seborrheic dermatitis, follicular disease, and neoplasm of uncertain behavior of skin. Additionally, 5 of the top 20 conditions encountered by dermatologists also were among the top 20 for only 1 individual nondermatologic specialty; these included atopic dermatitis (pediatrics), seborrheic dermatitis (pediatrics), psoriasis (internal medicine), rosacea (otolaryngology), and keratoderma (general surgery). Seborrheic dermatitis, psoriasis, and rosacea also were among the top 20 conditions most commonly referred to dermatologists for treatment by nondermatologists. Table 3 shows the top 20 dermatologic conditions encountered by nondermatologists by comparison.
Comment
According to NAMCS data from 2001 to 2010, visits to nondermatologists accounted for more than half of total outpatient visits for cutaneous diseases in the United States, whereas visits to dermatologists accounted for 47.1%. These findings are consistent with historical data indicating that 30% to 40% of skin-related visits are to dermatologists, and the majority of patients with skin disease are diagnosed by nondermatologists.5,6
Past data indicate that most visits to dermatologists were for evaluation of acne, infections, psoriasis, and neoplasms, whereas most visits to nondermatologists were for evaluation of epidermoid cysts, impetigo, plant dermatitis, cellulitis, and diaper rash.9 Over the last 10 years, acne has been more commonly encountered by nondermatologists, especially pediatricians. Additionally, infectious etiologies have been seen in larger volume by nondermatologists.9 Together, infectious cutaneous conditions make up nearly one-fourth of dermatologic encounters by emergency medicine physicians, internists, and family practitioners but are not within the top 20 diagnoses referred to dermatologists, which suggests that uncomplicated cases of cellulitis, herpes zoster, and other skin-related infections are largely managed by nondermatologists.5,6 Contact dermatitis, often caused by specific allergens such as detergents, solvents, and topical products, was one of the most common reported dermatologic encounters among dermatologists and nondermatologists and also was the fourth most common condition referred to dermatologists by nondermatologists for treatment; however, there may be an element of overuse of the International Classification of Diseases, Ninth Revision code, as any presumed contact dermatitis of unspecified cause can be reported under 692.9 defined as contact dermatitis and other eczema, unspecified cause. The high rate of referrals to dermatologists by nondermatologists may be for patch testing and further management. Additionally, there are no specific codes for allergic or irritant dermatitis, thus these diseases may be lumped together.
Although nearly half of all dermatologic encounters were seen by nondermatologists, dermatologists see a much larger proportion of patients with skin disease than nondermatologists and nondermatologists often have limited exposure to the field of dermatology during residency training. Studies have demonstrated differences in the abilities of dermatologists and nondermatologists to correctly diagnose common cutaneous diseases, which unsurprisingly revealed greater diagnostic accuracy demonstrated by dermatologists.11-16 The increase in acne and skin-related infections reported by nondermatologists is consistent with possible efforts to increase formal training in frequently encountered skin diseases. In one study evaluating the impact of a formal 3-week dermatology curriculum on an internal medicine department, internists demonstrated 100% accuracy in the diagnosis of acne and herpes zoster in contrast to 29% for tinea and 12% for lichen planus.5,6
The current Accreditation Council for Graduate Medical Education guidelines place little emphasis on exposure to dermatology training during residency for internists and pediatricians, as this training is not a required component of these programs.17 Two core problems with current training regarding the evaluation and management of cutaneous disease are minimal exposure to dermatologic conditions in medical school and residency and lack of consensus on the core topics that should be taught to nondermatologists.18 Exposure to dermatologic conditions through rotations in medical school has been shown to increase residents’ self-reported confidence in diagnosing and treating alopecia, cutaneous drug eruptions, warts, acne, rosacea, nonmelanoma skin cancers, sun damage, psoriasis, seborrhea, atopic dermatitis, and contact dermatitis; however, the majority of primary care residents surveyed still felt that this exposure in medical school was inadequate.19
In creating a core curriculum for dermatology training for nondermatologists, it is important to consider the dermatologic conditions that are most frequently encountered by these specialties. Our study revealed that the most commonly encountered dermatologic conditions differ among dermatologists and nondermatologists, with a fair degree of variation even among individual specialties. Failure to recognize these discrepancies has likely contributed to the challenges faced by nondermatologists in the diagnosis and management of dermatologic disease. In this study, contact dermatitis, epidermoid cysts, and skin infections were the most common dermatologic conditions encountered by nondermatologists and also were among the top skin diseases referred to dermatologists by nondermatologists. This finding suggests that nondermatologists are able to identify these conditions but have a tendency to refer approximately 10% of these patients to dermatology for further management. Clinical evaluation and medical management of these cutaneous diseases may be an important area of focus for medical school curricula, as the treatment of these diseases is within the capabilities of the nondermatologist. For example, initial management of dermatitis requires determination of the type of dermatitis (ie, essential, contact, atopic, seborrheic, stasis) and selection of an appropriate topical steroid, with referral to a dermatologist needed for questionable or refractory cases. Although a curriculum cannot be built solely on a list of the top 20 diagnoses provided here, these data may serve as a preliminary platform for medical school dermatology curriculum design. The curriculum also should include serious skin diseases, such as melanoma and severe drug eruptions. Although these conditions are less commonly encountered by nondermatologists, missed diagnosis and/or improper management can be life threatening.
The use of NAMCS data presents a few limitations. For instance, these data only represent outpatient management of skin disease. There is the potential for misdiagnosis and coding errors by the reporting physicians. The volume of data (ie, billions of office visits) prevents verification of diagnostic accuracy. The coding system requires physicians to give a diagnosis but does not provide any means by which to determine the physician’s confidence in that diagnosis. There is no code for “uncertain” or “diagnosis not determined.” Additionally, an “unspecified” diagnosis may reflect uncertainty or may simply imply that no other code accurately described the condition. Despite these limitations, the NAMCS database is a large, nationally representative survey of actual patient visits and represents some of the best data available for a study such as ours.
Conclusion
This study provides an important analysis of the most common outpatient dermatologic conditions encountered by dermatologists and nondermatologists of various specialties and offers a foundation from which to construct curricula for dermatology training tailored to individual specialties based on their needs. In the future, identification of the most common inpatient dermatologic conditions managed by each specialty also may benefit curriculum design.
- Thorpe KE, Florence CS, Joski P. Which medical conditions account for the rise in health care spending? Health Aff (Millwood). 2004;(suppl web exclusives):W4-437-445.
- Johnson ML. Defining the burden of skin disease in the United States—a historical perspective. J Investig Dermatol Symp Proc. 2004;9:108-110.
- Agency for Healthcare Research and Quality. Medical expenditure panel survey. US Department of Health & Human Services Web site. http://meps.ahrq.gov. Accessed November 17, 2014.
- Bickers DR, Lim HW, Margolis D, et al. The burden of skin diseases: 2004 a joint project of the American Academy of Dermatology Association and the Society for Investigative Dermatology. J Am Acad Dermatol. 2006;55:490-500.
- Johnson ML. On teaching dermatology to nondermatologists. Arch Dermatol. 1994;130:850-852.
- Ramsay DL, Weary PE. Primary care in dermatology: whose role should it be? J Am Acad Dermatol. 1996;35:1005-1008.
- Kimball AB, Resneck JS Jr. The US dermatology workforce: a specialty remains in shortage. J Am Acad Dermatol. 2008;59:741-745.
- Resneck JS Jr, Kimball AB. Who else is providing care in dermatology practices? trends in the use of nonphysician clinicians. J Am Acad Dermatol. 2008;58:211-216.
- Feldman SR, Fleischer AB Jr, McConnell RC. Most common dermatologic problems identified by internists, 1990-1994. Arch Intern Med. 1998;158:726-730.
- Ahn CS, Davis SA, Debade TS, et al. Noncosmetic skin-related procedures performed in the United States: an analysis of national ambulatory medical care survey data from 1995 to 2010. Dermatol Surg. 2013;39:1912-1921.
- Antic M, Conen D, Itin PH. Teaching effects of dermatological consultations on nondermatologists in the field of internal medicine. a study of 1290 inpatients. Dermatology. 2004;208:32-37.
- Federman DG, Concato J, Kirsner RS. Comparison of dermatologic diagnoses by primary care practitioners and dermatologists. a review of the literature. Arch Fam Med. 1999;8:170-172.
- Fleischer AB Jr, Herbert CR, Feldman SR, et al. Diagnosis of skin disease by nondermatologists. Am J Manag Care. 2000;6:1149-1156.
- Kirsner RS, Federman DG. Lack of correlation between internists’ ability in dermatology and their patterns of treating patients with skin disease. Arch Dermatol. 1996;132:1043-1046.
- McCarthy GM, Lamb GC, Russell TJ, et al. Primary care-based dermatology practice: internists need more training. J Gen Intern Med. 1991;6:52-56.
- Sellheyer K, Bergfeld WF. A retrospective biopsy study of the clinical diagnostic accuracy of common skin diseases by different specialties compared with dermatology. J Am Acad Dermatol. 2005;52:823-830.
- Medical specialties. Accreditation Council for Graduate Medical Education Web site. http://www.acgme.org/acgmeweb/tabid/368ProgramandInstitutionalGuidelines/MedicalAccreditation.aspx. Accessed November 17, 2014.
- McCleskey PE, Gilson RT, DeVillez RL. Medical student core curriculum in dermatology survey. J Am Acad Dermatol. 2009;61:30-35.
- Hansra NK, O’Sullivan P, Chen CL, et al. Medical school dermatology curriculum: are we adequately preparing primary care physicians? J Am Acad Dermatol. 2009;61:23-29.
Practice Points
- Approximately half of skin-related visits are to nondermatologists, such as family medicine physicians, pediatricians, and internists.
- Skin conditions that most frequently present to nondermatologists are different from those seen by dermatologists.
- Education efforts in nondermatology specialties should be targeted toward the common skin diseases that present to these specialties to maximize the yield of medical education and improve diagnostic accuracy and patient outcomes.