User login
Introducing a better bleeding risk score in atrial fib
CHICAGO – The ORBIT-AF bleeding risk score is a simple, user-friendly new tool for assessing the risk of major bleeding in patients with atrial fibrillation on oral anticoagulation, Emily C. O’Brien, Ph.D., announced at the American Heart Association scientific sessions.
This novel score offers significant advantages over existing bleeding risk scores, including HAS-BLED and ATRIA. Those scores were developed on the basis of small numbers of bleeding events, they show inconsistent performance, and their calculation requires data that’s often not readily accessible in busy daily practice, according to Dr. O’Brien of the Duke Clinical Research Institute in Durham, N.C.
The new score was derived from the ORBIT-AF registry, the largest prospective U.S. registry of patients with atrial fibrillation (AF).
The score was constructed using data on 7,411 AF patients in community practice settings at 173 U.S. sites. All subjects were on oral anticoagulant therapy at baseline. During 2 years of prospective follow-up, 581 patients (7.8%) experienced a major bleeding event as defined by International Society on Thrombosis and Haemostasis criteria.
After sifting through numerous potential candidate variables, Dr. O’Brien and coinvestigators settled upon five they identified as the most potent and practical baseline predictors of major bleeding risk while on oral anticoagulation. Then they packaged them in a convenient acronym: ORBIT, for Older than 74, Renal insufficiency with an estimated glomerular filtration rate below 60 mL/minute per/1.73 m2, Bleeding history, Insufficient hemoglobin/hematocrit or anemia, and Treatment with an antiplatelet agent. The two strongest predictors – renal insufficiency and bleeding history– were awarded two points each; the others are worth one point each.
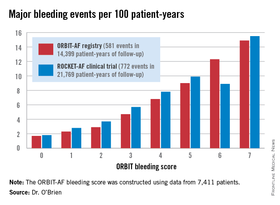
The observed major bleeding rate among patients enrolled in the ORBIT-AF registry rose with an increasing risk score. The same was true upon application of the ORBIT bleeding score to an independent study sample comprised of participants in the ROCKET-AF randomized clinical trial.
Dr. O’Brien also compared the performance of the ORBIT bleeding score to that of two existing bleeding risk scores – HAS-BLED and ATRIA – in the ORBIT-AF and ROCKET-AF cohorts. The simpler, more user friendly ORBIT bleeding score had a C-statistic of 0.67, similar to the 0.64 for HAS-BLED and 0.66 for ATRIA.
Thus, the ORBIT bleeding score is a practical new tool for use alongside the CHA2DS2-VASc stroke risk score to support clinical decision making regarding whether or not to place an individual AF patient on oral anticoagulation, Dr. O’Brien concluded.
She reported having no financial conflicts regarding this study. The ORBIT-AF registry is sponsored by Janssen.
CHICAGO – The ORBIT-AF bleeding risk score is a simple, user-friendly new tool for assessing the risk of major bleeding in patients with atrial fibrillation on oral anticoagulation, Emily C. O’Brien, Ph.D., announced at the American Heart Association scientific sessions.
This novel score offers significant advantages over existing bleeding risk scores, including HAS-BLED and ATRIA. Those scores were developed on the basis of small numbers of bleeding events, they show inconsistent performance, and their calculation requires data that’s often not readily accessible in busy daily practice, according to Dr. O’Brien of the Duke Clinical Research Institute in Durham, N.C.
The new score was derived from the ORBIT-AF registry, the largest prospective U.S. registry of patients with atrial fibrillation (AF).
The score was constructed using data on 7,411 AF patients in community practice settings at 173 U.S. sites. All subjects were on oral anticoagulant therapy at baseline. During 2 years of prospective follow-up, 581 patients (7.8%) experienced a major bleeding event as defined by International Society on Thrombosis and Haemostasis criteria.
After sifting through numerous potential candidate variables, Dr. O’Brien and coinvestigators settled upon five they identified as the most potent and practical baseline predictors of major bleeding risk while on oral anticoagulation. Then they packaged them in a convenient acronym: ORBIT, for Older than 74, Renal insufficiency with an estimated glomerular filtration rate below 60 mL/minute per/1.73 m2, Bleeding history, Insufficient hemoglobin/hematocrit or anemia, and Treatment with an antiplatelet agent. The two strongest predictors – renal insufficiency and bleeding history– were awarded two points each; the others are worth one point each.
The observed major bleeding rate among patients enrolled in the ORBIT-AF registry rose with an increasing risk score. The same was true upon application of the ORBIT bleeding score to an independent study sample comprised of participants in the ROCKET-AF randomized clinical trial.
Dr. O’Brien also compared the performance of the ORBIT bleeding score to that of two existing bleeding risk scores – HAS-BLED and ATRIA – in the ORBIT-AF and ROCKET-AF cohorts. The simpler, more user friendly ORBIT bleeding score had a C-statistic of 0.67, similar to the 0.64 for HAS-BLED and 0.66 for ATRIA.
Thus, the ORBIT bleeding score is a practical new tool for use alongside the CHA2DS2-VASc stroke risk score to support clinical decision making regarding whether or not to place an individual AF patient on oral anticoagulation, Dr. O’Brien concluded.
She reported having no financial conflicts regarding this study. The ORBIT-AF registry is sponsored by Janssen.
AT THE AHA SCIENTIFIC SESSIONS
Key clinical point: A simple new score is available to assess major bleeding risk in patients with atrial fibrillation on oral anticoagulation.
Major finding: The major bleeding risk in patients with atrial fibrillation on oral anticoagulation ranged from 1.7 per 100 patient-years in those with an ORBIT risk score of 0% to 14.9% in those with a maximum score of 7.
Data source: The risk score was derived by analyzing prospective 2-year follow-up data on 7,411 U.S. patients with atrial fibrillation in a large registry.
Disclosures: The ORBIT-AF registry is sponsored by Janssen. The presenter reported having no financial conflicts.

Weak magnetic fields not responsible for leukemia, study suggests

Research first carried out in the 1970s revealed an association between living near overhead power lines and an increased risk of childhood leukemia.
Although some later studies failed to find such a link, the International Agency for Research on Cancer has categorized low-frequency magnetic fields as “possibly carcinogenic.”
However, a mechanism for this association has never been found, and, now, researchers have ruled out one of the prime candidates.
The team studied the effects of weak magnetic fields (WMFs) on key human proteins, including those
crucial for health, and found they have no detectable impact.
The researchers detailed this discovery in the Journal of the Royal Society Interface.
Alex Jones, PhD, of The University of Manchester in the UK, and his colleagues looked at how WMFs affect flavoproteins, which are key to processes vital for healthy human function, such as the nervous system, DNA repair, and the biological clock.
If these proteins malfunction, there are serious knock-on effects for human health. But after subjecting flavoproteins to WMFs in the lab, the researchers found that WMFs have no detectable impact on these proteins.
“There is still some concern among the public about this potential link, which has been found in some studies into cases of childhood leukemia, but without any clear mechanism for why,” Dr Jones said.
“Flavoproteins transfer electrons from one place to another. Along the path the electrons take, very short-lived chemical species known as radical pairs are often created. Biochemical reactions involving radical pairs are considered the most plausible candidates for sensitivity to WMFs, but for them to be so, the reaction conditions have to be right. This research suggests that the correct conditions for biochemical effects of WMFs are likely to be rare in human biology.”
“More work on other possible links will need to be done,” noted study author Nigel Scrutton, PhD, also of the University of Manchester.
“But this study definitely takes us nearer to the point where we can say that power lines, mobile phones, and other similar devices are likely to be safe for humans.” ![]()
CDC offers pediatric health care providers resources on Ebola in children
Children’s needs differ significantly from the needs of adults, especially when it comes to handling dire situations like the current Ebola outbreak in West Africa that has resulted in a few cases in the United States.
Children may be at increased risk for developing the infection if they have recently traveled to one of the countries experiencing an outbreak. However, since they are very unlikely to be caregivers or participate in funeral activities that raise the risk of exposure, the chances of a child in the United States developing Ebola is very low, according to the Centers for Disease Control and Prevention.
Because information about Ebola can be scary and alarming for children, it is important for healthcare providers to recognize and address their developmental and psychological needs to help them better understand facts about the illness and their risk of exposure. It also helps to be prepared just in case the need arises to address a potential Ebola case.
The CDC recommends the following resources to guide health care providers who work with children:
1. Ebola Virus Disease and Children: What US Pediatricians Need to Know
2. What Obstetrician–Gynecologists Should Know About Ebola
3. Information for Healthcare Workers and Settings
4. Algorithm for Evaluation of the Returned Traveler
5. Checklist for Patients Being Evaluated for Ebola Virus Disease (EVD) in the United States
6. Interim Guidance for Environmental Infection Control in Hospitals for Ebola Virus
7. Ebola Preparedness Considerations for Outpatient/Ambulatory Care Centers
8. Ebola Screening Criteria for Outpatient/Ambulatory Care Centers
Product controls bleeding in kids with hemophilia A
the 2014 ASH Annual Meeting
SAN FRANCISCO—A recombinant factor VIII (FVIII) Fc fusion protein is effective for routine prophylaxis and control of bleeding in previously treated children with severe hemophilia A, according to the first phase 3 study of a long-acting FVIII in very young patients.
Prophylactic treatment of hemophilia A with recombinant FVIII requires frequent infusions, up to 3 to 4 per week.
Conventional FVIII replacement therapies have circulating half-lives of 8 to 12 hours.
And children exhibit faster clearance than adults, which may necessitate even more frequent infusions.
Recombinant FVIII Fc fusion protein (Eloctate) has been shown to have a 1.5-fold longer half-life when compared with recombinant FVIII (Advate) in a phase 3 study of adults and adolescents.
“In a pediatric population, we demonstrated similar pharmacokinetic safety and efficacy in terms of annualized bleeding rate, with no inhibitors and no adverse events related to the drug,” said Guy Young, MD, of the University of Southern California in Los Angeles.
At the 2014 ASH Annual Meeting, Dr Young and his colleagues reported results observed with recombinant FVIII Fc fusion protein in the KIDS A-LONG study (abstract 1494). This phase 3 trial was sponsored by Biogen Idec and Sobi, the companies developing recombinant FVIII Fc fusion protein.
The study enrolled 71 males under the age of 12 with severe hemophilia A (< 1 IU/dL endogenous FVIII activity), who had at least 50 prior exposure days to FVIII and no history of FVIII inhibitors.
The patients received twice-weekly prophylactic infusions of the drug, 25 IU/kg on day 1 and 50 IU/kg on day 4. Adjustments to dosing frequency up to once every 2 days and dose to ≤ 80 IU/kg were made as needed.
A subset of 25 patients under age 6 and 35 patients ages 6 to 11 underwent sequential pharmacokinetic evaluations with their prior FVIII therapy (50 IU/kg), followed by the recombinant FVIII Fc fusion protein (50 IU/kg).
“The recombinant factor VIII Fc fusion protein was effective for routine prophylaxis and for control of bleeding,” Dr Young said. “A low annualized bleeding rate was observed in both age cohorts.”
About three-quarters of the patients had a longer dosing interval with recombinant FVIII Fc fusion protein compared with their prior FVIII prophylactic dosing interval.
About 90% of the patients were on twice-weekly dosing at the end of the study compared with about 75% infusing at least 3 times a week pre-study, Dr Young said. Some 93% of bleeding episodes were controlled with 1 or 2 injections.
“The recombinant FVIII Fc fusion protein had a prolonged half-life and reduced clearance compared with conventional FVIII,” Dr Young noted.
Half-life extension was comparable to that observed in adults and adolescents.
Adverse events were generally similar to those expected for the pediatric hemophilia population.
Some 85.5% of subjects reported at least one adverse event, but no patient discontinued treatment due to an adverse event. Two non-serious events (myalgia and erythematous rash) were related to recombinant FVIII Fc fusion protein.
Five patients (7.2%) experienced a total of 7 serious adverse events, which were not related to treatment. There were no reports of anaphylaxis, vascular thrombotic events, or death.
Dr Young said the next step is to test the recombinant FVIII Fc fusion protein in previously untreated young hemophilia A patients to determine the rate of immunogenicity.
“We don’t expect to see antibodies in these patients,” he said. ![]()
Granular Cell Tumor
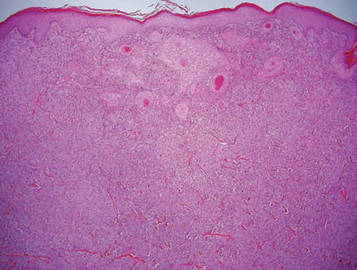
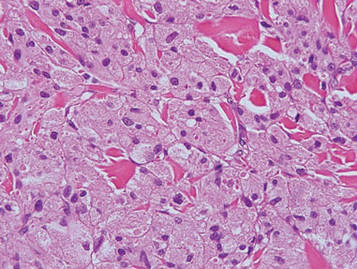
Granular cell tumors (GCTs) tend to present as solitary nodules, not uncommonly affecting the dorsum of the tongue but also involving the skin, breasts, and internal organs.1 Cutaneous GCTs typically present as 0.5- to 3-cm firm nodules with a verrucous or eroded surface.2 They most commonly present in dark-skinned, middle-aged women but have been reported in all age groups and in both sexes.3 Multiple GCTs are reported in up to 25% of cases, rarely in association with LEOPARD syndrome (consisting of lentigines, electrocardiographic abnormalities, ocular hypertelorism, pulmonary stenosis, abnormalities of genitalia, retardation of growth, and deafness).4 Granular cell tumors generally are benign with a metastatic rate of approximately 3%.2
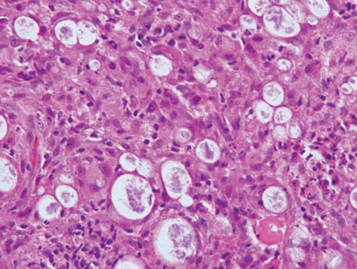
Granular cell tumors are histopathologically characterized by sheets of large polygonal cells with small, round, central nuclei; cytoplasm that is eosinophilic, coarse, and granular, as well as periodic acid–Schiff positive and diastase resistant; and distinct cytoplasmic membranes (Figure 1). Pustulo-ovoid bodies of Milian often generally appear as larger eosinophilic granules surrounded by a clear halo (Figure 2).5 Increased mitotic activity, a high nuclear-cytoplasmic ratio, pleomorphism, and necrosis suggest malignancy.6
|
|
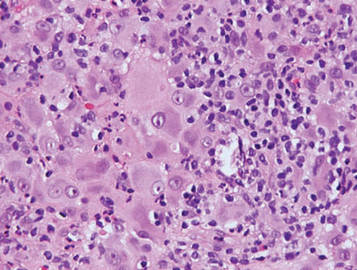
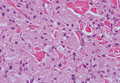
Lepromatous leprosy is characterized by sheets of histiocytes with vacuolated cytoplasm, some with clumped amphophilic bacilli known as globi (Figure 3). Mastocytoma can be distinguished from GCTs by the “fried egg” appearance of the mast cells (Figure 4). Although mast cells have a pale granular cytoplasm, they are smaller and lack pustulo-ovoid bodies and the polygonal shape of GCT cells. Reticulohistiocytoma, on the other hand, has two-toned dusty rose ground glass histiocytes (Figure 5), and xanthelasma can be distinguished histologically from GCT by the presence of a foamy rather than granular cytoplasm (Figure 6).
|
|
|
|


1. Elston DM, Ko C, Ferringer TC, et al, eds. Dermatopathology: Requisites in Dermatology. Philadelphia, PA: Saunders Elsevier; 2009.
2. Bolognia JL, Jorizzo JL, Schaffer JV. Dermatology. 3rd ed. Philadelphia, PA: Elsevier; 2012.
3. van de Loo S, Thunnissen E, Postmus P, et al. Granular cell tumor of the oral cavity; a case series including a case of metachronous occurrence in the tongue and the lung [published online ahead of print June 1, 2014]. Med Oral Patol Oral Cir Bucal. doi:10.4317/medoral.19867.
4. Schrader KA, Nelson TN, De Luca A, et al. Multiple granular cell tumors are an associated feature of LEOPARD syndrome caused by mutation in PTPN11. Clin Genet. 2009;75:185-189.
5. Epstein DS, Pashaei S, Hunt E Jr, et al. Pustulo-ovoid bodies of Milian in granular cell tumors. J Cutan Pathol. 2007;34:405-409.
6. Fanburg-Smith JC, Meis-Kindblom JM, Fante R, et al. Malignant granular cell tumor of soft tissue: diagnostic criteria and clinicopathologic correlation. Am J Surg Pathol. 1998;22:779-794.
Granular cell tumors (GCTs) tend to present as solitary nodules, not uncommonly affecting the dorsum of the tongue but also involving the skin, breasts, and internal organs.1 Cutaneous GCTs typically present as 0.5- to 3-cm firm nodules with a verrucous or eroded surface.2 They most commonly present in dark-skinned, middle-aged women but have been reported in all age groups and in both sexes.3 Multiple GCTs are reported in up to 25% of cases, rarely in association with LEOPARD syndrome (consisting of lentigines, electrocardiographic abnormalities, ocular hypertelorism, pulmonary stenosis, abnormalities of genitalia, retardation of growth, and deafness).4 Granular cell tumors generally are benign with a metastatic rate of approximately 3%.2
Granular cell tumors are histopathologically characterized by sheets of large polygonal cells with small, round, central nuclei; cytoplasm that is eosinophilic, coarse, and granular, as well as periodic acid–Schiff positive and diastase resistant; and distinct cytoplasmic membranes (Figure 1). Pustulo-ovoid bodies of Milian often generally appear as larger eosinophilic granules surrounded by a clear halo (Figure 2).5 Increased mitotic activity, a high nuclear-cytoplasmic ratio, pleomorphism, and necrosis suggest malignancy.6
|
|
Lepromatous leprosy is characterized by sheets of histiocytes with vacuolated cytoplasm, some with clumped amphophilic bacilli known as globi (Figure 3). Mastocytoma can be distinguished from GCTs by the “fried egg” appearance of the mast cells (Figure 4). Although mast cells have a pale granular cytoplasm, they are smaller and lack pustulo-ovoid bodies and the polygonal shape of GCT cells. Reticulohistiocytoma, on the other hand, has two-toned dusty rose ground glass histiocytes (Figure 5), and xanthelasma can be distinguished histologically from GCT by the presence of a foamy rather than granular cytoplasm (Figure 6).
|
|
|
|
1. Elston DM, Ko C, Ferringer TC, et al, eds. Dermatopathology: Requisites in Dermatology. Philadelphia, PA: Saunders Elsevier; 2009.
2. Bolognia JL, Jorizzo JL, Schaffer JV. Dermatology. 3rd ed. Philadelphia, PA: Elsevier; 2012.
3. van de Loo S, Thunnissen E, Postmus P, et al. Granular cell tumor of the oral cavity; a case series including a case of metachronous occurrence in the tongue and the lung [published online ahead of print June 1, 2014]. Med Oral Patol Oral Cir Bucal. doi:10.4317/medoral.19867.
4. Schrader KA, Nelson TN, De Luca A, et al. Multiple granular cell tumors are an associated feature of LEOPARD syndrome caused by mutation in PTPN11. Clin Genet. 2009;75:185-189.
5. Epstein DS, Pashaei S, Hunt E Jr, et al. Pustulo-ovoid bodies of Milian in granular cell tumors. J Cutan Pathol. 2007;34:405-409.
6. Fanburg-Smith JC, Meis-Kindblom JM, Fante R, et al. Malignant granular cell tumor of soft tissue: diagnostic criteria and clinicopathologic correlation. Am J Surg Pathol. 1998;22:779-794.
Two activin receptor fusion proteins show promise in anemia

site of the ASH Annual Meeting
Photo courtesy of ASH
SAN FRANCISCO—Two activin receptor fusion proteins, luspatercept and sotatercept, increased hemoglobin levels and transfusion independence in patients with β-thalassemia and myelodysplastic syndromes (MDS)/chronic myelomonocytic leukemia (CMML), respectively, in phase 2 trials.
Luspatercept is a type IIB activin receptor, while sotatercept is type IIA. Both impact late-stage erythropoiesis and improve anemia.
Investigators reported the trial results at the 2014 ASH Annual Meeting.
Luspatercept in β-thalassemia
Antonio G. Piga, MD, of Turin University in Italy, explained that luspatercept binds to GDF11 and other ligands in the TGF-β superfamily and promotes late-stage erythroid maturation.
The study was designed in the US and conducted abroad, he said, because while β-thalassemia is rare in the US, it is not so in Europe.
Investigators evaluated whether luspatercept could increase hemoglobin levels 1.5 g/dL or more for at least 2 weeks in non-transfusion-dependent (NTD) patients.
And in transfusion-dependent (TD) patients, luspatercept was expected to decrease the transfusion burden by 20% or more over 12 weeks.
Thirty patients, 7 TD and 23 NTD, received an injection of luspatercept every 3 weeks for 3 months at doses ranging from 0.2 to 1.0 mg/kg.
The median age was 35, and 53% of patients were male. Eighty-three percent had had a splenectomy.
Luspatercept efficacy
Three-quarters of patients treated with 0.8 to 1.0 mg/kg increased their hemoglobin levels or reduced their transfusion burden.
Of the NTD patients, 8 of 12 with iron overload at baseline experienced a reduction in liver iron concentration of 1 mg or more at 16 weeks.
And in the TD group, “All patients had clinically improved reduction of transfusion dependence,” Dr Piga said.
They had a more than 60% reduction in transfusion burden over 12 weeks. This included 2 patients with β0 β0 genotype, who experienced a 79% and 75% reduction.
“There was a trend to lower liver iron concentration in TD patients,” Dr Piga noted, “except in 1 patient.”
And 5 of 5 TD patients experienced decreases in serum ferritin ranging from 12% to 60%.
Luspatercept safety
Luspatercept did not cause any treatment-related serious or severe adverse events. The most common adverse events were bone pain (20%), headache (17%), myalgia (13%), and asthenia (10%).
There was 1 grade 3 dose-limiting toxicity of worsening lumbar spine bone pain, and 3 patients discontinued early, 1 each with occipital headache, ankle pain, and back pain.
Luspatercept had beneficial effects on other complications of the disease, Dr Piga noted, such as the healing of leg ulcers in the 3 patients with this complication, 1 who is just ending the trial.
With these promising results, Dr Piga said the investigators are “anxious to start phase 3.”
Dr Piga reported the data as abstract 53. The study was supported by Acceleron Pharma and Celgene Corporation.
Sotatercept in MDS and CMML with anemia
Rami Komrokji, MD, of the Moffit Cancer Center in Tampa, Florida, explained that sotaterept increases the release of mature erythrocytes into circulation by a mechanism distinct from erythropoietin.
Sotatercept was shown to stimulate erythropoiesis and increase hemoglobin levels in healthy volunteers, so investigators undertook to study its potential to treat anemia.
They conducted a phase 2 dose-finding study to determine the best effective dose in patients with anemia and lower-risk MDS or nonproliferative CMML who were refractory to erythropoiesis-stimulating agents (ESAs).
Investigators evaluated 53 patients who had anemia of 9 g/dL or less requiring 2 or more units of red blood cells (RBCs) in the 12 weeks prior to enrollment.
Their white blood cell counts had to be under 13,000/μL, and they had to have no response, loss of response, or low chance of response to ESAs, reflected by serum erythropoietin of more than 500 mIU/mL.
Patients were a median age of 71, and 70% were male.
They received subcutaneous sotatercept at dose levels of 0.1, 0.3, 0.5, or 1.0 mg/kg once every 3 weeks for up to 24 months following the first treatment.
Sotatercept efficacy
The investigators evaluated efficacy for the entire cohort as well as in subgroups of patients with high transfusion burden (HTB) and low transfusion burden (LTB). Patients were defined as HTB if they required RBC transfusions of 4 or more units every 8 weeks and LTB as less than 4 units per 8 weeks.
Overall, 45% (24/53) of the evaluable patients achieved hematologic improvement as defined by IWG 2006 criteria.
Forty-two percent of HTB patients had a reduction in their transfusion burden of 4 or more RBC units per 8 weeks, with a median duration of longest response of 106 days (range, 62 to 345+). Eleven percent (5/44) achieved RBC transfusion independence of 56 days or more.
Sixty-three percent (5/8) of LTB patients achieved both RBC transfusion independence of 56 days or more and a mean hemoglobin increase of 1.5 mg/dL or more for at least 8 weeks.
Their maximum mean hemoglobin increase ranged from 1.9 to 4.4 g/dL, and the mean duration of RBC transfusion independence ranged from 76 to 233+ days. Of these 8 patients, 67% were in the 1.0 mg/kg cohort.
Sotatercept safety
“Most of the adverse events were not necessarily related to the treatment,” Dr Komrokji said, “and they were grade 1 or grade 2 toxicity.”
Twenty of 54* patients (37%) experienced 1 or more treatment-related adverse events, the most common of which were fatigue/asthenia (13%), headache (9%), decreased appetite (7%), nausea (7%), and dyspnea (6%).
Three patients discontinued the study due to treatment-emergent adverse events that were possibly related to sotatercept. One was for grade 2 hemolytic anemia, 1 for grade 3 hypertension, and 1 for grade 2 muscle weakness.
Dr Komrokji concluded saying the results showed “promising evidence of clinical activity” in these ESA-refractory, anemic, lower-risk MDS and CMML patients who have a “challenging and unmet need for treatment.”
He indicated that further exploration of sotatercept at higher dose levels and for longer treatment periods is planned and ongoing.
He presented the data as abstract 3251. The study was supported by Celgene Corporation. ![]()
*One patient was excluded from the efficacy analysis due to a protocol violation.
Civilian Stress Compounds Service-Related Stress
The stresses of civilian life—job problems, divorce, money—can add to the burden when a service member is already under strain from deployment-related traumatic events, such as being wounded or sexually harassed. Those extramilitary stressors may make it more likely for reserve soldiers to abuse alcohol, say researchers from Columbia University in New York City; University of Michigan in Ann Arbor; Case Western Reserve University in Cleveland, and University of Toledo, both in Ohio.
The researchers surveyed 1,095 members of the Ohio Army National Guard who served mostly in Afghanistan and Iraq from June 2008 to February 2009. They wanted to find out the relative influence of both deployment-related trauma and civilian stress, including the influence of both or either on alcohol abuse.
Almost 60% of soldiers surveyed reported experiencing combat-related traumatic events; 13% of that group was abusing alcohol. Of the 17% who reported being sexually harassed, about 5% were abusing alcohol. Of the nearly 36% of respondents who also experienced civilian stressors, 7.1% were abusing alcohol. In a final model, only civilian stressors were associated with subsequent alcohol use disorder (AUD), independent of deployment-related traumatic events.
Of the respondents, 106 had experienced mental illness personally or in someone close to them, 156 had been through a divorce or breakup, and 105 had been unemployed for ≥ 3 months. While serving, 364 had encountered land mines, water mines, or booby traps; 573 had received hostile incoming fire; and 471 had been attacked by terrorists, insurgents, or civilians.
The civilian stressors found to be most closely associated with AUD were having a family member with a serious drug or alcohol problem (adjusted odds ratio [OR] 1.36; 95% CI, 0.96-1.94), being robbed or having the house broken into (adjusted OR, 1.48; 95% CI, 1.02-2.21), and having problems in getting access to adequate health care (adjusted OR, 1.97; 95% CI, 1.07-3.63). Having experienced sexual harassment was the most closely associated combat trauma.
It was clear to the researchers that the combination of deployment-related trauma and civilian stressors were associated with new onset of AUD. That could mean that adult-onset AUD constitutes a different phenotype from recurrent AUDs, the researchers say. They cite previous research that identified 2 “types” of people who abuse alcohol. One type has a later onset, has “greater malleability to the social environment,” uses alcohol to soothe anxiety, and has less severe alcohol dependence symptoms. The other type turns to alcohol earlier, may be genetically predisposed to alcohol abuse, uses alcohol for its euphoric effect, and has a chronic treatment history.
A consideration when evaluating the findings, the researchers say, is that the soldiers who were interviewed shortly after their deployment may have been misclassified because psychiatric symptoms tend to appear 3 to 4 months after deployment.
Source
Cerdá M, Richards C, Cohen GH, et al. Am J Prev Med. 2014;47(4):461-466.
doi: 10.1016/j.amepre.2014.06.015.
Discovery could help predict, prevent therapy-related AML

Credit: Rhoda Baer
A new study challenges the view that cancer treatment is a direct cause of therapy-related acute myeloid leukemia (AML).
The research suggests that mutations in p53 can accumulate in hematopoietic stem cells (HSCs) as a person ages, years before a cancer diagnosis.
If and when cancer develops, these mutated cells are more resistant to treatment and multiply at an accelerated pace after exposure to chemotherapy or radiation therapy, which can then lead to AML.
The findings, reported in Nature, open up new avenues for research to predict which patients are at risk of developing therapy-related AML and to find ways to prevent it.
“Until now, we’ve really understood very little about therapy-related AML and why it is so difficult to treat,” said study author Daniel Link, MD, of Washington University in St Louis, Missouri.
“This gives us some important clues for further studies aimed at treatment and prevention.”
Dr Link and his colleagues began this research by sequencing the genomes of 22 patients with therapy-related AML. The patients had similar numbers and types of mutations in their leukemia cells as other patients who developed AML without prior exposure to chemotherapy or radiation, an indication that cancer treatment does not cause widespread DNA damage.
“This is contrary to what physicians and scientists have long accepted as fact,” said study author Richard K. Wilson, PhD, of The Genome Institute at Washington University.
“It led us to consider a novel hypothesis: p53 mutations accumulate randomly as part of the aging process and are present in blood stem cells long before a patient is diagnosed with therapy-related AML.”
When therapy-related AML occurs, it typically develops 1 to 5 years after treatment with chemotherapy or radiation. Its incidence varies by cancer type. For example, 10% of lymphoma patients who relapse after chemotherapy go on to develop therapy-related AML, compared to 0.1% of breast cancer patients.
The researchers knew that patients with therapy-related AML are more likely than other AML patients to have a high rate of p53 mutations in their blood cells.
But the team was surprised to find that nearly 50% of 19 healthy subjects (aged 68 to 89 with no history of cancer or chemotherapy) had mutations in one copy of p53, an indicator that many people acquire mutations in this gene as they age.
The finding encouraged the researchers to dig further. They scoured the US to find bone marrow samples from patients with therapy-related AML that had been stored before the patients developed leukemia.
“We wanted to know whether we could go back in time—before a patient is diagnosed with therapy-related AML—to find the exact p53 mutation that caused them to develop leukemia years later,” Dr Link said.
The researchers found 7 bone marrow samples that fit the criteria. In 4 samples, they detected specific mutations in p53 that were present at very low rates in blood cells or bone marrow 3 to 6 years before the patients developed AML.
In the 3 cases in which p53 mutations could not be found, the researchers said it’s possible the mutations were present but at rates too low to be detected, or it may be that other age-related mutations contributed to the onset of therapy-related AML.
In related work in mice, the team showed that chemotherapy causes HSCs with mutations in p53 to divide rapidly, which gives them a competitive advantage. But that was not the case in HSCs with both copies of the gene intact.
The researchers suspect the early accumulation of p53 mutations in HSCs likely contributes to the frequent chromosomal and genetic abnormalities seen in patients with therapy-related AML and their poor responses to chemotherapy. The team believes other age-related mutations may be involved in the disease as well.
“We’re already conducting follow-up studies to look for other age-related mutations that may be at play in therapy-related AML,” Dr Link said. “As individuals, we’re not genetically homogeneous throughout our lives. Our DNA is constantly changing as we age, and we know this plays an important role in the development of cancer.”
“With advanced genomics, we can investigate the interplay between aging and the random accumulation of mutations, as a means to improve the diagnosis, treatment, and prevention of cancer.” ![]()
Ixazomib induces durable responses in hard-to-treat amyloidosis

Photo courtesy of ASH
SAN FRANCISCO—The oral proteasome inhibitor ixazomib induces high-quality hematologic responses in patients with relapsed/refractory systemic light-chain (AL) amyloidosis, with generally manageable side effects, a phase 1 study suggests.
Preliminary results from this study indicated that ixazomib had promise for treating AL amyloidosis.
Now, researchers have reported updated safety data and figures for hematologic and organ responses, progression-free survival, and overall survival.
The study was presented at the 2014 ASH Annual Meeting (abstract 3450) 5 days after the US Food and Drug Administration granted ixazomib breakthrough status for the treatment of relapsed/refractory AL amyloidosis.
“To have an oral drug that is well-tolerated and extremely effective in patients exposed to all lines of other therapy is remarkable in this disease,” said study investigator Giampaolo Merlini, MD, of the Amyloidosis Research and Treatment Center, Fondazione IRCCS Policlinico San Matteo, at the University of Pavia in Italy.
He and his colleagues evaluated ixazomib in 22 patients with a median age of 65 years. They were heavily pretreated, with 95% exposed to melphalan and 73% to bortezomib.
The patients received 4 mg of ixazomib on days 1, 8, and 15 of 28-day cycles for up to 12 cycles. Those who did not achieve a hematologic partial response after 3 cycles received added dexamethasone.
In 21 evaluable patients, the overall response rate was 52%, including a complete response and very good partial response in 43% of patients.
Dr Merlini noted that responses were deep and durable. And the high response rates translated into high organ response rates.
“End-organ damage is what kills patients,” he said. “In 18 evaluable patients, both the heart and kidney response rate was 45%.”
At 1 year, progression-free survival was 60%. At 2 years, overall survival was 63%.
The drug was well-tolerated as well. The 3 most common side effects—nausea, diarrhea, and fatigue—were mild and seen in about 30% of patients.
Severe grade 3 or higher side effects included thrombocytopenia, diarrhea, and rash, occurring in about 10% of patients.
The development program for ixazomib in AL amyloidosis progressed directly from this phase 1 trial to a phase 3 study, TOURMALINE-AL1. The trial is already underway, with 80 patients enrolled thus far.
TOURMALINE-AL1 investigators are comparing ixazomib plus dexamethasone to physician’s choice of treatment in patients with relapsed/refractory AL amyloidosis. Data from this trial are expected by the end of 2015.
“For the first time, we have evidence of an oral drug that is extremely effective,” Dr Merlini said. “We need to see the phase 3 data, but it could be a breakthrough.” ![]()
FDA approves first supplemental test for HTLV-I/II
Credit: Daniel Gay
The US Food and Drug Administration (FDA) has approved the first supplemental test for human T-cell lymphotropic virus-I/II (HTLV-I/II).
The test, MP Diagnostics HTLV Blot 2.4, is a qualitative enzyme immunoassay intended for use as an additional, more specific test for human serum or plasma specimens that have previously tested positive for HTLV-I/II.
MP Diagnostics HTLV Blot 2.4 can confirm infection with HTLV and differentiate between HTLV-I and HTLV-II.
The HTLVs are a group of human retroviruses known to cause diseases such as adult T-cell leukemia/lymphoma and myelopathy. HTLV can be transmitted from person to person through breastfeeding, unprotected sexual contact, or transfusion of blood from an infected donor.
Therefore, the FDA requires that donated blood be tested for HTLV-I/II antibodies. Currently, there are 2 FDA-licensed screening tests for HTLV-I/II. If a test is positive, the donation is discarded, and the donor is notified of his or her deferral.
The MP Diagnostics HTLV Blot 2.4 can provide blood establishments with additional information to convey to the donor. Specifically, the test can confirm HTLV infection and determine which virus type is causing the infection, HTLV-I or HTLV-II.
“The approval of MP Diagnostics HTLV Blot 2.4 will help blood establishments better counsel donors who have had positive results on an FDA-licensed HTLV-I/II screening test,” said Karen Midthun, MD, director of the FDA’s Center for Biologics Evaluation and Research.
MP Diagnostics HTLV Blot 2.4 is manufactured by MP Biomedicals Asia Pacific Pte. Ltd. in Singapore, a company of MP Biomedicals LLC in Santa Ana, California. For more information on the test, visit the MP Biomedicals website. ![]()