User login
Blood products can transmit food allergies
![]()
In rare cases, children can develop allergies to previously tolerated foods after receiving blood products via transfusion, according to a case study published in Canadian Medical Association Journal.
“It is very unusual to identify someone who experienced passive transfer of allergy from blood products,” said study author Julia Upton, MD, of The Hospital for Sick Children in Toronto, Ontario, Canada.
“Importantly, this condition has an excellent prognosis and typically resolves within a few months.”
Dr Upton and her colleagues found that blood donors who have food allergies can transfer immunoglobulin E, an antibody that reacts against allergens, from blood products such as platelets, although this is rare.
The researchers said it is important for parents and physicians to be aware of this event in case children have anaphylactic reactions after receiving blood products, particularly after eating peanuts, tree nuts, and fish, foods they could previously consume without reaction.
These reactions—with symptoms such as facial swelling, throat discomfort, or sudden fatigue—should be treated immediately at an emergency department.
When there is passive transfer of allergies after blood transfusion, physicians should follow up with the family after a few months to decide the timing of careful reintroduction of the temporary allergens into a child’s diet.
Physicians should report suspected cases of passive transfer of allergies to the hospital’s transfusion service to investigate the cause and ensure the safety of the country’s blood supply. ![]()
SHM, IPC Healthcare Launch Hospitalist-Focused, Post–Acute-Care Educational Program
Hospitalists practicing in post–acute-care facilities have a new resource via an SHM partnership.
The society and IPC Healthcare of North Hollywood, Calif., debuted at the "Primer for Hospitalists on Skilled Nursing Facilities" at 2015 annual meeting.
The educational program, housed at SHM's Learning Portal, has 32 lessons meant to differentiate the traditional acute-care hospital from post–acute-care facilities. Lessons are grouped into five sections and two modules, with a focus on skilled-nursing facilities (SNFs), the most common post–acute-care settings.
"The types of resources that are available are different, and that's not only in terms of staff, but the availability of specialists, the availability of testing capabilities," says Joseph Miller, SHM's senior vice president for practice management.
"If you need to work with a cardiologist for a particular patient…how do you engage them?" Miller adds. "You're not going to be able to have them come and see that patient frequently. How do you communicate with them to get the feedback you need as the attending physician?"
Miller says that some 30% of hospitalist groups are practicing in post-acute settings, with the number only expected to rise. That's why SHM partnered with IPC to adapt and supplement that firm's post–acute-care program.
In addition, the rise of bundled payments and other reimbursement plans that include the post-discharge period also make now the right time for SHM to help provide educational resources, he adds.
Miller compared hospitalists to football quarterbacks, coordinating patient care as part of a team. Historically their focus has only been on care within the four walls of the hospital. But this is changing.
“Discharging a patient is like throwing a football pass," Miller says. “Today you don’t pay much attention to the receiver—whether he catches the ball or not. In the future, hospitalists will need to be concerned with completing the pass and scoring a touchdown.”
Visit our website for more on post-acute care.
Disparities in National Hospital Ratings Systems Produce No Clear Winners, Losers
A recent study found different approaches used by four popular hospital ratings systems resulted in disagreement about the ranking of many U.S. hospitals.
"Only 10% of hospitals that were rated as a high performer on one of the systems were rated as a high performer on another rating system," says lead author John Matthew Austin, MS, PhD, assistant professor of anesthesiology and critical care medicine at Johns Hopkins University School of Medicine in Baltimore. "There was no one hospital that was rated as a high performer on all four."
The study, which appeared in Health Affairs, looked at the hospital ratings systems of U.S. News, Healthgrades, The Leapfrog Group, and Consumer Reports, and found none took the same approach to assessing hospital quality. Of the 83 hospitals rated by all four systems, none were universally recognized as either a high performer or a low performer.
"I think the impact, or the influence, on consumers is that these conflicting ratings could generate confusion," Dr. Austin says. "Depending on which rating system you look at, it may give you a different answer on which hospital or where you should seek care. If you look at these four rating systems in a community, you may actually wind up being directed to four different hospitals."
David Pressel, MD, PhD, medical director of inpatient care at Alfred I. duPont Hospital for Children in Wilmington, Del., emphasized the difficulty of defining quality.
"Measuring quality is really difficult and hard, and people, physicians, and hospitals struggle with this," he explains. "I think it's very important that people recognize in rating systems there’s always going to be a top 10% or top 50% and a bottom 10% or 50%, and what's really important is not if you're in the top or bottom but what the scatter of the data is. If the scatter of the data is very narrow, they may not be providing much worse care than the top hospitals. I think that is lost on the public."
Dr. Austin's study identified varying missions and methodologies for each ratings system.
"U.S. News' Best Hospitals is actually intending to identify the best medical centers for the most complicated cases," Dr. Austin says. "The Leapfrog Hospital Safety Score has a very laser focus on patient safety, so freedom from harm, things like errors, infections."
Dr. Austin also noticed that some rating systems were more descriptive about their methods than others.
"Some of the ratings are much more transparent in what they share, in terms of how hospitals are rated, and others are less clear," he notes. "Healthgrades lists the top 100 hospitals. They're supposedly looking at hospital outcomes, but they don't publicly make their methodology available in terms of their risk-adjustment levels."
The rating systems also communicated their ratings differently. Leapfrog issues letter grades A–F; Consumer Reports and U.S. News issue scores from 0–100; and Healthgrades identifies the top 50 and top 100 hospitals but doesn’t rank hospitals, and hospitals that are not in the top 100 are not rated at all.
The study authors outlined possible improvements to eliminate some of these disparities, including reaching out to the sponsoring organizations and encouraging them to be more transparent about their ratings to allow for easier patient interpretation.
"Patients should understand what's being measured," Dr. Austin says. "Hospitals should be able to duplicate their ratings, so full transparency of the measures themselves, of the methodologies, is really important. We feel like these are a great start, but we definitely have some issues that still need to be resolved around measurements. We need better standardized measures."
Visit our website for more information on hospital ratings.
Practice Question Answers: Allergic Contact Dermatitis, Part 3
1. Which of the following is an amide-type anesthetic?
a. benzocaine
b. cocaine
c. lidocaine
d. procaine
e. tetracaine
2. A patient is referred for patch testing for suspected allergic contact dermatitis and is found to have positivity to hydrocortisone butyrate. The patient should try to avoid all of the following, except:
a. desonide
b. desoximetasone
c. fluocinolone
d. fluocinonide
e. triamcinolone
3. A patient with a documented contact allergy to neomycin sulfate should avoid all of the following medications, except:
a. bacitracin
b. gentamicin
c. kanamycin
d. mupirocin
e. streptomycin
4. Imidazolidinyl urea can cross-react with all of the following, except:
a. diazolidinyl urea
b. DMDM hydantoin
c. para-aminobenzoic acid
d. quaternium-15
e. tris(hydroxymethyl)nitromethane
5. Mercaptobenzothiazole can coreact with all of the following, except:
a. carbamates
b. dibenzothiazyl disulfide
c. mercapto mix
d. methyldibromo glutaronitrile
e. thiurams
Easing the ultimate transition
According to the National Hospice Foundation, an estimated 70 million Americans will need hospice and palliative care services in the next 20 years, and most of us cannot even begin to remember all the patients we have treated who were ultimately transferred from a medical ward to some form of hospice.
Hospice care is often a compassionate, appropriate recommendation, but is it not always an easy subject for hospitalists to broach. After all, we went into medicine to cure the sick. At least on a subconscious level, we may feel we have failed our patients when all we have to offer them is hospice. Plus, we are often at the disadvantage of not having enough time with our patients and their families to develop the trust needed to accept such a life-altering recommendation.

It’s important to remember that, even when we can’t cure our patients, we can offer them symptomatic relief and the ability to heal on a certain level. Sometimes, the recommendation of hospice is a much-welcomed release for patients and their families, a way to finally ease the burdens of uncertainty and of pain, both physical and emotional.
Palliative care can be an important addition to the care plan, as it focuses on relieving suffering, regardless of the stage of disease. Palliative care incorporates support, as well as assistance with communication about care needs. Within an integrated care model, palliative care may be provided alongside curative or life-prolonging treatments.
Palliative care can be particularly useful for helping patients to prepare for the emotional transition from seeking aggressive but likely futile care to accepting the ultimate reality of their disease process. Even when death is not imminent, having the appropriate support systems in place for patients and their families can play a significant role in easing their minds and helping them make informed, appropriate treatment decisions.
Dr. Hester is a hospitalist at Baltimore-Washington Medical Center in Glen Burnie, Md. She is the creator of the Patient Whiz, a patient-engagement app for iOS. Reach her at [email protected].
According to the National Hospice Foundation, an estimated 70 million Americans will need hospice and palliative care services in the next 20 years, and most of us cannot even begin to remember all the patients we have treated who were ultimately transferred from a medical ward to some form of hospice.
Hospice care is often a compassionate, appropriate recommendation, but is it not always an easy subject for hospitalists to broach. After all, we went into medicine to cure the sick. At least on a subconscious level, we may feel we have failed our patients when all we have to offer them is hospice. Plus, we are often at the disadvantage of not having enough time with our patients and their families to develop the trust needed to accept such a life-altering recommendation.
It’s important to remember that, even when we can’t cure our patients, we can offer them symptomatic relief and the ability to heal on a certain level. Sometimes, the recommendation of hospice is a much-welcomed release for patients and their families, a way to finally ease the burdens of uncertainty and of pain, both physical and emotional.
Palliative care can be an important addition to the care plan, as it focuses on relieving suffering, regardless of the stage of disease. Palliative care incorporates support, as well as assistance with communication about care needs. Within an integrated care model, palliative care may be provided alongside curative or life-prolonging treatments.
Palliative care can be particularly useful for helping patients to prepare for the emotional transition from seeking aggressive but likely futile care to accepting the ultimate reality of their disease process. Even when death is not imminent, having the appropriate support systems in place for patients and their families can play a significant role in easing their minds and helping them make informed, appropriate treatment decisions.
Dr. Hester is a hospitalist at Baltimore-Washington Medical Center in Glen Burnie, Md. She is the creator of the Patient Whiz, a patient-engagement app for iOS. Reach her at [email protected].

Drug approved to treat CML, ALL in Canada

Photo courtesy of the FDA
Health Canada has approved ponatinib hydrochloride (Iclusig) to treat adults with any phase of chronic myeloid leukemia (CML) or Philadelphia
chromosome-positive acute lymphoblastic leukemia (Ph+ ALL) for whom other tyrosine kinase inhibitor (TKI) therapy is not appropriate, including CML or Ph+ ALL patients with the T315I mutation and those who have exhibited prior TKI resistance or intolerance.
Ponatinib is approved under the Notice of Compliance with Conditions policy based on promising evidence of clinical effectiveness.
Products approved under this policy are intended for the treatment, prevention, or diagnosis of a serious, life-threatening, or severely debilitating illness. The products must have demonstrated promising benefit, be of high quality, and possess an acceptable safety profile based on a benefit/risk assessment.
These products either respond to a serious unmet medical need in Canada or have demonstrated a significant improvement in the benefit/risk profile over existing therapies.
Ponatinib will be made available in Canada through a controlled distribution program. Prescribers who have completed the certification procedure will be able to prescribe the drug. Trained pharmacies will verify the prescriber’s certified status prior to dispensing ponatinib to the patient.
Health Canada’s decision to approve ponatinib was based on 2-year data from the phase 2 PACE trial.
A trial set to begin in mid-2015 will serve as the confirmatory trial for the Health Canada approval. Investigators will evaluate 3 starting doses of ponatinib in patients with refractory, chronic-phase CML who are resistant to at least 2 approved TKIs.
PACE trial
Researchers conducted this trial in patients with CML or Ph+ ALL who were resistant or intolerant to prior TKI therapy, or who had the T315I mutation.
Ponatinib demonstrated anti-leukemic activity in these patients, prompting a major cytogenetic response (MCyR) in 56% of chronic-phase CML patients and in 70% of patients with the T315I mutation. MCyR within the first 12 months of treatment was the primary endpoint for chronic-phase patients.
In patients with advanced disease, 57% of accelerated-phase CML patients and 31% of blast-phase CML patients achieved a major hematologic response (MaHR). MaHR within the first 6 months was the primary endpoint for patients with advanced disease. In patients with Ph+ ALL, 41% achieved MaHR.
Common non-hematologic adverse events included rash (38%), abdominal pain (38%), headache (35%), dry skin (35%), constipation (34%), fatigue (27%), pyrexia (27%), nausea (26%), arthralgia (25%), hypertension (21%), increased lipase (19%), and increased amylase (7%).
Hematologic events of any grade included thrombocytopenia (42%), neutropenia (24%), and anemia (20%). Serious adverse events of arterial thromboembolism, including arterial stenosis, occurred in patients with cardiovascular risk factors.
Extended follow-up data from the PACE trial, collected in 2013, suggested ponatinib can increase the risk of thrombotic events. When these data came to light, officials in the European Union and the US, where ponatinib had already been approved, began to investigate the drug.
Ponatinib was pulled from the US market for a little over 2 months, and trials of the drug were placed on partial hold while the Food and Drug Administration evaluated the drug’s safety. Ponatinib went back on the market in January 2014, with new safety measures in place.
The drug was not pulled from the market in the European Union, but the European Medicine’s Agency released recommendations for safer use of ponatinib. The Committee for Medicinal Products for Human Use reviewed data on ponatinib and decided the drug’s benefits outweigh its risks. ![]()
Protein proves essential for hematopoietic recovery

in the bone marrow
New research suggests the cell survival protein MCL-1, a target for a number of new anticancer agents, is essential for hematopoietic recovery.
Investigators found that reducing MCL-1 levels hindered hematopoietic recovery after chemotherapy and radiotherapy caused extensive destruction of mature blood cells.
Reducing MCL-1 also impaired reconstitution of the bone marrow after hematopoietic stem cell transplant (HSCT).
“Our previous research has shown that targeting MCL-1 could be used with great success for treating certain blood cancers,” said Alex Delbridge, PhD, of the Walter and Eliza Hall Institute of Medical Research in Melbourne, Victoria, Australia.
“However, we have now shown that MCL-1 is also critical for emergency recovery of the blood cell system after cancer therapy-induced blood cell loss.”
Dr Delbridge and his colleagues reported these findings in Blood.
Experiments in mice revealed that loss of a single MCL-1 allele, which reduced MCL-1 protein levels, greatly compromised the immune system and hindered red blood cell recovery after treatment with 5-fluorouracil, γ-irradiation, or HSCT.
Further investigation showed that the pro-apoptotic gene PUMA plays a key role in this phenomenon, as MCL-1 inhibits PUMA. In mice, knocking out PUMA alleviated—but did not eliminate—the HSC survival defect caused by deletion of both MCL-1 alleles.
“This exquisite dependency on MCL-1 for emergency blood cell production has important implications for potential cancer treatments involving MCL-1 inhibitors,” Dr Delbridge said.
“If MCL-1 inhibitors are to be used in combination with other cancer therapies, careful monitoring of the blood cell system will be needed,” added Stephanie Grabow, PhD, also of the Walter and Eliza Hall Institute.
“Our institute colleagues are working to evaluate a potential new drug to treat blood cancers by targeting MCL-1. Our findings suggest that MCL-1 inhibitors and chemotherapeutic drugs should not be used simultaneously.”
Dr Delbridge said this research also offers insights that could help improve HSCT.
“Stem cell transplants can be dangerous because, until the blood cell system is functionally restored, patients are vulnerable to infection,” he said. “Our research suggests that increasing levels of MCL-1 or decreasing the activity of opposing proteins could be a viable strategy for speeding up the regeneration process and reducing the risk of infection after stem cell transplantation.” ![]()
Inconsistent Code Status Documentation
For hospitalized patients, providers should ideally establish advanced directives for cardiopulmonary resuscitation, commonly referred to as a patient's code status. Having an end‐of‐life plan is important and is associated with better quality of life for patients.[1, 2, 3, 4, 5] Advanced directive discussions and documentation are key quality measures to improve end‐of‐life care for vulnerable elders.[6, 7, 8]
Clear and consistent code status documentation is a prerequisite to providing care that respects hospitalized patients' preferences. Code status documentation only occurs in a minority of hospitalized patients, ranging from 25% of patients on a general medical ward to 36% of patients on elderly‐care wards.[9] Even in high‐risk patients, such as patients with metastatic cancer, providers only documented code status 20% of the time.[10] Even when code status documentation occurs, the amount of detail regarding patient goals and values, prognosis, and treatment options is generally poor.[11, 12] There are also concerns about the accuracy of code status documentation.[13, 14, 15, 16, 17, 18, 19] For example, a recent study found that for patients who had discussed their code status during their hospitalization, only 30% had documentation of their preferences in their chart that accurately reflected what was discussed.[20]
Further complicating matters is the fact that providers document key patient information, such as a patient's code status, in multiple places (eg, progress notes, physician orders). As a result, an additional documentation problem of inconsistency can arise for 2 reasons. First, code status documentation can be inconsistent because of incomplete documentation. Incomplete documentation is primarily a problem in patients who do not want to be resuscitated (ie, do not resuscitate [DNR]), because the absence of code status documentation leads front‐line staff to assume that the patient wants to be resuscitated (ie, full code). Second, inconsistent documentation can occur because of conflicting documentation (eg, a patient has a different code status documented in 2 or more places).
Together, these documentation problems have the potential to lead healthcare providers to resuscitate patients who do not wish to be resuscitated, or for patients who wish to be resuscitated to have delays in their resuscitation efforts. This study will extend the knowledge from the previous literature by exploring how the complexity and redundancy of clinical documentation practices affect the quality of code status documentation. To our knowledge, there are no prior studies that focus specifically on the frequency and clinical relevance of inconsistent code status documentation for inpatients across multiple documentation sources.
METHODS
Study Context
This is a point‐prevalence study conducted at 3 academic medical centers (AMCs) affiliated with the University of Toronto. At all 3 AMCs, the majority of general internal medicine (GIM) patients are admitted to 1 of 4 clinical teaching units (CTUs). The physician team on each CTU consists of 1 attending staff, 1 senior resident (second or third year resident), 2 to 3 first‐year residents, and 2 to 3 medical students. CTUs typically care for between 15 and 25 patients. The research ethics boards at each of the AMCs approved this study.
Existing Code Status Documentation Processes
At all 3 AMCs, providers document patient code status in 5 different places: (1) progress notes (admission and daily progress notes in the paper chart), (2) physician orders (computerized orders at 1 site, paper orders at the other 2 sites), (3) electronic sign‐out lists (Web‐based tools used by residents to support patient handover), (4) nursing‐care plan (used by nurses to document care plans for their assigned patients), and (5) DNR sheet (a cover sheet placed at the front of the paper chart in patients who have a DNR order) (see Supporting Information, Appendix, in the online version of this article). None of these documentation sources link automatically to one another. Once a physician establishes a patient's code status, it should be documented in the progress notes. The same physician should also write the code status as a physician order and update the patient's code status in the Web‐based electronic sign‐out list. The nurse responsible for the patient transcribes the code status order in the nursing‐care plan. For DNR patients, nurses or physicians (depending on the AMC) also place the DNR sheet in the front of the chart.
At our 3 AMCs, in the event of a cardiac arrest, resident physicians and nurses are typically the first responders. To quickly determine a patient's code status nurses and resident physicians look for the presence or absence of a DNR sheet. In addition, nurses rely on their nursing‐care plan and resident physicians rely on their electronic sign‐out list.
Eligibility Criteria and Sampling Strategy
Our study included GIM patients admitted to a CTU at 1 of 3 AMCs, and excluded admitted GIM patients who remained in the emergency department (due to differences in code status documentation processes). Data collection took place between September 2010 and September 2011 on days when the principal author (A.S.W.) was available to collect the data.
We collected data for all patients from a single GIM CTU on the same day to minimize the chance that a team updates or changes a patient's code status during data collection. We included each of the 4 CTUs at the 3 study sites once during the study period (ie, 12 full days of data collection).
Study Measures and Data Collection
One study author (A.S.W.) screened the 5 code status documentation sources listed above for each patient and recorded the documented code status as full code, DNR, or blank (if there was nothing entered) in a database. We also collected patient demographic data, admitting diagnosis, length of stay, admission to home ward (ie, the medicine ward affiliated with the CTU team that admitted the patient), free‐text code status documentation, transfer to the intensive care unit during their hospitalization, and whether the patient is receiving comfort measures, up to the time of data collection. Because the study investigators were not members of the team providing care to patients included in the study, we could not directly elicit the patient's actual code status.
The primary study outcome measures were the completeness and consistency of code status documentation across the 5 documentation sources. For completeness, we included data relating to 4 documentation sources only, excluding the DNR sheet because it is only relevant for DNR patients. We defined inconsistent code status documentation a priori as (1) the code status is conflicting in at least 2 documentation sources (eg, full code in 1 source and DNR in another) or (2) the code status is documented in 1 or more documentation source and not documented in at least 1 documentation source (eg, full code in 1 source and blank in another).
We then subdivided code status documentation inconsistencies into nonclinically relevant and clinically relevant subcategories. For example, a nonclinically relevant inconsistency would be if a physician documented full code in the physician orders, but a nurse did not document anything in the nursing‐care plan, because most providers would assume a preference for resuscitation in the absence of code status documentation in the nursing‐care plan.
We defined clinically relevant inconsistencies as those that would reasonably lead healthcare providers referring to different documentation sources to respond differently in the event of a cardiac arrest (eg, the physician orders show DNR whereas the nursing‐care plan is blanka provider who refers to the physician orders would not resuscitate the patient, but another provider who refers to the blank nursing‐care plan would resuscitate the patient).
We determined the proportion of patients with inconsistent code status documentation by listing the 31 different permutations of code status documentation in our data (Figure 1). Using the prespecified definition of inconsistent code status documentation, 3 study authors (I.A.D., B.M.W., R.C.W.) independently determined whether each permutation met the criteria for inconsistent code status documentation, and judged the clinical relevance of each documentation inconsistency. We resolved disagreements by consensus.

Statistical Analysis
We calculated descriptive statistics for all variables, summarizing continuous measures using means and standard deviations, and categorical measures using counts, percentages, and their associated 95% confidence intervals. Logistic regression analyses adjusting for the correlation among observations taken from the same team were carried out. Each of the 4 variables of interest (patient age, length of stay, receiving comfort measures, free text code status documentation) was run in a bivariate model to obtain unadjusted estimates as well as the final multivariable model. All estimates were displayed as odds ratios (ORs) and their associated 95% confidence intervals (CIs). A P value <0.05 was used to denote statistical significance. We also carried out a kappa analysis to assess inter‐rater agreement when judging whether inconsistent documentation is clinically relevant. All analyses were carried out using SAS version 9.3 (SAS Institute, Cary, NC).
RESULTS
There were 194 patients potentially eligible for inclusion. Seven admitted GIM patients who had not been transferred from the emergency department were excluded, leaving 187 patients in the study. The mean patient age was 70 years; 83 (44%) were female. The median length of stay up to the time of data collection was 6 days, with the majority (156 [83%]) of patients admitted to their home ward. Ten (5%) patients were receiving comfort measures.
Completeness of Code Status Documentation
Thirty‐eight (20%; 95% CI, 14%‐26%) patients had complete and consistent code status documentation across all documentation sources, whereas 27 (14%; 95% CI, 9%‐19%) patients had no code status documented in any documentation source. By documentation source, providers documented code status in the progress notes for 89 patients (48%; 95% CI, 40%‐55%), the physician orders for 107 patients (57%; 95% CI, 50%‐64%), the nursing‐care plan for 110 patients (59%; 95% CI, 51%‐66%), and the electronic sign‐out list for 129 patients (69%; 95% CI, 62%‐76%).
Consistency of Code Status Documentation
The remaining 122 patients (65%; 95% CI, 58%‐72%) had at least 1 code status documentation inconsistency. Of these, 38 patients (20%; 95% CI, 14%‐26%) had a clinically relevant code status documentation inconsistency. Code status documentation inconsistency differed by site; the 2 hospitals with paper‐based physician orders had fewer patients with complete and consistent code status documentation compared to the hospital where physician orders are electronic (15% vs 42%, respectively, P<0.001) (Table 1).
| Physician Code Status Order | Sites 1 & 2: Paper‐Based, N=108 | Site 3: Electronic, N=52 | P Value |
|---|---|---|---|
| Consistent code status documentation | 16 (15%) | 22 (42%) | |
| Inconsistent code status documentation, nonclinically relevant | 60 (56%) | 30 (58%) | <0.0001 |
| Inconsistent code status documentation, clinically relevant | 32 (30%) | 6 (12%) |
The permutations of clinically relevant and nonclinically relevant inconsistencies are summarized in Figure 1. We achieved high inter‐rater reliability among the 3 independent reviewers with respect to rating the clinical relevance of documentation inconsistencies (=0.86 [95% CI, 0.76‐0.95]).
To identify correlates of clinically relevant code status documentation inconsistencies, we included 4 variables of interest (patient age, length of stay, receiving comfort measures, and free text code status documentation) in a logistic regression analysis. Bivariate analyses demonstrated that increased age (OR =1.07 [95% CI, 1.05‐1.10] for every 1‐year increase in age, P<0.001) and receiving comfort measures (OR= 10.98 [95% CI, 1.94‐62.12], P=0.007) were associated with a clinically relevant code status documentation inconsistency. Using these 4 variables in a multivariable analysis clustering for physician team, increased age (OR=1.07 [95% CI, 1.04‐1.10] for every 1‐year increase in age, P<0.0001) and receiving comfort measures (OR=9.39 [95% CI, 1.3565.19], P=0.02) remained as independent positive correlates of having a clinically relevant code status documentation inconsistency (Table 2).
| Clinically Relevant Inconsistencies, N=38 | No Inconsistencies and Nonclinically Relevant Inconsistencies, N=149 | P Value | |
|---|---|---|---|
| |||
| Age, y, mean (SD) | 83 (10) | 67 (19) | <0.0001* |
| Length of stay, d, median (IQR) | 6.5 (310) | 6 (219) | 0.39 |
| Receiving comfort measures, n (%) | 7 (18%) | 3 (2%) | <0.0001* |
| Free‐text code status documentation, n (%) | 18 (47%) | 58 (39%) | 0.34 |
DISCUSSION
We found that 2 out of 3 patients had at least 1 inconsistency in code status documentation, and that 1 in 5 patients had at least 1 clinically relevant code status documentation inconsistency. The majority of clinically relevant inconsistencies occurred because there was a DNR order written in some sources of code status documentation, and no orders in other documentation sources. However, there were 4 striking examples where DNR was written in some sources of code status documentation and full code was written in other documentation sources (Figure 1).
Older patients and patients receiving comfort measures were more likely to have a clinically relevant inconsistency in code status documentation. This is particularly concerning, because they are among the most vulnerable patients at highest risk for having an in‐hospital cardiac arrest.
Our study extends the findings of prior studies that identified gaps in completeness and accuracy of code status documentation and describes another important gap in the quality and consistency of code status documentation.[20] This becomes particularly important because efforts aimed at increasing documentation of patients' code status without ensuring consistency across documentation sources may still result in patients being resuscitated or not resuscitated inappropriately.
This issue of poorly integrated health records is relevant for many other aspects of patient care. For example, 1 study found significant discrepancies in patient medication allergy documentation across multiple health records.[21] This fragmentation of documentation of the same patient information in multiple health records requires attention and should be the focus of institutional quality improvement efforts.
There are several potential ways to improve the code status documentation process. First, the use of standard fields or standardized orders can increase the completeness and improve the clarity of code status documentation.[22, 23] For institutions with an electronic medical record, forcing functions may further increase code status documentation. One study found that the implementation of an electronic medical record increased code status documentation from 4% to 63%.[24] We found similarly that the site with electronic physician orders had higher rates of complete and consistent code status documentation.
A second approach is to minimize the number of different sources for code status documentation. Institutions should critically examine each place where providers could document code status and decide whether this information adds value, and create policies to restrict unnecessary duplicate documentation and ensure accurate documentation of code status in several key, centralized locations.[25] A third option would be to automatically synchronize all code status documentation sources.[25] This final approach requires a fully integrated electronic health record.
Our study has several limitations. Although we report a large number of code status documentation inconsistencies, we do not know how many of these lead to incorrect resuscitative measures, so the actual impact on patient care is unknown. Also, because we were focusing on inconsistencies among sources of code status documentation, and not on accurate documentation of a patients' code status, the patients' actual preferences were not elicited and are not known. Finally, we carried out our study in 3 AMCs with residents that rotate from 1 site to another. The transient nature of resident work may increase the likelihood of documentation inconsistencies, because trainees may be less aware of local processes. In addition, the way front‐line staff uses clinical documentation sources to determine a patient's code status may differ at other institutions. Therefore, our estimate of clinical relevance may not be generalizable to other institutions with different front‐line processes or with healthcare teams that are more stable and aware of local documentation processes.
In summary, our study uncovered significant gaps in the quality of code status documentation that span 3 different AMCs. Having multiple, poorly integrated sources for code status documentation leads to a significant number of concerning inconsistencies that create opportunities for healthcare providers to inappropriately deliver or withhold resuscitative measures that conflict with patients' expressed wishes. Institutions need to be aware of this potential documentation hazard and take steps to minimize code status documentation inconsistencies. Even though cardiac arrests occur infrequently, if healthcare teams take inappropriate action because of these code status documentation inconsistencies, the consequences can be devastating.
Disclosure
Nothing to report.
- , , , et al. Advance directives for medical care—a case for greater use. N Engl J Med. 1991;324(13):889–895.
- , , , et al; Canadian Researchers at the End of Life Network (CARENET). What matters most in end‐of‐life care: perceptions of seriously ill patients and their family memebrs. CMAJ. 2006;174(5):627–633.
- , , . Advance directives and outcomes of surrogate decision making before death. N Eng J Med. 2010;362(13):1211–1218.
- , , , et al. Associations between end‐of‐life discussions, patient mental health, medical care near death, and caregiver bereavement adjustment. JAMA. 2008;300(14):1665–1673.
- , , , . The impact of advance care planning on end of life care in elderly patients: randomized controlled trial. BMJ. 2010;340:c1345.
- , . Quality indicators for end‐of‐life care in vulnerable elders. Ann Intern Med. 2001;135(8):667–685.
- , , , . Assessing care of vulnerable elders: methods for developing quality indicators. Ann Intern Med. 2001;135:647–652.
- , , , et al. Perceptions by family members of the dying experience of older and seriously ill patients. Ann Intern Med. 1997;126(2):97–106.
- , . Cardiopulmonary resuscitation: capacity, discussion and documentation. Q J Med. 2006;99(10):683–690.
- , , , et al. Code status documentation in the outpatient electronic medical records or patients with metastatic cancer. J Gen Intern Med. 2009;25(2):150–153.
- , , , et al. Factors associated with discussion of care plans and code status at the time of hospital admission: results from the multicenter hospitalist study. J Hosp Med. 2008;3(6):437–445.
- , , , . Documentation quality of inpatient code status discussions. J Pain Symptom Manage. 2014;48(4):632–638.
- , , , . The use of life‐sustaining treatments in hospitalized persons aged 80 and older. J Am Geriatr Soc. 2002;50(5):930–934.
- The SUPPORT Principal Investigators. A controlled trial to improve care for seriously ill hospitalized patients: the Study to Understand Prognoses and Preferences for Outcomes and Risks of Treatments (SUPPORT). JAMA. 1995;274(20):1591–1598.
- , , . Some treatment‐withholding implications of no‐code orders in an academic hospital. Crit Care Med. 1984;12(10):879–881.
- . A prospective study of patients with DNR orders in a teaching hospital. Arch Intern Med. 1998;148(10):2193–2198.
- , . Compliance with do‐not‐resuscitate orders for hospitalized patient transported to radiology department. Ann Int Med. 1998;129(10):801–805.
- , . Identification of inpatient DNR status: a safety hazard begging for standardization. J Hosp Med. 2007;2(6):366–371.
- . Controlling death: the false promise of advance directives. Ann Int Med. 2007;147(1):51–57.
- , , , et al. Failure to engage hospitalized elderly patients and their families in advance care planning. JAMA Intern Med. 2013;173(9):778–787.
- , , , et al. The recording of drug sensitivities for older people living in care homes. Br J Clin Pharmacol. 2010;69(5):553–557.
- , , , , , . A comparison of methods to communicate treatment preferences in nursing facilities: traditional practices versus the physician orders for life‐sustaining treatment program. J Am Geriatr Soc. 2010;58(7):1241–1248.
- , , , et al. Evaluation of a treatment limitation policy with a specific treatment‐limiting order page. Arch Intern Med. 1994;154(4):425–432.
- , , , et al. An electronic medical record intervention increased nursing home advance directive orders and documentation. J Am Geriatr Soc. 2007;55(7):1001–1006.
- , , , et al. Honouring patient's resuscitation wishes: a multiphased effort to improve identification and documentation. BMJ Quality Safety. 2013;22(1):85–92.
For hospitalized patients, providers should ideally establish advanced directives for cardiopulmonary resuscitation, commonly referred to as a patient's code status. Having an end‐of‐life plan is important and is associated with better quality of life for patients.[1, 2, 3, 4, 5] Advanced directive discussions and documentation are key quality measures to improve end‐of‐life care for vulnerable elders.[6, 7, 8]
Clear and consistent code status documentation is a prerequisite to providing care that respects hospitalized patients' preferences. Code status documentation only occurs in a minority of hospitalized patients, ranging from 25% of patients on a general medical ward to 36% of patients on elderly‐care wards.[9] Even in high‐risk patients, such as patients with metastatic cancer, providers only documented code status 20% of the time.[10] Even when code status documentation occurs, the amount of detail regarding patient goals and values, prognosis, and treatment options is generally poor.[11, 12] There are also concerns about the accuracy of code status documentation.[13, 14, 15, 16, 17, 18, 19] For example, a recent study found that for patients who had discussed their code status during their hospitalization, only 30% had documentation of their preferences in their chart that accurately reflected what was discussed.[20]
Further complicating matters is the fact that providers document key patient information, such as a patient's code status, in multiple places (eg, progress notes, physician orders). As a result, an additional documentation problem of inconsistency can arise for 2 reasons. First, code status documentation can be inconsistent because of incomplete documentation. Incomplete documentation is primarily a problem in patients who do not want to be resuscitated (ie, do not resuscitate [DNR]), because the absence of code status documentation leads front‐line staff to assume that the patient wants to be resuscitated (ie, full code). Second, inconsistent documentation can occur because of conflicting documentation (eg, a patient has a different code status documented in 2 or more places).
Together, these documentation problems have the potential to lead healthcare providers to resuscitate patients who do not wish to be resuscitated, or for patients who wish to be resuscitated to have delays in their resuscitation efforts. This study will extend the knowledge from the previous literature by exploring how the complexity and redundancy of clinical documentation practices affect the quality of code status documentation. To our knowledge, there are no prior studies that focus specifically on the frequency and clinical relevance of inconsistent code status documentation for inpatients across multiple documentation sources.
METHODS
Study Context
This is a point‐prevalence study conducted at 3 academic medical centers (AMCs) affiliated with the University of Toronto. At all 3 AMCs, the majority of general internal medicine (GIM) patients are admitted to 1 of 4 clinical teaching units (CTUs). The physician team on each CTU consists of 1 attending staff, 1 senior resident (second or third year resident), 2 to 3 first‐year residents, and 2 to 3 medical students. CTUs typically care for between 15 and 25 patients. The research ethics boards at each of the AMCs approved this study.
Existing Code Status Documentation Processes
At all 3 AMCs, providers document patient code status in 5 different places: (1) progress notes (admission and daily progress notes in the paper chart), (2) physician orders (computerized orders at 1 site, paper orders at the other 2 sites), (3) electronic sign‐out lists (Web‐based tools used by residents to support patient handover), (4) nursing‐care plan (used by nurses to document care plans for their assigned patients), and (5) DNR sheet (a cover sheet placed at the front of the paper chart in patients who have a DNR order) (see Supporting Information, Appendix, in the online version of this article). None of these documentation sources link automatically to one another. Once a physician establishes a patient's code status, it should be documented in the progress notes. The same physician should also write the code status as a physician order and update the patient's code status in the Web‐based electronic sign‐out list. The nurse responsible for the patient transcribes the code status order in the nursing‐care plan. For DNR patients, nurses or physicians (depending on the AMC) also place the DNR sheet in the front of the chart.
At our 3 AMCs, in the event of a cardiac arrest, resident physicians and nurses are typically the first responders. To quickly determine a patient's code status nurses and resident physicians look for the presence or absence of a DNR sheet. In addition, nurses rely on their nursing‐care plan and resident physicians rely on their electronic sign‐out list.
Eligibility Criteria and Sampling Strategy
Our study included GIM patients admitted to a CTU at 1 of 3 AMCs, and excluded admitted GIM patients who remained in the emergency department (due to differences in code status documentation processes). Data collection took place between September 2010 and September 2011 on days when the principal author (A.S.W.) was available to collect the data.
We collected data for all patients from a single GIM CTU on the same day to minimize the chance that a team updates or changes a patient's code status during data collection. We included each of the 4 CTUs at the 3 study sites once during the study period (ie, 12 full days of data collection).
Study Measures and Data Collection
One study author (A.S.W.) screened the 5 code status documentation sources listed above for each patient and recorded the documented code status as full code, DNR, or blank (if there was nothing entered) in a database. We also collected patient demographic data, admitting diagnosis, length of stay, admission to home ward (ie, the medicine ward affiliated with the CTU team that admitted the patient), free‐text code status documentation, transfer to the intensive care unit during their hospitalization, and whether the patient is receiving comfort measures, up to the time of data collection. Because the study investigators were not members of the team providing care to patients included in the study, we could not directly elicit the patient's actual code status.
The primary study outcome measures were the completeness and consistency of code status documentation across the 5 documentation sources. For completeness, we included data relating to 4 documentation sources only, excluding the DNR sheet because it is only relevant for DNR patients. We defined inconsistent code status documentation a priori as (1) the code status is conflicting in at least 2 documentation sources (eg, full code in 1 source and DNR in another) or (2) the code status is documented in 1 or more documentation source and not documented in at least 1 documentation source (eg, full code in 1 source and blank in another).
We then subdivided code status documentation inconsistencies into nonclinically relevant and clinically relevant subcategories. For example, a nonclinically relevant inconsistency would be if a physician documented full code in the physician orders, but a nurse did not document anything in the nursing‐care plan, because most providers would assume a preference for resuscitation in the absence of code status documentation in the nursing‐care plan.
We defined clinically relevant inconsistencies as those that would reasonably lead healthcare providers referring to different documentation sources to respond differently in the event of a cardiac arrest (eg, the physician orders show DNR whereas the nursing‐care plan is blanka provider who refers to the physician orders would not resuscitate the patient, but another provider who refers to the blank nursing‐care plan would resuscitate the patient).
We determined the proportion of patients with inconsistent code status documentation by listing the 31 different permutations of code status documentation in our data (Figure 1). Using the prespecified definition of inconsistent code status documentation, 3 study authors (I.A.D., B.M.W., R.C.W.) independently determined whether each permutation met the criteria for inconsistent code status documentation, and judged the clinical relevance of each documentation inconsistency. We resolved disagreements by consensus.
Statistical Analysis
We calculated descriptive statistics for all variables, summarizing continuous measures using means and standard deviations, and categorical measures using counts, percentages, and their associated 95% confidence intervals. Logistic regression analyses adjusting for the correlation among observations taken from the same team were carried out. Each of the 4 variables of interest (patient age, length of stay, receiving comfort measures, free text code status documentation) was run in a bivariate model to obtain unadjusted estimates as well as the final multivariable model. All estimates were displayed as odds ratios (ORs) and their associated 95% confidence intervals (CIs). A P value <0.05 was used to denote statistical significance. We also carried out a kappa analysis to assess inter‐rater agreement when judging whether inconsistent documentation is clinically relevant. All analyses were carried out using SAS version 9.3 (SAS Institute, Cary, NC).
RESULTS
There were 194 patients potentially eligible for inclusion. Seven admitted GIM patients who had not been transferred from the emergency department were excluded, leaving 187 patients in the study. The mean patient age was 70 years; 83 (44%) were female. The median length of stay up to the time of data collection was 6 days, with the majority (156 [83%]) of patients admitted to their home ward. Ten (5%) patients were receiving comfort measures.
Completeness of Code Status Documentation
Thirty‐eight (20%; 95% CI, 14%‐26%) patients had complete and consistent code status documentation across all documentation sources, whereas 27 (14%; 95% CI, 9%‐19%) patients had no code status documented in any documentation source. By documentation source, providers documented code status in the progress notes for 89 patients (48%; 95% CI, 40%‐55%), the physician orders for 107 patients (57%; 95% CI, 50%‐64%), the nursing‐care plan for 110 patients (59%; 95% CI, 51%‐66%), and the electronic sign‐out list for 129 patients (69%; 95% CI, 62%‐76%).
Consistency of Code Status Documentation
The remaining 122 patients (65%; 95% CI, 58%‐72%) had at least 1 code status documentation inconsistency. Of these, 38 patients (20%; 95% CI, 14%‐26%) had a clinically relevant code status documentation inconsistency. Code status documentation inconsistency differed by site; the 2 hospitals with paper‐based physician orders had fewer patients with complete and consistent code status documentation compared to the hospital where physician orders are electronic (15% vs 42%, respectively, P<0.001) (Table 1).
| Physician Code Status Order | Sites 1 & 2: Paper‐Based, N=108 | Site 3: Electronic, N=52 | P Value |
|---|---|---|---|
| Consistent code status documentation | 16 (15%) | 22 (42%) | |
| Inconsistent code status documentation, nonclinically relevant | 60 (56%) | 30 (58%) | <0.0001 |
| Inconsistent code status documentation, clinically relevant | 32 (30%) | 6 (12%) |
The permutations of clinically relevant and nonclinically relevant inconsistencies are summarized in Figure 1. We achieved high inter‐rater reliability among the 3 independent reviewers with respect to rating the clinical relevance of documentation inconsistencies (=0.86 [95% CI, 0.76‐0.95]).
To identify correlates of clinically relevant code status documentation inconsistencies, we included 4 variables of interest (patient age, length of stay, receiving comfort measures, and free text code status documentation) in a logistic regression analysis. Bivariate analyses demonstrated that increased age (OR =1.07 [95% CI, 1.05‐1.10] for every 1‐year increase in age, P<0.001) and receiving comfort measures (OR= 10.98 [95% CI, 1.94‐62.12], P=0.007) were associated with a clinically relevant code status documentation inconsistency. Using these 4 variables in a multivariable analysis clustering for physician team, increased age (OR=1.07 [95% CI, 1.04‐1.10] for every 1‐year increase in age, P<0.0001) and receiving comfort measures (OR=9.39 [95% CI, 1.3565.19], P=0.02) remained as independent positive correlates of having a clinically relevant code status documentation inconsistency (Table 2).
| Clinically Relevant Inconsistencies, N=38 | No Inconsistencies and Nonclinically Relevant Inconsistencies, N=149 | P Value | |
|---|---|---|---|
| |||
| Age, y, mean (SD) | 83 (10) | 67 (19) | <0.0001* |
| Length of stay, d, median (IQR) | 6.5 (310) | 6 (219) | 0.39 |
| Receiving comfort measures, n (%) | 7 (18%) | 3 (2%) | <0.0001* |
| Free‐text code status documentation, n (%) | 18 (47%) | 58 (39%) | 0.34 |
DISCUSSION
We found that 2 out of 3 patients had at least 1 inconsistency in code status documentation, and that 1 in 5 patients had at least 1 clinically relevant code status documentation inconsistency. The majority of clinically relevant inconsistencies occurred because there was a DNR order written in some sources of code status documentation, and no orders in other documentation sources. However, there were 4 striking examples where DNR was written in some sources of code status documentation and full code was written in other documentation sources (Figure 1).
Older patients and patients receiving comfort measures were more likely to have a clinically relevant inconsistency in code status documentation. This is particularly concerning, because they are among the most vulnerable patients at highest risk for having an in‐hospital cardiac arrest.
Our study extends the findings of prior studies that identified gaps in completeness and accuracy of code status documentation and describes another important gap in the quality and consistency of code status documentation.[20] This becomes particularly important because efforts aimed at increasing documentation of patients' code status without ensuring consistency across documentation sources may still result in patients being resuscitated or not resuscitated inappropriately.
This issue of poorly integrated health records is relevant for many other aspects of patient care. For example, 1 study found significant discrepancies in patient medication allergy documentation across multiple health records.[21] This fragmentation of documentation of the same patient information in multiple health records requires attention and should be the focus of institutional quality improvement efforts.
There are several potential ways to improve the code status documentation process. First, the use of standard fields or standardized orders can increase the completeness and improve the clarity of code status documentation.[22, 23] For institutions with an electronic medical record, forcing functions may further increase code status documentation. One study found that the implementation of an electronic medical record increased code status documentation from 4% to 63%.[24] We found similarly that the site with electronic physician orders had higher rates of complete and consistent code status documentation.
A second approach is to minimize the number of different sources for code status documentation. Institutions should critically examine each place where providers could document code status and decide whether this information adds value, and create policies to restrict unnecessary duplicate documentation and ensure accurate documentation of code status in several key, centralized locations.[25] A third option would be to automatically synchronize all code status documentation sources.[25] This final approach requires a fully integrated electronic health record.
Our study has several limitations. Although we report a large number of code status documentation inconsistencies, we do not know how many of these lead to incorrect resuscitative measures, so the actual impact on patient care is unknown. Also, because we were focusing on inconsistencies among sources of code status documentation, and not on accurate documentation of a patients' code status, the patients' actual preferences were not elicited and are not known. Finally, we carried out our study in 3 AMCs with residents that rotate from 1 site to another. The transient nature of resident work may increase the likelihood of documentation inconsistencies, because trainees may be less aware of local processes. In addition, the way front‐line staff uses clinical documentation sources to determine a patient's code status may differ at other institutions. Therefore, our estimate of clinical relevance may not be generalizable to other institutions with different front‐line processes or with healthcare teams that are more stable and aware of local documentation processes.
In summary, our study uncovered significant gaps in the quality of code status documentation that span 3 different AMCs. Having multiple, poorly integrated sources for code status documentation leads to a significant number of concerning inconsistencies that create opportunities for healthcare providers to inappropriately deliver or withhold resuscitative measures that conflict with patients' expressed wishes. Institutions need to be aware of this potential documentation hazard and take steps to minimize code status documentation inconsistencies. Even though cardiac arrests occur infrequently, if healthcare teams take inappropriate action because of these code status documentation inconsistencies, the consequences can be devastating.
Disclosure
Nothing to report.
- , , , et al. Advance directives for medical care—a case for greater use. N Engl J Med. 1991;324(13):889–895.
- , , , et al; Canadian Researchers at the End of Life Network (CARENET). What matters most in end‐of‐life care: perceptions of seriously ill patients and their family memebrs. CMAJ. 2006;174(5):627–633.
- , , . Advance directives and outcomes of surrogate decision making before death. N Eng J Med. 2010;362(13):1211–1218.
- , , , et al. Associations between end‐of‐life discussions, patient mental health, medical care near death, and caregiver bereavement adjustment. JAMA. 2008;300(14):1665–1673.
- , , , . The impact of advance care planning on end of life care in elderly patients: randomized controlled trial. BMJ. 2010;340:c1345.
- , . Quality indicators for end‐of‐life care in vulnerable elders. Ann Intern Med. 2001;135(8):667–685.
- , , , . Assessing care of vulnerable elders: methods for developing quality indicators. Ann Intern Med. 2001;135:647–652.
- , , , et al. Perceptions by family members of the dying experience of older and seriously ill patients. Ann Intern Med. 1997;126(2):97–106.
- , . Cardiopulmonary resuscitation: capacity, discussion and documentation. Q J Med. 2006;99(10):683–690.
- , , , et al. Code status documentation in the outpatient electronic medical records or patients with metastatic cancer. J Gen Intern Med. 2009;25(2):150–153.
- , , , et al. Factors associated with discussion of care plans and code status at the time of hospital admission: results from the multicenter hospitalist study. J Hosp Med. 2008;3(6):437–445.
- , , , . Documentation quality of inpatient code status discussions. J Pain Symptom Manage. 2014;48(4):632–638.
- , , , . The use of life‐sustaining treatments in hospitalized persons aged 80 and older. J Am Geriatr Soc. 2002;50(5):930–934.
- The SUPPORT Principal Investigators. A controlled trial to improve care for seriously ill hospitalized patients: the Study to Understand Prognoses and Preferences for Outcomes and Risks of Treatments (SUPPORT). JAMA. 1995;274(20):1591–1598.
- , , . Some treatment‐withholding implications of no‐code orders in an academic hospital. Crit Care Med. 1984;12(10):879–881.
- . A prospective study of patients with DNR orders in a teaching hospital. Arch Intern Med. 1998;148(10):2193–2198.
- , . Compliance with do‐not‐resuscitate orders for hospitalized patient transported to radiology department. Ann Int Med. 1998;129(10):801–805.
- , . Identification of inpatient DNR status: a safety hazard begging for standardization. J Hosp Med. 2007;2(6):366–371.
- . Controlling death: the false promise of advance directives. Ann Int Med. 2007;147(1):51–57.
- , , , et al. Failure to engage hospitalized elderly patients and their families in advance care planning. JAMA Intern Med. 2013;173(9):778–787.
- , , , et al. The recording of drug sensitivities for older people living in care homes. Br J Clin Pharmacol. 2010;69(5):553–557.
- , , , , , . A comparison of methods to communicate treatment preferences in nursing facilities: traditional practices versus the physician orders for life‐sustaining treatment program. J Am Geriatr Soc. 2010;58(7):1241–1248.
- , , , et al. Evaluation of a treatment limitation policy with a specific treatment‐limiting order page. Arch Intern Med. 1994;154(4):425–432.
- , , , et al. An electronic medical record intervention increased nursing home advance directive orders and documentation. J Am Geriatr Soc. 2007;55(7):1001–1006.
- , , , et al. Honouring patient's resuscitation wishes: a multiphased effort to improve identification and documentation. BMJ Quality Safety. 2013;22(1):85–92.
© 2015 Society of Hospital Medicine
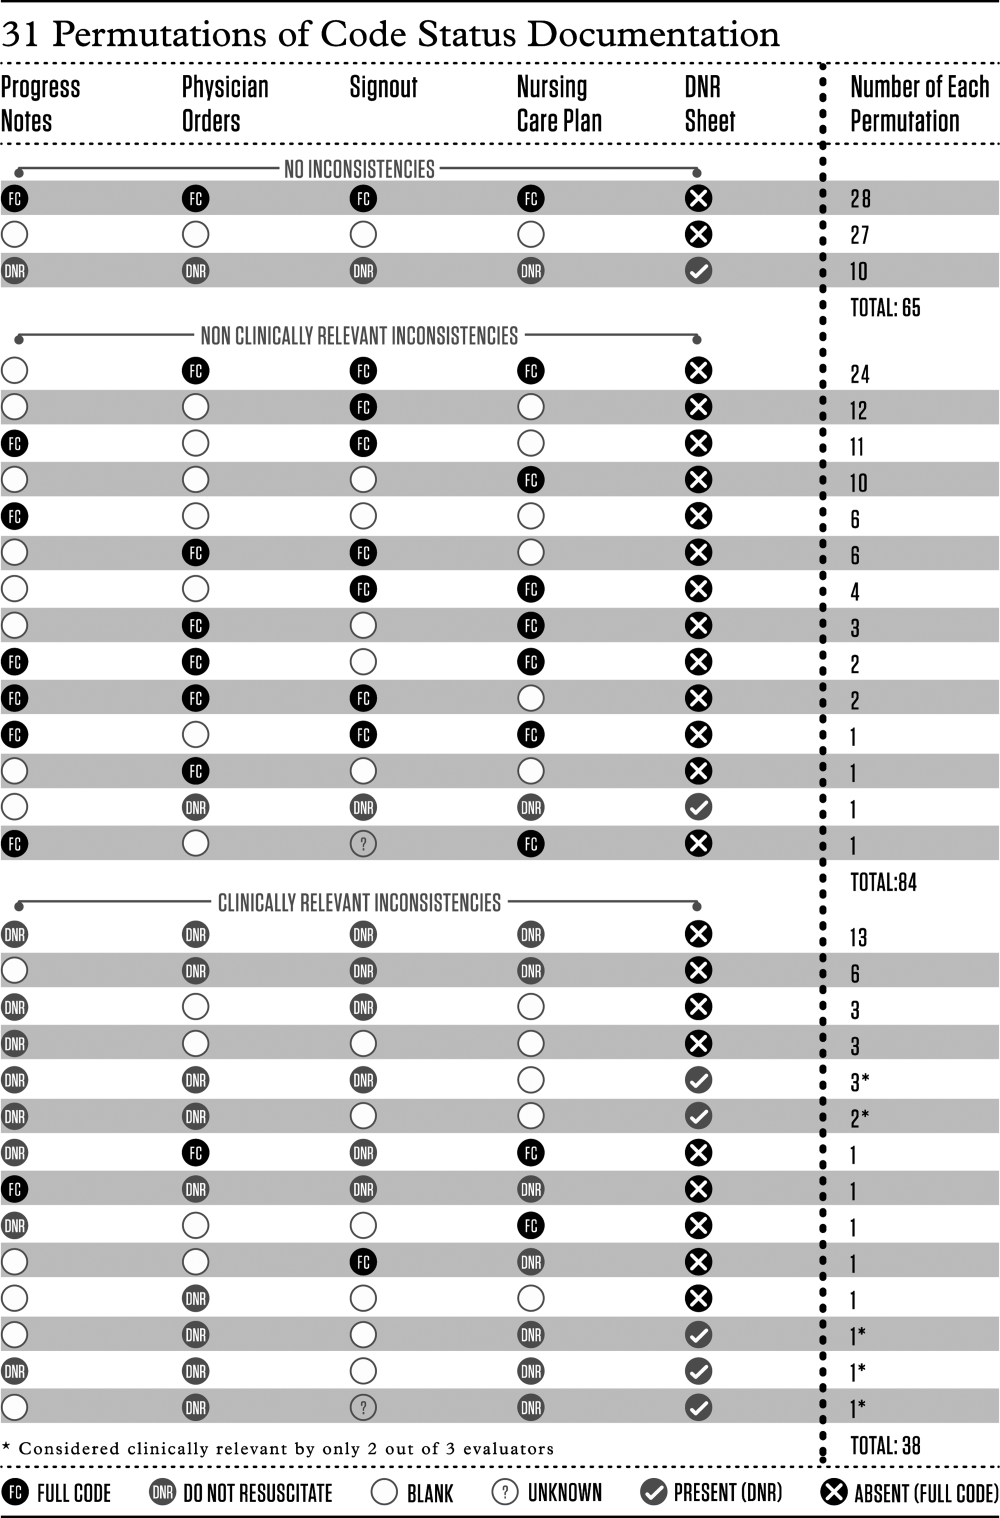
Chronic lymphocytic leukemia prognosis relatively good after transplantation failure
Unlike for those with acute leukemia, patients with chronic lymphocytic leukemia who had disease progression after undergoing transplantation had a relatively good prognosis, with 2- and 5-year overall survival rates of 67% and 38%, investigators reported online April 6 in the Journal of Clinical Oncology.*
Patients with chronic lymphocytic leukemia (CLL) who experienced acute or chronic graft-versus-host disease (GVHD) had significantly longer overall survival (OS) than those who did not have GVHD (P = .04 and P = .05, respectively). “Nearly half our patients with active CLL after transplantation had chronic GVHD, and the association of chronic GVHD with achieving cure and its power to predict OS among patients for whom transplantation failed suggests that the GVL (graft-versus-leukemia) effect contributes to prolonged survival even in patients with a high burden of disease,” wrote Dr. Uri Rozovski and associates at the University of Texas MD Anderson Cancer Center, Houston (J. Clin. Oncol. 2015 Apr. 6 [doi:10.1200/JCO.2014.58.6750]).
A matched-pair analysis showed that patients who underwent allogeneic stem cell transplant (SCT) about the same time and did not relapse also had higher rates of acute and chronic GVHD (P = .004 and P = .011, respectively).
The retrospective review of the Bone Marrow Transplantation Program database identified 358 patients with CLL or RT who underwent SCT from 1998 to 2011. The study evaluated 72 patients who had disease progression at a median 74 months after SCT, most of whom received one to eight lines of treatment after relapse and had a median OS of almost 3 years from the time of progression. Multivariate analysis showed that low hemoglobin levels and the presence of Richter’s transformation (RT) were associated with shorter OS; chronic GVHD and response to the first post-SCT treatment predicted longer OS.
Patients with RT had a worse prognosis, with a median OS of 15 months (95% confidence interval, 2-28 months) and 2- and 5-year survival rates of 36% and 0%. Transplantation carried a significant risk for transformation: 16 (30%) patients with CLL developed RT after allogeneic SCT. Conversely, four patients with RT developed CLL after transplantation.
The authors note that even in patients who did not maintain a durable response, SCT was beneficial. The study cohort received a variety of salvage treatments, and patients who received ibrutinib responded well. “Because of the favorable outcomes with ibrutinib in relapsed/refractory CLL, we believe that ibrutinib might have a role in the treatment of disease progression following transplantation failure,” they wrote.
*Correction, 4/8/2015: A previous version of this article misstated the type of leukemia referenced in the study.
FROM JOURNAL OF CLINICAL ONCOLOGY
Key clinical point: The prognosis for patients with chronic lymphocytic* leukemia who have undergone failed stem cell transplantation (SCT) is relatively good.
Major finding: From the time of progression after SCT, median OS was 36 months (95% CI, 24-48) for patients with CLL, and 38% survived 5 or more years.
Data source: The retrospective database review identified 72 patients with CLL or Richter’s transformation who underwent allogenic SCT from 1998 to 2011 and progressed after transplantation.
Disclosures: Dr. Rozovski reported having no disclosures. Two of the coauthors reported ties to several industry sources.
Avoid voriconazole in transplant patients at risk for skin cancer
SAN FRANCISCO – Voriconazole increased the risk of squamous cell carcinoma by 73% in a review of 455 lung transplant patients at the University of California, San Francisco.
The increase was for any exposure to the drug after transplant (adjusted hazard ratio, 1.73; P = .03). The investigators also found that each additional 30-day exposure at 200 mg of voriconazole twice daily increased the risk of squamous cell carcinoma (SCC) by 3.0% (HR, 1.03; P < .001). The results were adjusted for age at transplant, sex, and race. Overall, SCC risk was highest among white men aged 50 years or older at the time of transplant.

Although voriconazole did protect against posttransplant Aspergillus colonization (aHR, 0.50; P < .001), it did not reduce the risk of invasive aspergillosis. The drug reduced all-cause mortality only among colonized subjects (aHR, 0.34; P = .03), and offered no mortality benefit among those who were not colonized.
There was no difference in all-cause mortality between patients who had any exposure to voriconazole and those who did not, “but we actually found a 2% increased risk of death for each 1 month on the medication. Patients who weren’t colonized were the ones contributing to this increased risk of death,” said lead investigator Matthew Mansh, now a medical student at Stanford (Calif.) University.
There was no increased risk of SCC with alternative antifungals, including inhaled amphotericin and posaconazole. These alternatives should be considered instead of voriconazole in people at higher risk for skin cancer after lung transplants, according to the study, Mr. Mansh noted.
Voriconazole, which is widely used for antifungal prophylaxis after solid organ transplants, has been linked to skin cancer. The reason for the carcinogenic effect is not known; researchers are working to unravel the molecular mechanisms.
“Physicians should be cautious when using voriconazole in the care of transplant recipients. If you see a patient who is developing phototoxicity” with voriconazole, “and if they don’t have evidence of Aspergillus colonization, you may want to limit exposure to high doses of this drug or suggest an alternative,” Mr. Mansh said.
“We have now demonstrated that the alternatives “don’t carry this increased risk of cutaneous SCC,” Mr. Mansh said at the American Academy of Dermatology annual meeting.
The mean age of the study patients at transplant was 52 years, and the majority of patients were white; slightly more than half were men. Most had bilateral lung transplants, with pulmonary fibrosis at the leading indication.
Voriconazole was used in 85% of the patients for an average of 10 months. A quarter of voriconazole patients developed SCC within 5 years of transplant, and 43% within 10 years. Among patients who did not receive the drug, 15% developed SCC within 5 years of transplant, and 28% developed SCC within 10 years of transplant.
“The benefit of voriconazole in terms of death was limited to patients with evidence of Aspergillus colonization, and it wasn’t dose dependent. Patients who had a higher cumulative exposure did not get more benefit,” Mr. Mansh said.
Mr. Mansh had no relevant disclosures.

|
Dr. Paul T. Nghiem |
This is a carefully done study with a practical message: voriconazole patients are at a prolonged increased risk for squamous cell carcinoma. If patients develop phototoxicity or are fair-skinned, have sun damage, a history of squamous cell carcinoma or other risk factors, I think it’s highly appropriate to suggest an alternative. The alternatives are not at all associated with phototoxicity or squamous cell carcinoma.
Dr. Paul T. Nghiem moderated the late-breaker presentation in which the study was presented and is a professor of dermatology at the University of Washington, Seattle. Dr. Nghiem had no disclosures related to the study.
|
|
Dr. Paul T. Nghiem |
This is a carefully done study with a practical message: voriconazole patients are at a prolonged increased risk for squamous cell carcinoma. If patients develop phototoxicity or are fair-skinned, have sun damage, a history of squamous cell carcinoma or other risk factors, I think it’s highly appropriate to suggest an alternative. The alternatives are not at all associated with phototoxicity or squamous cell carcinoma.
Dr. Paul T. Nghiem moderated the late-breaker presentation in which the study was presented and is a professor of dermatology at the University of Washington, Seattle. Dr. Nghiem had no disclosures related to the study.
SAN FRANCISCO – Voriconazole increased the risk of squamous cell carcinoma by 73% in a review of 455 lung transplant patients at the University of California, San Francisco.
The increase was for any exposure to the drug after transplant (adjusted hazard ratio, 1.73; P = .03). The investigators also found that each additional 30-day exposure at 200 mg of voriconazole twice daily increased the risk of squamous cell carcinoma (SCC) by 3.0% (HR, 1.03; P < .001). The results were adjusted for age at transplant, sex, and race. Overall, SCC risk was highest among white men aged 50 years or older at the time of transplant.
Although voriconazole did protect against posttransplant Aspergillus colonization (aHR, 0.50; P < .001), it did not reduce the risk of invasive aspergillosis. The drug reduced all-cause mortality only among colonized subjects (aHR, 0.34; P = .03), and offered no mortality benefit among those who were not colonized.
There was no difference in all-cause mortality between patients who had any exposure to voriconazole and those who did not, “but we actually found a 2% increased risk of death for each 1 month on the medication. Patients who weren’t colonized were the ones contributing to this increased risk of death,” said lead investigator Matthew Mansh, now a medical student at Stanford (Calif.) University.
There was no increased risk of SCC with alternative antifungals, including inhaled amphotericin and posaconazole. These alternatives should be considered instead of voriconazole in people at higher risk for skin cancer after lung transplants, according to the study, Mr. Mansh noted.
Voriconazole, which is widely used for antifungal prophylaxis after solid organ transplants, has been linked to skin cancer. The reason for the carcinogenic effect is not known; researchers are working to unravel the molecular mechanisms.
“Physicians should be cautious when using voriconazole in the care of transplant recipients. If you see a patient who is developing phototoxicity” with voriconazole, “and if they don’t have evidence of Aspergillus colonization, you may want to limit exposure to high doses of this drug or suggest an alternative,” Mr. Mansh said.
“We have now demonstrated that the alternatives “don’t carry this increased risk of cutaneous SCC,” Mr. Mansh said at the American Academy of Dermatology annual meeting.
The mean age of the study patients at transplant was 52 years, and the majority of patients were white; slightly more than half were men. Most had bilateral lung transplants, with pulmonary fibrosis at the leading indication.
Voriconazole was used in 85% of the patients for an average of 10 months. A quarter of voriconazole patients developed SCC within 5 years of transplant, and 43% within 10 years. Among patients who did not receive the drug, 15% developed SCC within 5 years of transplant, and 28% developed SCC within 10 years of transplant.
“The benefit of voriconazole in terms of death was limited to patients with evidence of Aspergillus colonization, and it wasn’t dose dependent. Patients who had a higher cumulative exposure did not get more benefit,” Mr. Mansh said.
Mr. Mansh had no relevant disclosures.
AT AAD 2015
Key clinical point: Use an alternative antifungal after lung transplant in white men aged 50 years and older.
Major finding: Exposure to voriconazole increased the risk of squamous cell carcinoma by 73% after lung transplant (aHR, 1.73; P = .03); each additional 30‐day exposure at 200 mg twice daily increased the risk by 3.0% (HR 1.03; P < .001).
Data source: Retrospective cohort study of 455 lung transplant patients
Disclosures: The lead investigator had no relevant disclosures.