User login
The importance of UA in diagnosing UTIs in infants under 2 months
A 28-day-old uncircumcised male infant presents to the emergency department with fever of 38.9° C, decreased feeding, and irritability. The physical examination is normal with the exception of the irritability and your assessment of mild dehydration. The infant undergoes a sepsis work-up. The CBC is remarkable for a WBC of 16,500/mm3 with 44% neutrophils, 52% lymphocytes, and 4% monocytes. Platelet count is normal. Cerebrospinal fluid (CSF) shows no white or red blood cells with normal glucose and protein. The urinalysis (UA) has a positive 1+ leukocyte esterase (LE) with 10 WBC per high-power field (HPF), but negative nitrite and 1+ bacteria microscopically. The child is admitted to the hospital for empiric antibiotics pending blood, urine, and CSF cultures. What are the chances that a urinary tract infection (UTI) is the origin of the febrile presentation?

UTIs are currently the most common serious bacterial infection (SBI) in < 2-year-old febrile children without an apparent source of fever (Pediatrics 2011;128:595-610). Since 2000, the prevalence of UTIs in all febrile infants and young children without an apparent source is unchanged, being approximately 5%. The rate of UTIs in fever-without-apparent-source presentations at < 90 days of age is higher, ranging from 6%-15% in different studies.
Meanwhile bacteremia, sepsis, meningitis, and other previously common SBIs, mostly caused by Haemophilus influenzae type b (Hib) or pneumococcus, have decreased. We recognize these reductions as effects of universal implementation of Hib (mid-1990s) and pneumococcal (2000 and 2010) conjugate vaccines.
Given the case above, other pertinent facts are that uncircumcised males have more UTIs in the first months of life (J. Pediatr. 1996;128:23-7) and approximately 5% of young infants with UTIs also are concurrently bacteremic (Pediatrics 1999;104:79-86;J. Pediatr. 1994;124:513-9)
The elephant in the room is the fact that we also need to be cognizant of asymptomatic bacteriuria (AB). AB is colonization of the lower urinary tract without infection. Patients with AB may meet culture criteria for UTI (whether we consider > 50,000 or > 100,000 colony-forming units/mL), but there is no evidence of true infection, that is no inflammation or mucosal injury. So children with AB are not at risk for renal injury or later renal damage and do not require antibiotic treatment.
But when AB patients develop fever, for example with an enterovirus infection, their urine cultures (together with the fever) can do a good imitation of a UTI, unless we focus on the UA results. It not only remains critical to detect true UTIs in infants < 90 days old, such as the one in our case above, but also to distinguish UTI from AB.
The 1999 American Academy of Pediatrics’ UTI guidelines (Pediatrics 1999;103:843-52) included UA results as suggestive of UTI. They stated that a positive LE or nitrite test or > 5 WBC/HPF in a spun urine, or bacteria visualized in unspun gram-stained specimen suggest, but cannot be diagnostic of a UTI. Recommendation five in the guidelines states that UTI diagnosis required 100,000 CFU/mL in culture of sterilely obtained catheterized urine as the threshold criterion (strength of evidence: strong). However, AB was not fully considered because, in part, data defining AB was incomplete in 1999.
The 1999 guidelines also stated, “The urinalysis … can be valuable in selecting individuals for prompt initiation of treatment while waiting for the results of the urine culture.” So, UA was considered adjunctive. UA’s main function was to allow empiric therapy of sufficiently ill children, given positive results for LE, nitrites, or microscopic visualization of > 5 WBC/HPF or bacteria in the spun urine.
In the 2011 AAP guidelines for UTI, things have changed (Pediatrics 2011;128:595-610). The third action statement tells us that both the UA and culture taken together are necessary for UTI diagnosis. To paraphrase: The diagnosis of UTI requires urinalysis results suggesting infection (pyuria or microscopic bacteriuria) plus > 50,000 CFU/mL of a uropathogen in urine from catheterization or suprapubic aspiration. But remember that these guidelines do not apply specifically to the youngest of infants, that is < 2 months old.
Both of these criteria were changes from the 1999 UTI guidelines. Previously pyuria or microscopic bacteriuria were not considered necessary to diagnose UTI, and >100,000 CFU/mL rather than > 50,000 CFU/mL of a single pathogen species was the critical diagnostic result for catheterized urine. For suprapubic aspiration urine samples, > 10,000 CFU/HPF were considered adequate for UTI diagnoses in 1999.
Now, a recent study of children < 90 days of age (including those < 2 months of age) reports that pyuria (> 3 WBC/HPF) plus > 50,000 CFU/mL are the keys to diagnosing UTI (Pediatrics 2015;135:965-71). One caveat is that the study population was febrile infants < 90 days old with concurrent bacteremia (bacteremic UTI). Bacteremic UTI was studied to reduce as much as possible the chance that AB patients might be inadvertently included in the study. One other conclusion of this new study is that microscopic bacteriuria did not add significantly to the either sensitivity or specificity.
These data in an overall younger population than that covered by the 2011 guidelines adds evidence that pyuria (but not microscopic bacteriuria) is critical to diagnosing UTI. Pyuria plus positive culture has been a combination for the pediatric infectious diseases practitioner’s toolkit for decades. Likewise, it seems to me that primary care pediatric clinicians also often decide whether to undertake the expense of culture based on UA results. For example, a completely normal UA may obviate need for culture except in selected unusual cases.
Requiring UA evidence of inflammation to diagnose UTI (per the 2011 guidelines and the recommendations of the authors of the recent 2015 study) makes sense because most UTIs in otherwise healthy children are caused by gram-negative organisms (> 90% from Escherichia coli) (J. Pediatr. 1994;124:513-9). Why are UA results so important?
A positive nitrite test strongly suggests UTI because nitrites in the urine indicate viable gram-negative organisms also are present in the urine. Nitrates in the urine are converted to nitrites by metabolic activity of gram-negative pathogens. For WBCs or LE in the urine, their presence indicates inflammation in the urinary tract, Consider that lipopolysaccharide (LPS), also known as gram-negative endotoxin, is a major component of the cell membrane of > 90% of uropathogens like E. coli. Moreover, LPS elicits about the strongest innate immune response via toll-like receptor 4 (TLR4) from monocytes/macrophages, inducing a large pro-inflammatory and chemotactic response – interleukin-6, interleukin-8, tetrahydrofuran-alpha. Remember that LPS is also a major cause of fever and of shock during gram-negative sepsis.
So a UTI diagnosis based on a “positive” culture without evidence of metabolic products of gram negatives (nitrites) or without inflammation (no pyuria or negative LE) should be questioned. The combination of > 50,000 CFU/mL with no detectable LE or < 3-5 WBC/HPF in a febrile child is most likely evidence for AB in a child with the fever caused by some non-UTI process.
In contrast, selected SBIs may occur when the culture is “positive” without inflammation or nitrites. The first of three examples is a renal parenchymal abscess, where bacteria enter the urine sporadically in only small numbers, and do not actually infect the urinary tract mucosa. The scenario of no inflammation but “positive” culture also may occur when a large bacteremic load causes results in organisms filtering through the kidney into the urine, again without urinary mucosal infection, such as Staphylococcus aureus, group A streptococcus, or group B streptococcus bacteremia/sepsis. The third scenario with a “positive” culture and no pyuria can be with organisms that have blunted abilities to induce inflammation, such as enterococcus. Enterococcal cell components have weak inflammatory and chemotactic capability. So a urinary mucosal infection in the collecting system or bladder may occur without much if any pyuria. In fact, the patients from the recent study with insufficient evidence of pyuria/inflammation were those who had either gram-positive organisms or considerably less than 50,000 CFU/mL of gram-negative organisms.
The sensitivity and specificity of the LE or pyuria was higher in the recent study (Pediatrics 2015;135:965-71) than any prior study. The authors comment that they had not expected such a high sensitivity of 97.6% (94.5-99.2) for LE in confirmed bacteremic UTI, nor did they expect the high specificity of 93.9% (87.9-97.5). The presence of microscopic pyuria defined as > 3 WBC/HPF was nearly as sensitive, 96%, and specific, 91.3%. Disappointingly, positive nitrite testing was only 39.5% sensitive, but it was 100% specific. This likely reflects the short time that urine resides in the bladder of infants < 90 days of age, so there is insufficient time for the pathogens to metabolically convert the nitrates to nitrites.
So how would the UA help with our example case? There is microscopic bacteriuria, pyuria, and positive LE, but negative nitrites. Using the suggestions of the authors of the recent report (Pediatrics 2015;135:965-71) and those of another report on the utility of UA results (Acta Paediatr. 2010;99:581-4), the UA in our case indicates that we should be highly suspicious of a UTI in this child < 2 months old for whom the 2011 guidelines do not directly apply. But remember that these impressive sensitivity and specificity values relate to bacteremic UTI. Whether they apply to nonbacteremic UTI is not known. Likewise, the authors caution that their study design did not allow calculation of positive or negative predictive values – aspects that would clarify things even further.
So we still cannot be more than highly suspicious. Without a positive predictive value, we do not know the odds of this case having a UTI with mathematical precision. The authors do point out that only one of their subjects had a completely normal UA and actually had a bacteremic UTI. If you guessed that it was a gram-positive pathogen, you win the prize. So it seems reasonable to predict that a normal UA has a high specificity for not being a UTI (87.8%), but a positive UA remains only highly suggestive. It is still not clear if a negative UA statistically justifies not submitting the culture of the sterilely obtained urine because we still don’t have a negative predictive value.
Bottom line: The 2011 UTI guidelines provide good advice on diagnosing UTIs.
1. We have more data that evidence of inflammation is essential for diagnosing gram-negative UTIs.
2. We also have more evidence that 50,000 CFU/mL is a good threshold for diagnosing UTIs.
3. It appears that microscopic bacteriuria did not add significantly to the either sensitivity or specificity.
4. And we now have more evidence that these criteria also apply to infants < 2 months of age.
To close the loop on our case, the child’s CSF and blood cultures were negative, but the urine culture revealed > 100,000 CFU/mL of E. coli susceptible to second- and third-generation cephalosporins, ciprofloxacin, and nitrofurantoin, but resistant to trimethoprim-sulfamethoxazole.
Have a great summer and watch for UTIs in your young patients < 90 days old and fever without apparent focus.
Dr. Harrison is professor of pediatrics and pediatric infectious diseases at Children’s Mercy Hospitals and Clinics, Kansas City, Mo. He said he had no relevant financial disclosures. E-mail Dr. Harrison at [email protected].
A 28-day-old uncircumcised male infant presents to the emergency department with fever of 38.9° C, decreased feeding, and irritability. The physical examination is normal with the exception of the irritability and your assessment of mild dehydration. The infant undergoes a sepsis work-up. The CBC is remarkable for a WBC of 16,500/mm3 with 44% neutrophils, 52% lymphocytes, and 4% monocytes. Platelet count is normal. Cerebrospinal fluid (CSF) shows no white or red blood cells with normal glucose and protein. The urinalysis (UA) has a positive 1+ leukocyte esterase (LE) with 10 WBC per high-power field (HPF), but negative nitrite and 1+ bacteria microscopically. The child is admitted to the hospital for empiric antibiotics pending blood, urine, and CSF cultures. What are the chances that a urinary tract infection (UTI) is the origin of the febrile presentation?
UTIs are currently the most common serious bacterial infection (SBI) in < 2-year-old febrile children without an apparent source of fever (Pediatrics 2011;128:595-610). Since 2000, the prevalence of UTIs in all febrile infants and young children without an apparent source is unchanged, being approximately 5%. The rate of UTIs in fever-without-apparent-source presentations at < 90 days of age is higher, ranging from 6%-15% in different studies.
Meanwhile bacteremia, sepsis, meningitis, and other previously common SBIs, mostly caused by Haemophilus influenzae type b (Hib) or pneumococcus, have decreased. We recognize these reductions as effects of universal implementation of Hib (mid-1990s) and pneumococcal (2000 and 2010) conjugate vaccines.
Given the case above, other pertinent facts are that uncircumcised males have more UTIs in the first months of life (J. Pediatr. 1996;128:23-7) and approximately 5% of young infants with UTIs also are concurrently bacteremic (Pediatrics 1999;104:79-86;J. Pediatr. 1994;124:513-9)
The elephant in the room is the fact that we also need to be cognizant of asymptomatic bacteriuria (AB). AB is colonization of the lower urinary tract without infection. Patients with AB may meet culture criteria for UTI (whether we consider > 50,000 or > 100,000 colony-forming units/mL), but there is no evidence of true infection, that is no inflammation or mucosal injury. So children with AB are not at risk for renal injury or later renal damage and do not require antibiotic treatment.
But when AB patients develop fever, for example with an enterovirus infection, their urine cultures (together with the fever) can do a good imitation of a UTI, unless we focus on the UA results. It not only remains critical to detect true UTIs in infants < 90 days old, such as the one in our case above, but also to distinguish UTI from AB.
The 1999 American Academy of Pediatrics’ UTI guidelines (Pediatrics 1999;103:843-52) included UA results as suggestive of UTI. They stated that a positive LE or nitrite test or > 5 WBC/HPF in a spun urine, or bacteria visualized in unspun gram-stained specimen suggest, but cannot be diagnostic of a UTI. Recommendation five in the guidelines states that UTI diagnosis required 100,000 CFU/mL in culture of sterilely obtained catheterized urine as the threshold criterion (strength of evidence: strong). However, AB was not fully considered because, in part, data defining AB was incomplete in 1999.
The 1999 guidelines also stated, “The urinalysis … can be valuable in selecting individuals for prompt initiation of treatment while waiting for the results of the urine culture.” So, UA was considered adjunctive. UA’s main function was to allow empiric therapy of sufficiently ill children, given positive results for LE, nitrites, or microscopic visualization of > 5 WBC/HPF or bacteria in the spun urine.
In the 2011 AAP guidelines for UTI, things have changed (Pediatrics 2011;128:595-610). The third action statement tells us that both the UA and culture taken together are necessary for UTI diagnosis. To paraphrase: The diagnosis of UTI requires urinalysis results suggesting infection (pyuria or microscopic bacteriuria) plus > 50,000 CFU/mL of a uropathogen in urine from catheterization or suprapubic aspiration. But remember that these guidelines do not apply specifically to the youngest of infants, that is < 2 months old.
Both of these criteria were changes from the 1999 UTI guidelines. Previously pyuria or microscopic bacteriuria were not considered necessary to diagnose UTI, and >100,000 CFU/mL rather than > 50,000 CFU/mL of a single pathogen species was the critical diagnostic result for catheterized urine. For suprapubic aspiration urine samples, > 10,000 CFU/HPF were considered adequate for UTI diagnoses in 1999.
Now, a recent study of children < 90 days of age (including those < 2 months of age) reports that pyuria (> 3 WBC/HPF) plus > 50,000 CFU/mL are the keys to diagnosing UTI (Pediatrics 2015;135:965-71). One caveat is that the study population was febrile infants < 90 days old with concurrent bacteremia (bacteremic UTI). Bacteremic UTI was studied to reduce as much as possible the chance that AB patients might be inadvertently included in the study. One other conclusion of this new study is that microscopic bacteriuria did not add significantly to the either sensitivity or specificity.
These data in an overall younger population than that covered by the 2011 guidelines adds evidence that pyuria (but not microscopic bacteriuria) is critical to diagnosing UTI. Pyuria plus positive culture has been a combination for the pediatric infectious diseases practitioner’s toolkit for decades. Likewise, it seems to me that primary care pediatric clinicians also often decide whether to undertake the expense of culture based on UA results. For example, a completely normal UA may obviate need for culture except in selected unusual cases.
Requiring UA evidence of inflammation to diagnose UTI (per the 2011 guidelines and the recommendations of the authors of the recent 2015 study) makes sense because most UTIs in otherwise healthy children are caused by gram-negative organisms (> 90% from Escherichia coli) (J. Pediatr. 1994;124:513-9). Why are UA results so important?
A positive nitrite test strongly suggests UTI because nitrites in the urine indicate viable gram-negative organisms also are present in the urine. Nitrates in the urine are converted to nitrites by metabolic activity of gram-negative pathogens. For WBCs or LE in the urine, their presence indicates inflammation in the urinary tract, Consider that lipopolysaccharide (LPS), also known as gram-negative endotoxin, is a major component of the cell membrane of > 90% of uropathogens like E. coli. Moreover, LPS elicits about the strongest innate immune response via toll-like receptor 4 (TLR4) from monocytes/macrophages, inducing a large pro-inflammatory and chemotactic response – interleukin-6, interleukin-8, tetrahydrofuran-alpha. Remember that LPS is also a major cause of fever and of shock during gram-negative sepsis.
So a UTI diagnosis based on a “positive” culture without evidence of metabolic products of gram negatives (nitrites) or without inflammation (no pyuria or negative LE) should be questioned. The combination of > 50,000 CFU/mL with no detectable LE or < 3-5 WBC/HPF in a febrile child is most likely evidence for AB in a child with the fever caused by some non-UTI process.
In contrast, selected SBIs may occur when the culture is “positive” without inflammation or nitrites. The first of three examples is a renal parenchymal abscess, where bacteria enter the urine sporadically in only small numbers, and do not actually infect the urinary tract mucosa. The scenario of no inflammation but “positive” culture also may occur when a large bacteremic load causes results in organisms filtering through the kidney into the urine, again without urinary mucosal infection, such as Staphylococcus aureus, group A streptococcus, or group B streptococcus bacteremia/sepsis. The third scenario with a “positive” culture and no pyuria can be with organisms that have blunted abilities to induce inflammation, such as enterococcus. Enterococcal cell components have weak inflammatory and chemotactic capability. So a urinary mucosal infection in the collecting system or bladder may occur without much if any pyuria. In fact, the patients from the recent study with insufficient evidence of pyuria/inflammation were those who had either gram-positive organisms or considerably less than 50,000 CFU/mL of gram-negative organisms.
The sensitivity and specificity of the LE or pyuria was higher in the recent study (Pediatrics 2015;135:965-71) than any prior study. The authors comment that they had not expected such a high sensitivity of 97.6% (94.5-99.2) for LE in confirmed bacteremic UTI, nor did they expect the high specificity of 93.9% (87.9-97.5). The presence of microscopic pyuria defined as > 3 WBC/HPF was nearly as sensitive, 96%, and specific, 91.3%. Disappointingly, positive nitrite testing was only 39.5% sensitive, but it was 100% specific. This likely reflects the short time that urine resides in the bladder of infants < 90 days of age, so there is insufficient time for the pathogens to metabolically convert the nitrates to nitrites.
So how would the UA help with our example case? There is microscopic bacteriuria, pyuria, and positive LE, but negative nitrites. Using the suggestions of the authors of the recent report (Pediatrics 2015;135:965-71) and those of another report on the utility of UA results (Acta Paediatr. 2010;99:581-4), the UA in our case indicates that we should be highly suspicious of a UTI in this child < 2 months old for whom the 2011 guidelines do not directly apply. But remember that these impressive sensitivity and specificity values relate to bacteremic UTI. Whether they apply to nonbacteremic UTI is not known. Likewise, the authors caution that their study design did not allow calculation of positive or negative predictive values – aspects that would clarify things even further.
So we still cannot be more than highly suspicious. Without a positive predictive value, we do not know the odds of this case having a UTI with mathematical precision. The authors do point out that only one of their subjects had a completely normal UA and actually had a bacteremic UTI. If you guessed that it was a gram-positive pathogen, you win the prize. So it seems reasonable to predict that a normal UA has a high specificity for not being a UTI (87.8%), but a positive UA remains only highly suggestive. It is still not clear if a negative UA statistically justifies not submitting the culture of the sterilely obtained urine because we still don’t have a negative predictive value.
Bottom line: The 2011 UTI guidelines provide good advice on diagnosing UTIs.
1. We have more data that evidence of inflammation is essential for diagnosing gram-negative UTIs.
2. We also have more evidence that 50,000 CFU/mL is a good threshold for diagnosing UTIs.
3. It appears that microscopic bacteriuria did not add significantly to the either sensitivity or specificity.
4. And we now have more evidence that these criteria also apply to infants < 2 months of age.
To close the loop on our case, the child’s CSF and blood cultures were negative, but the urine culture revealed > 100,000 CFU/mL of E. coli susceptible to second- and third-generation cephalosporins, ciprofloxacin, and nitrofurantoin, but resistant to trimethoprim-sulfamethoxazole.
Have a great summer and watch for UTIs in your young patients < 90 days old and fever without apparent focus.
Dr. Harrison is professor of pediatrics and pediatric infectious diseases at Children’s Mercy Hospitals and Clinics, Kansas City, Mo. He said he had no relevant financial disclosures. E-mail Dr. Harrison at [email protected].

Hospitalists Can Lead Health Information Technology Field
Clinical informatics has been growing significantly in this age of precision medicine, healthcare reform, and population health. Over the last decade, there have been great efforts focused on implementation and integration of electronic health records (EHRs). With the explosive use of mobile technologies, doctors can engage, educate, and empower their patients in ways that have never before been possible. An interconnected digital healthcare data network is slowly but steadily taking shape. We will eventually reach a new era in which clinicians can harness the power of information technology (IT) to receive, report, and analyze healthcare data in order to predict and prevent adverse health outcomes for individuals and populations.
However, there is still much left to be done—the current state of EHRs is not delivering its full potential. In fact, many providers would argue that EHRs have taken us steps backward in our quest to achieve higher efficiency, safety, and quality. As members of the Society of Hospital Medicine (SHM) IT Committee, we have heard the frustration of hospitalists at each of our IT interest group meetings and other forums. This frustration does not come from resistance to adopt or accept technology, but arises from the gap between where we currently are with health IT and where each of us knows we could and should be. For us to attain the full potential of health IT, providers with a clinical perspective must engage and lead in this area. We believe hospitalists are uniquely qualified and positioned to provide such leadership.
Understanding the great demand for specialized physician informatics experts, the American Board of Medical Specialties (ABMS) approved clinical informatics as a board-eligible subspecialty in 2011, and the first board exam was offered in October 2013. The board certification recognizes both the vital role of practicing informatics in healthcare and the sophisticated knowledge and skills it requires. Appropriately, the exam assesses not only knowledge of informatics, but also quality, safety, leadership, and change management. There is a narrow window of opportunity for hospitalists who are currently involved in health IT to become certified in clinical informatics during a grandfather period. Physicians can grandfather into board eligibility via the “practice pathway” through 2017 if they have been working in informatics professionally for at least 25% of their time during any three of the previous five years. Starting in 2018, only graduates of two-year Accreditation Council for Graduate Medical Education (ACGME)-accredited fellowships will be board eligible.
Hospitalists, given their broad understanding of hospital operations, their firsthand end-user experience of EHRs, the high percentage that come from the tech-savvy generation, and their flexible working schedule, are well-positioned to become physician leaders in this field. Recognizing the high value of these skills in hospitalists, the SHM IT Committee has made encouraging SHM members to become board certified in clinical informatics one of its priorities. In fact, we believe that hospital medicine could have more clinical informatics board-certified physicians than any other specialty. If you have been contributing to health IT projects over the last few years, you may already be qualified to sit for the board exam of clinical informatics.
Currently, there are fewer than 800 physicians board certified in clinical informatics, and there has been a high pass rate of about 90% for the board certification exam. We encourage every board-eligible hospitalist who has been practicing informatics to apply for the board exam. For more information, you may refer to the webpage created by the SHM IT committee and seek advice from SHM IT committee members from the HMX IT community forum.1,2 The future potential of health IT is simply beyond imagination, and hospitalists can, and should, be the major driving force.
Cheng-Kai Kao, MD, assistant professor of medicine, medical director of informatics, University of Chicago
Kendall Rogers, MD, SFHM, associate professor of medicine, chief, division of hospital medicine, University of New Mexico
References
- Society of Hospital Medicine. Are you a hospitalist frustrated with health IT? Become part of the solution. Accessed June 7, 2015.
- Society of Hospital Medicine. HMX Healthcare Information Technology community forum. Accessed June 7, 2015.
What Hospitalists Should Consider Before Becoming an Expert Witness
Editor’s note: First in a two-part series on hospitalists as expert witnesses.
Recently, you have found yourself pondering whether you want to be an expert witness for the prosecution on behalf of one of your patients or for the defense on behalf of one of your fellow colleagues. You enjoy tackling confrontational questions head on, are intellectually curious, and are articulate both orally and in writing. You like to look at complex fact patterns and simplify them, and “Law and Order” is your favorite television show. But, seriously, are you ready to be an expert witness?
The expert witness plays an essential role in determining medical negligence under the United States system of jurisprudence. Generally, expert witnesses are asked to testify regarding the standards of care relevant to the given case, identify any deviations from those standards, and render an opinion as to whether those breaches are the most likely cause of the injury. Without the expert’s explanation of the range of acceptable treatments within the standard of care and interpretation of medical facts, juries would not have the technical expertise needed to determine whether or not malpractice occurred.
This article, the first in a two-part series on hospitalists as expert witnesses, addresses the nuts and bolts of serving as an expert witness, including the role of the expert witness, time commitments, compensation, privacy or lack thereof, and the ever-present internal struggle about whether or not to choose to participate actively in our legal system.

The Role of the Expert Witness
First, let’s take a small step back, as the hospitalist’s role as an expert witness is largely dependent on how the expert witness is going to be used by the attorney. An expert witness is someone who has been qualified as an authority to assist others—namely, the attorneys, judge, and jury—in understanding complicated technical subjects that are beyond the understanding of the average lay person.
Thus, attorneys retain expert witnesses for a whole host of reasons, including:
- Evaluating their client’s claim initially to determine if the patient has a valid claim;
- Writing an expert report to be used for settlement, mediation, arbitration, or as an exhibit to a motion for summary judgment;
- Consulting with the attorney in order to form an opinion in the case, which will be used to shape the prosecution or defense, including in a response to the complaint, in discovery, or at trial (“Confidential, Non-testifying Consultant Only Expert”); or
- Testifying at a deposition and/or in court at trial (“Disclosed, Nothing the Expert Touches is Confidential, Testifying Expert”).
The first thing you need to do, therefore, is make sure your role and the scope of your area of expertise are clearly defined and that you are comfortable performing the tasks that are described in more detail below in a timely manner. As you will soon learn, testifying under oath can be a grueling experience.
Time Commitment
Is it worth the time commitment? Here, again, a lot depends on not only the expert witness’s role but also where in the course of the litigation the expert is brought on board the trial team. Is it ninety days before trial, before the lawsuit has even been filed, or somewhere in between? Have court deadlines already been issued that require the rescheduling of patient obligations?
Assuming you have been brought onboard as an expert before the complaint has been filed, you should expect to encounter the following noninclusive time constraints:
- Preparing litigation budgets and bills;
- Preparing a current curriculum vitae;
- Reviewing the entire file of paper;
- Assisting in drafting or responding to the complaint;
- Assisting in drafting and/or responding to discovery;
- Preparing an expert report;
- Preparing a rebuttal expert report;
- Preparing for your deposition;
- Attending your deposition;
- Assisting in the deposition of the other side’s expert witness;
- Assisting in preparing for trial;
- Preparing to take the stand at trial;
- Attending trial; and/or
- Assisting in identifying or responding to any post-trial appealable issues.
Although you should be compensated for each of these tasks, these tasks take away time you could be engaging in patient care.
Compensation
It should be a no brainer, but make sure you get paid. The expert witness business is built upon reputation, integrity, credibility, and expertise. Consequently, hospitalists who have developed a niche in a small area of expertise in which they can dominate a certain market, or those who have developed a national reputation, can charge a significant amount of money depending on their area of expertise. In the absence of substantial experience, expert witness rates are dependent on the location of the case, the dollar amount at stake, and the novelty of the legal disputes at issue.
You should immediately request a written agreement that states exactly who is responsible for paying your bills, when those bills will be paid, and, in addition to your hourly rate and what services that rate covers, the specific out-of-pocket expenses that will be paid, including those that are needed to cover postage, copies, travel, lodging, and any other incidentals.
Privacy, or Lack Thereof
Thanks to the Internet, unless a protective order is in place, and even that is likely to be narrowly tailored, opposing counsels can easily pull copies of all of your past deposition and trial transcripts, divorce records, past curriculum vitae, and articles you may have written in medical school or in practice. They can also use the Internet to identify who you usually testify for, whether your testimony has ever been refused by the judge, where you live, and even whether you own any property.
In essence, any and all public dirt on your private life can be extracted and used as fodder at the next trial. Are you prepared to become an overnight public figure?
The Internal Struggle
Finally, there is no question that the decision of whether to serve as an expert witness in a malpractice case is one of the most difficult, yet most important, nonpatient care decisions a physician can make. Expert testimony is essential to medical malpractice litigation, however. Many hospitalists may find themselves balancing their duty to patients who should have access to the courts and fair compensation from injuries caused by physicians who are impaired or who deviated from the standard of care against the professional and social pressure not to testify against colleagues and not to participate in a legal system that many hospitalists feel victimizes members of their profession.
The legal system, nonetheless, relies on competent medical expertise that is just and fair and relies on medical professionals to provide that expertise. Are you ready for the challenge? If you are, the second article in this two-part series will serve as a primer for your expert report, deposition, and testimony at trial.
Steven Harris is a nationally recognized healthcare attorney and a member of the law firm McDonald Hopkins LLC in Chicago. Write to him at [email protected].
Editor’s note: First in a two-part series on hospitalists as expert witnesses.
Recently, you have found yourself pondering whether you want to be an expert witness for the prosecution on behalf of one of your patients or for the defense on behalf of one of your fellow colleagues. You enjoy tackling confrontational questions head on, are intellectually curious, and are articulate both orally and in writing. You like to look at complex fact patterns and simplify them, and “Law and Order” is your favorite television show. But, seriously, are you ready to be an expert witness?
The expert witness plays an essential role in determining medical negligence under the United States system of jurisprudence. Generally, expert witnesses are asked to testify regarding the standards of care relevant to the given case, identify any deviations from those standards, and render an opinion as to whether those breaches are the most likely cause of the injury. Without the expert’s explanation of the range of acceptable treatments within the standard of care and interpretation of medical facts, juries would not have the technical expertise needed to determine whether or not malpractice occurred.
This article, the first in a two-part series on hospitalists as expert witnesses, addresses the nuts and bolts of serving as an expert witness, including the role of the expert witness, time commitments, compensation, privacy or lack thereof, and the ever-present internal struggle about whether or not to choose to participate actively in our legal system.
The Role of the Expert Witness
First, let’s take a small step back, as the hospitalist’s role as an expert witness is largely dependent on how the expert witness is going to be used by the attorney. An expert witness is someone who has been qualified as an authority to assist others—namely, the attorneys, judge, and jury—in understanding complicated technical subjects that are beyond the understanding of the average lay person.
Thus, attorneys retain expert witnesses for a whole host of reasons, including:
- Evaluating their client’s claim initially to determine if the patient has a valid claim;
- Writing an expert report to be used for settlement, mediation, arbitration, or as an exhibit to a motion for summary judgment;
- Consulting with the attorney in order to form an opinion in the case, which will be used to shape the prosecution or defense, including in a response to the complaint, in discovery, or at trial (“Confidential, Non-testifying Consultant Only Expert”); or
- Testifying at a deposition and/or in court at trial (“Disclosed, Nothing the Expert Touches is Confidential, Testifying Expert”).
The first thing you need to do, therefore, is make sure your role and the scope of your area of expertise are clearly defined and that you are comfortable performing the tasks that are described in more detail below in a timely manner. As you will soon learn, testifying under oath can be a grueling experience.
Time Commitment
Is it worth the time commitment? Here, again, a lot depends on not only the expert witness’s role but also where in the course of the litigation the expert is brought on board the trial team. Is it ninety days before trial, before the lawsuit has even been filed, or somewhere in between? Have court deadlines already been issued that require the rescheduling of patient obligations?
Assuming you have been brought onboard as an expert before the complaint has been filed, you should expect to encounter the following noninclusive time constraints:
- Preparing litigation budgets and bills;
- Preparing a current curriculum vitae;
- Reviewing the entire file of paper;
- Assisting in drafting or responding to the complaint;
- Assisting in drafting and/or responding to discovery;
- Preparing an expert report;
- Preparing a rebuttal expert report;
- Preparing for your deposition;
- Attending your deposition;
- Assisting in the deposition of the other side’s expert witness;
- Assisting in preparing for trial;
- Preparing to take the stand at trial;
- Attending trial; and/or
- Assisting in identifying or responding to any post-trial appealable issues.
Although you should be compensated for each of these tasks, these tasks take away time you could be engaging in patient care.
Compensation
It should be a no brainer, but make sure you get paid. The expert witness business is built upon reputation, integrity, credibility, and expertise. Consequently, hospitalists who have developed a niche in a small area of expertise in which they can dominate a certain market, or those who have developed a national reputation, can charge a significant amount of money depending on their area of expertise. In the absence of substantial experience, expert witness rates are dependent on the location of the case, the dollar amount at stake, and the novelty of the legal disputes at issue.
You should immediately request a written agreement that states exactly who is responsible for paying your bills, when those bills will be paid, and, in addition to your hourly rate and what services that rate covers, the specific out-of-pocket expenses that will be paid, including those that are needed to cover postage, copies, travel, lodging, and any other incidentals.
Privacy, or Lack Thereof
Thanks to the Internet, unless a protective order is in place, and even that is likely to be narrowly tailored, opposing counsels can easily pull copies of all of your past deposition and trial transcripts, divorce records, past curriculum vitae, and articles you may have written in medical school or in practice. They can also use the Internet to identify who you usually testify for, whether your testimony has ever been refused by the judge, where you live, and even whether you own any property.
In essence, any and all public dirt on your private life can be extracted and used as fodder at the next trial. Are you prepared to become an overnight public figure?
The Internal Struggle
Finally, there is no question that the decision of whether to serve as an expert witness in a malpractice case is one of the most difficult, yet most important, nonpatient care decisions a physician can make. Expert testimony is essential to medical malpractice litigation, however. Many hospitalists may find themselves balancing their duty to patients who should have access to the courts and fair compensation from injuries caused by physicians who are impaired or who deviated from the standard of care against the professional and social pressure not to testify against colleagues and not to participate in a legal system that many hospitalists feel victimizes members of their profession.
The legal system, nonetheless, relies on competent medical expertise that is just and fair and relies on medical professionals to provide that expertise. Are you ready for the challenge? If you are, the second article in this two-part series will serve as a primer for your expert report, deposition, and testimony at trial.
Steven Harris is a nationally recognized healthcare attorney and a member of the law firm McDonald Hopkins LLC in Chicago. Write to him at [email protected].
Hospitalists Back Bill to Reform Medicare Audit Process
A bill proposed in Congress to streamline the audit process of the Centers for Medicare & Medicaid Service (CMS) is being hailed by hospitalists as a needed step forward.
The Audit & Appeal Fairness, Integrity, and Reforms in Medicare (AFIRM) Act of 2015 would speed up the Recovery Audit Contractor (RAC) appeal process, shorten look-back periods, increase transparency, and allow licensed attorneys to serve as Medicare magistrates to adjudicate certain appeals. The proposed legislation, which was passed by the Senate Committee on Finance in June, is sponsored by Sen. Orrin Hatch (R-Utah) and Sen. Ron Wyden (D-Ore.).
"Although RAC audits, appeals, and hospital payment issues may seem convoluted and not a direct hospitalist issue, the flawed audit and appeals system has negative downstream effects on hospitalist practice, autonomy, and ultimately negatively impacts the patients we care for," SHM Public Policy Committee member Ann Sheehy, MD, MS, FHM, writes in an email to The Hospitalist. "We need audits in the Medicare system, but RAC reform is needed and long overdue."
Dr. Sheehy, a hospitalist at the University of Wisconsin School of Medicine and Public Health in Madison, testified in May 2014 before the House Committee on Ways and Means' Subcommittee on Health about the impact Medicare's two-midnight rule and RAC audit process have on hospitals.
Dr. Sheehy says hospitalists dealing with RAC audits of patients under observation status can wait years for appeals to be heard.
"At the heart of the observation problem is the reality that a provider's clinical judgment can be questioned by an auditor up to three years after care was delivered and payment denied," Dr. Sheehy adds.
The pending bill's bipartisan support is a hopeful sign, says hospitalist Jairy Hunter III, MD, MBA, SFHM, associate executive medical director for case management and care transitions at the Medical University of South Carolina in Charleston. Dr. Hunter, who attended SHM's Hospitalists on the Hill advocacy day last March, says efforts to streamline bureaucratic issues are an indication that politicians are starting to understand the impact of CMS' myriad rules and regulations.
"We advocated for much more sweeping improvements, but in my view, this is somewhat of a start," he says. "It means that Congress and the lawmakers are hearing what we're saying." TH
Visit our website for information on avoiding a Medicare audit.
Hospitalists Positioned to Lead Improvements in Hospital Quality, Patient Safety
Hospitalists are ideally positioned to help create new approaches to hospital quality and safety, but they must acquire the skills necessary to make sustained, systematic changes, says David W. Baker, MD, MPH, The Joint Commission's executive vice president of healthcare quality evaluation.
“Hospitalists know the system inside and out, and they have great ideas on how to improve care," Dr. Baker says. In a recent article he coauthored in JAMA, Dr. Baker describes the issue as crucial.
"We as physicians need to do a better job improving quality and safety, otherwise we're going to lose what autonomy we still have," he says. Tolerating quality and safety problems as an inevitable part of giving care will bring about increasing external forces regulating physicians, he adds.
Instead, physicians should embrace the goal of zero harm.
"It's not some overly idealistic, unattainable goal," Dr. Baker says. He points to Memorial Hermann, a health system in Houston. "Hospitals in their system are achieving zero harm on measures such as central line infections month after month."
To make such changes, hospitalists must understand modern principles of QI—including the tools of Lean Six Sigma—principles that The Joint Commission has fully adopted.
"Right now, hospitals do individual projects, but we need to think about systems of care and how we can develop interventions that are sustainable and achieve high reliability," Dr. Baker says. "For many physicians, that requires a different skill set."
Developing these systems means cutting out unnecessary steps and therefore saving money so they can achieve cost neutrality. "The critical thing is understanding the principles of change management so these things really become part of the culture of an organization," he says. "That's what hospitalists really need to learn to be able to do these projects so they’re truly sustainable." TH
Visit our website for more information on hospitalists’ role in quality improvement.
Laparoscopic management of interstitial ectopic pregnancy
Interstitial ectopic pregnancies, commonly reported as “cornual” ectopic pregnancies, are rare, accounting for only 2% to 3% of all tubal ectopic pregnancies. They can be managed medically with methotrexate or surgically via laparotomy or laparoscopy. Many variations of laparoscopic techniques have been described in the literature but no standardized surgical management has been established.
In this video, we begin by reviewing interstitial ectopic pregnancy and surgical approaches to treatment, with a focus on key surgical techniques and steps for successful laparoscopic management.
We then present the case of a 40-year-old woman (G3P1011) at 7 weeks 2 days gestation with a 5-cm left interstitial ectopic pregnancy who underwent a laparoscopic cornual resection.
We hope this video can serve as a quick reference in your practice for the surgical management of interstitial ectopic pregnancies.
Share your thoughts on this video! Send your Letter to the Editor to [email protected]. Please include your name and the city and state in which you practice.
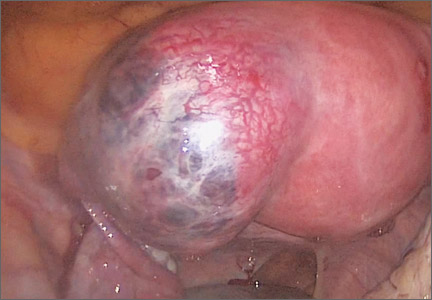
Documenting quantity of care rather than quality
Pneumonia shot? Check. Flu shot? Got it.
What do asking about these two immunizations mean in a neurology history? Absolutely nothing, for most cases.
But that doesn’t stop me and other neurologists from asking about them. Why? Because they’re part of the Physician Quality Reporting System (PQRS) measures, of course! None of us want to be penalized by Medicare for failing to document them. Along with medications (Measure 130: drug, dose, and route of administration), counseling for women of childbearing potential with epilepsy (Measure 268), tobacco status (Measure 226), and blood pressure at visit (Measure 317).

My colleagues in orthopedics tell me they’re now documenting a female patient’s most recent mammogram for the same reasons. While it’s unlikely to affect why they need a new knee, it’s what they have to do to avoid penalties.
How much time does this take? About 30-60 seconds per Medicare patient in my practice. That’s not a huge amount of time, but when you see about 1,000 Medicare visits per year, that adds up to 8-16 hours spent on extraneous documentation.
Do I do it to improve patient care? No. Checking off boxes that have no relation to the case at hand makes no difference at all. I doubt you’ll find a practicing physician who believes otherwise. It simply comes down to playing by the rules, no matter how irrelevant they are.
That’s part of the problem in health care today. In documentation, quantity has replaced quality as a measure of care. The concise, pointed, summary has been eclipsed by long notes that document a large amount of unimportant data. Attaching the PQRS data (a 2-page form in my office) to the bill I submit, and noting it in my chart, only wastes time and paper.
Obviously, documenting blood pressure, tobacco status, and medications are important ... but I’ve always done those. I don’t know any neurologist who doesn’t check those things regularly, since they can directly affect our care.
But the rest is just fluff, which, sadly, seems to be more important these days than actually doing something to help the patient, at least in the eyes of Medicare.
Dr. Block has a solo neurology practice in Scottsdale, Ariz.
Pneumonia shot? Check. Flu shot? Got it.
What do asking about these two immunizations mean in a neurology history? Absolutely nothing, for most cases.
But that doesn’t stop me and other neurologists from asking about them. Why? Because they’re part of the Physician Quality Reporting System (PQRS) measures, of course! None of us want to be penalized by Medicare for failing to document them. Along with medications (Measure 130: drug, dose, and route of administration), counseling for women of childbearing potential with epilepsy (Measure 268), tobacco status (Measure 226), and blood pressure at visit (Measure 317).
My colleagues in orthopedics tell me they’re now documenting a female patient’s most recent mammogram for the same reasons. While it’s unlikely to affect why they need a new knee, it’s what they have to do to avoid penalties.
How much time does this take? About 30-60 seconds per Medicare patient in my practice. That’s not a huge amount of time, but when you see about 1,000 Medicare visits per year, that adds up to 8-16 hours spent on extraneous documentation.
Do I do it to improve patient care? No. Checking off boxes that have no relation to the case at hand makes no difference at all. I doubt you’ll find a practicing physician who believes otherwise. It simply comes down to playing by the rules, no matter how irrelevant they are.
That’s part of the problem in health care today. In documentation, quantity has replaced quality as a measure of care. The concise, pointed, summary has been eclipsed by long notes that document a large amount of unimportant data. Attaching the PQRS data (a 2-page form in my office) to the bill I submit, and noting it in my chart, only wastes time and paper.
Obviously, documenting blood pressure, tobacco status, and medications are important ... but I’ve always done those. I don’t know any neurologist who doesn’t check those things regularly, since they can directly affect our care.
But the rest is just fluff, which, sadly, seems to be more important these days than actually doing something to help the patient, at least in the eyes of Medicare.
Dr. Block has a solo neurology practice in Scottsdale, Ariz.

ObGyn salaries continue gradual improvement
The mean income for ObGyns rose by 2% in 2014 over 2013 to $249,000, according to the 2015 Medscape Compensation Report.1 This slight rise continues a gradual increase over the past few years ($242,000 in 2012; $220,000 in 2011).1–4 The 2015 report took into account survey responses from 19,657 physicians across 26 specialties, 5% (982) of whom were ObGyns.
The highest earners among all physician specialties were orthopedists ($421,000), cardiologists, and gastroenterologists. The lowest earners were pediatricians, family physicians, endocrinologists, and internists ($196,000). The highest ObGyn earners lived in the Northwest ($289,000) and Great Lakes ($268,000) regions; the lowest earners lived in the Mid-Atlantic ($230,000) and Northeast ($235,000) areas.1
Survey findings
Career satisfaction for ObGyns is dipping
In 2011, 69%, 53%, and 48% of ObGyns indicated they would choose a career in medicine again, select the same specialty, and pick the same practice setting, respectively.4 In the 2015 survey, 67% of ObGyns reported that they would still choose medicine; however, only 40% would pick obstetrics and gynecology as their specialty, and only 22% would select the same practice setting.1
Employment over private practice: Who feels best compensated?
Overall, 63% of all physicians are now employed, with only 23% reporting to be in private practice. Employment appears to be more popular for women: 59% of men and 72% of women responded that they work for a salary. Slightly more than a third (36%) of men and about a quarter (23%) of women are self-employed.5
The gender picture. Half of all ObGyns are women, and almost half of medical school graduates are women, yet male ObGyns continue to make more money than their female counterparts.1,5,6 The 9% difference between compensation rates for self-employed male and female ObGyns ($265,000 vs $242,000, respectively) is less than the 14% difference between their employed colleagues ($266,000 vs $229,000, respectively).1 Women tend to work shorter hours, fewer weeks, and see fewer patients than men, which could account for the lower compensation rate for female ObGyns. Studies suggest that greater schedule flexibility and fewer hours are key factors that improve satisfaction rates for female physicians.5
Male and female ObGyns tend to agree on their income satisfaction: less than half are satisfied (male, 44%; female, 46%). Many more employed ObGyns (55%) than self-employed ObGyns (31%) believe that they are fairly compensated.1

Which practice settings pay better?
Compensation rates for ObGyns in 2015 are greatest for those in office-based multispecialty group practice ($280,000), followed by those who work in1:
- health care organizations ($269,000)
- office-based single-specialty group practices ($266,000)
- outpatient clinics ($223,000)
- academic settings (nonhospital), research, military, and government ($219,000).
The lowest paid practice settings are office-based solo practices ($218,000) and hospital-employed ObGyns ($209,000).
In 2013, ObGyns who earned the most worked for health care organizations ($273,000); those who earned the least worked for outpatient clinics ($207,000).1
Do you take insurance, Medicare, Medicaid?
More employed (82%) than self-employed (53%) ObGyns will continue to take new and current Medicare or Medicaid patients, which is a rise from data published in the 2014 report (employed, 72%; self-employed, 46%).1
More than half (58%) of all physicians received less than $100 from private insurers for a new-patient office visit in 2014. Among ObGyns, 26% said they would drop insurers that pay poorly; 29% replied that they would not drop an insurer because they need all payers.1
The rate of participation in Accountable Care Organizations (ACOs) has increased from 25% in 2013 to 35% in 2014, with 8% more expecting to join an ACO in 2015. Concierge practice (2%) and cash-only practice (5%) were reportedly not significant payment models for ObGyns in 2014.1
Only 26% of ObGyns are planning to participate in health insurance exchanges; 23% said they are not participating, and 51% are not sure whether they will participate. Close to half (41%) of ObGyns believe their income will decrease because of health insurance exchanges, whereas 54% do not anticipate a change in income.1
Do you offer ancillary services?
When asked, 11% of employed ObGyns and 28% of self-employed ObGyns revealed that they have offered new ancillary services within the past 3 years. These ancillary services can include mammography, bone density testing, ultrasound, in-house laboratory services, bioidentical hormone replacement therapy, and weight management.1
How much time do you spend with patients?
In 2014, 62% of ObGyns reported spending 9 to 16 minutes with a patient during a visit. This is compared to 56% of family physicians and 44% of internists (TABLE).1,5
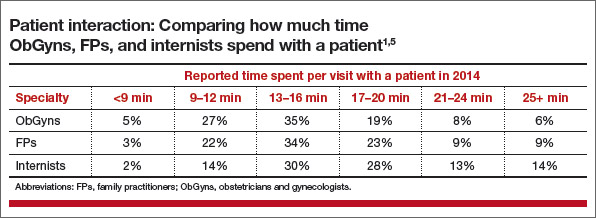
More than one-half (52%) of ObGynsspend 30 to 45 hours per week seeing patients. Fewer (38%) spend more than 45 hours per week, and 9% spend less than 30 hours per week with patients. This decline may be due to the increasing proportion of women and older physicians who tend to work shorter hours and fewer weeks.1
In the general physician population, 24% of women and 13% of men work part time, whereas 16% of both male and female ObGyns work part time. ObGyns aged 65 years or older constitute 35% of part-timers; 9% of those aged 35 to 49 years, and 11% of those aged 50 to 64 years, work part time. Only 2% of those younger than age 35 work part time.1
Would you select a career in obstetrics and gynecology all over again?
If given a second chance, would you rather choose orthopedic surgery as your specialty, or even choose medicine as a career again? OBG Management recently asked readers to weigh in, through its Quick Poll posted at obgmanagement.com, on whether or not they would choose ObGyn all over again. Ninety-one readers answered “yes” and 70 answered “no,” for a total of 161 respondents.
When this same question was posed to OBG Management’s Virtual Board of Editors (VBE), the perspectives were as split as the Quick Poll results:
- “No, no, no, I would not choose ObGyn all over again.”
- “Yes, I still love what I do.”
- “Yes, it is still the most unique specialty in medicine because it involves both surgery and primary care.”
- “Yes, for all the reasons I first loved the specialty: every week’s schedule, and every day is different. There is a mix of office care, surgery, and call.”
- “No! There is constant concern of litigation for complications, poor reimbursement, and compromised lifestyle.”
“There are much easier ways to make a living,” said one respondent, and another replied, “Work is very tough right now and the payment is too low.”
“The specialty has changed,” said Mary Vanko, MD, who practices in the suburbs of “blue collar Indiana.” “The public has very little idea of the breadth of our knowledge. The ObGyn generalist has the ability to serve as a woman’s doctor throughout her lifetime, not just perform the deliveries and surgeries. All of a sudden we are excluded from primary care status and people have to fight to see us. The newbies will never experience what it used to be as an ObGyn, the woman’s primary. Now we are the doctors to see when someone wants an IUD or is bleeding or pregnant. Big difference.”
Wesley Hambright, MD, practices in a small community hospital, but feels that “a larger hospital with more specialties may offer more flexibility and support in dealing with external pressures.” Tameka O’Neal, MD, is currently hospital employed but feels “as though I have little say in my practice.” Shaukat Ashai, MD, who is retired after 35 years in practice, says he would have preferred an academic setting on a full-time basis, citing long hours and poor compensation.
Robert del Rosario, MD, is in a large single-specialty suburban practice and would choose this practice setting again, although he would not choose a career as an ObGyn again. “The work demands have taken away too much from family,” he says. In addition, “as a male ObGyn, I am regularly faced with patients who choose their doctors based on gender rather than on skill. Our colleagues are no better. Early in my career and until the present, I hear people say, ‘Oh, I can’t hire Dr. X because we’re looking to hire a female.’”
Joe Walsh, MD, of Philadelphia, Pennsylvania, expresses similar discontent as a male ObGyn practicing in today’s female-populated specialty. In a letter to the editor in response to Editor in Chief Robert L. Barbieri, MD’s Editorial in the May 2015 issue, “Why is obstetrics and gynecology a popular choice for medical students?” Dr. Walsh states: “The unaddressed question is why is it unpopular for half of medical students? Ninety-three percent of resident graduates in the field are women, while women account for half of medical student graduates. Men rarely go into the field today. Perhaps job advertisements touting physician opportunities in ‘all female groups’ discourage men. Perhaps hospitals’ ‘Women’s Health Centers’ with such slogans as ‘Women taking care of women’ discourage men. Perhaps receptionists’ asking patients whether they prefer a male or female physician discourages male ObGyns.”
Many VBE members express some frustrations—with their practice setting, compensation, and longer work hours—but say that the patient relationships are the most rewarding aspect of their jobs. After 29 years in practice, Patrick Pevoto, MD, says the most rewarding aspect of his job is “being part of the legacy in people’s lives.”
Others say what keeps them engaged is:
- Enjoying “good outcomes.”
- “The patient contact. It’s fun having someone come up to me in the grocery store and introduce me to a teenager that I delivered 15 years ago.”
- “Surgery.”
- “Helping patients and teaching fellows.”
- “Knowing that I am making a difference in people’s lives.”
What is most rewarding?
When given several choices to select as the most rewarding aspect of their jobs, more female ObGyns (47%) than males (41%) reported that their physician-patient relationships are the major source of satisfaction. More men (10%) than women (7%) cite that making good money at a job they like is most gratifying. Only 3% of men and 2% of women reported no reward to being an ObGyn.1
Survey methodology
Medscape reports that the recruitment period for the 2015 Physician Compensation Report was from December 30, 2014, through March 11, 2015. Data were collected via a third-party online survey collection site. The margin of error for the survey was ±0.69%.1
Share your thoughts on this article! Send your Letter to the Editor to [email protected]. Please include your name and the city and state in which you practice.
1. Peckham C. Medscape OB/GYN Compensation Report 2015. Medscape Web site. http://www.medscape.com/features/slideshow/compensation/2015/womenshealth. Published April 21, 2015. Accessed May 13, 2015.
2. Peckham C. Medscape OB/GYN Compensation Report 2014. Medscape Web site. http://www.medscape.com/features/slideshow/compensation/2014/womenshealth. Published April 15, 2014. Accessed June 2, 2014.
3. Medscape News. Ob/Gyn Compensation Report 2013. Medscape Web site. http://www.medscape.com/features/slideshow/compensation/2013/womenshealth. Accessed June 30, 2013.
4. Reale D. Mean income for ObGyns increased in 2012. OBG Manag. 2013;25(8):34–36.
5. Peckham C. Medscape Physician Compensation Report 2015. Medscape Web site. http://www.medscape.com/features/slideshow/compensation/2015/public/overview. Published April 21, 2015. Accessed May 13, 2015.
6. Distribution of medical school graduates by gender. Henry Kaiser Family Foundation Web site. http://kff.org/other/state-indicator/medical-school-graduates-by-gender/. Accessed May 13, 2015.
The mean income for ObGyns rose by 2% in 2014 over 2013 to $249,000, according to the 2015 Medscape Compensation Report.1 This slight rise continues a gradual increase over the past few years ($242,000 in 2012; $220,000 in 2011).1–4 The 2015 report took into account survey responses from 19,657 physicians across 26 specialties, 5% (982) of whom were ObGyns.
The highest earners among all physician specialties were orthopedists ($421,000), cardiologists, and gastroenterologists. The lowest earners were pediatricians, family physicians, endocrinologists, and internists ($196,000). The highest ObGyn earners lived in the Northwest ($289,000) and Great Lakes ($268,000) regions; the lowest earners lived in the Mid-Atlantic ($230,000) and Northeast ($235,000) areas.1
Survey findings
Career satisfaction for ObGyns is dipping
In 2011, 69%, 53%, and 48% of ObGyns indicated they would choose a career in medicine again, select the same specialty, and pick the same practice setting, respectively.4 In the 2015 survey, 67% of ObGyns reported that they would still choose medicine; however, only 40% would pick obstetrics and gynecology as their specialty, and only 22% would select the same practice setting.1
Employment over private practice: Who feels best compensated?
Overall, 63% of all physicians are now employed, with only 23% reporting to be in private practice. Employment appears to be more popular for women: 59% of men and 72% of women responded that they work for a salary. Slightly more than a third (36%) of men and about a quarter (23%) of women are self-employed.5
The gender picture. Half of all ObGyns are women, and almost half of medical school graduates are women, yet male ObGyns continue to make more money than their female counterparts.1,5,6 The 9% difference between compensation rates for self-employed male and female ObGyns ($265,000 vs $242,000, respectively) is less than the 14% difference between their employed colleagues ($266,000 vs $229,000, respectively).1 Women tend to work shorter hours, fewer weeks, and see fewer patients than men, which could account for the lower compensation rate for female ObGyns. Studies suggest that greater schedule flexibility and fewer hours are key factors that improve satisfaction rates for female physicians.5
Male and female ObGyns tend to agree on their income satisfaction: less than half are satisfied (male, 44%; female, 46%). Many more employed ObGyns (55%) than self-employed ObGyns (31%) believe that they are fairly compensated.1
Which practice settings pay better?
Compensation rates for ObGyns in 2015 are greatest for those in office-based multispecialty group practice ($280,000), followed by those who work in1:
- health care organizations ($269,000)
- office-based single-specialty group practices ($266,000)
- outpatient clinics ($223,000)
- academic settings (nonhospital), research, military, and government ($219,000).
The lowest paid practice settings are office-based solo practices ($218,000) and hospital-employed ObGyns ($209,000).
In 2013, ObGyns who earned the most worked for health care organizations ($273,000); those who earned the least worked for outpatient clinics ($207,000).1
Do you take insurance, Medicare, Medicaid?
More employed (82%) than self-employed (53%) ObGyns will continue to take new and current Medicare or Medicaid patients, which is a rise from data published in the 2014 report (employed, 72%; self-employed, 46%).1
More than half (58%) of all physicians received less than $100 from private insurers for a new-patient office visit in 2014. Among ObGyns, 26% said they would drop insurers that pay poorly; 29% replied that they would not drop an insurer because they need all payers.1
The rate of participation in Accountable Care Organizations (ACOs) has increased from 25% in 2013 to 35% in 2014, with 8% more expecting to join an ACO in 2015. Concierge practice (2%) and cash-only practice (5%) were reportedly not significant payment models for ObGyns in 2014.1
Only 26% of ObGyns are planning to participate in health insurance exchanges; 23% said they are not participating, and 51% are not sure whether they will participate. Close to half (41%) of ObGyns believe their income will decrease because of health insurance exchanges, whereas 54% do not anticipate a change in income.1
Do you offer ancillary services?
When asked, 11% of employed ObGyns and 28% of self-employed ObGyns revealed that they have offered new ancillary services within the past 3 years. These ancillary services can include mammography, bone density testing, ultrasound, in-house laboratory services, bioidentical hormone replacement therapy, and weight management.1
How much time do you spend with patients?
In 2014, 62% of ObGyns reported spending 9 to 16 minutes with a patient during a visit. This is compared to 56% of family physicians and 44% of internists (TABLE).1,5
More than one-half (52%) of ObGynsspend 30 to 45 hours per week seeing patients. Fewer (38%) spend more than 45 hours per week, and 9% spend less than 30 hours per week with patients. This decline may be due to the increasing proportion of women and older physicians who tend to work shorter hours and fewer weeks.1
In the general physician population, 24% of women and 13% of men work part time, whereas 16% of both male and female ObGyns work part time. ObGyns aged 65 years or older constitute 35% of part-timers; 9% of those aged 35 to 49 years, and 11% of those aged 50 to 64 years, work part time. Only 2% of those younger than age 35 work part time.1
Would you select a career in obstetrics and gynecology all over again?
If given a second chance, would you rather choose orthopedic surgery as your specialty, or even choose medicine as a career again? OBG Management recently asked readers to weigh in, through its Quick Poll posted at obgmanagement.com, on whether or not they would choose ObGyn all over again. Ninety-one readers answered “yes” and 70 answered “no,” for a total of 161 respondents.
When this same question was posed to OBG Management’s Virtual Board of Editors (VBE), the perspectives were as split as the Quick Poll results:
- “No, no, no, I would not choose ObGyn all over again.”
- “Yes, I still love what I do.”
- “Yes, it is still the most unique specialty in medicine because it involves both surgery and primary care.”
- “Yes, for all the reasons I first loved the specialty: every week’s schedule, and every day is different. There is a mix of office care, surgery, and call.”
- “No! There is constant concern of litigation for complications, poor reimbursement, and compromised lifestyle.”
“There are much easier ways to make a living,” said one respondent, and another replied, “Work is very tough right now and the payment is too low.”
“The specialty has changed,” said Mary Vanko, MD, who practices in the suburbs of “blue collar Indiana.” “The public has very little idea of the breadth of our knowledge. The ObGyn generalist has the ability to serve as a woman’s doctor throughout her lifetime, not just perform the deliveries and surgeries. All of a sudden we are excluded from primary care status and people have to fight to see us. The newbies will never experience what it used to be as an ObGyn, the woman’s primary. Now we are the doctors to see when someone wants an IUD or is bleeding or pregnant. Big difference.”
Wesley Hambright, MD, practices in a small community hospital, but feels that “a larger hospital with more specialties may offer more flexibility and support in dealing with external pressures.” Tameka O’Neal, MD, is currently hospital employed but feels “as though I have little say in my practice.” Shaukat Ashai, MD, who is retired after 35 years in practice, says he would have preferred an academic setting on a full-time basis, citing long hours and poor compensation.
Robert del Rosario, MD, is in a large single-specialty suburban practice and would choose this practice setting again, although he would not choose a career as an ObGyn again. “The work demands have taken away too much from family,” he says. In addition, “as a male ObGyn, I am regularly faced with patients who choose their doctors based on gender rather than on skill. Our colleagues are no better. Early in my career and until the present, I hear people say, ‘Oh, I can’t hire Dr. X because we’re looking to hire a female.’”
Joe Walsh, MD, of Philadelphia, Pennsylvania, expresses similar discontent as a male ObGyn practicing in today’s female-populated specialty. In a letter to the editor in response to Editor in Chief Robert L. Barbieri, MD’s Editorial in the May 2015 issue, “Why is obstetrics and gynecology a popular choice for medical students?” Dr. Walsh states: “The unaddressed question is why is it unpopular for half of medical students? Ninety-three percent of resident graduates in the field are women, while women account for half of medical student graduates. Men rarely go into the field today. Perhaps job advertisements touting physician opportunities in ‘all female groups’ discourage men. Perhaps hospitals’ ‘Women’s Health Centers’ with such slogans as ‘Women taking care of women’ discourage men. Perhaps receptionists’ asking patients whether they prefer a male or female physician discourages male ObGyns.”
Many VBE members express some frustrations—with their practice setting, compensation, and longer work hours—but say that the patient relationships are the most rewarding aspect of their jobs. After 29 years in practice, Patrick Pevoto, MD, says the most rewarding aspect of his job is “being part of the legacy in people’s lives.”
Others say what keeps them engaged is:
- Enjoying “good outcomes.”
- “The patient contact. It’s fun having someone come up to me in the grocery store and introduce me to a teenager that I delivered 15 years ago.”
- “Surgery.”
- “Helping patients and teaching fellows.”
- “Knowing that I am making a difference in people’s lives.”
What is most rewarding?
When given several choices to select as the most rewarding aspect of their jobs, more female ObGyns (47%) than males (41%) reported that their physician-patient relationships are the major source of satisfaction. More men (10%) than women (7%) cite that making good money at a job they like is most gratifying. Only 3% of men and 2% of women reported no reward to being an ObGyn.1
Survey methodology
Medscape reports that the recruitment period for the 2015 Physician Compensation Report was from December 30, 2014, through March 11, 2015. Data were collected via a third-party online survey collection site. The margin of error for the survey was ±0.69%.1
Share your thoughts on this article! Send your Letter to the Editor to [email protected]. Please include your name and the city and state in which you practice.
1. Peckham C. Medscape OB/GYN Compensation Report 2015. Medscape Web site. http://www.medscape.com/features/slideshow/compensation/2015/womenshealth. Published April 21, 2015. Accessed May 13, 2015.
2. Peckham C. Medscape OB/GYN Compensation Report 2014. Medscape Web site. http://www.medscape.com/features/slideshow/compensation/2014/womenshealth. Published April 15, 2014. Accessed June 2, 2014.
3. Medscape News. Ob/Gyn Compensation Report 2013. Medscape Web site. http://www.medscape.com/features/slideshow/compensation/2013/womenshealth. Accessed June 30, 2013.
4. Reale D. Mean income for ObGyns increased in 2012. OBG Manag. 2013;25(8):34–36.
5. Peckham C. Medscape Physician Compensation Report 2015. Medscape Web site. http://www.medscape.com/features/slideshow/compensation/2015/public/overview. Published April 21, 2015. Accessed May 13, 2015.
6. Distribution of medical school graduates by gender. Henry Kaiser Family Foundation Web site. http://kff.org/other/state-indicator/medical-school-graduates-by-gender/. Accessed May 13, 2015.
In this article
- Which practice settings pay better?
- Would you select a career in ObGyn again?
- Comparing time spent with patients

Head CT in Kids with Minor Head Injury Down After Quality-Improvement Effort
NEW YORK (Reuters Health) - Following a quality-improvement effort at the Boston Children's Hospital emergency department, the number of head CT scans for children with blunt head trauma has dropped without missing any significant injuries, researchers say.
"A combination of an evidence-based guideline and individual provider feedback was associated with a reduction in cranial CT rates," Dr. Lise Nigrovic from Boston Children's told Reuters Health by email. "Clinicians successfully identified all children with head injuries requiring acute intervention."
The evidence-based guideline was based on the PECARN TBI clinical prediction rules, Dr. Nigrovic and her colleagues explain in a report in Pediatrics, online June 22. Immediate CT is recommended for children with either a single high-risk or at least three of the other PECARN TBI predictors.
A period of observation before deciding on CT is recommended for children with one or two predictors, and no CT is recommended for children without PECARN TBI predictors.
The goal of individual provider feedback was to improve awareness, acceptance, adoption and adherence to head trauma guideline recommendations. Each fall, ED providers receive a confidential report of annual cranial CT rates for ED patients with minor blunt head trauma for the previous year. Providers also get information on median overall division CT rate for the previous year, with the goal of reducing variability between providers while further decreasing overall CT rate.
Dr. Nigrovic's team analyzed more than 6,800 ED visits for minor head injuries, of which 62% occurred after implementation of the initiative.
From a baseline head CT rate of 21%, they observed a significant reduction of 6 percentage points in cranial CT rate after initial guideline implementation, and an additional drop of 6 percentage points after initiation of individual provider feedback, the researchers report.
"No children discharged from the ED required admission within 72 hours of initial evaluation," they note.
"Importantly," they add, the decline in the head CT rate has been sustained for two years so far after implementation, "which supports the sustainability of the QI (quality improvement) interventions."
"We believe that these changes are generalizable," Dr. Nigrovic told Reuters Health. "In fact, we have described our QI intervention in detail to help with adoption by other centers."
The study had no commercial funding and the authors have disclosed no potential conflicts of interest.
—Reuters Health
Team endorses intensified chemo for PET-positive HL
Photo by Rhoda Baer
LUGANO—Long-awaited results of the Intergroup H10 trial in PET-positive Hodgkin lymphoma (HL) patients have shown that intensifying chemotherapy significantly increases 5-year progression-free survival (PFS) and produces a non-significant increase in overall survival (OS).
Switching patients who are PET-positive after 2 cycles of ABVD to escalated BEACOPP and involved-node radiotherapy increased 5-year PFS to 91% and 5-year OS to 96%.
The trial was a cooperative effort of the European Organisation for Research and Treatment of Cancer (EORTC), Lymphoma Study Association (LYSA), and Fondazione Italiana Linfomi (FIL).
The investigators already knew that early FDG-PET scans have prognostic impact. Patients with a negative PET scan after 2 cycles of chemotherapy have very good outcomes, while those with PET-positive interim scans have poor outcomes.
So the team designed the H10 trial to learn whether they could reduce long-term toxicity in the majority of patients and improve outcomes in the unfavorable subgroups.
Results of the primary endpoint—whether chemotherapy alone is as effective as, but less toxic than, combined-modality treatment in PET-negative patients after 2 cycles of ABVD—were published in the Journal of Clinical Oncology.
The secondary endpoint was an improvement in PFS with an early change from ABVD to escalated BEACOPP in stage I or II HL patients who are PET-positive after 2 cycles of ABVD.
John M. M. Raemaekers, MD, PhD, of Radboud University Medical Center in The Netherlands, presented details on the trial’s secondary endpoint at the 13th International Congress on Malignant Lymphoma (no abstract available).
H10 trial design
The investigators enrolled patients with favorable and unfavorable prognostic characteristics.
Unfavorable characteristics consisted of age 50 or older, more than 3 nodal areas, mediastinal-to-thorax ratio of 0.35 or higher, erythrocyte sedimentation rate of 50 mm or greater without B symptoms, or erythrocyte sedimentation rate of 30 mm or greater with B symptoms.
In the standard treatment arm, patients with favorable or unfavorable characteristics were treated similarly. After 2 cycles of ABVD, a PET scan was performed, and, irrespective of the result, patients received combined-modality treatment of ABVD followed by involved-node radiotherapy.
In the experimental arm, patients who were PET-negative had chemotherapy alone without involved-node radiotherapy. PET-negative patients were not discussed further in this presentation.
For the PET-positive patients in the experimental arm, the treatment for those with favorable and unfavorable characteristics was identical.
Patients who were PET-positive after 2 cycles were switched to 2 escalated BEACOPP cycles plus involved-node radiotherapy. Patients were considered PET-positive if they had a Deauville score of 3, 4, or 5.
Randomization
The first patient was enrolled in November 2006 and the last in June 2011. Investigators randomized 1950 patients, 754 with favorable and 1196 with unfavorable characteristics. All patients had untreated, supradiaphragmatic, clinical stage I or II HL.
Nine hundred fifty-four patients were enrolled in the standard arm, 371 with favorable characteristics and 583 with unfavorable. Nine hundred seventy-one patients entered the experimental arm, 376 with favorable and 595 with unfavorable characteristics.
Twenty-five patients were excluded because they did not complete the first 2 cycles of ABVD or did not have a PET scan.
After 2 cycles of ABVD, 361 patients were PET-positive, 192 in the ABVD arm (54 favorable, 138 unfavorable), and 169 in the escalated BEACOPP arm (43 favorable, 126 unfavorable).
The median age was 30 years in both arms (range, 15 to 70), and the investigators followed patients for a median of 4.5 years.
Results
The only grade 3-4 toxicities were hematologic events and infection.
“As expected, the neutropenia, thrombocytopenia, and anemia, grade 3-4, were more frequent in the experimental BEACOPP arm,” Dr Raemaekers said.
The incidence of grade 3-4 neutropenia was 30.3% (ABVD) and 53.5% (BEACOPP), thrombocytopenia was 0% (ABVD) and 19.7% (BEACOPP), and anemia was 0% (ABVD) and 4.9% (BEACOPP).
The incidence of grade 3-4 febrile neutropenia was 1.1% (ABVD) and 23.9% (BEACOPP), and infection without neutropenia was 1.1% (ABVD) and 11.2% (BEACOPP).
Progression or relapse occurred in 18.8% of patients in the ABVD arm and 7.7% in the BEACOPP arm.
There were 18 deaths in the ABVD arm and 7 deaths in the BEACOPP arm. Eleven deaths in the ABVD arm and 3 in the BEACOPP arm were due to progressive disease or relapse.
The investigators also tallied up the number of patients who progressed, relapsed, or died, whichever occurred first. Forty-one patients in the ABVD arm fulfilled one of these criteria, compared to 16 in the BEACOPP arm.
“Progression and relapse had to be established by conventional restaging, including physical exam, chest X-ray, and CT scan,” Dr Raemaekers pointed out. “And it was based on any new lesion or increase by 50% or more in size of previously involved sites.”
Patients in the BEACOPP arm experienced a significantly better PFS than the ABVD arm, with a hazard ratio of 0.42 (P=0.002). The 5-year PFS was 91% in the BEACOPP arm and 77% in the ABVD arm.
The 5-year OS was 89% in the ABVD arm and 96% in the BEACOPP arm, a difference that was not statistically significant.
“But [the trial] was also not powered for overall survival,” Dr Raemaekers said. “[T]here is a hint, at least, that, even in overall survival, the BEACOPP arm is superior to the ABVD arm.”
Based on these findings, the investigators concluded that, despite increased toxicity, physicians should consider intensifying chemotherapy in early PET-positive patients with stage I/II HL in the combined-modality setting. ![]()