User login
A PEARL of wisdom about writing ‘Pearls’
Since 2005, I’ve had the opportunity to review “Pearls” articles submitted for publication in Current Psychiatry. In that time, I have read many worthwhile papers written by authors who may not be entirely clear about what constitutes a “Pearl." The mnemonic PEARL could help authors:
- decide if their article or idea is appropriate for “Pearls”
- construct the article to conform to the “Pearls” format.
Easy to remember. Lengthy, highly detailed articles may be helpful and informative but are not consistent with the purpose of “Pearls.
Alert. A “Pearl” should alert a physician to identify a problem, diagnosis, or adverse effect that they might otherwise miss or take unnecessary time to identify. Classic examples are the “handshake diagnosis” of hyperthyroidism,1 or the “3 little words that can diagnose mild cognitive impairment.”2
References. A professional article of any length should include references. References add immediate credibility to the information presented. For a “Pearl,” even 1 reference is acceptable. A writer can easily search PubMed and the Internet to find references to confirm or support their ideas.
Less is more. Architect Mies van der Rohe’s minimalist concept applies to “Pearls.” A “Pearl”—like its namesake—is small, polished, and valuable. Simplicity is its essence.
I hope this mnemonic is useful for clinicians interested in sharing their ideas or experiences to help others in the field. I look forward to reviewing many more “Pearls.”
1. Bedell SE, Graboys TB. Hand to hand. J Gen Intern Med. 2002;17(8):653-656.
2. Steenland NK, Auman CM, Patel PM, et al. Development of a rapid screening instrument for mild cognitive impairment and undiagnosed dementia. J Alzheimers Dis. 2008;15(3):419-427.
Since 2005, I’ve had the opportunity to review “Pearls” articles submitted for publication in Current Psychiatry. In that time, I have read many worthwhile papers written by authors who may not be entirely clear about what constitutes a “Pearl." The mnemonic PEARL could help authors:
- decide if their article or idea is appropriate for “Pearls”
- construct the article to conform to the “Pearls” format.
Easy to remember. Lengthy, highly detailed articles may be helpful and informative but are not consistent with the purpose of “Pearls.
Alert. A “Pearl” should alert a physician to identify a problem, diagnosis, or adverse effect that they might otherwise miss or take unnecessary time to identify. Classic examples are the “handshake diagnosis” of hyperthyroidism,1 or the “3 little words that can diagnose mild cognitive impairment.”2
References. A professional article of any length should include references. References add immediate credibility to the information presented. For a “Pearl,” even 1 reference is acceptable. A writer can easily search PubMed and the Internet to find references to confirm or support their ideas.
Less is more. Architect Mies van der Rohe’s minimalist concept applies to “Pearls.” A “Pearl”—like its namesake—is small, polished, and valuable. Simplicity is its essence.
I hope this mnemonic is useful for clinicians interested in sharing their ideas or experiences to help others in the field. I look forward to reviewing many more “Pearls.”
1. Bedell SE, Graboys TB. Hand to hand. J Gen Intern Med. 2002;17(8):653-656.
2. Steenland NK, Auman CM, Patel PM, et al. Development of a rapid screening instrument for mild cognitive impairment and undiagnosed dementia. J Alzheimers Dis. 2008;15(3):419-427.
1. Bedell SE, Graboys TB. Hand to hand. J Gen Intern Med. 2002;17(8):653-656.
2. Steenland NK, Auman CM, Patel PM, et al. Development of a rapid screening instrument for mild cognitive impairment and undiagnosed dementia. J Alzheimers Dis. 2008;15(3):419-427.
Guidance for parents of LGBT youth
Two years ago, a mother of one of my patients asked me for advice. She knew that her daughter identified as lesbian, and she was fully supportive. One day, her daughter wanted to go to a sleepover at a female friend’s house. Her first reaction was to say yes, but then she had second thoughts: If her daughter were straight, and this friend were male, she would not allow her to go because of the potential for sexual activity. When she told her daughter she could not attend the sleepover, her daughter accused her of not letting her go because of her sexual orientation. And now, the dilemma: In her effort to be fair and consistent with her values, the mother is being accused of discrimination. What should she do?
Parents play an irreplaceable role in the life of any teen, especially in the lives of teens that identify as lesbian, gay, bisexual, or transgender (LGBT). But many LGBT youth face serious challenges with their parents. They face the potential of parental rejection of their sexual or gender identity. At the very worst, teens may face homelessness if they come out to homophobic parents.1 Youth whose parents are accepting, nevertheless, are less likely to have mental health problems or engage in substance use.2

As a clinical provider for children and adolescents, caregivers will ask you for advice on how to address parenting challenges. Because LGBT youth are at risk for many adverse health outcomes, and parental support is paramount in preventing them, this is an opportunity for you to help this vulnerable population.
If parents ask you how to be supportive of their LGBT children, here are some recommendations, which are based on an intervention by colleagues at the University of Utah:3
1. Let their affection show. Receiving news that a child is LGBT can be emotionally intense for parents.4 Because of this emotional intensity, parents may react negatively and neglect to show their love for their child, which is what the child is seeking. Parents showing affection is the first step in supporting their LGBT child. Remind parents to tell their child that they love them no matter what.
2. Avoid rejecting behaviors. This is sometimes hard, because some forms of rejection can be quite subtle. Avoid saying anything that may indicate a negative view of LGBT people, even if it is not intended. For example, saying that something is “gay” may seem innocent enough, but it sends the message that being gay is something to be ashamed of.
3. Express their pain away from their child. Evidence shows that minimizing a child’s exposure to parental conflict and stress is associated with better coping with these devastating events.5 Parents should avoid telling their children that news of their sexual orientation or gender identity upsets them, as this is another form of rejecting behavior.
4. Do good before they feel good. Previous studies suggest that changes in behavior can occur even though a person may feel otherwise.6 Negative feelings about a child’s sexual orientation or gender identity can last months or years.7 It’s okay to have these feelings, but showing support such as telling their child how they still love them can ultimately lead to acceptance.
Although it is important for parents to accept their child, it is only half the battle. If you remember Baumrind’s theory on parenting, there are two sides of parenting. The first side involves parents showing their affection, love, and support for their children, which I described earlier. The other side involves managing a child’s behaviors, whether parents create an environment that makes it difficult to engage in behaviors they disapprove of or teach their children how to make the right decision.8 Many LGBT youth engage in risky behaviors because it’s a way of coping in a homophobic environment. The parents’ job is to teach their children healthier coping strategies.
Research on this aspect of parenting in LGBT youth is still at its infancy, and some of it is not reassuring. One important behavior, parental monitoring, which is “a set of correlated parenting behaviors involving attention to and tracking of the child’s whereabouts, activities, and adaptations,”9 can prevent conduct disorders, substance use, and mental health problems in the typical teenager.10 Unfortunately, we don’t find the same results for sexual minorities. One study suggests that parental monitoring may not prevent high-risk sexual behavior for young gay males, even if the parent is aware of the young man’s sexual orientation.11
This doesn’t mean that parental monitoring isn’t helpful. This just means that parenting LGBT youth is different than parenting heterosexual youth. It’s not enough for parents to just accept their child’s sexual orientation. They also must help them make the right decisions taking into consideration the effect of stigma and discrimination on sexual minorities. There are a couple of things you can suggest to your parents to help them raise their LGBT children:
1. Be proactive. Join organizations that support parents of LGBT youth such as Parents, Families, and Friends of Lesbians and Gays (PFLAG). Also, parents must be aware of their children’s behavior. If they are acting depressed, seek help. Having depression or anxiety increases the chances of engaging in risky behaviors, so the earlier parents address this, the better.
2. Make their child know what their views are on high risk-behaviors, such as substance use or having unprotected sex. They need to communicate their expectations clearly. If parents believe that drinking alcohol before the legal age is wrong, they should clearly let their children know that.
3. Make it easier for their child to tell parents what’s going on in their lives. Parents have to gain their children’s trust, be accessible (don’t answer texts while talking to them!), and be an active listener. LGBT youth may not ask parents for advice because they feel that because their parents are straight or cisgender, their life experiences do not apply. Being a member of an organization like PLFAG can be helpful, because parents can ask other parents who have experience raising LGBT youth for advice that works.
4. If parents’ children do something wrong, they should talk to them about how their actions were risky. Children will listen to parents if they view their parenting as legitimate and fair, which can only happen if there is a strong parent-child relationship. Being supportive of a child’s sexual orientation or gender identity is key here. And for the next time, it’s always good to role-play a scenario (for example, what to do if someone tries to make them drink at a party).
Parents of LGBT youth face many challenges. You can help these parents by encouraging them to accept and support their child’s sexual orientation or gender identity and provide parenting strategies relevant for LGBT youth. Most important of all, encourage them to seek support through organizations like PFLAG. With this support, parents can encourage healthy development in LGBT youth.
Resources for parents of LGBT youth
• The Centers for Disease Control and Prevention (CDC) has information on the health of LGBT Youth and advice on parental monitoring in general.
• The Family Acceptance Project is a project researching ways to improve parent-child relationships in LGBT Youth.
• PFLAG is an organization that provides support for families of LGBT youth.
• Lead with Love is a film about how various types of families react to their children coming out to them.
References
1. J Sex Res. 2004 Nov;41(4):329-42.
2. Aust N Z J Psychiatry. 2010 Sep;44(9):774-83.
3. Huebner D. “Leading with Love: Interventions to Support Families of Lesbian, Gay, and Bisexual Adolescents,” The Register Report, Vol. 39. National Register of Health Service Psychologists, Spring 2013.
4. J GLBT Fam Stud. 2014 Jan;10(1-2):36-57.
5. Prof Psychol Res Pr. 2008 Apr;39(2):113-21.
6. “Behaviorism: Classic Studies” (Casper, Wyo: Endeavor Books/Mountain States Litho, 2009).
7. Journal of LGBT Issues in Counseling. 2008;2(2):126-58.
8. Genet Psychol Monogr. 1967;75(1):43-88.
9. Clin Child Fam Psychol Rev. 1998 Mar;1(1):61-75.
10. “Parental Monitoring of Adolescents: Current Perspectives for Researchers and Practitioners” (New York: Columbia University Press, 2010).
11. AIDS Behav. 2014 Aug;18(8):1604-14.
Dr. Montano is an adolescent medicine fellow at Children’s Hospital of Pittsburgh of UPMC and a postdoctoral fellow in the department of pediatrics at the University of Pittsburgh. Email him at [email protected].
Two years ago, a mother of one of my patients asked me for advice. She knew that her daughter identified as lesbian, and she was fully supportive. One day, her daughter wanted to go to a sleepover at a female friend’s house. Her first reaction was to say yes, but then she had second thoughts: If her daughter were straight, and this friend were male, she would not allow her to go because of the potential for sexual activity. When she told her daughter she could not attend the sleepover, her daughter accused her of not letting her go because of her sexual orientation. And now, the dilemma: In her effort to be fair and consistent with her values, the mother is being accused of discrimination. What should she do?
Parents play an irreplaceable role in the life of any teen, especially in the lives of teens that identify as lesbian, gay, bisexual, or transgender (LGBT). But many LGBT youth face serious challenges with their parents. They face the potential of parental rejection of their sexual or gender identity. At the very worst, teens may face homelessness if they come out to homophobic parents.1 Youth whose parents are accepting, nevertheless, are less likely to have mental health problems or engage in substance use.2
As a clinical provider for children and adolescents, caregivers will ask you for advice on how to address parenting challenges. Because LGBT youth are at risk for many adverse health outcomes, and parental support is paramount in preventing them, this is an opportunity for you to help this vulnerable population.
If parents ask you how to be supportive of their LGBT children, here are some recommendations, which are based on an intervention by colleagues at the University of Utah:3
1. Let their affection show. Receiving news that a child is LGBT can be emotionally intense for parents.4 Because of this emotional intensity, parents may react negatively and neglect to show their love for their child, which is what the child is seeking. Parents showing affection is the first step in supporting their LGBT child. Remind parents to tell their child that they love them no matter what.
2. Avoid rejecting behaviors. This is sometimes hard, because some forms of rejection can be quite subtle. Avoid saying anything that may indicate a negative view of LGBT people, even if it is not intended. For example, saying that something is “gay” may seem innocent enough, but it sends the message that being gay is something to be ashamed of.
3. Express their pain away from their child. Evidence shows that minimizing a child’s exposure to parental conflict and stress is associated with better coping with these devastating events.5 Parents should avoid telling their children that news of their sexual orientation or gender identity upsets them, as this is another form of rejecting behavior.
4. Do good before they feel good. Previous studies suggest that changes in behavior can occur even though a person may feel otherwise.6 Negative feelings about a child’s sexual orientation or gender identity can last months or years.7 It’s okay to have these feelings, but showing support such as telling their child how they still love them can ultimately lead to acceptance.
Although it is important for parents to accept their child, it is only half the battle. If you remember Baumrind’s theory on parenting, there are two sides of parenting. The first side involves parents showing their affection, love, and support for their children, which I described earlier. The other side involves managing a child’s behaviors, whether parents create an environment that makes it difficult to engage in behaviors they disapprove of or teach their children how to make the right decision.8 Many LGBT youth engage in risky behaviors because it’s a way of coping in a homophobic environment. The parents’ job is to teach their children healthier coping strategies.
Research on this aspect of parenting in LGBT youth is still at its infancy, and some of it is not reassuring. One important behavior, parental monitoring, which is “a set of correlated parenting behaviors involving attention to and tracking of the child’s whereabouts, activities, and adaptations,”9 can prevent conduct disorders, substance use, and mental health problems in the typical teenager.10 Unfortunately, we don’t find the same results for sexual minorities. One study suggests that parental monitoring may not prevent high-risk sexual behavior for young gay males, even if the parent is aware of the young man’s sexual orientation.11
This doesn’t mean that parental monitoring isn’t helpful. This just means that parenting LGBT youth is different than parenting heterosexual youth. It’s not enough for parents to just accept their child’s sexual orientation. They also must help them make the right decisions taking into consideration the effect of stigma and discrimination on sexual minorities. There are a couple of things you can suggest to your parents to help them raise their LGBT children:
1. Be proactive. Join organizations that support parents of LGBT youth such as Parents, Families, and Friends of Lesbians and Gays (PFLAG). Also, parents must be aware of their children’s behavior. If they are acting depressed, seek help. Having depression or anxiety increases the chances of engaging in risky behaviors, so the earlier parents address this, the better.
2. Make their child know what their views are on high risk-behaviors, such as substance use or having unprotected sex. They need to communicate their expectations clearly. If parents believe that drinking alcohol before the legal age is wrong, they should clearly let their children know that.
3. Make it easier for their child to tell parents what’s going on in their lives. Parents have to gain their children’s trust, be accessible (don’t answer texts while talking to them!), and be an active listener. LGBT youth may not ask parents for advice because they feel that because their parents are straight or cisgender, their life experiences do not apply. Being a member of an organization like PLFAG can be helpful, because parents can ask other parents who have experience raising LGBT youth for advice that works.
4. If parents’ children do something wrong, they should talk to them about how their actions were risky. Children will listen to parents if they view their parenting as legitimate and fair, which can only happen if there is a strong parent-child relationship. Being supportive of a child’s sexual orientation or gender identity is key here. And for the next time, it’s always good to role-play a scenario (for example, what to do if someone tries to make them drink at a party).
Parents of LGBT youth face many challenges. You can help these parents by encouraging them to accept and support their child’s sexual orientation or gender identity and provide parenting strategies relevant for LGBT youth. Most important of all, encourage them to seek support through organizations like PFLAG. With this support, parents can encourage healthy development in LGBT youth.
Resources for parents of LGBT youth
• The Centers for Disease Control and Prevention (CDC) has information on the health of LGBT Youth and advice on parental monitoring in general.
• The Family Acceptance Project is a project researching ways to improve parent-child relationships in LGBT Youth.
• PFLAG is an organization that provides support for families of LGBT youth.
• Lead with Love is a film about how various types of families react to their children coming out to them.
References
1. J Sex Res. 2004 Nov;41(4):329-42.
2. Aust N Z J Psychiatry. 2010 Sep;44(9):774-83.
3. Huebner D. “Leading with Love: Interventions to Support Families of Lesbian, Gay, and Bisexual Adolescents,” The Register Report, Vol. 39. National Register of Health Service Psychologists, Spring 2013.
4. J GLBT Fam Stud. 2014 Jan;10(1-2):36-57.
5. Prof Psychol Res Pr. 2008 Apr;39(2):113-21.
6. “Behaviorism: Classic Studies” (Casper, Wyo: Endeavor Books/Mountain States Litho, 2009).
7. Journal of LGBT Issues in Counseling. 2008;2(2):126-58.
8. Genet Psychol Monogr. 1967;75(1):43-88.
9. Clin Child Fam Psychol Rev. 1998 Mar;1(1):61-75.
10. “Parental Monitoring of Adolescents: Current Perspectives for Researchers and Practitioners” (New York: Columbia University Press, 2010).
11. AIDS Behav. 2014 Aug;18(8):1604-14.
Dr. Montano is an adolescent medicine fellow at Children’s Hospital of Pittsburgh of UPMC and a postdoctoral fellow in the department of pediatrics at the University of Pittsburgh. Email him at [email protected].

Parental Perceptions of Nighttime Communication Are Strong Predictors of Patient Experience
Clinical question: How does parental perception of overnight pediatric inpatient care affect the overall patient experience?
Background: Restrictions on resident duty hours have become progressively more stringent as attention to the effects of resident fatigue on patient safety has increased. In 2011, the Accreditation Council for Graduate Medical Education (ACGME) limited total weekly duty hours to 80 and reduced shifts for junior trainees to a maximum of 16 hours. As a result, a majority of teaching hospitals have instituted “night float,” or night team models, for overnight coverage of pediatric inpatients. The rapid adoption of night float inpatient coverage models has raised concerns about training residents in a structure that may not foster patient ownership and may promote shift worker mentality. Although communication between healthcare providers and patients/caregivers is known to be a key driver of patient satisfaction, little is known about the quality of communication overnight in the era of night float teams.
Study design: Prospective cohort study utilizing survey methodology.
Setting: Two general pediatric units at a 395-bed, urban, freestanding children’s teaching hospital.
Synopsis: A randomly selected subset of children (0-17 years) with English-speaking parents/caregivers admitted to two general pediatric units was studied over an 18-month period. Both general pediatric and subspecialty service patients, including adolescent, immunology, hematology, and rheumatology, were included. Researchers administered written surveys on weekday (Monday-Thursday) evenings prior to discharge, and surveys were collected either later that evening or in the morning. The surveys included 29 questions that used a five-point Likert scale to assess communication and experience.
These questions covered the following constructs:
- Parent understanding of the medical plan;
- Parent communication and experience with nighttime doctors;
- Parent communication and experience with nighttime nurses;
- Parent perceptions of nighttime interactions between doctors and nurses; and
- Parent overall experience of care during hospitalization.
An open question addressing whether parents had anything else to share about communication during the hospitalization was included. The primary outcome measure was the so-called “top-box” rating of overall experience of care during the hospitalization (from construct five). This outcome was dichotomous based on whether the parent had given the highest rating or not for all five questions in that construct (either “excellent” or “strongly agree”).
A top-box rating of overall experience of care was found to be associated with high mean construct scores regarding communication and experience with doctors (4.85) and nurses (4.87). Top-box overall experience ratings were also associated with top ratings for coordination between daytime and nighttime nurses and for teamwork between nighttime doctors and nurses. Multivariable analysis showed that parents’ rating of direct communications with doctors and nurses and perceived teamwork and communication between doctors and nurses were significant predictors of top-box overall experience.
Bottom line: Parents’ perceptions of direct communications with nighttime doctors and nurses and their perceived teamwork and communication were strong predictors of overall experience of care during pediatric hospitalization.
Citation: Khan A, Rogers JE, Melvin P, et al. Physician and nurse nighttime communication and parents’ hospital experience. Pediatrics. 2015;136(5):e1249-1258.
Statin may reduce vaso-occlusive pain in SCD

Photo courtesy of the CDC
ORLANDO, FL—In a small study, the cholesterol-lowering medication simvastatin reduced the frequency of vaso-occlusive pain in adults and children with sickle cell disease (SCD).
Overall, there was a 46% decrease in the frequency of vaso-occlusive pain after 3 months of treatment with simvastatin.
There was a slight overall decrease in the intensity of pain as well, but this was not statistically significant.
Still, investigators observed a decrease in biomarkers of inflammation and said the drug appeared to be safe for this patient population.
The team believes these preliminary data suggest the need to conduct a larger, randomized trial of simvastatin in SCD.
Carolyn C. Hoppe, MD, of UCSF Benioff Children’s Hospital Oakland in California, presented the data at the 2015 ASH Annual Meeting (abstract 545).*
“Vaso-occlusive pain is a clinical hallmark and major cause of morbidity in sickle cell disease,” Dr Hoppe said. “Triggered by polymerization and hemolysis, vaso-occlusion involves multiple pathways.”
Similarly, although statins are best known for their cholesterol-inhibiting ability, they also inhibit oxidative stress and inflammation.
With this in mind, Dr Hoppe and her colleagues previously tested simvastatin in a phase 1 study of SCD patients who were 13 years of age or older.
The investigators found the safety profile to be acceptable, and they observed an improvement in biomarkers of inflammation. So they decided to carry out the current study.
This was a single-center, uncontrolled trial that enrolled SCD patients ages 10 and older. They received once-daily oral simvastatin (40 mg) for 3 months.
The primary outcome measure was the frequency and intensity of vaso-occlusive pain, as recorded by daily electronic pain diaries, before and after simvastatin treatment.
Clinical laboratory studies and plasma biomarkers were evaluated at baseline, at 0.5, 1, 2, and 3 months during treatment, as well as 1 month after the discontinuation of simvastatin.
Results
Nineteen patients completed the study. They had a mean age of 19 (range, 10-34), and 13 were female. Seventeen had HbSS genotype, and 2 had S/β0 thalassemia. Ten patients were receiving hydroxyurea.
The simvastatin adherence rate was 85%, and the adherence to using the daily pain diary was 73%.
Dr Hoppe said there were no new safety issues or drug-related adverse events in this trial. There was no myalgia or myopathy. One subject did experience transient facial swelling that may have been drug-related.
The patients’ total cholesterol decreased by 20% from baseline. There was a significant decrease in both LDL and HDL cholesterol (P<0.001 for both).
Creatinine kinase remained stable during treatment, as did hemoglobin levels.
Dr Hoppe noted that the study was not designed to include an assessment of fetal hemoglobin, so she and her colleagues did not have data on that measure for all the patients, but the team did observe an increase in fetal hemoglobin levels from baseline among the patients who were receiving hydroxyurea.
The investigators observed a decrease from baseline in markers of hemolysis—absolute reticulocyte count (P=0.006) and total bilirubin (P=0.02).
Overall, there was a 46% decrease in the frequency of vaso-occlusive pain from baseline (P=0.005) and a 10% decrease in the intensity of pain (which was not significant).
There was a 59% decrease in hsCRP (P=0.003), an 18% decrease in sE-selectin (P=0.01), a 5% decrease in sICAM (P=0.03), and a 17% decrease in VEGF (P=0.05). There was no significant effect on plasma nitric oxide metabolites, sVCAM1, or P-selectin levels.
“These results are basically preliminary data to give clinical support for a larger, randomized trial of simvastatin to assess its clinical efficacy in SCD,” Dr Hoppe concluded.
She reported receiving research funding and consultancy payments from Eli Lilly and Company, and another investigator involved in this study is an employee of Pharmacyclics LLC. ![]()
*Data in the abstract differ from the data presented.
Protein discovery could have therapeutic implications

Photo courtesy of The
Scripps Research Institute
New research shows how NPM1—a protein implicated in non-Hodgkin lymphoma, acute myelogenous leukemia, and other cancers—twists and morphs into different structures.
This protein has many functions and, when mutated, has been shown to interfere with cells’ normal tumor suppressing ability.
Previous research showed that a section of NPM1, called the N-terminal domain, doesn’t have a defined, folded structure.
Instead, the protein morphs between 2 forms: a 1-subunit disordered monomer and a 5-subunit folded pentamer.
Until now, the mechanism behind this transformation was unknown, but researchers believed this monomer-pentamer equilibrium could be important for the protein’s location and functioning in the cell.
Ashok Deniz, PhD, of The Scripps Research Institute in La Jolla, California, and his colleagues conducted the current study to shed light on how this transformation occurs. They reported their findings in Angewandte Chemie.
The researchers used a combination of 3 techniques to analyze NPM1—single-molecule biophysics, fluorescence resonance energy transfer, and circular dichroism.
These techniques revealed that NPM1’s transformation can proceed through more than one pathway. In one pathway, the transformation begins when the cell sends signals to attach phosphoryl groups to NPM1.
This phosphorylation prompts the ordered pentamer to become disordered and likely causes NPM1 to shuttle outside the cell’s nucleus. A meeting with a binding partner can mediate the reverse transformation to a pentamer.
However, when NPM1 does become a pentamer again under these conditions, which likely causes it to move back to the nucleolus, it takes a different path instead of just retracing its earlier steps.
The study also revealed many intermediate states between monomer and pentamer structures. And it showed that these states can be manipulated or “tuned” by changing conditions such as salt levels, phosphorylation, and partner binding, which may explain how cells regulate NPM1’s multiple functions.
The researchers said future studies could shed more light on the biological functions of these different structures and how they might be used in future cancer therapies.
“We’re studying basic biophysics, but we believe the complexity and rules we uncover for the physics of protein disorder and folding could one day also be used for better designs of therapeutics,” Dr Deniz said.
He and his colleagues also believe that combining the 3 techniques used in this study, plus a novel protein-labeling technique for single-molecule fluorescence, could be a useful strategy for studying other unstructured, intrinsically disordered proteins. ![]()
Antihemophilic factor meets phase 3 endpoint

An antihemophilic factor that was recently approved in the US has met the primary endpoint of a phase 3 study, according to the product’s maker, Baxalta.
The product is Adynovate, a recombinant pegylated factor VIII (FVIII) treatment based on the full-length Advate molecule.
The study enrolled patients younger than 12 years of age who had severe hemophilia A. And, thus far, none of these patients has developed inhibitors to Adynovate, which was the study’s primary endpoint.
Adynovate also proved effective for preventing bleeds in some patients and did not appear to produce any serious adverse events.
Adynovate was approved in the US last month for use as routine prophylaxis and on-demand treatment and control of bleeding episodes in hemophilia A patients age 12 and older.
Baxalta said the phase 3 data will form the basis of a US filing for a pediatric indication in early 2016.
The study was designed to assess the safety and immunogenicity of Adynovate in young, previously treated patients with severe hemophilia A. The study enrolled 73 such patients.
Researchers assessed the hemostatic efficacy of Adynovate as prophylaxis and for treatment of bleeding episodes. All patients received prophylactic Adynovate treatment (a median of 1.9 infusions per week) and were followed for 6 months.
The study’s primary endpoint was met, as no patients developed inhibitory antibodies to the drug. In addition, no treatment-related serious adverse events were reported.
About 73% of patients had no joint bleeds while on treatment, and about 38% had no bleeds of any kind.
The median annualized bleeding rate among patients treated with Adynovate was 2.0 (range, 0-49.8), and the mean was 3.0, which is comparable to the rates seen in adults treated with the product.
“These initial efficacy and safety findings indicate a potentially valuable role for Adynovate to treat pediatric patients with hemophilia A, with data consistent with what was reported in clinical studies among adult patients,” said John Orloff, MD, head of research & development and chief scientific officer at Baxalta.
With these results, the company plans to file for marketing authorization in Europe and aims to file for a pediatric indication in the US in early 2016.
Adynovate is currently under regulatory review in Japan, Canada, and Switzerland. Baxalta plans to present the complete data from this study at a congress in 2016. ![]()
LAAC a better long-term value than anticoagulants, team says

Photo courtesy of
Boston Scientific
Researchers have compared the cost-effectiveness of left atrial appendage closure (LAAC) with the Watchman device to treatment with warfarin or novel oral anticoagulants (NOACs) as stroke prophylaxis in patients with non-valvular atrial fibrillation.
The results showed that, in the long-term, both NOACs and LAAC were cost-effective relative to warfarin.
LAAC was cost-saving relative to warfarin by year 10 and relative to NOACs by year 5. NOACs were not cost-saving relative to warfarin over the 20-year period studied.
Vivek Reddy, MD, of the Mount Sinai Medical Center in New York, New York, and his colleagues reported these findings in the Journal of American College of Cardiology.
The researchers used a Markov model to evaluate the cost-effectiveness of warfarin, NOACs, and LAAC with the Watchman device from the perspective of the Centers for Medicare & Medicaid Services over a lifetime horizon, which was defined as 20 years.
The patients were 70 years of age and at moderate risk for stroke and bleeding. Clinical event rates, stroke outcomes, and quality of life information were drawn predominantly from 4-year data from the PROTECT AF trial and meta-analyses of warfarin and NOACs.
Costs were presented in 2015 US dollars. The researchers assessed cost-effectiveness annually to determine if there was an observable time horizon over which treatment options reached accepted levels of cost-effectiveness.
They found that LAAC was more expensive than warfarin in the first post-procedure year, and patients had fewer quality-adjusted life years (QALYs) with LAAC.
But by year 3, LAAC-treated patients had gained more QALYs than warfarin-treated patients. And LAAC became cost-effective relative to warfarin by year 7, with a cost per QALY gained of $42,994.
By year 10, LAAC was more effective and less costly than warfarin. This was true for the remainder of the 20-year time horizon. Over a lifetime, LAAC provided an additional 0.506 life-years and 0.638 QALYs relative to warfarin.
NOACs were more effective than warfarin in year 1 and achieved cost-effectiveness relative to warfarin at year 16, with a cost per QALY gained of $48,446.
NOACs were not cost-saving relative to warfarin over 20 years. However, the incremental cost-effectiveness ratio continued to decrease over time so the cost per QALY gained at 20 years was $40,602.
Compared to NOACs, LAAC was more expensive in the first year post-procedure. However, by year 5, LAAC was less expensive—$20,892 vs $20,924—and more effective—3.455 QALYs vs 3.448 QALYs. This remained true for the rest of the time horizon.
Over a patient’s lifetime, LAAC was estimated to provide an additional 0.298 life-years and 0.349 QALYs relative to NOACs.
Dr Reddy and other authors of this paper are paid consultants to Boston Scientific, manufacturer of the Watchman device. Another author is a full-time employee of Boston Scientific, and yet another author has a financial interest in the Watchman device. Dr Reddy is also a paid consultant for and has received grant support from Coherex and St. Jude Medical. ![]()
The HPV vaccine
As physicians, we play a unique role in medicine. Drawing on research data, we provide a gateway of information to patients and families. Governing agencies use that data to make recommendations so that we can promote treatment with confidence. But we also have a responsibility if there is an ill outcome, so being well versed on vaccines and treatments is imperative.
Since the human papillomavirus (HPV) vaccines (Gardasil, Cervarix) were approved for the prevention of HPV, there has been controversy. Despite the ongoing reports of the vaccine’s success in lowering cervical cancer rates, many parents still feel that it puts their children at risk.
A 2012 study – a systematic review of parents’ knowledge of HPV – showed a decline from 2001 to 2011, with a rise in parents’ safety concerns, and fewer parents opting to have their children vaccinated (Obstet Gynecol Int. 2012. doi: 10.1155/2012/921236).

Several studies have shown the overwhelming decline in cervical cancer that is directly related to the implementation of the HPV vaccines. But there has been growing concern, as postural orthostatic hypotension (POTS), complex regional pain syndrome (CRPS), and sudden death have been cited as side effects of theses vaccines. POTS and CRPS have been in the headlines recently, since a report came out linking the vaccine to these syndromes. Although a review by the European Medicines Agency found that the evidence does not support the notion of the HPV vaccine causing POTS or CRPS, many groups still promote a ban of the vaccine.
In 2013, Japan withdrew its recommendation for administration of the HPV vaccine after reports that many girls had been seriously harmed by it, and now calls for follow-up for patients who believe they are having side effects. Researchers argue that the basis for this action is poorly founded, and that many young women are being deprived of a vaccine that would be protective. But just as many say that more investigation needs to be done before the recommendation can be reinstated, given the number of reports about women being seriously injured from the vaccine. The Japan Society of Obstetrics and Gynecology is pleading with the Japanese Health Ministry to commence recommending the HPV cancer-preventing vaccineonce again.
An Internet search of this topic shows there are several articles questioning the safety of the vaccine, and throughout the world, concerns are forcing more research to be done to ensure its safety. Although the research overwhelmingly shows that the risk-to-benefit ratio is in favor of the HPV vaccine, several sites are reporting injury.
In a study of 997,585 girls aged 10-17 years in Denmark and Sweden, among whom 296,826 received a total of 696,420 quadrivalent HPV vaccine doses, 1,043 (less than 1%) were found to have adverse reactions, compared with 11,944 (2%) of unvaccinated girls (BMJ 2013;347:f5906). Although some relationship between HPV vaccine and autoimmune disorders such as Behçet’s syndrome, Raynaud’s disease, and type 1 diabetes was apparent, no consistent evidence for a causal association was found.
“Analysis of data reported to the Vaccine Adverse Event Reporting System revealed disproportionate reporting of venous thromboembolism,” noted Dr. Lisen Arnheim-Dahlström of the Karolinska Institutet, Stockholm, lead author of the BMJ study, and associates. “A study by the Vaccine Safety Datalink, which involved eight outcomes, identified a nonsignificantly increased relative risk (1.98) of venous thromboembolism; medical record review could confirm five of the eight cases identified from databases using international classification of diseases codes, and all five had known risk factors for venous thromboembolism. In our analysis, based on 21 vaccine exposed cases, there was no significant association with venous thromboembolism within 90 days after exposure to [quadrivalent] HPV vaccine.”
These rising concerns are resulting in more parents declining the HPV vaccine, and more questions for the primary care physician to answer. Not only are parents alarmed, but so are the physicians who make the recommendations. Being aware of the most current research and reports for and against the vaccine’s use, and being able to discuss with the family the validity of this information, will help to dispel much of the anxiety.
Dr. Pearce is a pediatrician in Frankfort, Ill. To contact her, send email to [email protected].
As physicians, we play a unique role in medicine. Drawing on research data, we provide a gateway of information to patients and families. Governing agencies use that data to make recommendations so that we can promote treatment with confidence. But we also have a responsibility if there is an ill outcome, so being well versed on vaccines and treatments is imperative.
Since the human papillomavirus (HPV) vaccines (Gardasil, Cervarix) were approved for the prevention of HPV, there has been controversy. Despite the ongoing reports of the vaccine’s success in lowering cervical cancer rates, many parents still feel that it puts their children at risk.
A 2012 study – a systematic review of parents’ knowledge of HPV – showed a decline from 2001 to 2011, with a rise in parents’ safety concerns, and fewer parents opting to have their children vaccinated (Obstet Gynecol Int. 2012. doi: 10.1155/2012/921236).
Several studies have shown the overwhelming decline in cervical cancer that is directly related to the implementation of the HPV vaccines. But there has been growing concern, as postural orthostatic hypotension (POTS), complex regional pain syndrome (CRPS), and sudden death have been cited as side effects of theses vaccines. POTS and CRPS have been in the headlines recently, since a report came out linking the vaccine to these syndromes. Although a review by the European Medicines Agency found that the evidence does not support the notion of the HPV vaccine causing POTS or CRPS, many groups still promote a ban of the vaccine.
In 2013, Japan withdrew its recommendation for administration of the HPV vaccine after reports that many girls had been seriously harmed by it, and now calls for follow-up for patients who believe they are having side effects. Researchers argue that the basis for this action is poorly founded, and that many young women are being deprived of a vaccine that would be protective. But just as many say that more investigation needs to be done before the recommendation can be reinstated, given the number of reports about women being seriously injured from the vaccine. The Japan Society of Obstetrics and Gynecology is pleading with the Japanese Health Ministry to commence recommending the HPV cancer-preventing vaccineonce again.
An Internet search of this topic shows there are several articles questioning the safety of the vaccine, and throughout the world, concerns are forcing more research to be done to ensure its safety. Although the research overwhelmingly shows that the risk-to-benefit ratio is in favor of the HPV vaccine, several sites are reporting injury.
In a study of 997,585 girls aged 10-17 years in Denmark and Sweden, among whom 296,826 received a total of 696,420 quadrivalent HPV vaccine doses, 1,043 (less than 1%) were found to have adverse reactions, compared with 11,944 (2%) of unvaccinated girls (BMJ 2013;347:f5906). Although some relationship between HPV vaccine and autoimmune disorders such as Behçet’s syndrome, Raynaud’s disease, and type 1 diabetes was apparent, no consistent evidence for a causal association was found.
“Analysis of data reported to the Vaccine Adverse Event Reporting System revealed disproportionate reporting of venous thromboembolism,” noted Dr. Lisen Arnheim-Dahlström of the Karolinska Institutet, Stockholm, lead author of the BMJ study, and associates. “A study by the Vaccine Safety Datalink, which involved eight outcomes, identified a nonsignificantly increased relative risk (1.98) of venous thromboembolism; medical record review could confirm five of the eight cases identified from databases using international classification of diseases codes, and all five had known risk factors for venous thromboembolism. In our analysis, based on 21 vaccine exposed cases, there was no significant association with venous thromboembolism within 90 days after exposure to [quadrivalent] HPV vaccine.”
These rising concerns are resulting in more parents declining the HPV vaccine, and more questions for the primary care physician to answer. Not only are parents alarmed, but so are the physicians who make the recommendations. Being aware of the most current research and reports for and against the vaccine’s use, and being able to discuss with the family the validity of this information, will help to dispel much of the anxiety.
Dr. Pearce is a pediatrician in Frankfort, Ill. To contact her, send email to [email protected].

Manic and nonadherent, with a diagnosis of breast cancer
CASE Diagnosis, mood changes
Ms. A, age 58, is a white female with a history of chronic bipolar I disorder who is being evaluated as a new patient in an academic psychiatric clinic. Recently, she was diagnosed with ER+, PR+, and HER2+ ductal carcinoma. She does not take her prescribed mood stabilizers.
After her cancer diagnosis, Ms. A experiences new-onset agitation, including irritable mood, suicidal thoughts, tearfulness, decreased need for sleep, fast speech, excessive spending, and anorexia. She reports that she hears the voice of God telling her that she could cure her breast cancer through prayer and herbal remedies. Her treatment team, comprising her primary care provider and surgical oncologist, consider several medication adjustments, but are unsure of their effects on Ms. A’s mental health, progression of cancer, and cancer treatment.
What is the most likely cause of Ms. A’s psychiatric symptoms?
a) anxiety from having a diagnosis of cancer
b) stress reaction
c) panic attack
d) manic or mixed phase of bipolar I disorder
The authors’ observations
Treating breast cancer with concurrent severe mental illness is complex and challenging for the patient, family, and health care providers. Mental health and oncology clinicians must collaborate when treating these patients because of overlapping pathophysiology and medication interactions. A comprehensive evaluation is required to tease apart whether a patient is simply demoralized by her new diagnosis, or if a more serious mood disorder is present.
Worldwide, breast cancer is the most frequently diagnosed cancer and the leading cause of cancer death among women.1 The mean age of women diagnosed with breast cancer is 61 years; 61% of these women are alive 15 years after diagnosis, representing the largest group of female cancer survivors.
The incidence of breast cancer is reported to be higher in women with bipolar disorder compared with the general population.2-4 This positive correlation might be associated with a high rate of smoking, poor health-related behaviors, and, possibly, medication side effects. A genome-wide association study found significant associations between bipolar disorder and the breast cancer-related genes BRCA2 and PALB2.5
Antipsychotics and prolactin
Antipsychotics play an important role in managing bipolar disorder; several, however, are known to raise the serum prolactin level 10- to 20-fold. A high prolactin level could be associated with progression of breast cancer. All antipsychotics have label warnings regarding their use in women with breast cancer.
The prolactin receptor is overexpressed in >95% of breast cancer cells, regardless of estrogen-receptor status. The role of prolactin in development of new breast cancer is open to debate. The effect of a high prolactin level in women with diagnosed breast cancer is unknown, although available preclinical data suggest that high levels should be avoided. Psychiatric clinicians should consider checking the serum prolactin level or switching to a treatment strategy that avoids iatrogenic prolactin elevation. This risk must be carefully weighed against the mood-stabilizing properties of antipsychotics.6
TREATMENT Consider comorbidities
Ms. A receives supportive psychotherapy in addition to quetiapine, 400 mg/d, and valproic acid, 1,500 mg/d. This regimen helps her successfully complete the initial phase of breast cancer treatment, which consists of a single mastectomy, adjuvant chemotherapy (doxorubicin and cyclophosphamide followed by paclitaxel and trastuzumab). She is now on endocrine therapy with tamoxifen.
Ms. A, calm, much improved mood symptoms, and euthymic, has questions regarding her mental health, cancer prognosis, and potential medication side effects with continued cancer treatment.
Which drug used to treat breast cancer might relieve Ms. A’s manic symptoms?
a) cyclophosphamide
b) tamoxifen
c) trastuzumab
d) pamidronate
The authors’ observations
Recent evidence suggests that tamoxifen reduces symptoms of bipolar mania more rapidly than many standard medications for bipolar disorder. Tamoxifen is the only available centrally active protein kinase C (PKC) inhibitor,7 although lithium and valproic acid also might inhibit PKC activity. PKC regulates presynaptic and postsynaptic neurotransmission, neuronal excitability, and neurotransmitter release. PKC is thought to be overactive during mania, possibly because of an increase in membrane-bound PKC and PKC translocation from the cytosol to membrane.7,8
Preliminary clinical trials suggest that tamoxifen significantly reduces manic symptoms in patients with bipolar disorder within 5 days of initiation.7 These findings have been confirmed in animal studies and in 1 single-blind and 4 double-blind placebo-controlled clinical studies over the past 15 years.9
Tamoxifen is a selective estrogen-receptor modulator used to prevent recurrence in receptor-positive breast cancer. Cytochrome P450 (CYP) 2D6 is the principal enzyme that converts tamoxifen to its active metabolite, endoxifen. Inhibition of tamoxifen conversion to endoxifen by CYP2D6 inhibitors could decrease the efficacy of tamoxifen therapy and might increase the risk of breast cancer recurrence. Although antidepressants generally are not recommended as a first-line agent for bipolar disorder, several selective serotonin reuptake inhibitors and serotonin-norepinephrine reuptake inhibitors are potent, moderate, or mild inhibitors of CYP2D610 (Table 1). Approximately 7% of women have nonfunctional CYP2D6 alleles and have a lower endoxifen level.11
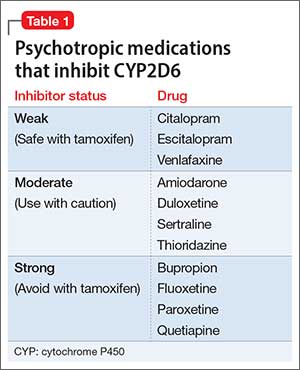
Treating breast cancer
The mainstays of breast cancer treatment are surgery, radiation therapy, chemotherapy, hormone therapy, and targeted monoclonal antibody therapy. The protocol of choice depends on the stage of cancer, estrogen receptor status, expression of human epidermal growth factor receptor 2 (HER-2), treatment history, and the patient’s menopausal status. Overexpression of HER-2 oncoprotein, found in 25% to 30% of breast cancers, has been shown to promote cell transformation. HER-2 overexpression is associated with aggressive tumor phenotypes, lymph node involvement, and resistance to chemotherapy and endocrine therapy. Therefore, the HER-2 oncoprotein is a key target for treatment. Often, several therapies are combined to prevent recurrence of disease.
Breast cancer treatment often can cause demoralization, menopausal symptoms, sleep disturbance, impaired sexual function, infertility, and disturbed body image. It also can trigger psychiatric symptoms in patients with, or without, a history of mental illness.
Trastuzumab is a recombinant humanized monoclonal antibody against HER-2, and is approved for treating HER-2 positive breast cancer. However, approximately 50% of patients with HER-2 overexpression do not respond to trastuzumab alone or combined with chemotherapy, and nearly all patients develop resistance to trastuzumab, leading to recurrence.12 This medication is still used in practice, and research regarding antiepileptic drugs working in synergy with this monoclonal antibody is underway.
OUTCOME Stability achieved
Quetiapine and valproic acid are first-line choices for Ms. A because (1) she would be on long-term tamoxifen to maintain cancer remission maintenance and (2) she is in a manic phase of bipolar disorder. Tamoxifen also could improve her manic symptoms. This medication regimen might enhance the action of cancer treatments and also could reduce adverse effects of cancer treatment, such as insomnia associated with tamoxifen.
After the team educates Ms. A about how her psychiatric medications could benefit her cancer treatment, she becomes more motivated to stay on her regimen. Ms. A does well on these medications and after 18 months has not experienced exacerbation of psychiatric symptoms or recurrence of cancer.
The authors’ observations
There are 3 major classes of mood stabilizers for treating bipolar disorder: lithium, antiepileptic drugs, and atypical antipsychotics.13 In a setting of cancer, mood stabilizers are prescribed for managing mania or drug-induced agitation or anxiety associated with steroid use, brain metastases, and other medical conditions. They also can be used to treat neuropathic pain and hot flashes and seizure prophylaxis.13
Valproic acid
Valproic acid can help treat mood lability, impulsivity, and disinhibition, whether these symptoms are due to primary psychiatric illness or secondary to cancer metastasis. It is a first-line agent for manic and mixed bipolar states, and can be titrated quickly to achieve optimal benefit. Valproic acid also has been described as a histone deacetylase (HDAC) inhibitor, known to attenuate apoptotic activity, making it of interest as a treatment for cancer.14 HDAC inhibitors have been shown to:
- induce differentiation and cell cycle arrest
- activate the extrinsic or intrinsic pathways of apoptosis
- inhibit invasion, migration, and angiogenesis in different cancer cell lines.15
In regard to breast cancer, valproic acid inhibits growth of cell lines independent of estrogen receptors, increases the action of such breast cancer treatments as tamoxifen, raloxifene, fulvestrant, and letrozole, and induces solid tumor regression.14 Valproic acid also reduces cancer cell viability and could act as a powerful antiproliferative agent in estrogen-sensitive breast cancer cells.16
Valproic acid reduces cell growth-inducing apoptosis and cell cycle arrest in ERα-positive breast cancer cells, although it has no significant apoptotic effect in ERα-negative cells.16 However, evidence does support the ability of valproic acid to restore an estrogen-sensitive phenotype in ERα-negative breast cancer cells, allowing successful treatment with the anti-estrogen tamoxifen in vitro.10
Antipsychotics
Antipsychotics act as dopamine D2 receptor antagonists within the hypothalamic-pituitary-adrenal axis, thus increasing the serum prolactin level. Among atypicals, risperidone and its active metabolite, paliperidone, produce the greatest increase in the prolactin level, whereas quetiapine, clozapine, and aripiprazole minimally elevate the prolactin level.
Hyperprolactinemia correlates with rapid breast cancer progression and inferior prognosis, regardless of breast cancer receptor typing. Therefore, prolactin-sparing antipsychotics are preferred when treating a patient with comorbid bipolar disorder and breast cancer. Checking the serum prolactin level might help guide treatment. The literature is mixed regarding antipsychotic use and new mammary tumorigenesis; current research does not support antipsychotic choice based on future risk of breast cancer.6
Other adverse effects from antipsychotic use for bipolar disorder could have an impact on patients with breast cancer. Several of these medications could ameliorate side effects of advanced cancer and chemotherapy. Quetiapine, for example, might improve tamoxifen-induced insomnia in women with breast cancer because of its high affinity for serotonergic receptors, thus enhancing central serotonergic neurotransmitters and decreasing excitatory glutamatergic transmission.17
In any type of advanced cancer, nausea and vomiting are common, independent of chemotherapy and medication regimens. Metabolic derangement, vestibular dysfunction, CNS disorders, and visceral metastasis all contribute to hyperemesis. Olanzapine has been shown to significantly reduce refractory nausea and can cause weight gain and improved appetite, which benefits cachectic patients.18
Last, clozapine is one of the more effective antipsychotic medications, but also carries a risk of neutropenia. In patients with neutropenia secondary to chemotherapy, clozapine could increase the risk of infection in an immunocompromised patient.19 Granulocyte colony stimulating factor might be useful as a rescue medication for treatment-emergent neutropenia.19
Treatment considerations
Cancer patients might be unable or unwilling to seek services for mental health during their cancer treatment, and many who have a diagnosis of psychiatric illness might stop following up with psychiatric care when cancer treatment takes priority. It is critical for clinicians to be aware of the current literature regarding the impact of mood-stabilizing medication on cancer treatment. Monitoring for drug interactions is essential, and electronic drug interaction tools, such as Lexicomp, may be useful for this purpose.13 Because of special vulnerabilities in this population, cautious and judicious prescribing practices are advised.
The risk-benefit profile for medications for bipolar disorder must be considered before they are initiated or changes are made to the regimen (Table 2). Changing an effective mood stabilizer to gain benefits in breast cancer prognosis is not recommended in most cases, because benefits have been shown to be only significant in preclinical research; currently, there are no clinical guidelines. However, medication adjustments should be made with these theoretical benefits in mind, as long as the treatment of bipolar disorder remains effective.
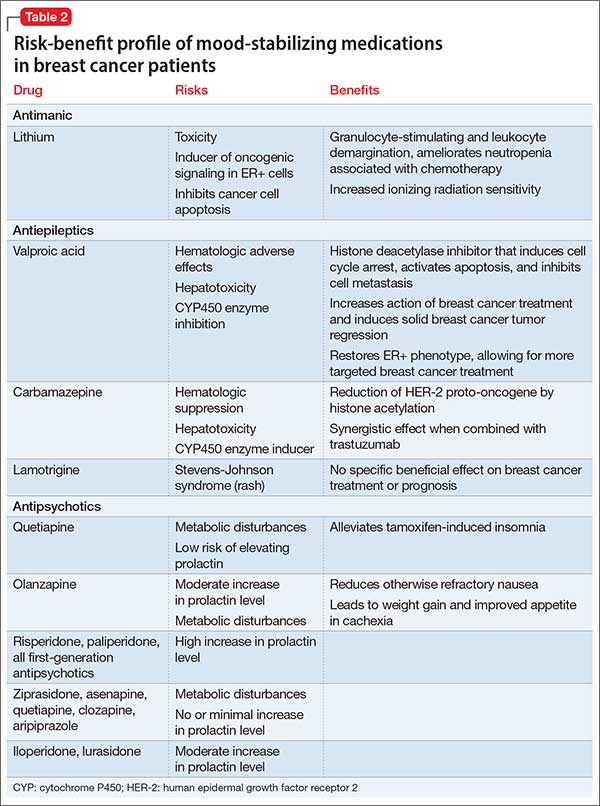
Regardless of what treatment regimen the health team decides on, several underlying issues that affect patient care must be considered in this population. Successfully treating breast cancer in a woman with severe mental illness only can be accomplished when her mental illness is under control. Once she is psychiatrically stable, it is important for her to have a basic understanding of how cancer can affect the body and know the reasons behind treatment.
It is imperative that physicians provide their patients with a general understanding of their comorbid disorders, and find ways to help patients remain adherent with treatment of both diseases. Many patients feel demoralized by a cancer diagnosis and adherence to a medication regimen might be a difficult task among those with bipolar disorder who also are socially isolated, lack education, or have poor recall of treatment recommendations.20
Bottom Line
Managing comorbid bipolar disorder and breast cancer might seem daunting,
but treatments for the 2 diseases can work in synergy. You have an opportunity to
educate patients and colleagues in treating bipolar disorder and comorbid breast
cancer. Optimizing care using known psychopharmacologic data can not only lead
to better outcomes, but might additionally offer some hope and reason to remain
treatment-adherent for patients suffering from this complex comorbidity.
Related Resources
• Agarwala P, Riba MB. Tailoring depression treatment for women with breast cancer. Current Psychiatry. 2010;9(11): 39-40,45-46,48-49.
• Cunningham R, Sarfati D, Stanley J, et al. Cancer survival in the context of mental illness: a national cohort study. Gen Hosp Psychiatry. 2015;37(6):501-506.
Drug Brand Names
Amiodarone • Cordarone
Aripiprazole • Abilify
Asenapine • Saphris
Bupropion • Wellbutrin
Carbamazepine • Tegretol
Citalopram • Celexa
Clozapine • Clozaril
Cyclophosphamide • Cytoxan, Neosar
Doxorubicin • Doxil, Adriamycin
Duloxetine • Cymbalta
Escitalopram • Lexapro
Fluoxetine • Prozac
Fulvestrant • Faslodex
Iloperidone • Fanapt
Lamotrigine • Lamictal
Letrozole • Femara
Lithium • Eskalith, Lithobid
Lurasidone • Latuda
Olanzapine • Zyprexa
Paclitaxel • Onxol
Paliperidone • Invega
Pamidronate • Aredia
Paroxetine • Paxil
Quetiapine • Seroquel
Raloxifene • Evista
Risperidone • Risperdal
Sertraline • Zoloft
Tamoxifen • Nolvadex
Thioridazine • Mellaril
Trastuzumab • Herceptin
Valproic acid • Depakene
Venlafaxine • Effexor
Ziprasidone • Geodon
Disclosures
The authors report no financial relationships with any company whose products are mentioned in this article or with manufacturers of competing products.
1. Jemal A, Bray F, Center MM, et al. Global cancer statistics. CA Cancer J Clin. 2011;61(2):69-90.
2. American Cancer Society. Cancer facts and figures 2014. Atlanta, GA: American Cancer Society; 2014.
3. BarChana M, Levav I, Lipshitz I, et al. Enhanced cancer risk among patients with bipolar disorder. J Affect Disord. 2008;108(1-2):43-48.
4. Hung YP, Liu CJ, Tsai CF, et al. Incidence and risk of mood disorders in patients with breast cancers in Taiwan: a nationwide population-based study. Psychooncology. 2013;22(10):2227-2234.
5. Tesli M, Athanasiu L, Mattingsdal M, et al. Association analysis of PALB2 and BRCA2 in bipolar disorder and schizophrenia in a scandinavian case–control sample. Am J Med Genet B Neuropsychiatr Genet. 2010;153B(7):1276-1282.
6. Rahman T, Clevenger CV, Kaklamani V, et al. Antipsychotic treatment in breast cancer patients. Am J Psychiatry. 2014;171(6):616-621.
7. Armani F, Andersen ML, Galduróz JC. Tamoxifen use for the management of mania: a review of current preclinical evidence. Psychopharmacology (Berl). 2014;231(4):639-649.
8. Zarate CA Jr, Singh JB, Carlson PJ, et al. Efficacy of a protein kinase C inhibitor (tamoxifen) in the treatment of acute mania: a pilot study. Bipolar Disord. 2007;9(6):561-570.
9. Zarate CA, Manji HK. Protein kinase C inhibitors: rationale for use and potential in the treatment of bipolar disorder. CNS Drugs. 2009;23(7):569-582.
10. Fortunati N, Bertino S, Costantino L, et al. Valproic acid restores ER alpha and antiestrogen sensitivity to ER alpha-negative breast cancer cells. Mol Cell Endocrinol. 2010;314(1):17-22.
11. Thekdi SM, Trinidad A, Roth A. Psychopharmacology in cancer. Curr Psychiatry Rep. 2014;17(1):529.
12. Meng Q, Chen X, Sun L, et al. Carbamazepine promotes Her-2 protein degradation in breast cancer cells by modulating HDAC6 activity and acetylation of Hsp90. Mol Cell Biochem. 2011;348(1-2):165-171.
13. Altamura AC, Lietti L, Dobrea C, et al. Mood stabilizers for patients with bipolar disorder: the state of the art. Expert Rev Neurother. 2011;11(1):85-99.
14. Chateauvieux S, Morceau F, Dicato M, et al. Molecular and therapeutic potential and toxicity of valproic acid [published online July 29, 2010]. J Biomed Biotechnol. doi: 10.1155/2010/479364.
15. Jafary H, Ahmadian S, Soleimani M. The enhanced apoptosis and antiproliferative response to combined treatment with valproate and nicotinamide in MCF-7 breast cancer cells. Tumour Biol. 2013;35(3):2701-2710.
16. Fortunati N, Bertino S, Costantino L, et al. Valproic acid is a selective antiproliferative agent in estrogen-sensitive breast cancer cells. Cancer Lett. 2008;259(2):156-164.
17. Pasquini M, Speca A, Biondi M. Quetiapine for tamoxifen-induced insomnia in women with breast cancer. Psychosomatics. 2009;50(2):159-161.
18. Srivastava M, Brito-Dellan N, Davis MP, et al. Olanzapine as an antiemetic in refractory nausea and vomiting in advanced cancer. J Pain Symptom Manage. 2003;25(6):578-582.
19. Sankaranarayanan A, Mulchandani M, Tirupati S. Clozapine, cancer chemotherapy and neutropenia - dilemmas in management. Psychiatr Danub. 2013;25(4):419-422.
20. Cole M, Padmanabhan A. Breast cancer treatment of women with schizophrenia and bipolar disorder from Philadelphia, PA: lessons learned and suggestions for improvement. J Cancer Educ. 2012;27(4):774-779.
CASE Diagnosis, mood changes
Ms. A, age 58, is a white female with a history of chronic bipolar I disorder who is being evaluated as a new patient in an academic psychiatric clinic. Recently, she was diagnosed with ER+, PR+, and HER2+ ductal carcinoma. She does not take her prescribed mood stabilizers.
After her cancer diagnosis, Ms. A experiences new-onset agitation, including irritable mood, suicidal thoughts, tearfulness, decreased need for sleep, fast speech, excessive spending, and anorexia. She reports that she hears the voice of God telling her that she could cure her breast cancer through prayer and herbal remedies. Her treatment team, comprising her primary care provider and surgical oncologist, consider several medication adjustments, but are unsure of their effects on Ms. A’s mental health, progression of cancer, and cancer treatment.
What is the most likely cause of Ms. A’s psychiatric symptoms?
a) anxiety from having a diagnosis of cancer
b) stress reaction
c) panic attack
d) manic or mixed phase of bipolar I disorder
The authors’ observations
Treating breast cancer with concurrent severe mental illness is complex and challenging for the patient, family, and health care providers. Mental health and oncology clinicians must collaborate when treating these patients because of overlapping pathophysiology and medication interactions. A comprehensive evaluation is required to tease apart whether a patient is simply demoralized by her new diagnosis, or if a more serious mood disorder is present.
Worldwide, breast cancer is the most frequently diagnosed cancer and the leading cause of cancer death among women.1 The mean age of women diagnosed with breast cancer is 61 years; 61% of these women are alive 15 years after diagnosis, representing the largest group of female cancer survivors.
The incidence of breast cancer is reported to be higher in women with bipolar disorder compared with the general population.2-4 This positive correlation might be associated with a high rate of smoking, poor health-related behaviors, and, possibly, medication side effects. A genome-wide association study found significant associations between bipolar disorder and the breast cancer-related genes BRCA2 and PALB2.5
Antipsychotics and prolactin
Antipsychotics play an important role in managing bipolar disorder; several, however, are known to raise the serum prolactin level 10- to 20-fold. A high prolactin level could be associated with progression of breast cancer. All antipsychotics have label warnings regarding their use in women with breast cancer.
The prolactin receptor is overexpressed in >95% of breast cancer cells, regardless of estrogen-receptor status. The role of prolactin in development of new breast cancer is open to debate. The effect of a high prolactin level in women with diagnosed breast cancer is unknown, although available preclinical data suggest that high levels should be avoided. Psychiatric clinicians should consider checking the serum prolactin level or switching to a treatment strategy that avoids iatrogenic prolactin elevation. This risk must be carefully weighed against the mood-stabilizing properties of antipsychotics.6
TREATMENT Consider comorbidities
Ms. A receives supportive psychotherapy in addition to quetiapine, 400 mg/d, and valproic acid, 1,500 mg/d. This regimen helps her successfully complete the initial phase of breast cancer treatment, which consists of a single mastectomy, adjuvant chemotherapy (doxorubicin and cyclophosphamide followed by paclitaxel and trastuzumab). She is now on endocrine therapy with tamoxifen.
Ms. A, calm, much improved mood symptoms, and euthymic, has questions regarding her mental health, cancer prognosis, and potential medication side effects with continued cancer treatment.
Which drug used to treat breast cancer might relieve Ms. A’s manic symptoms?
a) cyclophosphamide
b) tamoxifen
c) trastuzumab
d) pamidronate
The authors’ observations
Recent evidence suggests that tamoxifen reduces symptoms of bipolar mania more rapidly than many standard medications for bipolar disorder. Tamoxifen is the only available centrally active protein kinase C (PKC) inhibitor,7 although lithium and valproic acid also might inhibit PKC activity. PKC regulates presynaptic and postsynaptic neurotransmission, neuronal excitability, and neurotransmitter release. PKC is thought to be overactive during mania, possibly because of an increase in membrane-bound PKC and PKC translocation from the cytosol to membrane.7,8
Preliminary clinical trials suggest that tamoxifen significantly reduces manic symptoms in patients with bipolar disorder within 5 days of initiation.7 These findings have been confirmed in animal studies and in 1 single-blind and 4 double-blind placebo-controlled clinical studies over the past 15 years.9
Tamoxifen is a selective estrogen-receptor modulator used to prevent recurrence in receptor-positive breast cancer. Cytochrome P450 (CYP) 2D6 is the principal enzyme that converts tamoxifen to its active metabolite, endoxifen. Inhibition of tamoxifen conversion to endoxifen by CYP2D6 inhibitors could decrease the efficacy of tamoxifen therapy and might increase the risk of breast cancer recurrence. Although antidepressants generally are not recommended as a first-line agent for bipolar disorder, several selective serotonin reuptake inhibitors and serotonin-norepinephrine reuptake inhibitors are potent, moderate, or mild inhibitors of CYP2D610 (Table 1). Approximately 7% of women have nonfunctional CYP2D6 alleles and have a lower endoxifen level.11
Treating breast cancer
The mainstays of breast cancer treatment are surgery, radiation therapy, chemotherapy, hormone therapy, and targeted monoclonal antibody therapy. The protocol of choice depends on the stage of cancer, estrogen receptor status, expression of human epidermal growth factor receptor 2 (HER-2), treatment history, and the patient’s menopausal status. Overexpression of HER-2 oncoprotein, found in 25% to 30% of breast cancers, has been shown to promote cell transformation. HER-2 overexpression is associated with aggressive tumor phenotypes, lymph node involvement, and resistance to chemotherapy and endocrine therapy. Therefore, the HER-2 oncoprotein is a key target for treatment. Often, several therapies are combined to prevent recurrence of disease.
Breast cancer treatment often can cause demoralization, menopausal symptoms, sleep disturbance, impaired sexual function, infertility, and disturbed body image. It also can trigger psychiatric symptoms in patients with, or without, a history of mental illness.
Trastuzumab is a recombinant humanized monoclonal antibody against HER-2, and is approved for treating HER-2 positive breast cancer. However, approximately 50% of patients with HER-2 overexpression do not respond to trastuzumab alone or combined with chemotherapy, and nearly all patients develop resistance to trastuzumab, leading to recurrence.12 This medication is still used in practice, and research regarding antiepileptic drugs working in synergy with this monoclonal antibody is underway.
OUTCOME Stability achieved
Quetiapine and valproic acid are first-line choices for Ms. A because (1) she would be on long-term tamoxifen to maintain cancer remission maintenance and (2) she is in a manic phase of bipolar disorder. Tamoxifen also could improve her manic symptoms. This medication regimen might enhance the action of cancer treatments and also could reduce adverse effects of cancer treatment, such as insomnia associated with tamoxifen.
After the team educates Ms. A about how her psychiatric medications could benefit her cancer treatment, she becomes more motivated to stay on her regimen. Ms. A does well on these medications and after 18 months has not experienced exacerbation of psychiatric symptoms or recurrence of cancer.
The authors’ observations
There are 3 major classes of mood stabilizers for treating bipolar disorder: lithium, antiepileptic drugs, and atypical antipsychotics.13 In a setting of cancer, mood stabilizers are prescribed for managing mania or drug-induced agitation or anxiety associated with steroid use, brain metastases, and other medical conditions. They also can be used to treat neuropathic pain and hot flashes and seizure prophylaxis.13
Valproic acid
Valproic acid can help treat mood lability, impulsivity, and disinhibition, whether these symptoms are due to primary psychiatric illness or secondary to cancer metastasis. It is a first-line agent for manic and mixed bipolar states, and can be titrated quickly to achieve optimal benefit. Valproic acid also has been described as a histone deacetylase (HDAC) inhibitor, known to attenuate apoptotic activity, making it of interest as a treatment for cancer.14 HDAC inhibitors have been shown to:
- induce differentiation and cell cycle arrest
- activate the extrinsic or intrinsic pathways of apoptosis
- inhibit invasion, migration, and angiogenesis in different cancer cell lines.15
In regard to breast cancer, valproic acid inhibits growth of cell lines independent of estrogen receptors, increases the action of such breast cancer treatments as tamoxifen, raloxifene, fulvestrant, and letrozole, and induces solid tumor regression.14 Valproic acid also reduces cancer cell viability and could act as a powerful antiproliferative agent in estrogen-sensitive breast cancer cells.16
Valproic acid reduces cell growth-inducing apoptosis and cell cycle arrest in ERα-positive breast cancer cells, although it has no significant apoptotic effect in ERα-negative cells.16 However, evidence does support the ability of valproic acid to restore an estrogen-sensitive phenotype in ERα-negative breast cancer cells, allowing successful treatment with the anti-estrogen tamoxifen in vitro.10
Antipsychotics
Antipsychotics act as dopamine D2 receptor antagonists within the hypothalamic-pituitary-adrenal axis, thus increasing the serum prolactin level. Among atypicals, risperidone and its active metabolite, paliperidone, produce the greatest increase in the prolactin level, whereas quetiapine, clozapine, and aripiprazole minimally elevate the prolactin level.
Hyperprolactinemia correlates with rapid breast cancer progression and inferior prognosis, regardless of breast cancer receptor typing. Therefore, prolactin-sparing antipsychotics are preferred when treating a patient with comorbid bipolar disorder and breast cancer. Checking the serum prolactin level might help guide treatment. The literature is mixed regarding antipsychotic use and new mammary tumorigenesis; current research does not support antipsychotic choice based on future risk of breast cancer.6
Other adverse effects from antipsychotic use for bipolar disorder could have an impact on patients with breast cancer. Several of these medications could ameliorate side effects of advanced cancer and chemotherapy. Quetiapine, for example, might improve tamoxifen-induced insomnia in women with breast cancer because of its high affinity for serotonergic receptors, thus enhancing central serotonergic neurotransmitters and decreasing excitatory glutamatergic transmission.17
In any type of advanced cancer, nausea and vomiting are common, independent of chemotherapy and medication regimens. Metabolic derangement, vestibular dysfunction, CNS disorders, and visceral metastasis all contribute to hyperemesis. Olanzapine has been shown to significantly reduce refractory nausea and can cause weight gain and improved appetite, which benefits cachectic patients.18
Last, clozapine is one of the more effective antipsychotic medications, but also carries a risk of neutropenia. In patients with neutropenia secondary to chemotherapy, clozapine could increase the risk of infection in an immunocompromised patient.19 Granulocyte colony stimulating factor might be useful as a rescue medication for treatment-emergent neutropenia.19
Treatment considerations
Cancer patients might be unable or unwilling to seek services for mental health during their cancer treatment, and many who have a diagnosis of psychiatric illness might stop following up with psychiatric care when cancer treatment takes priority. It is critical for clinicians to be aware of the current literature regarding the impact of mood-stabilizing medication on cancer treatment. Monitoring for drug interactions is essential, and electronic drug interaction tools, such as Lexicomp, may be useful for this purpose.13 Because of special vulnerabilities in this population, cautious and judicious prescribing practices are advised.
The risk-benefit profile for medications for bipolar disorder must be considered before they are initiated or changes are made to the regimen (Table 2). Changing an effective mood stabilizer to gain benefits in breast cancer prognosis is not recommended in most cases, because benefits have been shown to be only significant in preclinical research; currently, there are no clinical guidelines. However, medication adjustments should be made with these theoretical benefits in mind, as long as the treatment of bipolar disorder remains effective.
Regardless of what treatment regimen the health team decides on, several underlying issues that affect patient care must be considered in this population. Successfully treating breast cancer in a woman with severe mental illness only can be accomplished when her mental illness is under control. Once she is psychiatrically stable, it is important for her to have a basic understanding of how cancer can affect the body and know the reasons behind treatment.
It is imperative that physicians provide their patients with a general understanding of their comorbid disorders, and find ways to help patients remain adherent with treatment of both diseases. Many patients feel demoralized by a cancer diagnosis and adherence to a medication regimen might be a difficult task among those with bipolar disorder who also are socially isolated, lack education, or have poor recall of treatment recommendations.20
Bottom Line
Managing comorbid bipolar disorder and breast cancer might seem daunting,
but treatments for the 2 diseases can work in synergy. You have an opportunity to
educate patients and colleagues in treating bipolar disorder and comorbid breast
cancer. Optimizing care using known psychopharmacologic data can not only lead
to better outcomes, but might additionally offer some hope and reason to remain
treatment-adherent for patients suffering from this complex comorbidity.
Related Resources
• Agarwala P, Riba MB. Tailoring depression treatment for women with breast cancer. Current Psychiatry. 2010;9(11): 39-40,45-46,48-49.
• Cunningham R, Sarfati D, Stanley J, et al. Cancer survival in the context of mental illness: a national cohort study. Gen Hosp Psychiatry. 2015;37(6):501-506.
Drug Brand Names
Amiodarone • Cordarone
Aripiprazole • Abilify
Asenapine • Saphris
Bupropion • Wellbutrin
Carbamazepine • Tegretol
Citalopram • Celexa
Clozapine • Clozaril
Cyclophosphamide • Cytoxan, Neosar
Doxorubicin • Doxil, Adriamycin
Duloxetine • Cymbalta
Escitalopram • Lexapro
Fluoxetine • Prozac
Fulvestrant • Faslodex
Iloperidone • Fanapt
Lamotrigine • Lamictal
Letrozole • Femara
Lithium • Eskalith, Lithobid
Lurasidone • Latuda
Olanzapine • Zyprexa
Paclitaxel • Onxol
Paliperidone • Invega
Pamidronate • Aredia
Paroxetine • Paxil
Quetiapine • Seroquel
Raloxifene • Evista
Risperidone • Risperdal
Sertraline • Zoloft
Tamoxifen • Nolvadex
Thioridazine • Mellaril
Trastuzumab • Herceptin
Valproic acid • Depakene
Venlafaxine • Effexor
Ziprasidone • Geodon
Disclosures
The authors report no financial relationships with any company whose products are mentioned in this article or with manufacturers of competing products.
1. Jemal A, Bray F, Center MM, et al. Global cancer statistics. CA Cancer J Clin. 2011;61(2):69-90.
2. American Cancer Society. Cancer facts and figures 2014. Atlanta, GA: American Cancer Society; 2014.
3. BarChana M, Levav I, Lipshitz I, et al. Enhanced cancer risk among patients with bipolar disorder. J Affect Disord. 2008;108(1-2):43-48.
4. Hung YP, Liu CJ, Tsai CF, et al. Incidence and risk of mood disorders in patients with breast cancers in Taiwan: a nationwide population-based study. Psychooncology. 2013;22(10):2227-2234.
5. Tesli M, Athanasiu L, Mattingsdal M, et al. Association analysis of PALB2 and BRCA2 in bipolar disorder and schizophrenia in a scandinavian case–control sample. Am J Med Genet B Neuropsychiatr Genet. 2010;153B(7):1276-1282.
6. Rahman T, Clevenger CV, Kaklamani V, et al. Antipsychotic treatment in breast cancer patients. Am J Psychiatry. 2014;171(6):616-621.
7. Armani F, Andersen ML, Galduróz JC. Tamoxifen use for the management of mania: a review of current preclinical evidence. Psychopharmacology (Berl). 2014;231(4):639-649.
8. Zarate CA Jr, Singh JB, Carlson PJ, et al. Efficacy of a protein kinase C inhibitor (tamoxifen) in the treatment of acute mania: a pilot study. Bipolar Disord. 2007;9(6):561-570.
9. Zarate CA, Manji HK. Protein kinase C inhibitors: rationale for use and potential in the treatment of bipolar disorder. CNS Drugs. 2009;23(7):569-582.
10. Fortunati N, Bertino S, Costantino L, et al. Valproic acid restores ER alpha and antiestrogen sensitivity to ER alpha-negative breast cancer cells. Mol Cell Endocrinol. 2010;314(1):17-22.
11. Thekdi SM, Trinidad A, Roth A. Psychopharmacology in cancer. Curr Psychiatry Rep. 2014;17(1):529.
12. Meng Q, Chen X, Sun L, et al. Carbamazepine promotes Her-2 protein degradation in breast cancer cells by modulating HDAC6 activity and acetylation of Hsp90. Mol Cell Biochem. 2011;348(1-2):165-171.
13. Altamura AC, Lietti L, Dobrea C, et al. Mood stabilizers for patients with bipolar disorder: the state of the art. Expert Rev Neurother. 2011;11(1):85-99.
14. Chateauvieux S, Morceau F, Dicato M, et al. Molecular and therapeutic potential and toxicity of valproic acid [published online July 29, 2010]. J Biomed Biotechnol. doi: 10.1155/2010/479364.
15. Jafary H, Ahmadian S, Soleimani M. The enhanced apoptosis and antiproliferative response to combined treatment with valproate and nicotinamide in MCF-7 breast cancer cells. Tumour Biol. 2013;35(3):2701-2710.
16. Fortunati N, Bertino S, Costantino L, et al. Valproic acid is a selective antiproliferative agent in estrogen-sensitive breast cancer cells. Cancer Lett. 2008;259(2):156-164.
17. Pasquini M, Speca A, Biondi M. Quetiapine for tamoxifen-induced insomnia in women with breast cancer. Psychosomatics. 2009;50(2):159-161.
18. Srivastava M, Brito-Dellan N, Davis MP, et al. Olanzapine as an antiemetic in refractory nausea and vomiting in advanced cancer. J Pain Symptom Manage. 2003;25(6):578-582.
19. Sankaranarayanan A, Mulchandani M, Tirupati S. Clozapine, cancer chemotherapy and neutropenia - dilemmas in management. Psychiatr Danub. 2013;25(4):419-422.
20. Cole M, Padmanabhan A. Breast cancer treatment of women with schizophrenia and bipolar disorder from Philadelphia, PA: lessons learned and suggestions for improvement. J Cancer Educ. 2012;27(4):774-779.

Agitated and hallucinating, with a throbbing headache
CASE Psychotic, and nonadherent
Mr. K, a 42-year-old Fijian man, is brought to the emergency department by his older brother for evaluation of behavioral agitation. Mr. K is belligerent and threatens to kill his family members. Three years earlier, he was given a diagnosis of schizophrenia and treated at an inpatient psychiatric unit.
At that time, Mr. K was stabilized on risperidone, 4 mg/d. However, he did not follow-up with treatment after discharge and has not taken any psychotropic medications since that time.
His brother reports that Mr. K has been slowly deteriorating, talking to himself, staying up at night, and getting into arguments with his family over his delusional beliefs. Although Mr. K once worked as a security guard, he has not worked in 8 years. He has been living with his family, who are no longer willing to accept him into their home because they fear he might harm them.
In the emergency department, Mr. K reports that he has a throbbing headache. Blood pressure is 177/101 mm Hg; heart rate is 103 beats per minute; respiratory rate is 18 breaths per minute; weight is 185 lb; and body mass index (BMI) is 31.8. Physical examination is unremarkable.
Laboratory values show that sodium is 131 mEq/L; potassium, 3.7 mEq/L; bicarbonate, 26 mEq/L; glucose, 420 mg/dL; hemoglobin A1c,12.7; and urine glucose, 3+. Mr. K denies being told he has diabetes.
What are Mr. K’s risk factors for diabetes?
a) schizophrenia
b) physical inactivity
c) obesity
d) Fijian ethnicity
e) all of the above
The authors’ observations
The prevalence of type 2 diabetes mellitus (T2DM) in persons with schizophrenia or a schizoaffective disorder is twice that of the general population.1-4 Multiple variables contribute to the increased prevalence of diabetes in this population, including genetic predisposition, environmental and cultural factors related to diet and physical activity, a high rate of smoking,5,6 iatrogenic causes (metabolic dysregulation and weight gain from antipsychotic treatment), and socioeconomic factors (poverty, lack of access to health care). In addition, symptoms of psychosis such as thought disorder, delusions, hallucinations, and cognitive decline in persons with chronic schizophrenia and schizoaffective disorder can make basic health maintenance difficult.
In Mr. K’s case, premorbid risk of diabetes was elevated because of his Fijian ethnicity.7 With a BMI of 31.8, obesity further increased that risk.5,6,8 In addition, his untreated chronic mental illness, lack of access to health care, low socioeconomic status, long-standing smoking habit, and previous exposure to antipsychotics also increased his risk of T2DM.
The interaction between diabetes and psychosis contributes to a vicious cycle that makes both conditions worse if either, or both, are untreated. In general, medical comorbidities are associated with depression and neurocognitive impairment in persons with schizophrenia.9 Specifically, diabetes is associated with lower global cognitive functioning among persons with schizophrenia.10 Poor cognitive functioning can, in turn, decrease the patient’s ability to manage his medical illness. Also, persons with schizophrenia are less likely to be treated for diabetes, dyslipidemia, and hypertension, as in Mr. K’s case.11
How would you treat Mr. K’s newly diagnosed diabetes?
a) refer him to a primary care physician
b) start an oral agent
c) start sliding-scale insulin
d) start long-acting insulin
e) recommend a carbohydrate-controlled diet=
TREATMENT Stabilization
Mr. K is admitted to the medical unit for treatment of hyperglycemia. The team starts him on amlodipine, 5 mg/d, for hypertension; aripiprazole, 10 mg/d, for psychosis; and sliding-scale insulin (lispro) and 20 units of insulin (glargine) nightly for diabetes. Mr. K’s blood glucose level is well regulated on this regimen; after being medically cleared, he is transferred to the inpatient psychiatric unit.
EVALUATION Denies symptoms
Mr. K appears older than his stated age, is poorly groomed, and is dressed in a hospital gown. He is isolated and appears to be internally preoccupied. He repeatedly denies hearing auditory hallucinations, but often is overheard responding to internal stimuli and mumbling indecipherably in a low tone. His speech is decreased and his affect is flat and guarded. He states that he is not “mental” but that he came to the hospital for “tooth pain.” Every day he asks when he can return home and he asks the staff to call his family to take him home. When informed that his family is not able to care for him, Mr. K states that he would live in a house he owns in Fiji, which his family members state is untrue.
How would you treat Mr. K’s psychosis?
a) continue aripiprazole
b) switch to risperidone, an agent to which he previously responded
c) switch to olanzapine because he has not been sleeping well
d) switch to haloperidol because of diabetes
The authors’ observations
Pharmacotherapy for patients with comorbid schizophrenia and diabetes requires consideration of clinical and psychosocial factors unique to this population.
Antipsychotic choice
Selection of an antipsychotic agent to address psychosis requires considering its efficacy, side-effect profile, and adherence rates, as well as its potential effects on metabolic regulation and weight (Table 1). Typical antipsychotics are less likely than atypical antipsychotics to cause metabolic dysregulation.12 When treatment with atypical antipsychotics cannot be avoided—such as when side effects or an allergic reaction develop—consider selecting a relatively weight-neutral drug with a lower potential for metabolic dysregulation, such as aripiprazole. However, many times, using an agent with significant effects on metabolic regulation cannot be avoided, making treating and monitoring the resulting metabolic effects even more significant.
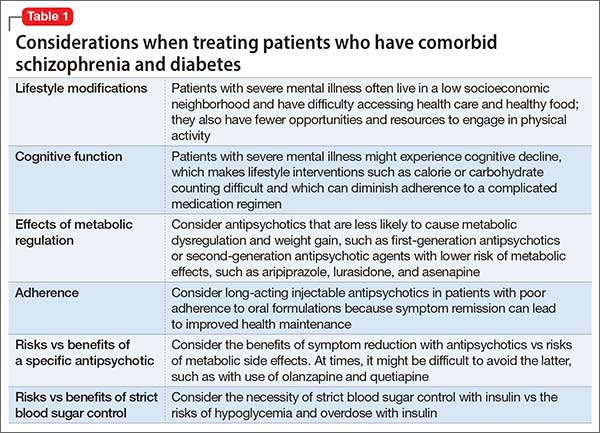
Glycemic control
Initiating an agent for glycemic control in persons with newly diagnosed diabetes requires weighing many factors, including mode of delivery (oral or subcutaneous), level of glycemic control required, comorbid medical illness (such as renal impairment and heart failure), cost, and potential long-term side effects of the medication (Table 2).13 Oral agents have a slower effect on lowering the blood glucose level, and each agent carries contraindications, but generally they are more affordable. Many present a low risk of hypoglycemia but sulfonylureas are an exception. In addition, metformin could lead to weight loss over the long term, which further lowers the risk of diabetes.

If, however, tight and immediate glycemic control is needed, subcutaneous insulin injections might be required, although this method is more costly, carries an increased risk of hypoglycemic episodes acutely, and leads to weight gain in the long run because of induced hunger and increased appetite.
Psychosocial factors
In addition to the clinical variables above, treating diabetes in patients with comorbid schizophrenia requires considering other psychosocial factors that might not be readily apparent (Table 3). For example, patients with schizophrenia might have decreased motivation, self-efficacy, and capacity for self-care when it comes to health maintenance and medication adherence.14 Chronically mentally ill persons might have reduced cognitive functioning that could affect their ability to maintain complicated medication regimens, such as administering insulin and monitoring blood glucose.
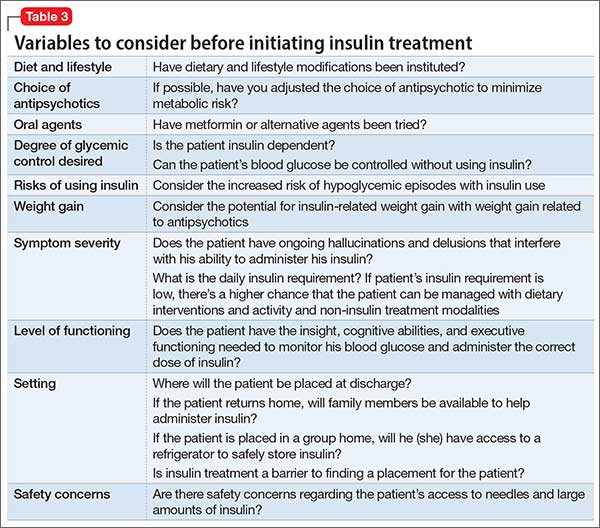
In addition, easy access to hypodermic needles and large amounts of insulin could become a safety concern in patients with ongoing hallucinations, delusions, and thought disorder, despite antipsychotic treatment. For example, a patient with schizophrenia and diabetes who has been maintained on insulin might begin hearing voices that tell her to inject her eyeballs with insulin. Similarly, although the risk of hypoglycemic episodes in patients treated with insulin is well known, patients with schizophrenia have a higher risk of acute complications of diabetes than other patients with diabetes.15Psychosocial factors, such as placement, support system, and follow-up care need to be considered. In some instances, the need to administer daily subcutaneous insulin could be a barrier to placement if the facility does not have the staff or expertise to monitor blood glucose and administer insulin.
If the patient is returning home, then the patient or a caretaker will need to be trained to monitor blood glucose and administer insulin. This might be difficult for persons with chronic mental illness who have lost the support and care of their family. Also, consider the issue of storing insulin, which requires refrigeration. Because of the potential complications involved in using insulin in patients with schizophrenia, practitioners should consider managing non-insulin dependent diabetes with an oral hypoglycemic agent, when possible, along with lifestyle modifications.
OUTCOME Weight loss, discharge
Mr. K is transitioned from aripiprazole to higher-potency oral risperidone, titrated to 6 mg/d. At this dosage, he continues to maintain a delusion about owning a house in Fiji, but was seen responding to internal stimuli less often. The treatment team places him on a diabetic and low-sodium diet of 1,800 kcal/d. His fasting blood glucose levels range in the 70s to 110s mg/dL during his first week of hospitalization.
The treatment team starts Mr. K on oral metformin, titrated to 1,000 mg twice daily, while tapering him off insulin lispro and glargine over the course of hospitalization. The transition from insulin to metformin also is considered because Mr. K’s daily insulin requirement is rather low (<0.5 units/kg).
Mr. K’s course is prolonged because his treatment team initiates the process of conservatorship and placement in the community. Approximately 6 months after his admission, Mr. K is discharged to an unlocked facility with support from an intensive outpatient mental health program. At 6 months follow-up with his outpatient provider, Mr. K’s hemoglobin A1c is 7.0 and he weighs 155 lb with a BMI of 26.5.
The authors’ observations
Despite Mr. K’s initial elevated hemoglobin A1c of 12.7 and weight of 185 lb, over approximately 6 months he experiences a 5.7-unit drop in hemoglobin A1c and weight loss of 30 lb with dietary management and metformin—without the need for other agents. Other options for weight-neutral treatment of T2DM include exenatide, which also is available as a once weekly injectable formulation, canagliflozin, and the gliptins (sitagliptin, saxagliptin, and linagliptin) (Table 4).
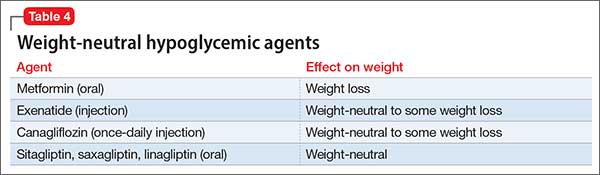
Mr. K’s improved control of his diabetes occurred despite initiation of an atypical antipsychotic, which would have been expected to cause additional weight gain and make his diabetes worse secondary to metabolic effects.12 Treatment with metformin in particular has been associated with weight loss in patients with16 and without17 comorbid schizophrenia, including those with antipsychotic-induced weight gain.18-20
Bottom Line
Persons with schizophrenia are at higher risk of type 2 diabetes mellitus for many reasons, including metabolic effects of antipsychotics, reduced cognitive functioning, poor self-care, and limited access to health care. Typical antipsychotics are less likely to cause metabolic dysregulation but, if an atypical is needed, one that is relatively weight-neutral should be selected. When choosing an agent for glycemic control, consider a patient’s or a caretaker’s ability to administer medications, monitor blood glucose, and follow dietary recommendations.
Related Resources
• Cohn T. The link between schizophrenia and diabetes. Current Psychiatry. 2012;11(10):28-34,46.
• Annamalai A, Tek C. An overview of diabetes management in schizophrenia patients: office based strategies for primary care practitioners and endocrinologists [published online March 23, 2015]. Int J Endocrinol. 2015;2015:969182. doi: 10.1155/2015/969182.
Drug Brand Names
Amlodipine • Norvasc
Aripiprazole • Abilify
Asenapine • Saphris
Canagliflozin • Invokana
Exenatide • Bydureon, Byetta
Glargine • Lantus
Linagliptin • Tradjenta
Lispro • Humalog
Lurasidone • Latuda
Metformin • Glucophage
Olanzapine • Zyprexa
Quetiapine • Seroquel
Risperidone • Risperdal
Saxagliptin • Onglyza
Sitagliptin • Januvia
Disclosures
The authors report no financial relationship with any company whose products are mentioned in this article or with manufacturers of competing products.
1. American Diabetes Association; American Psychiatric Association; American Association of Clinical Endocrinologists; North American Association for the Study of Obesity. Consensus development conference on antipsychotic drugs and obesity and diabetes. Diabetes Care. 2004;27(2):596-601.
2. Heald A. Physical health in schizophrenia: a challenge for antipsychotic therapy. Eur Psychiatry. 2010;25(suppl 2):S6-S11.
3. El-Mallakh P. Doing my best: poverty and self-care among individuals with schizophrenia and diabetes mellitus. Arch Psychiatr Nurs. 2007;21(1):49-60; discussion 61-63.
4. Rouillon F, Sorbara F. Schizophrenia and diabetes: epidemiological data. Eur Psychiatry. 2005;20(suppl 4):S345-S348.
5. Willi C, Bodenmann P, Ghali WA, et al. Active smoking and the risk of type 2 diabetes: a systematic review and meta-analysis. JAMA. 2007;298(22):2654-2664.
6. Dome P, Lazary J, Kalapos MP, et al. Smoking, nicotine and neuropsychiatric disorders. Neurosci Biobehav Rev. 2010;34(3):295-342.
7. National Institute of Diabetes and Digestive and Kidney Diseases. For people of African, Mediterranean, or Southeast Asian heritage: important information about diabetes blood tests. http://www.diabetes.niddk.nih.gov/dm/ pubs/asianamerican/index.htm. Published October 2011. Accessed November 18, 2015.
8. Shaten BJ, Smith GD, Kuller LH, et al. Risk factors for the development of type 2 diabetes among men enrolled in the usual care group of the Multiple Risk Factor Intervention Trial. Diabetes Care. 1993;16(10):1331-1339.
9. Chwastiak LA, Rosenheck RA, McEvoy JP, et al. Interrelationships of psychiatric symptom severity, medical comorbidity, and functioning in schizophrenia. Psychiatr Serv. 2006;57(8):1102-1109.
10. Takayanagi Y, Cascella NG, Sawa A, et al. Diabetes is associated with lower global cognitive function in schizophrenia. Schizophr Res. 2012;142(1-3):183-187.
11. Nasrallah HA, Meyer JM, Goff DC, et al. Low rates of treatment for hypertension, dyslipidemia and diabetes in schizophrenia: data from the CATIE schizophrenia trial sample at baseline. Schizophr Res. 2006;86(1-3):15-22.
12. Meyer JM, Davis VG, Goff DC, et al. Change in metabolic syndrome parameters with antipsychotic treatment in the CATIE Schizophrenia Trial: prospective data from phase 1. Schizophr Res. 2008;101(1-3):273-286.
13. Inzucchi SE. Clinical practice. Management of hyperglycemia in the hospital setting. N Engl J Med. 2006; 355(18):1903-1911.
14. Chen SR, Chien YP, Kang CM, et al. Comparing self-efficacy and self-care behaviours between outpatients with comorbid schizophrenia and type 2 diabetes and outpatients with only type 2 diabetes. J Psychiatr Ment Health Nurs. 2014;21(5):414-422.
15. Becker T, Hux J. Risk of acute complications of diabetes among people with schizophrenia in Ontario, Canada. Diabetes Care. 2011;34(2):398-402.
16. Diabetes Prevention Program Research Group. Long-term safety, tolerability, and weight loss associated with metformin in the Diabetes Prevention Program Outcomes Study. Diabetes Care. 2012;35(4):731-737.
17. Jarskog LF, Hamer RM, Catellier DJ, et al; METS Investigators. Metformin for weight loss and metabolic control in overweight outpatients with schizophrenia and schizoaffective disorder. Am J Psychiatry. 2013;170(9):1032-1040.
18. Chen CH, Huang MC, Kao CF, et al. Effects of adjunctive metformin on metabolic traits in nondiabetic clozapine-treated patients with schizophrenia and the effect of metformin discontinuation on body weight: a 24-week, randomized, double-blind, placebo-controlled study. J Clin Psychiatry. 2013;74(5):e424-430. doi: 10.4088/JCP.12m08186.
19. Wang M, Tong JH, Zhu G, et al. Metformin for treatment of antipsychotic-induced weight gain: a randomized, placebo-controlled study. Schizophr Res. 2012;138(1):54-57.
20. Mizuno Y, Suzuki T, Nakagawa A, et al. Pharmacological strategies to counteract antipsychotic-induced weight gain and metabolic adverse effects in schizophrenia: a systematic review and meta-analysis. Schizophr Bull. 2014;40(6): 1385-1403.
CASE Psychotic, and nonadherent
Mr. K, a 42-year-old Fijian man, is brought to the emergency department by his older brother for evaluation of behavioral agitation. Mr. K is belligerent and threatens to kill his family members. Three years earlier, he was given a diagnosis of schizophrenia and treated at an inpatient psychiatric unit.
At that time, Mr. K was stabilized on risperidone, 4 mg/d. However, he did not follow-up with treatment after discharge and has not taken any psychotropic medications since that time.
His brother reports that Mr. K has been slowly deteriorating, talking to himself, staying up at night, and getting into arguments with his family over his delusional beliefs. Although Mr. K once worked as a security guard, he has not worked in 8 years. He has been living with his family, who are no longer willing to accept him into their home because they fear he might harm them.
In the emergency department, Mr. K reports that he has a throbbing headache. Blood pressure is 177/101 mm Hg; heart rate is 103 beats per minute; respiratory rate is 18 breaths per minute; weight is 185 lb; and body mass index (BMI) is 31.8. Physical examination is unremarkable.
Laboratory values show that sodium is 131 mEq/L; potassium, 3.7 mEq/L; bicarbonate, 26 mEq/L; glucose, 420 mg/dL; hemoglobin A1c,12.7; and urine glucose, 3+. Mr. K denies being told he has diabetes.
What are Mr. K’s risk factors for diabetes?
a) schizophrenia
b) physical inactivity
c) obesity
d) Fijian ethnicity
e) all of the above
The authors’ observations
The prevalence of type 2 diabetes mellitus (T2DM) in persons with schizophrenia or a schizoaffective disorder is twice that of the general population.1-4 Multiple variables contribute to the increased prevalence of diabetes in this population, including genetic predisposition, environmental and cultural factors related to diet and physical activity, a high rate of smoking,5,6 iatrogenic causes (metabolic dysregulation and weight gain from antipsychotic treatment), and socioeconomic factors (poverty, lack of access to health care). In addition, symptoms of psychosis such as thought disorder, delusions, hallucinations, and cognitive decline in persons with chronic schizophrenia and schizoaffective disorder can make basic health maintenance difficult.
In Mr. K’s case, premorbid risk of diabetes was elevated because of his Fijian ethnicity.7 With a BMI of 31.8, obesity further increased that risk.5,6,8 In addition, his untreated chronic mental illness, lack of access to health care, low socioeconomic status, long-standing smoking habit, and previous exposure to antipsychotics also increased his risk of T2DM.
The interaction between diabetes and psychosis contributes to a vicious cycle that makes both conditions worse if either, or both, are untreated. In general, medical comorbidities are associated with depression and neurocognitive impairment in persons with schizophrenia.9 Specifically, diabetes is associated with lower global cognitive functioning among persons with schizophrenia.10 Poor cognitive functioning can, in turn, decrease the patient’s ability to manage his medical illness. Also, persons with schizophrenia are less likely to be treated for diabetes, dyslipidemia, and hypertension, as in Mr. K’s case.11
How would you treat Mr. K’s newly diagnosed diabetes?
a) refer him to a primary care physician
b) start an oral agent
c) start sliding-scale insulin
d) start long-acting insulin
e) recommend a carbohydrate-controlled diet=
TREATMENT Stabilization
Mr. K is admitted to the medical unit for treatment of hyperglycemia. The team starts him on amlodipine, 5 mg/d, for hypertension; aripiprazole, 10 mg/d, for psychosis; and sliding-scale insulin (lispro) and 20 units of insulin (glargine) nightly for diabetes. Mr. K’s blood glucose level is well regulated on this regimen; after being medically cleared, he is transferred to the inpatient psychiatric unit.
EVALUATION Denies symptoms
Mr. K appears older than his stated age, is poorly groomed, and is dressed in a hospital gown. He is isolated and appears to be internally preoccupied. He repeatedly denies hearing auditory hallucinations, but often is overheard responding to internal stimuli and mumbling indecipherably in a low tone. His speech is decreased and his affect is flat and guarded. He states that he is not “mental” but that he came to the hospital for “tooth pain.” Every day he asks when he can return home and he asks the staff to call his family to take him home. When informed that his family is not able to care for him, Mr. K states that he would live in a house he owns in Fiji, which his family members state is untrue.
How would you treat Mr. K’s psychosis?
a) continue aripiprazole
b) switch to risperidone, an agent to which he previously responded
c) switch to olanzapine because he has not been sleeping well
d) switch to haloperidol because of diabetes
The authors’ observations
Pharmacotherapy for patients with comorbid schizophrenia and diabetes requires consideration of clinical and psychosocial factors unique to this population.
Antipsychotic choice
Selection of an antipsychotic agent to address psychosis requires considering its efficacy, side-effect profile, and adherence rates, as well as its potential effects on metabolic regulation and weight (Table 1). Typical antipsychotics are less likely than atypical antipsychotics to cause metabolic dysregulation.12 When treatment with atypical antipsychotics cannot be avoided—such as when side effects or an allergic reaction develop—consider selecting a relatively weight-neutral drug with a lower potential for metabolic dysregulation, such as aripiprazole. However, many times, using an agent with significant effects on metabolic regulation cannot be avoided, making treating and monitoring the resulting metabolic effects even more significant.
Glycemic control
Initiating an agent for glycemic control in persons with newly diagnosed diabetes requires weighing many factors, including mode of delivery (oral or subcutaneous), level of glycemic control required, comorbid medical illness (such as renal impairment and heart failure), cost, and potential long-term side effects of the medication (Table 2).13 Oral agents have a slower effect on lowering the blood glucose level, and each agent carries contraindications, but generally they are more affordable. Many present a low risk of hypoglycemia but sulfonylureas are an exception. In addition, metformin could lead to weight loss over the long term, which further lowers the risk of diabetes.
If, however, tight and immediate glycemic control is needed, subcutaneous insulin injections might be required, although this method is more costly, carries an increased risk of hypoglycemic episodes acutely, and leads to weight gain in the long run because of induced hunger and increased appetite.
Psychosocial factors
In addition to the clinical variables above, treating diabetes in patients with comorbid schizophrenia requires considering other psychosocial factors that might not be readily apparent (Table 3). For example, patients with schizophrenia might have decreased motivation, self-efficacy, and capacity for self-care when it comes to health maintenance and medication adherence.14 Chronically mentally ill persons might have reduced cognitive functioning that could affect their ability to maintain complicated medication regimens, such as administering insulin and monitoring blood glucose.
In addition, easy access to hypodermic needles and large amounts of insulin could become a safety concern in patients with ongoing hallucinations, delusions, and thought disorder, despite antipsychotic treatment. For example, a patient with schizophrenia and diabetes who has been maintained on insulin might begin hearing voices that tell her to inject her eyeballs with insulin. Similarly, although the risk of hypoglycemic episodes in patients treated with insulin is well known, patients with schizophrenia have a higher risk of acute complications of diabetes than other patients with diabetes.15Psychosocial factors, such as placement, support system, and follow-up care need to be considered. In some instances, the need to administer daily subcutaneous insulin could be a barrier to placement if the facility does not have the staff or expertise to monitor blood glucose and administer insulin.
If the patient is returning home, then the patient or a caretaker will need to be trained to monitor blood glucose and administer insulin. This might be difficult for persons with chronic mental illness who have lost the support and care of their family. Also, consider the issue of storing insulin, which requires refrigeration. Because of the potential complications involved in using insulin in patients with schizophrenia, practitioners should consider managing non-insulin dependent diabetes with an oral hypoglycemic agent, when possible, along with lifestyle modifications.
OUTCOME Weight loss, discharge
Mr. K is transitioned from aripiprazole to higher-potency oral risperidone, titrated to 6 mg/d. At this dosage, he continues to maintain a delusion about owning a house in Fiji, but was seen responding to internal stimuli less often. The treatment team places him on a diabetic and low-sodium diet of 1,800 kcal/d. His fasting blood glucose levels range in the 70s to 110s mg/dL during his first week of hospitalization.
The treatment team starts Mr. K on oral metformin, titrated to 1,000 mg twice daily, while tapering him off insulin lispro and glargine over the course of hospitalization. The transition from insulin to metformin also is considered because Mr. K’s daily insulin requirement is rather low (<0.5 units/kg).
Mr. K’s course is prolonged because his treatment team initiates the process of conservatorship and placement in the community. Approximately 6 months after his admission, Mr. K is discharged to an unlocked facility with support from an intensive outpatient mental health program. At 6 months follow-up with his outpatient provider, Mr. K’s hemoglobin A1c is 7.0 and he weighs 155 lb with a BMI of 26.5.
The authors’ observations
Despite Mr. K’s initial elevated hemoglobin A1c of 12.7 and weight of 185 lb, over approximately 6 months he experiences a 5.7-unit drop in hemoglobin A1c and weight loss of 30 lb with dietary management and metformin—without the need for other agents. Other options for weight-neutral treatment of T2DM include exenatide, which also is available as a once weekly injectable formulation, canagliflozin, and the gliptins (sitagliptin, saxagliptin, and linagliptin) (Table 4).
Mr. K’s improved control of his diabetes occurred despite initiation of an atypical antipsychotic, which would have been expected to cause additional weight gain and make his diabetes worse secondary to metabolic effects.12 Treatment with metformin in particular has been associated with weight loss in patients with16 and without17 comorbid schizophrenia, including those with antipsychotic-induced weight gain.18-20
Bottom Line
Persons with schizophrenia are at higher risk of type 2 diabetes mellitus for many reasons, including metabolic effects of antipsychotics, reduced cognitive functioning, poor self-care, and limited access to health care. Typical antipsychotics are less likely to cause metabolic dysregulation but, if an atypical is needed, one that is relatively weight-neutral should be selected. When choosing an agent for glycemic control, consider a patient’s or a caretaker’s ability to administer medications, monitor blood glucose, and follow dietary recommendations.
Related Resources
• Cohn T. The link between schizophrenia and diabetes. Current Psychiatry. 2012;11(10):28-34,46.
• Annamalai A, Tek C. An overview of diabetes management in schizophrenia patients: office based strategies for primary care practitioners and endocrinologists [published online March 23, 2015]. Int J Endocrinol. 2015;2015:969182. doi: 10.1155/2015/969182.
Drug Brand Names
Amlodipine • Norvasc
Aripiprazole • Abilify
Asenapine • Saphris
Canagliflozin • Invokana
Exenatide • Bydureon, Byetta
Glargine • Lantus
Linagliptin • Tradjenta
Lispro • Humalog
Lurasidone • Latuda
Metformin • Glucophage
Olanzapine • Zyprexa
Quetiapine • Seroquel
Risperidone • Risperdal
Saxagliptin • Onglyza
Sitagliptin • Januvia
Disclosures
The authors report no financial relationship with any company whose products are mentioned in this article or with manufacturers of competing products.
1. American Diabetes Association; American Psychiatric Association; American Association of Clinical Endocrinologists; North American Association for the Study of Obesity. Consensus development conference on antipsychotic drugs and obesity and diabetes. Diabetes Care. 2004;27(2):596-601.
2. Heald A. Physical health in schizophrenia: a challenge for antipsychotic therapy. Eur Psychiatry. 2010;25(suppl 2):S6-S11.
3. El-Mallakh P. Doing my best: poverty and self-care among individuals with schizophrenia and diabetes mellitus. Arch Psychiatr Nurs. 2007;21(1):49-60; discussion 61-63.
4. Rouillon F, Sorbara F. Schizophrenia and diabetes: epidemiological data. Eur Psychiatry. 2005;20(suppl 4):S345-S348.
5. Willi C, Bodenmann P, Ghali WA, et al. Active smoking and the risk of type 2 diabetes: a systematic review and meta-analysis. JAMA. 2007;298(22):2654-2664.
6. Dome P, Lazary J, Kalapos MP, et al. Smoking, nicotine and neuropsychiatric disorders. Neurosci Biobehav Rev. 2010;34(3):295-342.
7. National Institute of Diabetes and Digestive and Kidney Diseases. For people of African, Mediterranean, or Southeast Asian heritage: important information about diabetes blood tests. http://www.diabetes.niddk.nih.gov/dm/ pubs/asianamerican/index.htm. Published October 2011. Accessed November 18, 2015.
8. Shaten BJ, Smith GD, Kuller LH, et al. Risk factors for the development of type 2 diabetes among men enrolled in the usual care group of the Multiple Risk Factor Intervention Trial. Diabetes Care. 1993;16(10):1331-1339.
9. Chwastiak LA, Rosenheck RA, McEvoy JP, et al. Interrelationships of psychiatric symptom severity, medical comorbidity, and functioning in schizophrenia. Psychiatr Serv. 2006;57(8):1102-1109.
10. Takayanagi Y, Cascella NG, Sawa A, et al. Diabetes is associated with lower global cognitive function in schizophrenia. Schizophr Res. 2012;142(1-3):183-187.
11. Nasrallah HA, Meyer JM, Goff DC, et al. Low rates of treatment for hypertension, dyslipidemia and diabetes in schizophrenia: data from the CATIE schizophrenia trial sample at baseline. Schizophr Res. 2006;86(1-3):15-22.
12. Meyer JM, Davis VG, Goff DC, et al. Change in metabolic syndrome parameters with antipsychotic treatment in the CATIE Schizophrenia Trial: prospective data from phase 1. Schizophr Res. 2008;101(1-3):273-286.
13. Inzucchi SE. Clinical practice. Management of hyperglycemia in the hospital setting. N Engl J Med. 2006; 355(18):1903-1911.
14. Chen SR, Chien YP, Kang CM, et al. Comparing self-efficacy and self-care behaviours between outpatients with comorbid schizophrenia and type 2 diabetes and outpatients with only type 2 diabetes. J Psychiatr Ment Health Nurs. 2014;21(5):414-422.
15. Becker T, Hux J. Risk of acute complications of diabetes among people with schizophrenia in Ontario, Canada. Diabetes Care. 2011;34(2):398-402.
16. Diabetes Prevention Program Research Group. Long-term safety, tolerability, and weight loss associated with metformin in the Diabetes Prevention Program Outcomes Study. Diabetes Care. 2012;35(4):731-737.
17. Jarskog LF, Hamer RM, Catellier DJ, et al; METS Investigators. Metformin for weight loss and metabolic control in overweight outpatients with schizophrenia and schizoaffective disorder. Am J Psychiatry. 2013;170(9):1032-1040.
18. Chen CH, Huang MC, Kao CF, et al. Effects of adjunctive metformin on metabolic traits in nondiabetic clozapine-treated patients with schizophrenia and the effect of metformin discontinuation on body weight: a 24-week, randomized, double-blind, placebo-controlled study. J Clin Psychiatry. 2013;74(5):e424-430. doi: 10.4088/JCP.12m08186.
19. Wang M, Tong JH, Zhu G, et al. Metformin for treatment of antipsychotic-induced weight gain: a randomized, placebo-controlled study. Schizophr Res. 2012;138(1):54-57.
20. Mizuno Y, Suzuki T, Nakagawa A, et al. Pharmacological strategies to counteract antipsychotic-induced weight gain and metabolic adverse effects in schizophrenia: a systematic review and meta-analysis. Schizophr Bull. 2014;40(6): 1385-1403.