User login
Save the Date: AATS Surgical Patient Safety Course
June 24-25, 2016
Renaissance Boston Waterfront Hotel
Boston, MA
Co-Directors
Thoralf M. Sundt, III, MD
Steven Yule, PhD
Program Committee
David J. Bunnell, PA-C, APACVS
David C. Fitzgerald, CCP, AMSECT
Jake Jaquiss, MD
M. Blair Marshall, MD
Shannon Pengel, RN
Kenneth Shann, CCP, LP, AMSECT
Marco Zenati, MD
Course Goal — The course provides members of the surgical care team with an introduction to the principles of patient safety and error management and provides them with practical tools that can be implemented in their care environment.
Target Audience — Recognizing that surgical safety is the product of the collective efforts of the entire care team, this course is directed at nurses and nurse practitioners, physician assistants, perfusionists, anesthesiologists, critical care physicians and surgeons. While the central focus is on cardiothoracic surgical care, the principles are universal and are applicable to all surgical specialties, making the course worthwhile for anyone involved in delivering surgical care.
Note: Approved by the American Board of Thoracic Surgery for Maintenance of Certification
Course Description — Improving patient care remains a constant mission for all members of the surgical team. The inaugural AATS Surgical Patient Safety Course has been designed to promote a culture of safety and reduce preventable patient harm by engaging, educating and equipping members of the cardiothoracic surgical team in the multidimensional approach to patient safety. Featuring didactic and interactive presentations and focused workshops, the course will provide attendees with the essential knowledge, skills and attitudes about patient safety that can improve care in the present and future.

AATS Week Registration & Housing Now Open
Aortic Symposium
May 12–13, 2016
New York, NY
Course Directors
Joseph S. Coselli
Steven L. Lansman
Registration and Housing Information
96th Annual Meeting
May 14-18, 2016
Baltimore, MD
President & Annual Meeting Chair
Joseph S. Coselli
Annual Meeting Co-Chairs
Charles D. Fraser
David R. Jones
Annual Meeting Registration PackagesAllied Health Package: Registration for the Saturday Courses, Sunday Symposium and the 96th Annual Meeting (Monday-Wednesday). Register before March 25, 2016, for only $400, after which the fee goes up to $500.
Resident/Fellow and Medical Student Package: Registration for the Saturday Courses, Sunday Symposium and the 96th Annual Meeting (Monday-Wednesday).
Register before March 25, 2016, and attend for no charge. After that date, the fee is $300.
Saturday Courses and Sunday Symposium Registration: Register for a Saturday course and/or a Sunday symposium and have access to all other courses/symposia that same day. Note: Registration for the Saturday courses and/or Sunday symposium is separate from the Annual Meeting fee.
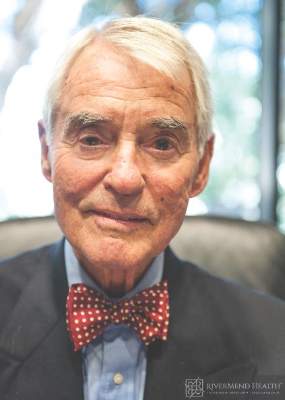
50 years of ob.gyn.: Embracing the ‘voice of the woman’
I hadn’t originally planned to be an obstetrician-gynecologist; in fact, I trained as an internist for 2 years. But as I became more exposed to the real-life experience of medical care, I realized that ob.gyn. would allow me to take care of women in all facets of their lives, from family planning to childbirth to endocrine problems and even depression.
Having joined the American College of Obstetricians and Gynecologists in 1965, my tenure as an ob.gyn. has spanned almost the exact length of this 50th anniversary retrospective of Ob.Gyn.News. But in my experience, those early days of my practice were actually the turning point for our specialty.
I’m an observer, not a historian. But I can’t imagine that any other specialty was more impacted by societal change in the mid-1960s than ours.
For one thing, when I was training, we were an overwhelmingly male group of residents who were learning about how to take care of women. Our commitment was not in question, but our ability to truly connect with women was certainly underdeveloped.
I’m gratified now to see that the demographics of ob.gyn. have changed, because they should. Without disrespecting my male ob.gyn. brethren, I was pleased to see that more than 80% of ob.gyn. trainees are now women. Importantly, many of them are learning now from female ob.gyns. This foretells a future in which connections between patient and physician are as strong as they should be.
Moreover, ob.gyn. trainees today have the highest proportions of African American and Hispanic trainees compared with any other specialty. We are doing a better job of representing, within our ranks, the women whom we treat. This continues to bolster our relationships, and in no other field is a trusting, intimate relationship as important as in ours.
Of course, the mid-1960s also heralded dramatic changes within reproductive health. Women were beginning to dip their toes into being able to control their own fertility and, in so doing, to prevent pregnancy. This also gave us the opportunity to focus on a woman’s greater well-being, helping her to address her own health before becoming pregnant. It pivoted the role of the ob.gyn. and charted us on a course to being, for many women, their primary point of care. And it gave women educational, professional, and economic opportunities the likes of which had never existed before.
Outside of fertility planning, we also began to make inroads in obstetric care – and to make some mistakes. The 1960s heralded some developments that we still embrace, but we also began a path toward dependence on technology and overinvasive care that we are trying to step away from today.
And, we had difficult conversations then that we have now. The more things change, the more they stay the same.
One of the most exciting, and essential, changes that I have seen since I began my career is the voice of the woman in ob.gyn. care. We speak with our patients. We screen them for depression and for intimate partner violence. We discuss their lives and whether they are using the birth control that is best for them. We try to reflect their own preferences in our approach to their labor and delivery. We missed an opportunity to do this in the past, to discuss a woman’s social history. We know now that there is more to a woman’s well-being than whether she smokes and drinks.
It makes sense that our specialty has changed, because we are the only specialty dedicated to women, and the last 50 years have brought about intense societal change for women.
We still have further to go. We can be slow to evolve, and we constantly face challenges that other specialties don’t confront. But I believe that the same dedication to women that inspired me to go into ob.gyn. 50 years ago is the same inspiration that is leading today’s trainees to do the same.
Dr. Pion is a clinical professor at the UCLA School of Medicine. He has served on the faculty of the University of Washington and the University of Hawaii, and worked for more than 25 years in the development and production of TV and radio programming on health care. He is a fellow of the American College of Obstetricians and Gynecologists.

Increasing eligibility for engineered T-cell therapy

Image courtesy of NIAID
A new study suggests that having a certain type of cancer or receiving certain chemotherapeutic agents
can affect T-cell function and make patients ineligible for engineered T-cell therapy.
However, researchers found that proper timing of T-cell collection can increase the number of patients eiligible for the therapy.
And the team developed a culture technique that can boost T cells’ fitness for expansion, which can increase eligibility as well.
Nathan Singh, MD, of the University of Pennsylvania in Philadelphia, and his colleagues described this work in Science Translational Medicine.
The researchers set out to determine why some patients’ T cells fail to multiply in culture. The team studied T cells from children with acute lymphoblastic leukemia (ALL) or non-Hodgkin lymphoma (NHL) who were undergoing chemotherapy. (NHL subtypes included Burkitt lymphoma, diffuse large B-cell lymphoma, primary mediastinal large B-cell lymphoma, primary lymphoma of bone, and follicular lymphoma.)
The researchers found that T cells from patients with ALL expanded better in culture than those from patients with NHL.
The team said a threshold of greater than 5-fold expansion during test expansion was associated with a high likelihood of successful clinical expansion.
Nearly 80% of patients with ALL met this threshold at diagnosis, but the rate declined over the course of therapy, falling to about 40% during maintenance therapy.
About 25% of NHL patients met the threshold at diagnosis, but few samples demonstrated any expansion after therapy began (12.5% of samples at all remaining time points tested).
The researchers said the difference in the proportion of ALL and NHL samples that met the expansion threshold was significant at all time points tested.
Analysis revealed that ALL patients had higher numbers of naïve T cells and stem central memory T cells, T cell subtypes known to be highly potent and proliferative with an enhanced capacity for self-renewal.
The researchers also found that certain chemotherapy drugs—namely, cyclophosphamide and cytarabine—selectively depleted early lineage T cells.
Fortunately, the team discovered that poor expansion can be rescued by exposing T cells to signaling molecules that stimulate T-cell activity. Culture with IL-7 and IL-15 boosted the expansion capacity of T cells from patients with NHL and those with ALL.
The researchers therefore concluded that using this culture technique or collecting T cells prior to chemotherapy can increase the number of patients eligible for engineered T-cell therapy. ![]()
Team creates ‘more reliable’ coagulation assay

Photo courtesy of the Wyss
Institute at Harvard University
Scientists have developed a blood coagulation assay that, they say, is more reliable than existing assays and could one day be used to diagnose rare bleeding disorders and prevent toxic effects of anticoagulant and antiplatelet drugs.
The team created a microfluidic device with hollow channels through which blood is flowed and devised an algorithm for analyzing patient-specific data to predict when blood clots will form.
Together, these components make up the assay, which can monitor blood coagulation and platelet function.
Donald Ingber, MD, PhD, of the Wyss Institute for Biologically Inspired Engineering at Harvard University in Boston, Massachusetts, and his colleagues described the assay in Nature Communications.
The team developed a microfluidic device in which blood flows through a life-like network of small “vessels.” The blood is subjected to true-to-life shear stresses and force gradients of the human vascular network.
The device contains hollow channels that mimic the pathology of the narrowing of small blood vessels, which can often cause a shift in the fluid mechanics of blood flow that can lead to life-threatening blood clots or internal bleeds.
The device mimics rapid changes in blood flow dynamics associated with stenosis or narrowing of small blood vessels by pumping pressurized blood flow through the device’s microfluidic channels.
Using automated pressure sensors and a proprietary algorithm, data acquired from the device is analyzed in real-time, thereby predicting the time at which a certain blood sample will obstruct the blood vessel network.
“By combining our fabricated microfluidic device that mimics blood flow dynamics of small arterioles with our novel data analysis software, we can rapidly quantitate hemostasis in real-time and predict if blood clots will develop in an individual or blood sample,” Dr Ingber explained.
He and his colleagues found they could accurately monitor the effects of anticoagulant and antiplatelet drugs in blood samples from human subjects.
The team was able to monitor platelet function as well. In particular, they found they could detect abnormal platelet function in samples from patients with Hermansky–Pudlak syndrome, a rare bleeding disorder characterized by a deficiency of platelet-dense granules that cannot be easily identified using conventional assays.
The novel assay also proved successful in large animal experiments. The scientists integrated their device directly into a vascular access line that was inserted into the femoral vein of a living pig to measure clinical clotting parameters over time. They recorded precise predictions for clotting times that were more accurate and faster than currently used clinical assays.
The team noted that their device uses inexpensive in-line pressure sensors to measure clot formation. As a result, it does not require additional instrumentation, and it can be integrated directly into the blood lines of extracorporeal devices.
The scientists said the device’s ability to be configured for lab use or real-time patient monitoring opens the door for countless potential uses that could improve patient care. ![]()
VTE guidelines recommend NOACs over VKA therapy

Photo courtesy of NIGMS
The American College of Chest Physicians has released a new edition of guidelines for the treatment of patients with venous thromboembolism (VTE).
This 10th edition of the guidelines, published in CHEST, includes 54 recommendations. However, only 20 of these recommendations were deemed “strong,” and none were based on high-quality evidence.
“The guideline presents stronger recommendations and weaker suggestions for treatment based on the best available evidence and identifies gaps in our knowledge and areas for future research,” said lead author Clive Kearon, MD, PhD, of McMaster University in Hamilton, Ontario, Canada.
One of the key recommendations in the guidelines is a preference for novel oral anticoagulants (NOACs) over vitamin K antagonist (VKA) therapy for initial and long-term treatment of VTE in patients without cancer.
The guideline authors say that, since the publication of the 9th edition, studies have shown that NOACs are as effective as VKA therapy, and NOACs confer a reduced risk of bleeding and increased convenience for patients and healthcare providers.
As long-term anticoagulant therapy for patients without cancer, the guideline authors suggest dabigatran, rivaroxaban, apixaban, or edoxaban over VKA therapy. But they suggest VKA therapy over low-molecular-weight heparin.
For patients with VTE and cancer, the guideline authors suggest low-molecular-weight heparin over VKA, dabigatran, rivaroxaban, apixaban, or edoxaban.
The guidelines advise against an inferior vena cava filter for patients with VTE who are receiving anticoagulant treatment.
Another change to guideline recommendations from the 9th edition to the 10th edition concerns the routine use of compression stockings. Based on recent evidence, the 10th edition advises against routinely using compression stockings to prevent post-thrombotic syndrome in patients with acute deep vein thrombosis (DVT).
The 10th edition also suggests which patients diagnosed with isolated subsegmental pulmonary embolism (PE) should, and should not, receive anticoagulant therapy.
For subsegmental PE and no proximal DVT, the guidelines suggest clinical surveillance over anticoagulation if patients have a low risk of recurrent VTE and anticoagulation over clinical surveillance if patients have a high risk of recurrence.
The guidelines suggest thrombolytic therapy for patients with PE and hypotension and systemic therapy over catheter-directed thrombolysis.
To date, the updated guidelines have been endorsed by the American Association for Clinical Chemistry, American College of Clinical Pharmacy, International Society for Thrombosis and Haemostasis, and American Society of Health-System Pharmacists. ![]()
US cancer stats: The good and the bad

patient and her father
Photo by Rhoda Baer
The American Cancer Society’s 2016 report on cancer in the US suggests that, in recent years, overall trends in cancer incidence have remained stable for women and declined for men.
However, the rates of certain malignancies are on the rise. This includes some leukemia subtypes for men and women, as well as myeloma for men.
Leukemia is the leading cause of cancer death for men ages 20 to 39, but leukemia is no longer the leading cause of cancer death among children and adolescents (of both genders).
These and other data are included in the report, which is published in CA: A Cancer Journal for Clinicians.
The report estimates there will be 1,685,210 new cancer cases and 595,690 cancer deaths in the US in 2016. This includes 81,080 new lymphoma cases and 21,270 lymphoma deaths, 60,140 new leukemia cases and 24,400 leukemia deaths, and 30,330 new myeloma cases and 12,650 myeloma deaths.
Cancer incidence over time
The report suggests the overall cancer incidence for women has been stable from 1998 to 2012. But the incidence for men has declined by 3.1% per year from 2009 to 2012, with one-half of the drop in men due to recent rapid declines in prostate cancer diagnoses as prostate-specific antigen testing decreases.
Incidence rates increased from 2003 to 2012 among both men and women for some leukemia subtypes and for cancers of the tongue, tonsil, small intestine, liver, pancreas, kidney, renal pelvis, and thyroid.
Incidence rates increased in men for melanoma, myeloma, and cancers of the breast, testis, and oropharynx. Among women, incidence rates increased for cancers of the anus, vulva, and uterine corpus.
Cancer deaths
The rate of cancer deaths in the US has dropped 23% from its peak in 1991 to 2012. The incidence of cancer death was 215.1 per 100,000 in 1991 and 166.4 per 100,000 in 2012.
The decline is larger in men (28% since 1990) than in women (19% since 1991). Over the past decade of data, the rate dropped by 1.8% per year in men and 1.4% per year in women.
The decline in cancer death rates over the past 2 decades is driven by continued decreases in death rates for the 4 major cancer sites: lung, breast, prostate, and colon/rectum.
Breast cancer is the leading cause of cancer death in women ages 20 to 59, while lung cancer is the leading cause of cancer death in women 60 and older.
Among men, leukemia is the leading cause of cancer death for those ages 20 to 39, whereas lung cancer ranks first among men 40 and older.
Among children and adolescents (0-19), brain cancer has surpassed leukemia as the leading cause of cancer death, a result of more rapid therapeutic advances against leukemia.
The report also features an analysis of leading causes of death by state. It shows that, even as cancer remains the second leading cause of death nationwide, steep drops in deaths from heart disease have made cancer the leading cause of death in 21 states: Alaska, Arizona, Colorado, Delaware, Florida, Georgia, Idaho, Kansas, Maine, Massachusetts, Minnesota, Montana, Nebraska, New Hampshire, New Mexico, North Carolina, Oregon, South Carolina, Vermont, Virginia, and Washington.
In addition, cancer is the leading cause of death among adults ages 40 to 79 and among both Hispanics and Asian/Pacific Islanders, who together make up one-quarter of the US population.
Heart disease remains the top cause of death overall in the US. In 2012, there were 599,711 (24%) deaths from heart disease, compared to 582,623 (23%) deaths from cancer.
“We’re gratified to see cancer death rates continuing to drop,” said Otis W. Brawley, MD, chief medical officer of the American Cancer Society.
“But the fact that cancer is nonetheless becoming the top cause of death in many populations is a strong reminder that the fight is not over.” ![]()
A look back at 1966
As Ob.Gyn. News celebrates 50 years of publication, we’re taking a look back at our first year – 1966.
Not surprisingly, medicine looked a lot different in the mid-1960s, largely driven by the culture and technology of the time. A review of the 1966 issues of Obstetrics and Gynecology (the Green Journal), offers a snapshot of the state of the science.
With scientists still struggling to develop a rapid test to detect pregnancy, researchers from the Brookdale Hospital Center in Brooklyn, N.Y., detailed the possibility of using elevated breast temperature to get faster results. They compared 50 pregnant and 50 nonpregnant women and found a consistent rise in breast temperature in all pregnant women as early as 1 week after the first missed period. In the March issue, they concluded that the use of temperature difference between the breast and a baseline area on the anterior chest wall could be a rapid, simple, and accurate pregnancy test (Obstet Gynecol. 1966 Mar;27[3]:378-80).
In August, researchers from Australia published promising data on the use of ultrasonic echoscopic examination of the uterus in late pregnancy. They found that the technology was useful in determining fetal position and possible abnormalities and could be repeated as often as necessary to observe changes and growth. The big advantage, they noted, would be the opportunity to avoid excessive fetal exposure to x-rays (Obstet Gynecol. 1966 Aug;28[2]:164-9).
Advertising directed at physicians – in both the Green Journal and in Ob.Gyn. News – provided a glimpse into the practice of medicine at the time. Ob.gyns. saw ads for products such as Eskatrol – a capsule that contained dextroamphetamine sulfate and prochlorperazine – promoted to help women control appetite and “relieve the emotional stress that causes overeating.” And doctors also saw ads for oral contraceptives, first approved by the Food and Drug Administration in 1960.
Ob.gyn. practice was different culturally as well. In a regular column titled “After Office Hours,” published in the Green Journal in January 1966, Dr. Malcolm S. Allan explored a relatively new idea – husband-attended deliveries. Dr. Allan, of Wesson Maternity Hospital in Springfield, Mass., explained that his hospital had conducted a nationwide survey of chiefs of obstetrics after they received a petition seeking to allow husbands into the delivery room, as well as more flexibility for fathers to room in with the mother and baby. The survey, which included responses from 267 hospitals, showed that 81% of hospitals did not allow husbands in the delivery room (Obstet Gynecol. 1966 Jan;27[1]:146-8).
After reviewing the survey results and talking to experts in the area, Dr. Allan and the leadership at Wesson decided not to allow husbands to witness deliveries. He concluded that “some patients in some of these ‘off-beat’ programs are being allowed to assume too much authority for determining the medical management of their pregnancies, while leaving the obstetrician with the responsibility for a healthy outcome.”
But in other ways, not much has changed since 1966. The March edition of “After Office Hours” bemoaned a looming manpower crisis in obstetrics (Obstet Gynecol. 1966 Mar;27[3]:449-52). Dr. Jan Schneider of the University of Michigan, Ann Arbor, wrote that even using conservative estimates of population growth, by 1970 there would be 20,000 obstetricians in the United States delivering on average of 225 babies each, a strain on the workforce. What were some of the factors? An uneven distribution of obstetricians throughout the country and increasing specialization.
In another familiar theme, Dr. Schneider urged physicians to consider team care as one part of the solution, allowing nurse midwives to provide prenatal care and perform normal deliveries under physician supervision.
Some of the clinical debates going on in 1966 are still unresolved. Consider the September 1966 issue of the Green Journal, which features an interim report on contraception with an intrauterine bow inserted immediately postpartum (Obstet Gynecol. 1966 Sep;28[3]:329-31). Five decades later, only about 12 state Medicaid programs cover the cost of insertion of an IUD immediately postpartum. And in the August 1966 issue of the Green Journal, Dr. Carl J. Pauerstein asked, “Once a Section, Always a Trial of Labor?” (Obstet Gynecol. 1966 Aug;28[2]:273-6). A look at the recent Master Class on vaginal birth after cesarean shows that those same questions are still being debated today.
So what will physicians and patients say about obstetrics and gynecology practice 50 years from now?
1966 at a glance
The Surgeon General
In a report to U.S. Surgeon General William H. Stewart titled “Protecting and Improving Health through the Radiological Sciences,” the National Advisory Committee on Radiation warned about emerging problems in the use of ionizing radiation in medicine.
Births
According to data provided by the Centers for Disease Control and Prevention, in 1966, there were 3.6 million births, for a birth rate of 18.4 and a fertility rate of 90.8; 8.4% of births were to unmarried women.
Women get organized
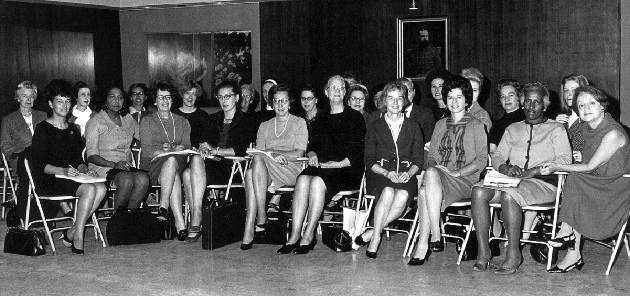
In June, Betty Friedan, Pauli Murray, and several other women launched the National Organization for Women at a conference in Washington, D.C., with Ms. Friedan famously writing N-O-W on a paper napkin.
Medical ethics
Dr. Henry K. Beecher published an article on ethics in the New England Journal of Medicine that is credited with spurring the federal government to set rules on human experimentation and informed consent, including establishment of Institutional Review Boards.
A safety net is born
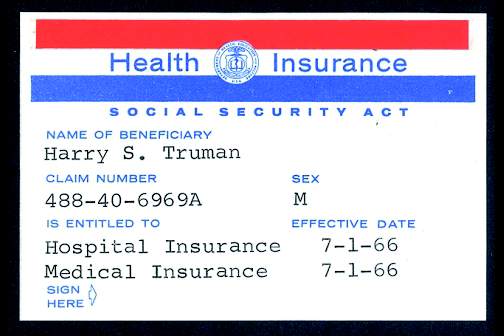
On July 1, 1966, Medicare coverage began, with more than 19 million beneficiaries.
The AMA

The American Medical Association published the first edition of the Current Procedural Terminology (CPT) code book, creating a system of standardized terms for medical procedures used in documentation. Also in 1966, the AMA encouraged doctors to promote exercise to improve health.
Planned Parenthood
The Planned Parenthood Federation of America awarded its first Margaret Sanger Award. In 1966, four men received the award, including the Rev. Martin Luther King Jr. and President Lyndon B. Johnson.
Pregnancy testing
The first radioimmunoassay for hCG (human chorionic gonadotropin) was described by A.R. Midgley, but the test could not distinguish between hCG and luteinizing hormone. A home pregnancy test was still a decade away.
Throughout 2016, Ob.Gyn. News will celebrate its 50th anniversary with exclusive articles looking at the evolution of the specialty, including the history of contraception, changes in gynecologic surgery, and the transformation of the well-woman visit. Look for these articles and more special features in the pages of Ob.Gyn. News and online at obgynnews.com.
On Twitter @maryellenny
As Ob.Gyn. News celebrates 50 years of publication, we’re taking a look back at our first year – 1966.
Not surprisingly, medicine looked a lot different in the mid-1960s, largely driven by the culture and technology of the time. A review of the 1966 issues of Obstetrics and Gynecology (the Green Journal), offers a snapshot of the state of the science.
With scientists still struggling to develop a rapid test to detect pregnancy, researchers from the Brookdale Hospital Center in Brooklyn, N.Y., detailed the possibility of using elevated breast temperature to get faster results. They compared 50 pregnant and 50 nonpregnant women and found a consistent rise in breast temperature in all pregnant women as early as 1 week after the first missed period. In the March issue, they concluded that the use of temperature difference between the breast and a baseline area on the anterior chest wall could be a rapid, simple, and accurate pregnancy test (Obstet Gynecol. 1966 Mar;27[3]:378-80).
In August, researchers from Australia published promising data on the use of ultrasonic echoscopic examination of the uterus in late pregnancy. They found that the technology was useful in determining fetal position and possible abnormalities and could be repeated as often as necessary to observe changes and growth. The big advantage, they noted, would be the opportunity to avoid excessive fetal exposure to x-rays (Obstet Gynecol. 1966 Aug;28[2]:164-9).
Advertising directed at physicians – in both the Green Journal and in Ob.Gyn. News – provided a glimpse into the practice of medicine at the time. Ob.gyns. saw ads for products such as Eskatrol – a capsule that contained dextroamphetamine sulfate and prochlorperazine – promoted to help women control appetite and “relieve the emotional stress that causes overeating.” And doctors also saw ads for oral contraceptives, first approved by the Food and Drug Administration in 1960.
Ob.gyn. practice was different culturally as well. In a regular column titled “After Office Hours,” published in the Green Journal in January 1966, Dr. Malcolm S. Allan explored a relatively new idea – husband-attended deliveries. Dr. Allan, of Wesson Maternity Hospital in Springfield, Mass., explained that his hospital had conducted a nationwide survey of chiefs of obstetrics after they received a petition seeking to allow husbands into the delivery room, as well as more flexibility for fathers to room in with the mother and baby. The survey, which included responses from 267 hospitals, showed that 81% of hospitals did not allow husbands in the delivery room (Obstet Gynecol. 1966 Jan;27[1]:146-8).
After reviewing the survey results and talking to experts in the area, Dr. Allan and the leadership at Wesson decided not to allow husbands to witness deliveries. He concluded that “some patients in some of these ‘off-beat’ programs are being allowed to assume too much authority for determining the medical management of their pregnancies, while leaving the obstetrician with the responsibility for a healthy outcome.”
But in other ways, not much has changed since 1966. The March edition of “After Office Hours” bemoaned a looming manpower crisis in obstetrics (Obstet Gynecol. 1966 Mar;27[3]:449-52). Dr. Jan Schneider of the University of Michigan, Ann Arbor, wrote that even using conservative estimates of population growth, by 1970 there would be 20,000 obstetricians in the United States delivering on average of 225 babies each, a strain on the workforce. What were some of the factors? An uneven distribution of obstetricians throughout the country and increasing specialization.
In another familiar theme, Dr. Schneider urged physicians to consider team care as one part of the solution, allowing nurse midwives to provide prenatal care and perform normal deliveries under physician supervision.
Some of the clinical debates going on in 1966 are still unresolved. Consider the September 1966 issue of the Green Journal, which features an interim report on contraception with an intrauterine bow inserted immediately postpartum (Obstet Gynecol. 1966 Sep;28[3]:329-31). Five decades later, only about 12 state Medicaid programs cover the cost of insertion of an IUD immediately postpartum. And in the August 1966 issue of the Green Journal, Dr. Carl J. Pauerstein asked, “Once a Section, Always a Trial of Labor?” (Obstet Gynecol. 1966 Aug;28[2]:273-6). A look at the recent Master Class on vaginal birth after cesarean shows that those same questions are still being debated today.
So what will physicians and patients say about obstetrics and gynecology practice 50 years from now?
1966 at a glance
The Surgeon General
In a report to U.S. Surgeon General William H. Stewart titled “Protecting and Improving Health through the Radiological Sciences,” the National Advisory Committee on Radiation warned about emerging problems in the use of ionizing radiation in medicine.
Births
According to data provided by the Centers for Disease Control and Prevention, in 1966, there were 3.6 million births, for a birth rate of 18.4 and a fertility rate of 90.8; 8.4% of births were to unmarried women.
Women get organized
In June, Betty Friedan, Pauli Murray, and several other women launched the National Organization for Women at a conference in Washington, D.C., with Ms. Friedan famously writing N-O-W on a paper napkin.
Medical ethics
Dr. Henry K. Beecher published an article on ethics in the New England Journal of Medicine that is credited with spurring the federal government to set rules on human experimentation and informed consent, including establishment of Institutional Review Boards.
A safety net is born
On July 1, 1966, Medicare coverage began, with more than 19 million beneficiaries.
The AMA
The American Medical Association published the first edition of the Current Procedural Terminology (CPT) code book, creating a system of standardized terms for medical procedures used in documentation. Also in 1966, the AMA encouraged doctors to promote exercise to improve health.
Planned Parenthood
The Planned Parenthood Federation of America awarded its first Margaret Sanger Award. In 1966, four men received the award, including the Rev. Martin Luther King Jr. and President Lyndon B. Johnson.
Pregnancy testing
The first radioimmunoassay for hCG (human chorionic gonadotropin) was described by A.R. Midgley, but the test could not distinguish between hCG and luteinizing hormone. A home pregnancy test was still a decade away.
Throughout 2016, Ob.Gyn. News will celebrate its 50th anniversary with exclusive articles looking at the evolution of the specialty, including the history of contraception, changes in gynecologic surgery, and the transformation of the well-woman visit. Look for these articles and more special features in the pages of Ob.Gyn. News and online at obgynnews.com.
On Twitter @maryellenny

Letter to the Editor/
We certainly agree with Dr. LaBrin that there are a minority of inpatients and outpatients who might benefit from nebulizer therapy. In our review article,[1] we attempted not to make a sweeping generalization, even if we did not explicitly mention some chronic obstructive pulmonary disease patients with suboptimal peak inspiratory flow rate (PIFR) or those with neuromuscular disease as populations where nebulizer therapy may be preferred. Our recommendation included this statement: Inpatient use of nebulizers may be more appropriate than metered‐dose inhalers (MDIs) for patients with dementia or altered mental status, as well as those in extreme distress resulting in an inability to coordinate inhaler usage. Very low health literacy may be an additional barrier to appropriate MDI teaching and usage.[1] Our list was not all‐inclusive, and patients with suboptimal PIFR or with neuromuscular disease are good additions to this recommendation.
As for proper MDI technique, it is unclear whether MDI teaching will result in long‐term mastery of the skill.[2] The only way to master a skill is to practice it. Thus, by prescribing MDIs and training patients on their proper usage during every admission, we will provide medically appropriate patients with many opportunities to practice the skill and reinforce effective techniques.
- , . Nebulized bronchodilators instead of metered‐dose inhalers for obstructive pulmonary symptoms. J Hosp Med. 2015;10(10):691–693.
- , , , et al. Misuse of respiratory inhalers in hospitalized patients with asthma or COPD. J Gen Intern Med. 2011;26(6):635–642.
We certainly agree with Dr. LaBrin that there are a minority of inpatients and outpatients who might benefit from nebulizer therapy. In our review article,[1] we attempted not to make a sweeping generalization, even if we did not explicitly mention some chronic obstructive pulmonary disease patients with suboptimal peak inspiratory flow rate (PIFR) or those with neuromuscular disease as populations where nebulizer therapy may be preferred. Our recommendation included this statement: Inpatient use of nebulizers may be more appropriate than metered‐dose inhalers (MDIs) for patients with dementia or altered mental status, as well as those in extreme distress resulting in an inability to coordinate inhaler usage. Very low health literacy may be an additional barrier to appropriate MDI teaching and usage.[1] Our list was not all‐inclusive, and patients with suboptimal PIFR or with neuromuscular disease are good additions to this recommendation.
As for proper MDI technique, it is unclear whether MDI teaching will result in long‐term mastery of the skill.[2] The only way to master a skill is to practice it. Thus, by prescribing MDIs and training patients on their proper usage during every admission, we will provide medically appropriate patients with many opportunities to practice the skill and reinforce effective techniques.
- , . Nebulized bronchodilators instead of metered‐dose inhalers for obstructive pulmonary symptoms. J Hosp Med. 2015;10(10):691–693.
- , , , et al. Misuse of respiratory inhalers in hospitalized patients with asthma or COPD. J Gen Intern Med. 2011;26(6):635–642.
- , . Nebulized bronchodilators instead of metered‐dose inhalers for obstructive pulmonary symptoms. J Hosp Med. 2015;10(10):691–693.
- , , , et al. Misuse of respiratory inhalers in hospitalized patients with asthma or COPD. J Gen Intern Med. 2011;26(6):635–642.
Letter to the Editor/
I read with great interest Moriates and Feldman's article advocating inhalers in obstructive disease.[1] Although I agree with the main thoughts of their argument, there are issues for consideration.
Patient education on proper inhaler use is needed, and Press et al.[2] offer hope of improvement. However, as acknowledged by Press et al., with any skill, it is unclear whether mastery is retained long term. Molimard et al.[3] found inhaler misuse occurring in the outpatient setting, suggesting this may be an ongoing problem, or that some patients may be unable to master this complex skill.
Inhaler therapy is recommended due to the benefits mentioned by the authors. However, discharge planning should focus more on appropriate device selection. Mahler et al.[4] identified patients with chronic obstructive pulmonary disease with a suboptimal peak inspiratory flow rate in whom use of an inhaler might be ineffective. A subsequent study in this population demonstrated significant improvements in forced expiratory volume in 1 second, total lung capacity, and inspiratory capacity with nebulizer therapy compared to a dry powder inhaler.[5] Other high‐risk populations may include patients with neuromuscular disease or impaired manual dexterity (eg, Parkinson's, poststroke) inhibiting proper inhaler use.
Therefore, although metered‐dose inhaler therapy is preferred over nebulized therapy, I would caution too sweeping a recommendation missing certain populations with a reason for alternative delivery.
- , . Nebulized bronchodilators instead of metered‐dose inhalers for obstructive pulmonary symptoms. J Hosp Med. 2015;10(10):691–693.
- , , , et al. Misuse of respiratory inhalers in hospitalized patients with asthma or COPD. J Gen Intern Med. 2011;26(6):635–642.
- , , , , , . Assessment of handling of inhaler devices in real life: an observational study in 3811 patients in primary care. J Aerosol Med. 2003;16(3):249–254.
- , , . Prevalence and COPD phenotype for a suboptimal peak inspiratory flow rate against the simulated resistance of the Diskus dry powder inhaler. J Aerosol Med Pulm Drug Deliv. 2013;26(3):174–179.
- , , , . Comparison of dry powder versus nebulized beta‐agonist in patients with COPD who have suboptimal peak inspiratory flow rate. J Aerosol Med Pulm Drug Deliv. 2014;27(2):103–109.
I read with great interest Moriates and Feldman's article advocating inhalers in obstructive disease.[1] Although I agree with the main thoughts of their argument, there are issues for consideration.
Patient education on proper inhaler use is needed, and Press et al.[2] offer hope of improvement. However, as acknowledged by Press et al., with any skill, it is unclear whether mastery is retained long term. Molimard et al.[3] found inhaler misuse occurring in the outpatient setting, suggesting this may be an ongoing problem, or that some patients may be unable to master this complex skill.
Inhaler therapy is recommended due to the benefits mentioned by the authors. However, discharge planning should focus more on appropriate device selection. Mahler et al.[4] identified patients with chronic obstructive pulmonary disease with a suboptimal peak inspiratory flow rate in whom use of an inhaler might be ineffective. A subsequent study in this population demonstrated significant improvements in forced expiratory volume in 1 second, total lung capacity, and inspiratory capacity with nebulizer therapy compared to a dry powder inhaler.[5] Other high‐risk populations may include patients with neuromuscular disease or impaired manual dexterity (eg, Parkinson's, poststroke) inhibiting proper inhaler use.
Therefore, although metered‐dose inhaler therapy is preferred over nebulized therapy, I would caution too sweeping a recommendation missing certain populations with a reason for alternative delivery.
- , . Nebulized bronchodilators instead of metered‐dose inhalers for obstructive pulmonary symptoms. J Hosp Med. 2015;10(10):691–693.
- , , , et al. Misuse of respiratory inhalers in hospitalized patients with asthma or COPD. J Gen Intern Med. 2011;26(6):635–642.
- , , , , , . Assessment of handling of inhaler devices in real life: an observational study in 3811 patients in primary care. J Aerosol Med. 2003;16(3):249–254.
- , , . Prevalence and COPD phenotype for a suboptimal peak inspiratory flow rate against the simulated resistance of the Diskus dry powder inhaler. J Aerosol Med Pulm Drug Deliv. 2013;26(3):174–179.
- , , , . Comparison of dry powder versus nebulized beta‐agonist in patients with COPD who have suboptimal peak inspiratory flow rate. J Aerosol Med Pulm Drug Deliv. 2014;27(2):103–109.