User login
ATG can reduce risk, severity of chronic GVHD
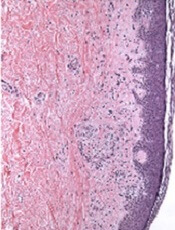
Image courtesy of PLOS ONE
Results of a phase 3 study suggest that administering antihuman T-lymphocyte immune globulin (ATG) prior to hematopoietic stem cell transplant (HSCT) can decrease the risk and severity of chronic graft-versus-host disease (GVHD).
Study investigators included ATG in the conditioning regimens of leukemia patients receiving peripheral blood stem cells from an HLA-identical sibling donor.
Two years after HSCT, these patients had less than half the rate of chronic GVHD of patients who did not receive ATG.
In addition, patients who received ATG were less likely to have severe chronic GVHD.
Nicolaus Kroger, MD, of the University Medical Center Hamburg-Eppendorf in Hamburg, Germany, and his colleagues reported these results in NEJM.
The investigators enrolled 168 patients undergoing HSCT at 27 centers. They were randomized in a 1:1 ratio to receive ATG or not.
One hundred and fifty-five patients were randomized and evaluable—83 in the ATG group and 72 in the non-ATG group.
The only significant difference in baseline characteristics was age. The median age was 39 (range, 18-64) in the ATG group and 43.5 (range, 21-61) in the non-ATG group (P=0.04).
Most patients in both groups were male (63.9% and 55.6%, respectively), and most had acute myeloid leukemia (66.3% and 76.4%, respectively) rather than acute lymphoblastic leukemia (33.8% and 23.6%, respectively).
Most patients had intermediate-risk disease (75.9% and 82.1%, respectively), and a minority had high-risk cytogenetics (37.3% and 30.6%, respectively).
The median time between diagnosis and HSCT was about 5 months in both groups. Both groups had a median of 2 courses of chemotherapy before transplant (overall range, 1-8).
Most patients in both groups received busulfan plus cyclophosphamide as conditioning—67.5% of the ATG group and 70.8% of the non-ATG group. Some received total-body irradiation plus cyclophosphamide (27.7% and 25.0%, respectively), and a few received total-body irradiation plus etoposide (4.8% and 4.2%, respectively).
Results
After a median follow-up of 24 months, the cumulative incidence of chronic GVHD was significantly lower in the ATG group than the non-ATG group—32.2% and 68.7%, respectively (P<0.001).
In addition, patients in the ATG group were significantly less likely to have severe or extensive chronic GVHD.
According to revised Seattle criteria, the rate of limited chronic GVHD was 20.5% in the ATG group and 30.6% in the non-ATG group. And the rates of extensive chronic GVHD were 6% and 33.3%, respectively (P<0.001).
According to revised NIH criteria, the rate of mild chronic GVHD was 15.7% in the ATG group and 16.7% in the non-ATG group. The rates of moderate chronic GVHD were 8.4% and 25%, respectively. And the rates of severe chronic GVHD were 2.4% and 22.2%, respectively (P<0.001).
However, all other outcomes, when assessed alone, were similar between the treatment groups.
The rate of 2-year relapse-free survival was 59.4% in the ATG group and 64.6% in the non-ATG group (P=0.21). The overall survival rates were 74.1% and 77.9%, respectively (P=0.46).
The incidence of relapse was 32.2% and 35.5%, respectively (P=0.17). Infectious complications occurred in 57.8% and 54.2%, respectively (P=0.65). And the rates of acute GVHD were 10.8% and 18.1%, respectively (P=0.13).
However, the rate of a composite endpoint of chronic GVHD-free and relapse-free survival at 2 years was significantly higher in the ATG group than the non-ATG group—36.6% and 16.8%, respectively (P=0.005). ![]()
Prophylaxis and Treatment of Venous Thromboembolism in Cancer Patients
The Case
A 62-year-old woman with a past medical history significant for metastatic adenocarcinoma of the lung presents to the ED with complaints of fever and shortness of breath. She has recently completed her first cycle of carboplatin, pemetrexed, and bevacizumab. Upon admission, she is found to have an absolute neutrophil count of 800 and a platelet count of 48,000. She is admitted for neutropenic fever and placed on IV antimicrobials. Sequential compression devices are initiated for DVT prophylaxis.
Key Clinical Questions
What risk do cancer patients have for VTE?
Patients with cancer have a risk of clinically significant VTE that is four to seven times that of patients without malignancy.1 This is due to a number of reasons:
- Tumor cells produce procoagulant activity inducing thrombin formation;2
- The cancer itself can compress or invade deep veins; and3
- Some cancer therapies such L-asparaginase and thalidomide/lenalidomide, plus high-dose steroids, or anti-estrogen medications such as tamoxifen can also increase patients’ risk of VTE.3,4,5
What inpatients with cancer need VTE prophylaxis?
Much like other hospitalized medical patients, patients with cancer who have reduced mobility and are not on therapeutic anticoagulation should receive pharmacologic prophylaxis unless there is a contraindication.3,6,7,8 Cancer patients with acute medical illnesses should also likely receive prophylaxis if there are no contraindications, because the vast majority of these have factors increasing their VTE risk, including infection, kidney disease, or pulmonary disease.3,6,7,8 Patients undergoing major cancer surgery should also receive pharmacologic prophylaxis prior to surgery and for at least seven to 10 days post-operatively.3,6,7,8
For ambulatory cancer patients who are admitted for short courses of chemotherapy or for minor procedures, however, there is not enough evidence to recommend routine VTE prophylaxis.6,7 An exception to this is patients with multiple myeloma receiving thalidomide-based or lenalidomide-based chemotherapy, who should receive pharmacologic prophylaxis.6,7
What are the options available for VTE in hospitalized cancer patients?
The guidelines for VTE prophylaxis in hospitalized cancer patients recommend either unfractionated heparin (UFH) or low molecular weight heparin (LMWH) for prophylaxis when no contraindications exist.5 The only two LMWH that have been FDA approved for prophylaxis are enoxaparin and dalteparin. When deciding between UFH and LMWH, no evidence shows that one is better than the other in preventing VTE in hospitalized cancer patients.9 There is evidence that the use of LMWH results in a lower incidence of major hemorrhage when compared to UFH.10
What are the contraindications to pharmacologic VTE prophylaxis in cancer patients?
Contraindications for pharmacologic VTE prophylaxis in cancer patients include active major bleeding, thrombocytopenia (platelet count <50,000/µL), severe coagulopathy, inherited bleeding disorder, and at the time of surgery or invasive procedures (including lumbar puncture and epidural or spinal anesthesia).3,6,7 Those with contraindications to pharmacologic VTE prophylaxis should have mechanical prophylaxis instead.
What is the recommended treatment of VTE in cancer patients?
After the diagnosis of pulmonary embolism (PE) or DVT is found, LMWH is the preferred initial anticoagulant instead of UFH unless the patient has severe renal impairment (CrCl of less than 30 ml/min).6,7,8 LMWH is also preferred over warfarin for long-term anticoagulation during the initial six months of therapy.6,7,8 Following the initial six months, continued anticoagulation with either LMWH or warfarin could be considered in patients with active cancer, metastatic disease, or ongoing chemotherapy.6,7,8
When should IVC filters be considered in treating VTE in cancer patients?
IVC filter insertion should be reserved for those patients found to have a DVT or PE who have a contraindication to pharmacologic anticoagulation.3,6 It can be considered in patients who have recurrent VTE despite the appropriate use of optimally dosed LMWH therapy.6,8
What about the new oral anticoagulants?
At this point, because the majority of the major trials looking at the new oral anticoagulants (dabigatran, rivaroxaban, and apixaban) excluded cancer patients or included them only in small numbers, there is not enough evidence to support their use in cancer patients diagnosed with VTE.6,7,8
Back to the Case
On hospital day three, the patient is clinically improved. She is afebrile, her neutropenia has resolved, and her platelet count is up to 80,000. Her only complaint is pain and swelling of her left leg. A lower extremity Doppler is performed. She is found to have an acute left femoral DVT. The patient is then started on enoxaparin 1 mg/kg every 12 hours. Her left leg swelling and pain begin to improve, and she is discharged on enoxaparin and follows up with her oncologist in the next week. TH
Drs. Bell and O’Rourke are assistant professor of medicine in the division of hospital medicine at the University of California San Diego.
References
1. Timp JF, Braekkan SK, Versteeg HH, Cannegieter SC. Epidemiology of cancer-associated venous thrombosis. Blood. 2013;122(10):1712-1723.
2. Blom JW, Doggen CJ, Osanto S, Rosendaal FR. Malignancies, prothrombotic mutations, and the risk of venous thrombosis. JAMA. 2005;293(6):715-722.
3. Streiff MB, Bockenstedt PL, Cataland SR, et al. Venous thromboembolic disease. J Natl Compr Canc Netw. 2013;11(11):1402-1429.
4. Payne JH, Vora AJ. Thrombosis and acute lymphoblastic leukaemia. Br J Haematol. 2007;138(4):430-445.
5. Amir E, Seruga B, Niraula S, Carlsson L, Ocaña A. Toxicity of adjuvant endocrine therapy in postmenopausal breast cancer patients: a systematic review and meta-analysis. J Natl Cancer Inst. 2011;103(17):1299-1309.
6. Lyman GH, Khorana AA, Kuderer NM, et al. Venous thromboembolism prophylaxis and treatment in patients with cancer: American Society of Clinical Oncology clinical practice guideline update. J Clin Oncol. 2013;31(17):2189-2204.
7. Lyman GH, Bohlke K, Khorana AA, et al. Venous thromboembolism prophylaxis and treatment in patients with cancer: american society of clinical oncology clinical practice guideline update 2014. J Clin Oncol. 2015;33(6):654-656.
8. Farge D, Debourdeau P, Beckers M, et al. International clinical practice guidelines for the treatment and prophylaxis of venous thromboembolism in patients with cancer. J Thromb Haemost. 2013;11(1):56-70.
9. Khorana AA. The NCCN clinical practice guidelines on venous thromboembolic disease: strategies for improving VTE prophylaxis in hospitalized cancer patients. Oncologist. 2007;12(11):1361-1370.
10. Mismetti P, Laporte-Simitisidis S, Tardy B, et al. Prevention of venous thromboembolism in internal medicine with unfractionated or low-molecular-weight heparins: a meta-analysis of randomized clinical trials. Thromb Haemost. 2000;83(1):14-19.
I am unworthy
The dream unfolds late in the semester with just a week to go, usually my final semester. My college career has been exemplary … good grades, honor society member, academic behavior any parent would be proud of. But for some reason I realize that I have failed to attend any of the classes of one of my courses, usually a math course. In fact, I’m not sure I have the text or maybe I never purchased it. More frighteningly, I can’t remember in which classroom it meets or even the hour. No one else seems to have noticed my failure to show up for class. Remember, it’s a math course and BSing doesn’t work in math. There is no way I will be able to resurrect myself from this academic disaster. The dream eventually dissolves without resolution, but it will return in some permutation, fortunately less often as I have gotten older. My wife and many of our friends share similar nightmares.
There are many angles from which one can interpret a dream like this, but one explanation is that I finally have been discovered as an impostor. I had studied hard, gotten good grades but at the core of things I was a goof-off and really wasn’t worthy of the adulation I had received. My good works were merely a shell over a life of not doing all the things that other people thought I had been doing.
It turns out that I had fallen into a surprisingly common psychological trap, probably during medical school. Despite accumulating significant amounts of clinical acumen, and in my later years what some might call wisdom, my dream suggests that I still have been unable to free myself of a nagging self-doubt. In 1978, two American psychologists Pauline Clance and Suzanne Imes labeled this phenomenon “the impostor syndrome” (“Learning to Deal with the Impostor Syndrome” by Carl Richards [The New York Times, Oct. 26, 2015]). They characterized it as a feeling “of phoniness in people who believe that they are not intelligent, capable, or creative despite evidence of high achievement.” The victims “are highly motivated to achieve” but “live in fear of being ‘found out’ or exposed as frauds.”
In college, I was in awe of those classmates who could play bridge for hours day after day, write their papers in the wee morning hours on the day they were due, and still get very acceptable grades. I imagined that if these guys had studied a third as much as I did or had simply begun their term papers on the day before they were due, their academic credentials would have blown mine out of the water.
In medical school I always had a sense that I didn’t belong there. I had never heard of anyone else who had gotten into an elite medical school off the waiting list as I had. There must have been a clerical error, and I had been mistaken for the scion of a wealthy benefactor with a similar sounding name. I had been around some smart people before, but my medical school classmates were in a different league altogether.
It turns out I was not alone bobbing in my sea of self-doubt. I learned from a blog entry on KevinMD.com (“The effect of impostor syndrome on medical students” by Aryeh Goldberg, March 1, 2014) of a lecture by Suzanne Poirier at Northwestern’s Feinberg School of Medicine, during which she reported on her analysis of more than forty book-length medical school memoirs. She discovered that a theme of a sense of not belonging ran through most (if not all) of the sources she reviewed. Other observers have wondered how much the impostor syndrome contributes to burnout, depression, and suicidal ideation in medical students.
I suffered from none of those maladies, but my feeling of unworthiness followed me into practice. Even as I acquired more experience during hundreds of thousands of patient encounters, I continued to worry that the next patient through the door would be the end of a decade’s long string of good fortune and my clinical ineptitude would be unmasked.
One of the most effective strategies for dealing with such feelings is sharing them. Unfortunately, most physicians don’t often find themselves in settings in which they can comfortably share these feelings with their peers. And of course it is probably not the best idea to share your self-doubts when you are trying to reassure a patient who is feeling vulnerable herself. Finding the balance between admitting that we don’t know everything and projecting the image that we know more than enough to help our patients is one of the biggest challenges facing us as we struggle to master the art of clinical medicine.
I will leave the question of whether I was an impostor to those who can be more objective. All I know is that I was damn lucky for 40 years.
Dr. Wilkoff practiced primary care pediatrics in Brunswick, Maine, for nearly 40 years. He has authored several books on behavioral pediatrics including “How to Say No to Your Toddler.”

Save your breath
If you haven’t already stopped investing your limited supply of office time in fruitless attempts to convince vaccine-hesitant parents to immunize their children, a small study at the University of North Carolina Women’s Hospital in Chapel Hill might finally convince you it’s time to save your breath for other more achievable goals. In a survey of 171 parents, 72% reported that they already had settled on their vaccine preferences prior to pregnancy.
This was a limited survey and may not reflect the responses of a national sample of parents, but it is concerning in light of several other studies that paint a similar gloomy picture. One such study found that even when vaccine-denying parents were presented with educational materials that they acknowledged seemed valid, they continued to withhold vaccines by falling back on other arguments to support their views (“Effective Messages in Vaccine Promotion: A Randomized Trial” by Nyhan et al. [Pediatrics. 2014 Apr;133(4):e835-42]).

If a larger and more geographically diverse study continues to find that the die is cast well before pediatricians have gotten our chance to discuss vaccines with parents-to-be, we will need to rethink our strategies for dealing with vaccine refusers. For those pediatricians who already ask vaccine decliners to find another practice, this new study suggests that they could save themselves time and trouble by advertising their policy to the obstetricians in their communities. This proactive advertising would require some courage, but in the long run it probably makes economic sense.
However, for most pediatricians it may be better to wait in hopes that future research can determine exactly when and under what circumstances most vaccine decliners arrive at their unfortunate decisions. How often was it a philosophy that they inherited from their parents? How often did it reflect their religious views? How often did it evolve from something they heard in school? Junior high, high school, college? Was it a science class, or history, or philosophy?
Was it the result of some media story? TV? Print? Internet? If they can recall a particular show or website, what was it that made it sound so convincing? If it was an individual, was it a friend, celebrity, or a teacher?
A study this detailed would be time consuming and labor intensive, as it would be best done in face-to-face structured interviews by someone who could project a nonjudgmental aura. It would necessarily be retrospective. But it might yield some surprising and helpful information that could be used to target our attack on the epidemic of vaccine refusal.
We know that outbreaks of certain infectious diseases, smallpox being the prime example, do not respond to media blitzes and immunization campaigns. Epidemics will continue to roll along unchecked until a labor-intensive, boots-on-the-ground, door-to-door case-finding effort is undertaken. Vaccine refusal may be similar to smallpox. It appears to be unresponsive to mass media and educational initiatives. It may continue to plague us until we chase down its roots.
Whatever strategy we try next, it is clear that although most parents report that they consider pediatricians among their most trusted sources of health information for their children, we are failing to reach a segment of our target audience. We are too late, long after the die is cast.
Dr. Wilkoff practiced primary care pediatrics in Brunswick, Maine, for nearly 40 years. He has authored several books on behavioral pediatrics including “How to Say No to Your Toddler.”
*This story was updated 1/28/2016.
If you haven’t already stopped investing your limited supply of office time in fruitless attempts to convince vaccine-hesitant parents to immunize their children, a small study at the University of North Carolina Women’s Hospital in Chapel Hill might finally convince you it’s time to save your breath for other more achievable goals. In a survey of 171 parents, 72% reported that they already had settled on their vaccine preferences prior to pregnancy.
This was a limited survey and may not reflect the responses of a national sample of parents, but it is concerning in light of several other studies that paint a similar gloomy picture. One such study found that even when vaccine-denying parents were presented with educational materials that they acknowledged seemed valid, they continued to withhold vaccines by falling back on other arguments to support their views (“Effective Messages in Vaccine Promotion: A Randomized Trial” by Nyhan et al. [Pediatrics. 2014 Apr;133(4):e835-42]).
If a larger and more geographically diverse study continues to find that the die is cast well before pediatricians have gotten our chance to discuss vaccines with parents-to-be, we will need to rethink our strategies for dealing with vaccine refusers. For those pediatricians who already ask vaccine decliners to find another practice, this new study suggests that they could save themselves time and trouble by advertising their policy to the obstetricians in their communities. This proactive advertising would require some courage, but in the long run it probably makes economic sense.
However, for most pediatricians it may be better to wait in hopes that future research can determine exactly when and under what circumstances most vaccine decliners arrive at their unfortunate decisions. How often was it a philosophy that they inherited from their parents? How often did it reflect their religious views? How often did it evolve from something they heard in school? Junior high, high school, college? Was it a science class, or history, or philosophy?
Was it the result of some media story? TV? Print? Internet? If they can recall a particular show or website, what was it that made it sound so convincing? If it was an individual, was it a friend, celebrity, or a teacher?
A study this detailed would be time consuming and labor intensive, as it would be best done in face-to-face structured interviews by someone who could project a nonjudgmental aura. It would necessarily be retrospective. But it might yield some surprising and helpful information that could be used to target our attack on the epidemic of vaccine refusal.
We know that outbreaks of certain infectious diseases, smallpox being the prime example, do not respond to media blitzes and immunization campaigns. Epidemics will continue to roll along unchecked until a labor-intensive, boots-on-the-ground, door-to-door case-finding effort is undertaken. Vaccine refusal may be similar to smallpox. It appears to be unresponsive to mass media and educational initiatives. It may continue to plague us until we chase down its roots.
Whatever strategy we try next, it is clear that although most parents report that they consider pediatricians among their most trusted sources of health information for their children, we are failing to reach a segment of our target audience. We are too late, long after the die is cast.
Dr. Wilkoff practiced primary care pediatrics in Brunswick, Maine, for nearly 40 years. He has authored several books on behavioral pediatrics including “How to Say No to Your Toddler.”
*This story was updated 1/28/2016.

Diagnosis and Management of Cold Urticaria
Cold urticaria is a rare condition characterized by a localized or systemic eruption of papules upon exposure of the skin to cold air, liquids, and/or objects. In some cases, angioedema and anaphylaxis can occur. The wheal-and-flare reaction results from a localized or systemic release of histamine, leukotrienes, and various other proinflammatory mast cell mediators. Cold urticaria can be acquired or follow an autosomal-dominant familial transmission pattern. Acquired cold urticaria often presents in young adulthood with a mean duration of 4 to 5 years and remission or improvement of symptoms after 5 years in 50% of cases.1 The familial variant most commonly presents in early childhood and endures throughout the patient’s life.2 Cold urticaria generally is classified as acute or chronic if symptoms persist for more than 6 weeks. Pharmacologic therapies with prophylactic effects that may reduce the intensity of symptoms or inhibit their development include antihistamines, leuko-triene receptor antagonists, biologics, and glucocorticoids. We present the case of a 23-year-old man with cold urticaria that was refractory to initial treatment with H1 antihistamines along with a review of the literature.
Case Report
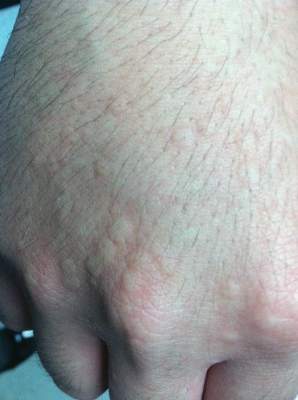
A 23-year-old man presented to the dermatology clinic for evaluation of recurrent burning, itching, and sometimes development of a painful rash on the face, neck, and arms of 2 years’ duration that typically occurred following exposure to cold, wind, and rain. He also developed symptoms in warm weather when exposed to wind while sweating. His medical history was remarkable for asthma, which was not active. He was not taking any medications and had no known drug or environmental allergies. No other members of his household developed similar symptoms. His only successful means of prevention was to stay indoors, which thereby limited his activities.
Physical examination of the dorsal hands following an ice cube test revealed numerous 3- to 5-mm urticarial papules with surrounding erythema (Figure).
Following the initial evaluation, the patient was treated unsuccessfully with a mix of first- and second-generation antihistamines in gradually increasing doses to a maximum dose of loratadine 20 mg once daily, cetirizine 20 mg once daily, and hydroxyzine 20 mg once daily. A course of montelukast 10 mg once daily was started in addition to the antihistamines and led to a reduction in the severity of the lesions but not the frequency and did not relieve the burning sensation; the patient subsequently discontinued therapy. Next, a trial of cyclosporine was attempted, but the patient reported that it caused emesis and subsequently discontinued treatment. The patient also did not tolerate prednisone. He eventually decided to treat his symptoms with lifestyle choices only, such as making sure to be well covered in cold temperatures.
Comment
Cold urticaria is a physical urticaria resulting from mast cell degranulation and the subsequent release of histamine and proinflammatory cytokines upon exposure of the skin to cold air, liquid, and/or objects. Symtpoms usually are limited to localized exposed areas of the skin but also can be generalized. Cold urticaria typically manifests as erythematous, pruritic papules and also may be accompanied by deep tissue involvement resulting in angioedema and/or anaphylaxis. Symptoms usually occur within minutes of cold exposure; however, in delayed-type cold urticaria, symptoms may develop 24 to 72 hours later.3 Prevalence is relatively equal in both sexes and is highest among young adults (ie, 18–27 years old), with a greater incidence associated with cold climates.4 In one study, the overall incidence of acquired cold urticaria in Central Europe was estimated to be 0.05%.1
Systemic involvement may occur with extensive cold contact, ranging in severity from generalized urticaria to anaphylaxis and involvement of the cardiovascular, respiratory, and/or gastrointestinal systems.5 Patients who exhibit systemic responses to cold exposure should avoid swimming in cold water, as this may induce anaphylaxis and result in injury or death. In a 2004 study that included 30 children with cold urticaria at a tertiary center in Boston,6 11 (36.7%) participants who underwent cold stimulation testing developed systemic symptoms; 5 (45.5%) participants experienced respiratory distress and 8 (72.7%) experienced a decrease in level of consciousness (eg, faintness, dizziness, hypotension). Aquatic activity was the trigger in all 11 participants except for 1 (9.0%), who experienced systemic symptoms on exposure to cold air. In the same study, 14 (46.7%) participants were diagnosed with asthma and 15 (50%) were diagnosed with allergic rhinitis. Of the 28 participants whose family histories were available for review, 25 (89.3%) had a family history of atopic disease.6 A 2008 Greek study4 of 62 adults with acquired cold urticaria found that 18 (29%) participants had at least 1 serious systemic response resulting in generalized urticaria or angioedema associated with hypotension (eg, dizziness, fainting, disorientation, shock). In both of these studies, a majority of the serious systemic reactions were associated with cold water activities.
Cold urticaria is primarily an idiopathic phenomenon but can be classified as acquired or familial. Acquired cold urticaria may result from primary or secondary causes, which can include cryoglobulinemia, human immunodeficiency virus, syphilis, mononucleosis, rubeola, toxoplasmosis, varicella, hepatitis, and various drugs (eg, penicillin, angiotensin-converting enzyme inhibitors, oral contraceptives).7 Familial causes include cryopyrin-associated periodic syndrome, phospholipase Cγ2 gene–associated antibody deficiency and immune dysregulation, Muckle-Wells syndrome, and neonatal-onset multisystem inflammatory disease.
Typically, cold urticaria is diagnosed using cold stimulation tests such as the ice cube test, in which an ice cube is applied directly to the patient’s skin for 3 to 5 minutes and a response is measured 10 minutes after its removal.8 This test has been shown to have a sensitivity of 83% to 90% and a specificity of 100%.9 Alternatively, cold urticaria may be diagnosed through the use of a Peltier element-based cold-provocation device, which exposes the patient to a variety of temperatures in order for clinicians to determine the threshold upon which there is an observable reaction. With a sensitivity of 93% and specificity of 100%, the accuracy of this test is similar to that of the ice cube test.10 If a patient has a history of serious systemic involvement, any testing that exposes the patient to extensive cold exposure should be used with caution.
Patients should be counseled about potential serious systemic symptoms and the importance of wearing appropriate cold-weather clothing. Avoidance of cold water activities and overexposure to cold weather also should be emphasized. Pharmacologic therapy for prophylaxis typically includes a second-generation H1 antihistamine (eg, cetirizine, loratadine, desloratadine). Since these drugs have been shown to be less sedating than first-generation antihistamines, they are considered a better choice for chronic treatment. At high doses, however, these medications may have a sedative effect; therefore, nighttime use is preferable if possible. The standard dosage is 5 mg to 10 mg daily for oral cetirizine, 10 mg daily for oral loratadine, and 5 mg daily for oral desloratadine; however, up to 4 times the standard dosage of these medications may be required for effective treatment of cold urticaria.11 Given the associated risk of anaphylaxis, patients should be prescribed an epinephrine pen and educated about its appropriate use, including the importance of keeping the pen accessible at all times.
In refractory cases of cold urticaria, an H2 antihistamine (eg, ranitidine) can be used in conjunction with H1 antihistamines.12 Omalizumab, an IgE-mediated treatment, also has been shown to be safe and effective in patients with recalcitrant physical urticaria, including cold urticaria.13,14 One report described the case of a 69-year-old woman with cold urticaria who was unable to leave the house without developing a widespread eruption on the face, trunk, and limbs.15 After undergoing a series of unsuccessful treatments, the patient was started on cyclosporine 125 mg twice daily, which was reduced to 100 mg twice daily after 4 weeks of therapy and then reduced to 75 mg twice daily after 4 months of treatment. One week after therapy was initiated the patient reported that she was able to leave the house, and after 4 weeks of treatment the lesions only developed on the hands and feet. The patient remained in remission with a low-dose therapy of cyclosporine 75 mg twice daily with lesions only occurring on the hands and feet. The low-dose maintenance therapy was associated with minimal adverse effects.15 To our knowledge, there are no known large studies on the efficacy of cyclosporine in the treatment of cold urticaria.
Leukotriene receptor antagonists (eg, montelukast, zafirlukast, zileuton) have been used to treat chronic urticaria. In one report, montelukast was used in a 29-year-old woman with cold urticaria who had initially been treated with cetirizine 30 mg daily, cyproheptadine 4 mg daily, and doxycycline 200 mg daily with minimal to no relief. After treatment with montelukast, she experienced notable and stable improvements in symptoms.16 Hydroxychloroquine also has been shown to be safe and to substantially improve quality of life in patients with idiopathic chronic urticaria.17 Methotrexate (with close patient monitoring for adverse effects) has been reported to benefit some patients whose chronic urticaria was unresponsive to standard treatment.18 Treatment regimens for chronic urticaria have shown variable success in the treatment of cold urticaria and may be considered in cases refractory to treatment with high-dose second-generation H1 antihistamines.
Topical application of capsaicin for 4 to 7 days has been shown to deplete the neuropeptides in sensory fibers that may be involved in cold reactions, although skin irritation may prevent usage.19
Prednisone therapy was used in a small study of 6 patients with acquired cold urticaria.20 Three patients were treated for periods of 3 to 5 days with prednisone 20 mg each morning. Three other patients were given a single dose of prednisone 20 mg or 25 mg in the morning, depending on body weight. Following prednisone therapy, complete or partial pruritus was subjectively improved in all 6 patients. Additionally, significant reductions in venous histamine concentrations at 5 and 10 minutes following cold immersion were noted (P<.05 and P<.025, respectively); however, no significant improvement in either erythema or edema was noted posttreatment following cold immersion.20 Despite these findings, prednisone has not been shown to consistently prevent histamine release. Another report noted the case of a 47-year-old man with cold urticaria who required hypothermic cardiopulmonary bypass. Pretreatment with prednisone 20 mg daily and preoperative hydrocortisone 100 mg intravenously did not prevent histamine release.21
Cold desensitization (ie, exposing progressively larger areas of the patient’s skin to increasingly colder water) may induce tolerance to cold and decrease the temperature threshold at which symptoms develop; however, patients with known serious systemic reactions should be tested with extreme caution and only under the supervision of a clinician.22,23 Tolerance may wane when cold desensitization therapy is stopped.
The prognosis for patients with acquired cold urticaria generally is good. Improvement of symptoms or full remission occurs within 5 to 6 years in 50% of patients.24 Once remission has occurred, patients generally remain symptom free. For other familial variants, symptoms may last a lifetime.
Conclusion
This case report and review of the literature highlights the limitations of cold urticaria and the importance of effective management in improving quality of life in affected patients. Symptoms may limit patients’ ability to work in certain environments, inhibit them from engaging in daily activities, and even prevent them from leaving their homes in colder temperatures. In addition to behavioral modifications, pharmacologic management may provide symptomatic relief. Antihistamines are the first line of treatment in cold urticaria. Second-generation antihistamines, which are more selective for H1 receptors and less sedating, are generally recommended. Up to 4 times the standard dosage of these medications may be required for effective treatment.5 The primary goal of therapy in mild to moderate cases is improvement in quality of life.
- Siebenhaar F, Weller K, Mlynek A, et al. Acquired cold urticaria: clinical picture and update on diagnosis and treatment. Clin Exp Dermatol. 2007;32:241-245.
- Gandhi C, Healy C, Wanderer AA, et al. Familial atypical cold urticaria: description of a new hereditary disease. J Allergy Clin Immunol. 2009;124:1245-1250.
- Bäck O, Larsen A. Delayed cold urticaria. Acta Derm Venereol. 1978;58:369-371.
- Katsarou-Katsari A, Makris M, Lagogianni E, et al. Clinical features and natural history of acquired cold urticaria in a tertiary referral hospital: a 10-year prospective study. J Eur Acad Dermatol Venereol. 2008;22:1405-1411.
- Wanderer AA, Grandel KE, Wasserman SI, et al. Clinical characteristics of cold-induced systemic reactions in acquired cold urticaria syndromes: recommendations for prevention of this complication and a proposal for a diagnostic classification of cold urticaria. J Allergy Clin Immunol. 1986;78(3 Pt 1):417-423.
- Alangari AA, Twarog FJ, Shih MC, et al. Clinical features and anaphylaxis in children with cold urticaria. Pediatrics. 2004;113:e313-e317.
- Wanderer AA, Hoffman HM. The spectrum of acquired and familial cold-induced urticaria/urticaria-like syndromes. Immunol Allergy Clin North Am. 2004;24:259-286.
- Visitsuntorn N, Tuchinda M, Arunyanark N, et al. Ice cube test in children with cold urticaria. Asian Pac J Allergy Immunol. 1992;10:111-115.
- Neittaanmäki H. Cold urticaria. clinical findings in 220 patients. J Am Acad Dermatol. 1985;13:636-644.
- Siebenhaar F, Staubach P, Metz M, et al. Peltier effect-based temperature challenge: an improved method for diagnosing cold urticaria. J Allergy Clin Immunol. 2004;114:1224-1225.
- Siebenhaar F, Degener F, Zuberbier T, et al. High-dose desloratadine decreases wheal volume and improves cold provocation thresholds compared with standard-dose treatment in patients with acquired cold urticaria: a randomized, placebo-controlled, crossover study. J Allergy Clin Immunol. 2009;123:672-679.
- Duc J, Pécoud A. Successful treatment of idiopathic cold urticaria with the association of H1 and H2 antagonists: a case report. Ann Allergy. 1986;56:355-357.
- Metz M, Altrichter S, Ardelean E, et al. Anti-immunoglobulin E treatment of patients with recalcitrant physical urticaria. Int Arch Allergy Immunol. 2011;154:177-180.
- Boyce JA. Successful treatment of cold-induced urticaria/anaphylaxis with anti-IgE. J Allergy Clin Immunol. 2006;117:1415-1418.
- Marsland AM, Beck MH. Cold urticaria responding to systemic cyclosporine. Br J Dermatol. 2003;149:214-215.
- Hani N, Hartmann K, Casper C, et al. Improvement of cold urticaria by treatment with the leukotriene receptor antagonist montelukast. Acta Derm Venereol. 2000;80:229.
- Reeves GE, Boyle MJ, Bonfield J, et al. Impact of hydroxychloroquine therapy on chronic urticaria: chronic autoimmune urticaria study and evaluation. Intern Med J. 2004;34:182-186.
- Perez A, Woods A, Grattan CE. Methotrexate: a useful steroid-sparing agent in recalcitrant chronic urticaria. Br J Dermatol. 2010;162:191-194.
- Tóth-Kása I, Jancsó G, Obál F Jr, et al. Involvement of sensory nerve endings in cold and heat urticaria. J Invest Dermatol. 1983;80:34-36.
- Black AK, Keahey TM, Eady RA, et al. Dissociation of histamine release and clinical improvement following treatment of acquired cold urticaria by prednisone. Br J Clin Pharmacol. 1981;12:327-331.
- Johnston WE, Moss J, Philbin DM, et al. Management of cold urticaria during hypothermic cardiopulmonary bypass. N Engl J Med. 1982;306:219-221.
- Krause K, Zuberbier T, Maurer, M. Modern Approaches to the diagnosis and treatment of cold contact urticaria. Curr Allergy Asthma Rep. 2010;10:273-279.
- von Mackensen YA, Sticherling M. Cold urticaria: tolerance induction with cold baths. Br J Dermatol. 2007;157:835-836.
- Möller A, Henning M, Zuberbier T, et al. Epidemiology and clinical aspects of cold urticaria [article in German]. Hautarzt. 1996;47:510-514.
Cold urticaria is a rare condition characterized by a localized or systemic eruption of papules upon exposure of the skin to cold air, liquids, and/or objects. In some cases, angioedema and anaphylaxis can occur. The wheal-and-flare reaction results from a localized or systemic release of histamine, leukotrienes, and various other proinflammatory mast cell mediators. Cold urticaria can be acquired or follow an autosomal-dominant familial transmission pattern. Acquired cold urticaria often presents in young adulthood with a mean duration of 4 to 5 years and remission or improvement of symptoms after 5 years in 50% of cases.1 The familial variant most commonly presents in early childhood and endures throughout the patient’s life.2 Cold urticaria generally is classified as acute or chronic if symptoms persist for more than 6 weeks. Pharmacologic therapies with prophylactic effects that may reduce the intensity of symptoms or inhibit their development include antihistamines, leuko-triene receptor antagonists, biologics, and glucocorticoids. We present the case of a 23-year-old man with cold urticaria that was refractory to initial treatment with H1 antihistamines along with a review of the literature.
Case Report
A 23-year-old man presented to the dermatology clinic for evaluation of recurrent burning, itching, and sometimes development of a painful rash on the face, neck, and arms of 2 years’ duration that typically occurred following exposure to cold, wind, and rain. He also developed symptoms in warm weather when exposed to wind while sweating. His medical history was remarkable for asthma, which was not active. He was not taking any medications and had no known drug or environmental allergies. No other members of his household developed similar symptoms. His only successful means of prevention was to stay indoors, which thereby limited his activities.
Physical examination of the dorsal hands following an ice cube test revealed numerous 3- to 5-mm urticarial papules with surrounding erythema (Figure).
Following the initial evaluation, the patient was treated unsuccessfully with a mix of first- and second-generation antihistamines in gradually increasing doses to a maximum dose of loratadine 20 mg once daily, cetirizine 20 mg once daily, and hydroxyzine 20 mg once daily. A course of montelukast 10 mg once daily was started in addition to the antihistamines and led to a reduction in the severity of the lesions but not the frequency and did not relieve the burning sensation; the patient subsequently discontinued therapy. Next, a trial of cyclosporine was attempted, but the patient reported that it caused emesis and subsequently discontinued treatment. The patient also did not tolerate prednisone. He eventually decided to treat his symptoms with lifestyle choices only, such as making sure to be well covered in cold temperatures.
Comment
Cold urticaria is a physical urticaria resulting from mast cell degranulation and the subsequent release of histamine and proinflammatory cytokines upon exposure of the skin to cold air, liquid, and/or objects. Symtpoms usually are limited to localized exposed areas of the skin but also can be generalized. Cold urticaria typically manifests as erythematous, pruritic papules and also may be accompanied by deep tissue involvement resulting in angioedema and/or anaphylaxis. Symptoms usually occur within minutes of cold exposure; however, in delayed-type cold urticaria, symptoms may develop 24 to 72 hours later.3 Prevalence is relatively equal in both sexes and is highest among young adults (ie, 18–27 years old), with a greater incidence associated with cold climates.4 In one study, the overall incidence of acquired cold urticaria in Central Europe was estimated to be 0.05%.1
Systemic involvement may occur with extensive cold contact, ranging in severity from generalized urticaria to anaphylaxis and involvement of the cardiovascular, respiratory, and/or gastrointestinal systems.5 Patients who exhibit systemic responses to cold exposure should avoid swimming in cold water, as this may induce anaphylaxis and result in injury or death. In a 2004 study that included 30 children with cold urticaria at a tertiary center in Boston,6 11 (36.7%) participants who underwent cold stimulation testing developed systemic symptoms; 5 (45.5%) participants experienced respiratory distress and 8 (72.7%) experienced a decrease in level of consciousness (eg, faintness, dizziness, hypotension). Aquatic activity was the trigger in all 11 participants except for 1 (9.0%), who experienced systemic symptoms on exposure to cold air. In the same study, 14 (46.7%) participants were diagnosed with asthma and 15 (50%) were diagnosed with allergic rhinitis. Of the 28 participants whose family histories were available for review, 25 (89.3%) had a family history of atopic disease.6 A 2008 Greek study4 of 62 adults with acquired cold urticaria found that 18 (29%) participants had at least 1 serious systemic response resulting in generalized urticaria or angioedema associated with hypotension (eg, dizziness, fainting, disorientation, shock). In both of these studies, a majority of the serious systemic reactions were associated with cold water activities.
Cold urticaria is primarily an idiopathic phenomenon but can be classified as acquired or familial. Acquired cold urticaria may result from primary or secondary causes, which can include cryoglobulinemia, human immunodeficiency virus, syphilis, mononucleosis, rubeola, toxoplasmosis, varicella, hepatitis, and various drugs (eg, penicillin, angiotensin-converting enzyme inhibitors, oral contraceptives).7 Familial causes include cryopyrin-associated periodic syndrome, phospholipase Cγ2 gene–associated antibody deficiency and immune dysregulation, Muckle-Wells syndrome, and neonatal-onset multisystem inflammatory disease.
Typically, cold urticaria is diagnosed using cold stimulation tests such as the ice cube test, in which an ice cube is applied directly to the patient’s skin for 3 to 5 minutes and a response is measured 10 minutes after its removal.8 This test has been shown to have a sensitivity of 83% to 90% and a specificity of 100%.9 Alternatively, cold urticaria may be diagnosed through the use of a Peltier element-based cold-provocation device, which exposes the patient to a variety of temperatures in order for clinicians to determine the threshold upon which there is an observable reaction. With a sensitivity of 93% and specificity of 100%, the accuracy of this test is similar to that of the ice cube test.10 If a patient has a history of serious systemic involvement, any testing that exposes the patient to extensive cold exposure should be used with caution.
Patients should be counseled about potential serious systemic symptoms and the importance of wearing appropriate cold-weather clothing. Avoidance of cold water activities and overexposure to cold weather also should be emphasized. Pharmacologic therapy for prophylaxis typically includes a second-generation H1 antihistamine (eg, cetirizine, loratadine, desloratadine). Since these drugs have been shown to be less sedating than first-generation antihistamines, they are considered a better choice for chronic treatment. At high doses, however, these medications may have a sedative effect; therefore, nighttime use is preferable if possible. The standard dosage is 5 mg to 10 mg daily for oral cetirizine, 10 mg daily for oral loratadine, and 5 mg daily for oral desloratadine; however, up to 4 times the standard dosage of these medications may be required for effective treatment of cold urticaria.11 Given the associated risk of anaphylaxis, patients should be prescribed an epinephrine pen and educated about its appropriate use, including the importance of keeping the pen accessible at all times.
In refractory cases of cold urticaria, an H2 antihistamine (eg, ranitidine) can be used in conjunction with H1 antihistamines.12 Omalizumab, an IgE-mediated treatment, also has been shown to be safe and effective in patients with recalcitrant physical urticaria, including cold urticaria.13,14 One report described the case of a 69-year-old woman with cold urticaria who was unable to leave the house without developing a widespread eruption on the face, trunk, and limbs.15 After undergoing a series of unsuccessful treatments, the patient was started on cyclosporine 125 mg twice daily, which was reduced to 100 mg twice daily after 4 weeks of therapy and then reduced to 75 mg twice daily after 4 months of treatment. One week after therapy was initiated the patient reported that she was able to leave the house, and after 4 weeks of treatment the lesions only developed on the hands and feet. The patient remained in remission with a low-dose therapy of cyclosporine 75 mg twice daily with lesions only occurring on the hands and feet. The low-dose maintenance therapy was associated with minimal adverse effects.15 To our knowledge, there are no known large studies on the efficacy of cyclosporine in the treatment of cold urticaria.
Leukotriene receptor antagonists (eg, montelukast, zafirlukast, zileuton) have been used to treat chronic urticaria. In one report, montelukast was used in a 29-year-old woman with cold urticaria who had initially been treated with cetirizine 30 mg daily, cyproheptadine 4 mg daily, and doxycycline 200 mg daily with minimal to no relief. After treatment with montelukast, she experienced notable and stable improvements in symptoms.16 Hydroxychloroquine also has been shown to be safe and to substantially improve quality of life in patients with idiopathic chronic urticaria.17 Methotrexate (with close patient monitoring for adverse effects) has been reported to benefit some patients whose chronic urticaria was unresponsive to standard treatment.18 Treatment regimens for chronic urticaria have shown variable success in the treatment of cold urticaria and may be considered in cases refractory to treatment with high-dose second-generation H1 antihistamines.
Topical application of capsaicin for 4 to 7 days has been shown to deplete the neuropeptides in sensory fibers that may be involved in cold reactions, although skin irritation may prevent usage.19
Prednisone therapy was used in a small study of 6 patients with acquired cold urticaria.20 Three patients were treated for periods of 3 to 5 days with prednisone 20 mg each morning. Three other patients were given a single dose of prednisone 20 mg or 25 mg in the morning, depending on body weight. Following prednisone therapy, complete or partial pruritus was subjectively improved in all 6 patients. Additionally, significant reductions in venous histamine concentrations at 5 and 10 minutes following cold immersion were noted (P<.05 and P<.025, respectively); however, no significant improvement in either erythema or edema was noted posttreatment following cold immersion.20 Despite these findings, prednisone has not been shown to consistently prevent histamine release. Another report noted the case of a 47-year-old man with cold urticaria who required hypothermic cardiopulmonary bypass. Pretreatment with prednisone 20 mg daily and preoperative hydrocortisone 100 mg intravenously did not prevent histamine release.21
Cold desensitization (ie, exposing progressively larger areas of the patient’s skin to increasingly colder water) may induce tolerance to cold and decrease the temperature threshold at which symptoms develop; however, patients with known serious systemic reactions should be tested with extreme caution and only under the supervision of a clinician.22,23 Tolerance may wane when cold desensitization therapy is stopped.
The prognosis for patients with acquired cold urticaria generally is good. Improvement of symptoms or full remission occurs within 5 to 6 years in 50% of patients.24 Once remission has occurred, patients generally remain symptom free. For other familial variants, symptoms may last a lifetime.
Conclusion
This case report and review of the literature highlights the limitations of cold urticaria and the importance of effective management in improving quality of life in affected patients. Symptoms may limit patients’ ability to work in certain environments, inhibit them from engaging in daily activities, and even prevent them from leaving their homes in colder temperatures. In addition to behavioral modifications, pharmacologic management may provide symptomatic relief. Antihistamines are the first line of treatment in cold urticaria. Second-generation antihistamines, which are more selective for H1 receptors and less sedating, are generally recommended. Up to 4 times the standard dosage of these medications may be required for effective treatment.5 The primary goal of therapy in mild to moderate cases is improvement in quality of life.
- Siebenhaar F, Weller K, Mlynek A, et al. Acquired cold urticaria: clinical picture and update on diagnosis and treatment. Clin Exp Dermatol. 2007;32:241-245.
- Gandhi C, Healy C, Wanderer AA, et al. Familial atypical cold urticaria: description of a new hereditary disease. J Allergy Clin Immunol. 2009;124:1245-1250.
- Bäck O, Larsen A. Delayed cold urticaria. Acta Derm Venereol. 1978;58:369-371.
- Katsarou-Katsari A, Makris M, Lagogianni E, et al. Clinical features and natural history of acquired cold urticaria in a tertiary referral hospital: a 10-year prospective study. J Eur Acad Dermatol Venereol. 2008;22:1405-1411.
- Wanderer AA, Grandel KE, Wasserman SI, et al. Clinical characteristics of cold-induced systemic reactions in acquired cold urticaria syndromes: recommendations for prevention of this complication and a proposal for a diagnostic classification of cold urticaria. J Allergy Clin Immunol. 1986;78(3 Pt 1):417-423.
- Alangari AA, Twarog FJ, Shih MC, et al. Clinical features and anaphylaxis in children with cold urticaria. Pediatrics. 2004;113:e313-e317.
- Wanderer AA, Hoffman HM. The spectrum of acquired and familial cold-induced urticaria/urticaria-like syndromes. Immunol Allergy Clin North Am. 2004;24:259-286.
- Visitsuntorn N, Tuchinda M, Arunyanark N, et al. Ice cube test in children with cold urticaria. Asian Pac J Allergy Immunol. 1992;10:111-115.
- Neittaanmäki H. Cold urticaria. clinical findings in 220 patients. J Am Acad Dermatol. 1985;13:636-644.
- Siebenhaar F, Staubach P, Metz M, et al. Peltier effect-based temperature challenge: an improved method for diagnosing cold urticaria. J Allergy Clin Immunol. 2004;114:1224-1225.
- Siebenhaar F, Degener F, Zuberbier T, et al. High-dose desloratadine decreases wheal volume and improves cold provocation thresholds compared with standard-dose treatment in patients with acquired cold urticaria: a randomized, placebo-controlled, crossover study. J Allergy Clin Immunol. 2009;123:672-679.
- Duc J, Pécoud A. Successful treatment of idiopathic cold urticaria with the association of H1 and H2 antagonists: a case report. Ann Allergy. 1986;56:355-357.
- Metz M, Altrichter S, Ardelean E, et al. Anti-immunoglobulin E treatment of patients with recalcitrant physical urticaria. Int Arch Allergy Immunol. 2011;154:177-180.
- Boyce JA. Successful treatment of cold-induced urticaria/anaphylaxis with anti-IgE. J Allergy Clin Immunol. 2006;117:1415-1418.
- Marsland AM, Beck MH. Cold urticaria responding to systemic cyclosporine. Br J Dermatol. 2003;149:214-215.
- Hani N, Hartmann K, Casper C, et al. Improvement of cold urticaria by treatment with the leukotriene receptor antagonist montelukast. Acta Derm Venereol. 2000;80:229.
- Reeves GE, Boyle MJ, Bonfield J, et al. Impact of hydroxychloroquine therapy on chronic urticaria: chronic autoimmune urticaria study and evaluation. Intern Med J. 2004;34:182-186.
- Perez A, Woods A, Grattan CE. Methotrexate: a useful steroid-sparing agent in recalcitrant chronic urticaria. Br J Dermatol. 2010;162:191-194.
- Tóth-Kása I, Jancsó G, Obál F Jr, et al. Involvement of sensory nerve endings in cold and heat urticaria. J Invest Dermatol. 1983;80:34-36.
- Black AK, Keahey TM, Eady RA, et al. Dissociation of histamine release and clinical improvement following treatment of acquired cold urticaria by prednisone. Br J Clin Pharmacol. 1981;12:327-331.
- Johnston WE, Moss J, Philbin DM, et al. Management of cold urticaria during hypothermic cardiopulmonary bypass. N Engl J Med. 1982;306:219-221.
- Krause K, Zuberbier T, Maurer, M. Modern Approaches to the diagnosis and treatment of cold contact urticaria. Curr Allergy Asthma Rep. 2010;10:273-279.
- von Mackensen YA, Sticherling M. Cold urticaria: tolerance induction with cold baths. Br J Dermatol. 2007;157:835-836.
- Möller A, Henning M, Zuberbier T, et al. Epidemiology and clinical aspects of cold urticaria [article in German]. Hautarzt. 1996;47:510-514.
Practice Points
- Cold urticaria is a physical urticaria characterized by a localized or systemic eruption of papules upon exposure of the skin to cold air, liquids, and/or objects.
- Symptoms of cold urticaria, which range from erythema, pruritus, and hives to angioedema and sometimes anaphylaxis, may be debilitating for patients; therefore, effective treatment is required to improve quality of life.
- First-line treatment for cold urticaria includes second-generation H1 antihistamines at up to 4 times the standard dosage.

Cancer prevention field riding high into the new year
The new year has us all looking forward and the cancer prevention community is no exception.
In a special report entitled “Transforming Cancer Prevention through Precision Medicine and Immune-Oncology,” a team of experts offer a brief look at what we can expect in the near future for cancer prevention research, including a Pre-Cancer Genome Atlas (PCGA), and highlight some of the recent advances shaping their optimism.
“Just as precision therapy and immunotherapy are transforming cancer treatment, precision medicine and immunoprevention approaches are being translated to the clinic and showing great promise. We stand at the edge of a new frontier that will include comprehensively characterizing the molecular and cellular events that drive premalignant progression (e.g. PCGA),” Dr. Scott M. Lippman, director of the University of California San Diego Moores Cancer Center, and his coauthors wrote (Cancer Prev Res. 2016;9:2-10).
The report details some of the clinical firsts in 2015 including genomic studies suggesting that clonal hematopoiesis is a premalignant state for blood cancer, the first precision medicine trial in cancer prevention (EPOC) reporting that loss of heterozygosity can predict which patients with premalignant mouth lesions are most likely to develop oral cancer, and the U.S. Preventive Services Task Force recommending low-dose aspirin for colorectal cancer prevention based on age and risk.
Randomized trials have also suggested that a single dose of human papillomavirus vaccine can provide durable protection against HPV infection. Tumor biology studies established new chemoprevention for familial adenomatous polyposis syndrome and universal tumor screening guidelines based on DNA mismatch repair mutations and microsatellite instability for colorectal cancer in patients with Lynch syndrome.
Further, remarkable advances have been made in liquid biopsy technology, high-throughput functional screening, and computational biology methods and algorithms that “provide unprecedented opportunities to interrogate the biology of premalignancy...” they noted.
In an American Association for Cancer Research blog post, Dr. Lippman acknowledges that not everyone is the same page when it comes to the underlying principles of cancer prevention.
A “contentious” paper published at the start of 2015 suggested that variations in cancer risk are due to random mutations or what might otherwise be called bad luck. The new year was heralded in by a second paper, however, that came to roughly the opposite conclusion or that most cancers are preventable.
In February, an AACR Cancer Prevention Summit will bring together various stakeholders to discuss the current state of cancer prevention and to identify top priorities and research directions for the field, he noted.
The authors acknowledged grant support from the National Institutes of Health/National Cancer Institute.
FROM CANCER PREVENTION RESEARCH
Flu activity high in New Jersey, South Carolina
Week 12 of the 2015-2016 U.S. flu season saw two states in the “high” range of the influenza-like illness (ILI) activity scale, the Centers for Disease Control and Prevention reported.
New Jersey was at level 10 on the CDC’s 1-10 scale for the week ending Jan. 2, 2016, and South Carolina was at level 9. The next-most-active state, Texas, was at level 7, putting it in the “moderate” range along with Maryland, which was at level 6, the CDC said.
States in the “low” range were Arizona, Oklahoma, Pennsylvania, and Virginia at level 5 and California, Colorado, and Georgia at level 4. Altogether, there were 24 states at level 2 or higher, according to data from the CDC’s Outpatient Influenza-like Illness Surveillance Network.
Puerto Rico also moved up to level 10 for the week ending Jan. 2 and, in a case of geographic concentration, New York City was at level 6 even though New York State was still at level 1.
The proportion of outpatient visits for ILI nationally was 2.8% at the end of week 12, which is above the national baseline of 2.1%. For comparison, at this point in the 2014-2015 flu season, the proportion of visits for ILI was about 6%, and in 2013-2014 it was around 4.5%.
There were two flu-related pediatric deaths reported during the week, bringing the total to six for the 2015-2016 season. One death was associated with an influenza A (H3) virus and the other was associated with
an influenza A (H1N1)pdm09 virus. Looking again at previous years, there had been single weeks with at least six pediatric deaths by week 12 in each of the last three seasons, the CDC report showed.
Proton Pump Inhibitors Linked to Chronic Kidney Disease
The use of proton pump inhibitors increased the risk of chronic kidney disease by 20%-50%, said the authors of two large population-based cohort analyses published online Jan. 11 in JAMA Internal Medicine.
These are the first such studies to link PPI use to chronic kidney disease (CKD), and the association held up after controlling for multiple potential confounders, said Dr. Benjamin Lazarus of Johns Hopkins University, Baltimore, and his associates. “Further research is required to investigate whether PPI use itself causes kidney damage and, if so, the underlying mechanisms of this association,” they wrote.
Proton pump inhibitors have been linked to other adverse health effects but remain among the most frequently prescribed medications in the United States. To further explore the risk of PPI use, the researchers analyzed data for 10,482 adults from the Atherosclerosis Risk in Communities (ARIC) study who were followed for a median of 13.9 years, and a replication cohort of 248,751 patients from a large rural health care system who were followed for a median of 6.2 years.

Incident CKD was defined based on hospital discharge diagnosis codes, reports of end-stage renal disease from the United States Renal Data System Registry, or a glomerular filtration rate of less than 60 mL/min per 1.73 m2 that persisted at follow-up visits (JAMA Intern Med. 2016 Jan 11. doi: 0.1001/jamainternmed.2015.7193).
In the ARIC study, there were 56 cases of CKD among 322 self-reported baseline PPI users, for an incidence of 14.2 cases per 1,000 person-years – significantly higher than the rate of 10.7 cases per 1,000 person-years among self-reported baseline nonusers. The 10-year estimated absolute risk of CKD among baseline users was 11.8% – 3.3% higher than the expected risk had they not used PPIs. Furthermore, PPI users were at significantly higher risk of CKD after demographic, socioeconomic, and clinical variables were accounted for (hazard ratio, 1.50; 95% confidence interval, 1.1-2.0), after modeling varying use of PPIs over time (adjusted HR, 1.3; 95% CI, 1.2-1.5), after directly comparing PPI users with H2 receptor antagonist users (adjusted HR, 1.4; 95% CI, 1.01-1.9), and after comparing baseline PPI users with propensity score–matched nonusers (HR, 1.8; 95% CI, 1.1-2.7).
In the replication cohort, there were 1,921 new cases of CKD among 16,900 patients with an outpatient PPI prescription (incidence of 20.1 cases per 1,000 person-years). The incidence of CKD among the other patients was lower: 18.3 cases per 1,000 person-years. The use of PPIs was significantly associated with incident CKD in all analyses, and the 10-year absolute risk of CKD among baseline PPI users was 15.6% – 1.7% higher than the expected risk had they not used PPIs.
These observational analyses cannot show causality, but a causal relationship between PPIs and CKD “could have a considerable public health impact, give the widespread extent of use,” the researchers emphasized. “More than 15 million Americans used prescription PPIs in 2013, costing more than $10 billion. Study findings suggest that up to 70% of these prescriptions are without indication and that 25% of long-term PPI users could discontinue therapy without developing symptoms. Indeed, there are already calls for the reduction of unnecessary use of PPIs (BMJ. 2008;336:2-3).”
The study was funded by the National Institute of Diabetes and Digestive and Kidney Diseases and the National Heart, Lung, and Blood Institute, both of which are part of the National Institutes of Health. The researchers had no disclosures.
See below for "Views on the News," a pro/con discussion on PPIs.
Available evidence suggests that proton pump inhibitor use is associated with an increased risk of both acute and chronic kidney disease, hypomagnesemia, Clostridium difficile infection, and osteoporotic fractures. Caution in prescribing PPIs should be used in patients at high risk for any of these conditions. Given the association with kidney disease and low magnesium levels, serum creatinine and magnesium levels probably should be monitored in patients using PPIs, especially those using high doses.
Given the evidence that PPI use is linked with a number of adverse outcomes, we recommend that patients and clinicians discuss the potential benefits and risks of PPI treatment, as well as potential alternative regimens such as histamine H2 receptor antagonists or lifestyle changes, before PPIs are prescribed. In patients with symptomatic gastrointestinal reflux, ulcer disease, and severe dyspepsia, the benefits of PPI use likely outweigh its potential harms. For less serious symptoms, however, and for prevention of bleeding in low-risk patients, potential harms may outweigh the benefits. A large number of patients are taking PPIs for no clear reason – often remote symptoms of dyspepsia or heartburn that have since resolved. In these patients, PPIs should be stopped to determine if symptomatic treatment is needed.
Dr. Adam J. Schoenfeld and Dr. Deborah Grady are with the University of California, San Francisco. They had no disclosures. These comments were taken from their editorial (JAMA Intern Med. 2016 Jan 11. doi: 10.1001/jamainternmed.2015.7927).
Pro: When used as indicated, PPIs are good medicine
The bottom line is that PPIs should be used continually for the three specific conditions for which they are known to be beneficial – hypersecretory states, gastroesophageal reflux disease (in all its manifestations), and NSAID/aspirin prophylaxis. As with all drugs, treatment always should be at the lowest effective dose. Although it is quite appropriate to limit chronic PPI use to these groups, given the potential association (no causality identified) with various putative side effects including renal disease, in my opinion, the risks of denying PPIs when indicated are higher than the low risks of renal or other possible side effects.
Dr. David C. Metz is associate chief for clinical affairs, GI division; codirector, esophagology and swallowing program; director, acid-peptic program; codirector, neuroendocrine tumor center; and professor of medicine at the Hospital of the University of Pennsylvania, Philadelphia.
Available evidence suggests that proton pump inhibitor use is associated with an increased risk of both acute and chronic kidney disease, hypomagnesemia, Clostridium difficile infection, and osteoporotic fractures. Caution in prescribing PPIs should be used in patients at high risk for any of these conditions. Given the association with kidney disease and low magnesium levels, serum creatinine and magnesium levels probably should be monitored in patients using PPIs, especially those using high doses.
Given the evidence that PPI use is linked with a number of adverse outcomes, we recommend that patients and clinicians discuss the potential benefits and risks of PPI treatment, as well as potential alternative regimens such as histamine H2 receptor antagonists or lifestyle changes, before PPIs are prescribed. In patients with symptomatic gastrointestinal reflux, ulcer disease, and severe dyspepsia, the benefits of PPI use likely outweigh its potential harms. For less serious symptoms, however, and for prevention of bleeding in low-risk patients, potential harms may outweigh the benefits. A large number of patients are taking PPIs for no clear reason – often remote symptoms of dyspepsia or heartburn that have since resolved. In these patients, PPIs should be stopped to determine if symptomatic treatment is needed.
Dr. Adam J. Schoenfeld and Dr. Deborah Grady are with the University of California, San Francisco. They had no disclosures. These comments were taken from their editorial (JAMA Intern Med. 2016 Jan 11. doi: 10.1001/jamainternmed.2015.7927).
The bottom line is that PPIs should be used continually for the three specific conditions for which they are known to be beneficial – hypersecretory states, gastroesophageal reflux disease (in all its manifestations), and NSAID/aspirin prophylaxis. As with all drugs, treatment always should be at the lowest effective dose. Although it is quite appropriate to limit chronic PPI use to these groups, given the potential association (no causality identified) with various putative side effects including renal disease, in my opinion, the risks of denying PPIs when indicated are higher than the low risks of renal or other possible side effects.
Dr. David C. Metz is associate chief for clinical affairs, GI division; codirector, esophagology and swallowing program; director, acid-peptic program; codirector, neuroendocrine tumor center; and professor of medicine at the Hospital of the University of Pennsylvania, Philadelphia.
The use of proton pump inhibitors increased the risk of chronic kidney disease by 20%-50%, said the authors of two large population-based cohort analyses published online Jan. 11 in JAMA Internal Medicine.
These are the first such studies to link PPI use to chronic kidney disease (CKD), and the association held up after controlling for multiple potential confounders, said Dr. Benjamin Lazarus of Johns Hopkins University, Baltimore, and his associates. “Further research is required to investigate whether PPI use itself causes kidney damage and, if so, the underlying mechanisms of this association,” they wrote.
Proton pump inhibitors have been linked to other adverse health effects but remain among the most frequently prescribed medications in the United States. To further explore the risk of PPI use, the researchers analyzed data for 10,482 adults from the Atherosclerosis Risk in Communities (ARIC) study who were followed for a median of 13.9 years, and a replication cohort of 248,751 patients from a large rural health care system who were followed for a median of 6.2 years.
Incident CKD was defined based on hospital discharge diagnosis codes, reports of end-stage renal disease from the United States Renal Data System Registry, or a glomerular filtration rate of less than 60 mL/min per 1.73 m2 that persisted at follow-up visits (JAMA Intern Med. 2016 Jan 11. doi: 0.1001/jamainternmed.2015.7193).
In the ARIC study, there were 56 cases of CKD among 322 self-reported baseline PPI users, for an incidence of 14.2 cases per 1,000 person-years – significantly higher than the rate of 10.7 cases per 1,000 person-years among self-reported baseline nonusers. The 10-year estimated absolute risk of CKD among baseline users was 11.8% – 3.3% higher than the expected risk had they not used PPIs. Furthermore, PPI users were at significantly higher risk of CKD after demographic, socioeconomic, and clinical variables were accounted for (hazard ratio, 1.50; 95% confidence interval, 1.1-2.0), after modeling varying use of PPIs over time (adjusted HR, 1.3; 95% CI, 1.2-1.5), after directly comparing PPI users with H2 receptor antagonist users (adjusted HR, 1.4; 95% CI, 1.01-1.9), and after comparing baseline PPI users with propensity score–matched nonusers (HR, 1.8; 95% CI, 1.1-2.7).
In the replication cohort, there were 1,921 new cases of CKD among 16,900 patients with an outpatient PPI prescription (incidence of 20.1 cases per 1,000 person-years). The incidence of CKD among the other patients was lower: 18.3 cases per 1,000 person-years. The use of PPIs was significantly associated with incident CKD in all analyses, and the 10-year absolute risk of CKD among baseline PPI users was 15.6% – 1.7% higher than the expected risk had they not used PPIs.
These observational analyses cannot show causality, but a causal relationship between PPIs and CKD “could have a considerable public health impact, give the widespread extent of use,” the researchers emphasized. “More than 15 million Americans used prescription PPIs in 2013, costing more than $10 billion. Study findings suggest that up to 70% of these prescriptions are without indication and that 25% of long-term PPI users could discontinue therapy without developing symptoms. Indeed, there are already calls for the reduction of unnecessary use of PPIs (BMJ. 2008;336:2-3).”
The study was funded by the National Institute of Diabetes and Digestive and Kidney Diseases and the National Heart, Lung, and Blood Institute, both of which are part of the National Institutes of Health. The researchers had no disclosures.
See below for "Views on the News," a pro/con discussion on PPIs.
Available evidence suggests that proton pump inhibitor use is associated with an increased risk of both acute and chronic kidney disease, hypomagnesemia, Clostridium difficile infection, and osteoporotic fractures. Caution in prescribing PPIs should be used in patients at high risk for any of these conditions. Given the association with kidney disease and low magnesium levels, serum creatinine and magnesium levels probably should be monitored in patients using PPIs, especially those using high doses.
Given the evidence that PPI use is linked with a number of adverse outcomes, we recommend that patients and clinicians discuss the potential benefits and risks of PPI treatment, as well as potential alternative regimens such as histamine H2 receptor antagonists or lifestyle changes, before PPIs are prescribed. In patients with symptomatic gastrointestinal reflux, ulcer disease, and severe dyspepsia, the benefits of PPI use likely outweigh its potential harms. For less serious symptoms, however, and for prevention of bleeding in low-risk patients, potential harms may outweigh the benefits. A large number of patients are taking PPIs for no clear reason – often remote symptoms of dyspepsia or heartburn that have since resolved. In these patients, PPIs should be stopped to determine if symptomatic treatment is needed.
Dr. Adam J. Schoenfeld and Dr. Deborah Grady are with the University of California, San Francisco. They had no disclosures. These comments were taken from their editorial (JAMA Intern Med. 2016 Jan 11. doi: 10.1001/jamainternmed.2015.7927).
Pro: When used as indicated, PPIs are good medicine
The bottom line is that PPIs should be used continually for the three specific conditions for which they are known to be beneficial – hypersecretory states, gastroesophageal reflux disease (in all its manifestations), and NSAID/aspirin prophylaxis. As with all drugs, treatment always should be at the lowest effective dose. Although it is quite appropriate to limit chronic PPI use to these groups, given the potential association (no causality identified) with various putative side effects including renal disease, in my opinion, the risks of denying PPIs when indicated are higher than the low risks of renal or other possible side effects.
Dr. David C. Metz is associate chief for clinical affairs, GI division; codirector, esophagology and swallowing program; director, acid-peptic program; codirector, neuroendocrine tumor center; and professor of medicine at the Hospital of the University of Pennsylvania, Philadelphia.
FROM JAMA INTERNAL MEDICINE
Proton pump inhibitors linked to chronic kidney disease
The use of proton pump inhibitors increased the risk of chronic kidney disease by 20%-50%, said the authors of two large population-based cohort analyses published online Jan. 11 in JAMA Internal Medicine.
These are the first such studies to link PPI use to chronic kidney disease (CKD), and the association held up after controlling for multiple potential confounders, said Dr. Benjamin Lazarus of Johns Hopkins University, Baltimore, and his associates. “Further research is required to investigate whether PPI use itself causes kidney damage and, if so, the underlying mechanisms of this association,” they wrote.
Proton pump inhibitors have been linked to other adverse health effects but remain among the most frequently prescribed medications in the United States. To further explore the risk of PPI use, the researchers analyzed data for 10,482 adults from the Atherosclerosis Risk in Communities (ARIC) study who were followed for a median of 13.9 years, and a replication cohort of 248,751 patients from a large rural health care system who were followed for a median of 6.2 years.

Incident CKD was defined based on hospital discharge diagnosis codes, reports of end-stage renal disease from the United States Renal Data System Registry, or a glomerular filtration rate of less than 60 mL/min per 1.73 m2 that persisted at follow-up visits (JAMA Intern Med. 2016 Jan 11. doi: 0.1001/jamainternmed.2015.7193).
In the ARIC study, there were 56 cases of CKD among 322 self-reported baseline PPI users, for an incidence of 14.2 cases per 1,000 person-years – significantly higher than the rate of 10.7 cases per 1,000 person-years among self-reported baseline nonusers. The 10-year estimated absolute risk of CKD among baseline users was 11.8% – 3.3% higher than the expected risk had they not used PPIs. Furthermore, PPI users were at significantly higher risk of CKD after demographic, socioeconomic, and clinical variables were accounted for (hazard ratio, 1.50; 95% confidence interval, 1.1-2.0), after modeling varying use of PPIs over time (adjusted HR, 1.3; 95% CI, 1.2-1.5), after directly comparing PPI users with H2 receptor antagonist users (adjusted HR, 1.4; 95% CI, 1.01-1.9), and after comparing baseline PPI users with propensity score–matched nonusers (HR, 1.8; 95% CI, 1.1-2.7).
In the replication cohort, there were 1,921 new cases of CKD among 16,900 patients with an outpatient PPI prescription (incidence of 20.1 cases per 1,000 person-years). The incidence of CKD among the other patients was lower: 18.3 cases per 1,000 person-years. The use of PPIs was significantly associated with incident CKD in all analyses, and the 10-year absolute risk of CKD among baseline PPI users was 15.6% – 1.7% higher than the expected risk had they not used PPIs.
These observational analyses cannot show causality, but a causal relationship between PPIs and CKD “could have a considerable public health impact, give the widespread extent of use,” the researchers emphasized. “More than 15 million Americans used prescription PPIs in 2013, costing more than $10 billion. Study findings suggest that up to 70% of these prescriptions are without indication and that 25% of long-term PPI users could discontinue therapy without developing symptoms. Indeed, there are already calls for the reduction of unnecessary use of PPIs (BMJ. 2008;336:2-3).”
The study was funded by the National Institute of Diabetes and Digestive and Kidney Diseases and the National Heart, Lung, and Blood Institute, both of which are part of the National Institutes of Health. The researchers had no disclosures.
Available evidence suggests that proton pump inhibitor use is associated with an increased risk of both acute and chronic kidney disease, hypomagnesemia, Clostridium difficile infection, and osteoporotic fractures. Caution in prescribing PPIs should be used in patients at high risk for any of these conditions. Given the association with kidney disease and low magnesium levels, serum creatinine and magnesium levels probably should be monitored in patients using PPIs, especially those using high doses.
Given the evidence that PPI use is linked with a number of adverse outcomes, we recommend that patients and clinicians discuss the potential benefits and risks of PPI treatment, as well as potential alternative regimens such as histamine H2 receptor antagonists or lifestyle changes, before PPIs are prescribed. In patients with symptomatic gastrointestinal reflux, ulcer disease, and severe dyspepsia, the benefits of PPI use likely outweigh its potential harms. For less serious symptoms, however, and for prevention of bleeding in low-risk patients, potential harms may outweigh the benefits. A large number of patients are taking PPIs for no clear reason – often remote symptoms of dyspepsia or heartburn that have since resolved. In these patients, PPIs should be stopped to determine if symptomatic treatment is needed.
Dr. Adam J. Schoenfeld and Dr. Deborah Grady are with the University of California, San Francisco. They had no disclosures. These comments were taken from their editorial (JAMA Intern Med. 2016 Jan 11. doi: 10.1001/jamainternmed.2015.7927).
The bottom line is that PPIs should be used continually for the three specific conditions for which they are known to be beneficial – hypersecretory states, gastroesophageal reflux disease (in all its manifestations), and NSAID/aspirin prophylaxis. As with all drugs, treatment always should be at the lowest effective dose. Although it is quite appropriate to limit chronic PPI use to these groups, given the potential association (no causality identified) with various putative side effects including renal disease, in my opinion, the risks of denying PPIs when indicated are higher than the low risks of renal or other possible side effects.
Dr. David C. Metz is associate chief for clinical affairs, GI division; codirector, esophagology and swallowing program; director, acid-peptic program; codirector, neuroendocrine tumor center; and professor of medicine at the Hospital of the University of Pennsylvania, Philadelphia.
The use of proton pump inhibitors increased the risk of chronic kidney disease by 20%-50%, said the authors of two large population-based cohort analyses published online Jan. 11 in JAMA Internal Medicine.
These are the first such studies to link PPI use to chronic kidney disease (CKD), and the association held up after controlling for multiple potential confounders, said Dr. Benjamin Lazarus of Johns Hopkins University, Baltimore, and his associates. “Further research is required to investigate whether PPI use itself causes kidney damage and, if so, the underlying mechanisms of this association,” they wrote.
Proton pump inhibitors have been linked to other adverse health effects but remain among the most frequently prescribed medications in the United States. To further explore the risk of PPI use, the researchers analyzed data for 10,482 adults from the Atherosclerosis Risk in Communities (ARIC) study who were followed for a median of 13.9 years, and a replication cohort of 248,751 patients from a large rural health care system who were followed for a median of 6.2 years.
Incident CKD was defined based on hospital discharge diagnosis codes, reports of end-stage renal disease from the United States Renal Data System Registry, or a glomerular filtration rate of less than 60 mL/min per 1.73 m2 that persisted at follow-up visits (JAMA Intern Med. 2016 Jan 11. doi: 0.1001/jamainternmed.2015.7193).
In the ARIC study, there were 56 cases of CKD among 322 self-reported baseline PPI users, for an incidence of 14.2 cases per 1,000 person-years – significantly higher than the rate of 10.7 cases per 1,000 person-years among self-reported baseline nonusers. The 10-year estimated absolute risk of CKD among baseline users was 11.8% – 3.3% higher than the expected risk had they not used PPIs. Furthermore, PPI users were at significantly higher risk of CKD after demographic, socioeconomic, and clinical variables were accounted for (hazard ratio, 1.50; 95% confidence interval, 1.1-2.0), after modeling varying use of PPIs over time (adjusted HR, 1.3; 95% CI, 1.2-1.5), after directly comparing PPI users with H2 receptor antagonist users (adjusted HR, 1.4; 95% CI, 1.01-1.9), and after comparing baseline PPI users with propensity score–matched nonusers (HR, 1.8; 95% CI, 1.1-2.7).
In the replication cohort, there were 1,921 new cases of CKD among 16,900 patients with an outpatient PPI prescription (incidence of 20.1 cases per 1,000 person-years). The incidence of CKD among the other patients was lower: 18.3 cases per 1,000 person-years. The use of PPIs was significantly associated with incident CKD in all analyses, and the 10-year absolute risk of CKD among baseline PPI users was 15.6% – 1.7% higher than the expected risk had they not used PPIs.
These observational analyses cannot show causality, but a causal relationship between PPIs and CKD “could have a considerable public health impact, give the widespread extent of use,” the researchers emphasized. “More than 15 million Americans used prescription PPIs in 2013, costing more than $10 billion. Study findings suggest that up to 70% of these prescriptions are without indication and that 25% of long-term PPI users could discontinue therapy without developing symptoms. Indeed, there are already calls for the reduction of unnecessary use of PPIs (BMJ. 2008;336:2-3).”
The study was funded by the National Institute of Diabetes and Digestive and Kidney Diseases and the National Heart, Lung, and Blood Institute, both of which are part of the National Institutes of Health. The researchers had no disclosures.
FROM JAMA INTERNAL MEDICINE
Key clinical point: The use of proton pump inhibitors was significantly associated with incident chronic kidney disease (CKD) in two large population-based studies.
Major finding: Baseline PPI use was associated with a 20%-50% increase in the risk of CKD, and the association held up in all sensitivity analyses.
Data source: A prospective, population-based cohort study of 10,482 adults from the Atherosclerosis Risk in Communities study and a separate replication analysis of 248,751 patients from a large health care system.
Disclosures: The study was funded by the National Institute of Diabetes and Digestive and Kidney Diseases and the National Heart, Lung, and Blood Institute, both of which are part of the National Institutes of Health. The researchers had no disclosures.

How new dietary guidelines affect health care providers
The U.S. Department of Health and Human Services and the U.S. Department of Agriculture have released the eighth iteration of the Dietary Guidelines for Americans, a set of recommendations for healthy eating habits Americans should adopt to prevent development of hypertension, heart disease, and type 2 diabetes, among other conditions.
The new guidelines, effective through 2020, highlight the importance of eating a wide variety of fruits, vegetables, grains, and dairy products, while staying away from processed foods heavy in saturated fats, sugar, and cholesterol as much as possible. The difference between this and earlier editions of the guidelines, the health agencies say, is to promote the importance of a wider variety of foods Americans should be consuming, rather than focusing on just a few isolated foods that should be integrated into an otherwise inadequate diet.

“Protecting the health of the American public includes empowering them with the tools they need to make healthy choices in their daily lives,” Secretary of Health and Human Services Sylvia M. Burwell said in a statement. “By focusing on small shifts in what we eat and drink, eating healthy becomes more manageable. The Dietary Guidelines provide science-based recommendations on food and nutrition so people can make decisions that may help keep their weight under control, and prevent chronic conditions, like Type 2 diabetes, hypertension, and heart disease.”
The American Medical Association voiced their support of the new guidelines, saying that they are “extremely pleased that the new recommendations call for significantly reducing the amount of added sugars and sugar sweetened beverages from the American diet.” Similarly, the American College of Cardiology issued a statement saying that the existence of “a source of clear science-based information about diet” is more important than ever for Americans in the face of increasingly omnipresent and often confusing information available; the college also lauded the recommendations to limit the intake of added sugars, saturated and trans fats, and sodium. The American Heart Association released a new Authoritative Review of data on the topic of nutritional balance as it related to chronic diseases.
While the recommendations may seem common sense and geared more towards patients and laymen, they are of equal importance to health care providers. Dr. Carolyn Lopez – a Chicago-area family physician and adjunct professor of medicine at Northwestern University – called the guidelines an important resource for physicians, with several elements that will be of particular benefit to physicians and clinicians looking to improve the quality of care given to their patients.
“People [should] understand that while individual food choices are important, the pattern of eating is paramount,” Dr. Lopez explained in an interview. “It’s not impossible to bring vegetables into breakfast – veggie omelettes are great – but it’s hard to imagine bringing a vegetable into the whole grain cereals with skim milk breakfast.”
As a family practitioner, however, Dr. Lopez stressed the difficulty of any doctor having a significant enough amount of time with each patient to really go in-depth into what needs to be done to enact meaningful nutritional and lifestyle changes. “These guidelines can only be effective if the whole team is talking to patients,” she explained. “On its own, it would be extraordinarily difficult [or] impossible to accomplish.
Dr. Nazrat Mirza, a pediatrician who is medical director of the IDEAL Pediatric Weight Management Clinic at Children’s National Health System, Washington, said in an interview that the guidelines are “significant in that they are leading us even closer to healthier dietary living – and from my pediatric perspective, healthier children who will grow into healthier adults. We must keep in mind that these guidelines are not prescriptive – but generalized to relatively healthy people. In particular, the recommendation to reduce sugar intake with specification of an upper limit of 10% of calories from added sugar factored into the suggested daily nutritional intake is an excellent update. Added sugar consumption is linked to diabetes, so any reduction in recommended intake will steer people away from potentially developing diabetes.”
She continued, “In my clinic and day-to-day counseling of patients, being able to point to helpful resources such as these guidelines is crucial. These guidelines will continue to serve as yet another way to reach parents and affect the daily dietary habits they practice at home. I was happy to see resources such as MyPlate.gov referenced in the guidelines; that is a tool I use regularly. When educating families on what a healthy plate looks like, I’m able to point directly to the MyPlate.gov posters hanging in the clinic. Comprehensive resources such as these guidelines, [which] give parents actual examples of foods, and deliver the information in a clear, concise, implementable way, are the best methods to reach parents and kids.”
“As a medical provider, such guidelines provide us with tools and reinforcement to say ‘this is policy,’ when approaching schools about the food and drink options they offer children on a daily basis – because the schools are going to have to follow these guidelines. If these guidelines can enforce public policy for the kids to eat healthy, ... and we can implement changes according to the guidelines, that would help greatly in the prevention of chronic disorders such as obesity, hypertension and diabetes – which is a step in the right direction,” said Dr. Mirza, also of George Washington University, Washington.
“Most physicians are so rushed nowadays by the health care system that they typically do not have adequate time to discuss these very important issues,” Dr. Rodbard said in an interview. “It takes time and perseverance to educate the patient and provide individualized care, assessing their current diet, assessing their willingness or potential for changing their diet or increasing their physical activity.”
On that last point. Dr. Rodbard criticized the new guidelines for not emphasizing the importance of exercise enough. “More clarity and emphasis on physical activity should have been provided,” she said, adding that “people need continual, gentle reminders with repetition and long-term follow-up.” Dr. Rodbard summed up the guidelines as “marginally adequate” but “a step in the right direction.”
An endocrinologist who practices in Winter Park, Fla., Dr. Victor L. Roberts – a Fellow of the ACP and ACE – agreed that time with the patients is critical in order for these guidelines to have any effect, calling the guidelines “just the GPS, not the destination.”
Preaching an ABC strategy – accountability, behavior, and calories, the latter of which he stressed is the most important part of any dietary strategy – Dr. Roberts explained that clinicians and physicians should leave the more specific dietary advice to nutritional experts and focus on telling their patients to watch calories, watch the amount of food they’re eating of any given type, and to exercise more.
“These guidelines crystallize and summarize what we’ve already known, and what we should have been practicing and advocating, for decades,” Dr. Roberts said in an interview, adding that “the difficulty is putting these recommendations into practice and having patients and doctors accept responsibility.”
Ultimately, the three doctors who treat adult patients concurred that the new guidelines are imperfect, and likely won’t result in any automatic widespread change. Dr. Rodbard admitted that she does not anticipate the guidelines affecting the way she treats her patients very much, if at all, while Dr. Lopez said that she’s “not sure it’s going to have a major effect.” Furthermore, the sheer volume of data and information available often leads to patients simply not knowing what to believe, which Dr. Roberts described as a “glazed over” effect of being told so many different things from so many different sources, patients just tune everything out.
Ultimately, while it’s important for health care providers to give advice and recommendations as necessary, these should be done on an individual basis. And, if a patient requires extensive dietary and nutritional intervention, that should be left in the hands of specialist who can accurately determine what the patient is capable of, what their goals should be, and how to tailor a plan specifically for them.
“I don’t know many clinicians, even in my own specialty, who know much about what specifically to eat,” said Dr. Roberts. “That should come from nutritional medicine people, not us.”
Dr. Lopez, Dr. Rodbard, and Dr. Roberts did not report any relevant financial disclosures.
*This article was updated 1/12/2016.
The U.S. Department of Health and Human Services and the U.S. Department of Agriculture have released the eighth iteration of the Dietary Guidelines for Americans, a set of recommendations for healthy eating habits Americans should adopt to prevent development of hypertension, heart disease, and type 2 diabetes, among other conditions.
The new guidelines, effective through 2020, highlight the importance of eating a wide variety of fruits, vegetables, grains, and dairy products, while staying away from processed foods heavy in saturated fats, sugar, and cholesterol as much as possible. The difference between this and earlier editions of the guidelines, the health agencies say, is to promote the importance of a wider variety of foods Americans should be consuming, rather than focusing on just a few isolated foods that should be integrated into an otherwise inadequate diet.
“Protecting the health of the American public includes empowering them with the tools they need to make healthy choices in their daily lives,” Secretary of Health and Human Services Sylvia M. Burwell said in a statement. “By focusing on small shifts in what we eat and drink, eating healthy becomes more manageable. The Dietary Guidelines provide science-based recommendations on food and nutrition so people can make decisions that may help keep their weight under control, and prevent chronic conditions, like Type 2 diabetes, hypertension, and heart disease.”
The American Medical Association voiced their support of the new guidelines, saying that they are “extremely pleased that the new recommendations call for significantly reducing the amount of added sugars and sugar sweetened beverages from the American diet.” Similarly, the American College of Cardiology issued a statement saying that the existence of “a source of clear science-based information about diet” is more important than ever for Americans in the face of increasingly omnipresent and often confusing information available; the college also lauded the recommendations to limit the intake of added sugars, saturated and trans fats, and sodium. The American Heart Association released a new Authoritative Review of data on the topic of nutritional balance as it related to chronic diseases.
While the recommendations may seem common sense and geared more towards patients and laymen, they are of equal importance to health care providers. Dr. Carolyn Lopez – a Chicago-area family physician and adjunct professor of medicine at Northwestern University – called the guidelines an important resource for physicians, with several elements that will be of particular benefit to physicians and clinicians looking to improve the quality of care given to their patients.
“People [should] understand that while individual food choices are important, the pattern of eating is paramount,” Dr. Lopez explained in an interview. “It’s not impossible to bring vegetables into breakfast – veggie omelettes are great – but it’s hard to imagine bringing a vegetable into the whole grain cereals with skim milk breakfast.”
As a family practitioner, however, Dr. Lopez stressed the difficulty of any doctor having a significant enough amount of time with each patient to really go in-depth into what needs to be done to enact meaningful nutritional and lifestyle changes. “These guidelines can only be effective if the whole team is talking to patients,” she explained. “On its own, it would be extraordinarily difficult [or] impossible to accomplish.
Dr. Nazrat Mirza, a pediatrician who is medical director of the IDEAL Pediatric Weight Management Clinic at Children’s National Health System, Washington, said in an interview that the guidelines are “significant in that they are leading us even closer to healthier dietary living – and from my pediatric perspective, healthier children who will grow into healthier adults. We must keep in mind that these guidelines are not prescriptive – but generalized to relatively healthy people. In particular, the recommendation to reduce sugar intake with specification of an upper limit of 10% of calories from added sugar factored into the suggested daily nutritional intake is an excellent update. Added sugar consumption is linked to diabetes, so any reduction in recommended intake will steer people away from potentially developing diabetes.”
She continued, “In my clinic and day-to-day counseling of patients, being able to point to helpful resources such as these guidelines is crucial. These guidelines will continue to serve as yet another way to reach parents and affect the daily dietary habits they practice at home. I was happy to see resources such as MyPlate.gov referenced in the guidelines; that is a tool I use regularly. When educating families on what a healthy plate looks like, I’m able to point directly to the MyPlate.gov posters hanging in the clinic. Comprehensive resources such as these guidelines, [which] give parents actual examples of foods, and deliver the information in a clear, concise, implementable way, are the best methods to reach parents and kids.”
“As a medical provider, such guidelines provide us with tools and reinforcement to say ‘this is policy,’ when approaching schools about the food and drink options they offer children on a daily basis – because the schools are going to have to follow these guidelines. If these guidelines can enforce public policy for the kids to eat healthy, ... and we can implement changes according to the guidelines, that would help greatly in the prevention of chronic disorders such as obesity, hypertension and diabetes – which is a step in the right direction,” said Dr. Mirza, also of George Washington University, Washington.
“Most physicians are so rushed nowadays by the health care system that they typically do not have adequate time to discuss these very important issues,” Dr. Rodbard said in an interview. “It takes time and perseverance to educate the patient and provide individualized care, assessing their current diet, assessing their willingness or potential for changing their diet or increasing their physical activity.”
On that last point. Dr. Rodbard criticized the new guidelines for not emphasizing the importance of exercise enough. “More clarity and emphasis on physical activity should have been provided,” she said, adding that “people need continual, gentle reminders with repetition and long-term follow-up.” Dr. Rodbard summed up the guidelines as “marginally adequate” but “a step in the right direction.”
An endocrinologist who practices in Winter Park, Fla., Dr. Victor L. Roberts – a Fellow of the ACP and ACE – agreed that time with the patients is critical in order for these guidelines to have any effect, calling the guidelines “just the GPS, not the destination.”
Preaching an ABC strategy – accountability, behavior, and calories, the latter of which he stressed is the most important part of any dietary strategy – Dr. Roberts explained that clinicians and physicians should leave the more specific dietary advice to nutritional experts and focus on telling their patients to watch calories, watch the amount of food they’re eating of any given type, and to exercise more.
“These guidelines crystallize and summarize what we’ve already known, and what we should have been practicing and advocating, for decades,” Dr. Roberts said in an interview, adding that “the difficulty is putting these recommendations into practice and having patients and doctors accept responsibility.”
Ultimately, the three doctors who treat adult patients concurred that the new guidelines are imperfect, and likely won’t result in any automatic widespread change. Dr. Rodbard admitted that she does not anticipate the guidelines affecting the way she treats her patients very much, if at all, while Dr. Lopez said that she’s “not sure it’s going to have a major effect.” Furthermore, the sheer volume of data and information available often leads to patients simply not knowing what to believe, which Dr. Roberts described as a “glazed over” effect of being told so many different things from so many different sources, patients just tune everything out.
Ultimately, while it’s important for health care providers to give advice and recommendations as necessary, these should be done on an individual basis. And, if a patient requires extensive dietary and nutritional intervention, that should be left in the hands of specialist who can accurately determine what the patient is capable of, what their goals should be, and how to tailor a plan specifically for them.
“I don’t know many clinicians, even in my own specialty, who know much about what specifically to eat,” said Dr. Roberts. “That should come from nutritional medicine people, not us.”
Dr. Lopez, Dr. Rodbard, and Dr. Roberts did not report any relevant financial disclosures.
*This article was updated 1/12/2016.
FROM THE USDA AND HHS
