User login
LISTEN NOW: Course Director Melissa Mattison, MD, SFHM, Chats HM16
Course Director Melissa Mattison, MD, SFHM, assistant professor of medicine at Harvard Medical School, talks about the SHM annual meeting's new emphasis on work-life balance and on how her past experience at the annual meeting influenced how she helped shape this year's meeting.
Course Director Melissa Mattison, MD, SFHM, assistant professor of medicine at Harvard Medical School, talks about the SHM annual meeting's new emphasis on work-life balance and on how her past experience at the annual meeting influenced how she helped shape this year's meeting.
Course Director Melissa Mattison, MD, SFHM, assistant professor of medicine at Harvard Medical School, talks about the SHM annual meeting's new emphasis on work-life balance and on how her past experience at the annual meeting influenced how she helped shape this year's meeting.
Six Strategies to Help Hospitalists Improve Communication
As Karen Smith, MD, SFHM, chief of hospital medicine at Children’s National Health System in Washington, D.C., sees it, communication problems often arise at the first possible opportunity, when she’s trying to find out whom to call when she needs to inform a primary care physician or specialist about a hospitalized patient. Sometimes, that information isn’t readily available.
“Which specialist is on and available to talk?” she says.
Then there’s timing.
“By the time we can set up a time to actually talk to people, it’s after normal business hours,” Dr. Smith says. “People aren’t answering their office phones after five. …Your other choice is going through the answering service, but then you get a variety of people and not the person who knows this patient.”
Dr. Smith spearheaded an effort to reach out in a more reliable fashion to community physicians, with a goal of speaking to—or, more commonly, leaving messages with—at least 90% of hospitalized patients’ physicians. They reached the goal, but it was an eye-opening effort.
“The feedback I got from the hospitalists was it’s ‘just so difficult,’” Dr. Smith says. “I’m sitting on the phone waiting to get ahold of someone. Even trying to use administrative people and have them call and contact us, which is kind of complicated to do.”
Yul Ejnes, MD, MACP, a past chair of the board of regents of the American College of Physicians and an internist at Coastal Medical in R.I., says that if he were grading hospitalist communication with primary care providers on a poor-fair-good-excellent scale, he would give it a “fair.”
“It runs the spectrum from getting nothing—which is rare, I have to say—to getting at least a notification that your patient is in the hospital: ‘Here’s a contact number,’ sometimes with diagnosis,” he says. “And, much less commonly, getting a phone call. That usually occurs when there are questions.”
Dr. Ejnes says consistent communication is not as “robust as I would like it to be.”
“Some institutions do much better than others, in terms of the hospitalist always letting us know patients have come in,” he says. “With others, it doesn’t seem to be part of the institutional culture.”
There has to be a better way.
And, in fact, Dr. Smith and many other hospitalists are developing ways to better use technology to communicate more effectively with primary care, specialists, nurses, and patients. The goal is to make communication more routine, more effective, and more convenient for both parties, all the while—hopefully—improving patient care and strengthening working relationships.
Most of the approaches are not ultra-high tech. Too high tech might, in itself, be a potential barrier to communication for those who might be uncomfortable with new technology. Instead, the initiatives are mostly common sense tweaks to—or new, logical uses of—existing technology.
EHR-Embedded Communication
At Children’s National, Dr. Smith and colleagues use a standardized letter as part of a patient’s electronic health record (EHR). In addition to facts about the patient’s condition, the EHR includes information that makes it easier for physicians to communicate.

“What’s lovely with that is that [the letter] tells the provider the team that they’re on,” she said, adding that teams are divided by letter and color. “It has information on how you can reach the doctor. All of our doctors carry a phone around with them, and so it’s got that number.”
The EHR also includes a note suggesting that physicians avoid calling during rounds and gives them information on how to access the portal, so they can follow along with the patient’s care, should they choose to do so.
The amount of actual contact from primary care physicians? Scarce. Maybe one of 20 pediatricians will actually place a call to the hospitalist, but the response she has received has been positive, Dr. Smith says.
The EHR note also includes a sentence further characterizing the patient’s care, such as: Bobby C. was admitted with bronchiolitis. He’s doing fine; I anticipate he will go home tomorrow.
“Pediatricians have loved that,” she says. “They say, ‘I know exactly what my patient’s there for. I had the ability to call if I want.’”
Smarter Pages
At Vanderbilt University Medical Center in Nashville, Tenn., hospitalists noticed a frequent occurrence with pages: Many times, the hospitalist would only receive a phone number.

“With that, you don’t know which patient it’s about, who called you, how urgent it is, or what they need,” says researcher Sunil Kripalani, MD, MSc, SFHM, associate professor and chief of the section of hospital medicine at Vanderbilt.
It’s a tough spot for a busy hospitalist, who might be on the phone or at a bedside with another patient when three, four, or even five pages come through. The page might just be an FYI requiring no callback. It might be urgent. It might be the same page sent multiple times from different numbers (e.g. nursing moving to various phones). Many times, Dr. Kripalani and his hospitalists have had no way to know.
Now, Vanderbilt has established an online template for text pages, with the following basic information:
- Patient;
- Room number;
- Urgency level;
- Name of the sender;
- Callback number;
- Message; and
- Whether or not a callback is needed.
“That structure is very helpful for allowing physicians to triage which pages to call back and how quickly,” Dr. Kripalani says.
He acknowledges it isn’t “fancy bells and whistles.”
“Sometimes it’s doing the basic things well that makes the difference,” he adds.
The “structured pages” have allowed the nature of pages to be analyzed. Dr. Kripalani and colleagues have found that approximately 5% of pages were about a patient’s dietary status. If the patient was ordered not to receive anything by mouth, pages asked, when did that order expire and what diet should the patient resume?
Now, a prompt for that information is included in the hospital’s order entry system, which has cut the number of pages sent.
Vanderbilt is now looking at other, similar ways to streamline communication.
Patients and iPads
At the University of Colorado Hospital in Denver, researchers had an idea to facilitate communication and patient education: Patients are always inquiring about their discharge status and other facets of their hospitalization; what if they got their own tablet to follow along with everything in real time?1

The only real requirements for the study were that patients had to have Internet access at home and an understanding of how to work a web browser, says Jonathan Pell, MD, SFHM, assistant professor of internal medicine at the University of Colorado in Aurora and a hospitalist at University of Colorado Hospital. Patients were shown how to access their schedule for the day, their medication list and dosing schedule, and test results. Much of the information was delivered in real time, so patients who were told that if a lab result came back at a certain level they could be discharged could perhaps start preparing for that possibility earlier than they might have otherwise.
Researchers found that their patients worried less and reported less confusion. They also found that providing the tablets didn’t cause any increase in workload for doctors or nurses.
Providers and nurses expected that patients would notice medication errors, but that endpoint was not significant. Surprisingly, patients’ understanding of discharge times did not live up to expectations. But the results overall were encouraging enough that the effort will continue.
“We have these mixed results,” Dr. Pell says. “I think it’s good to get something out there in the literature and see what else people may be interested in doing. Our next step is to potentially open up notes to patients and let them see their doctor’s and nurse’s notes during their hospitalization.”
He says that, in some cases, communication with patients is the most crucial channel for hospitalists.
“For the very engaged patient [who has] a busy primary care doctor who’s hard to get in touch with,” he explains, “using the patient, informing them well, and getting them all the information they need is actually the best way to make sure that transition of care is smooth.”
Discharge, Facebook-Style
New England Inpatient Specialists (NEIS), a hospitalist group in North Andover, Mass., has an interesting approach to discharge. Instead of a nurse picking up the phone to make a follow-up appointment for a patient leaving the hospital, a secretary posts a message on “Chatter,” a secure tool similar to Facebook. The technology was developed by Salesforce.com, which offers platforms mainly designed to assist businesses with communication.

The idea behind Chatter is that the primary care office personnel can respond to a post at a time that’s convenient to them.
“All of this is so time-consuming. Why would you want somebody like an RN spending 15 to 20 minutes on the phone setting up an appointment when she could be on the floor?” says Sawad Thotathil, MD, vice president of performance and physician recruitment at NEIS. “Our program secretary will just post a discharge, and then somebody at the practice will look at it when they can and find out what associated information is needed and answer at their own convenience.”
Dr. Thotathil’s group also has been using the Imprivata Cortext secure text messaging system for more than a year, with what he deems “overall positive” results. About 60% of the practices with which NEIS staff need to communicate have signed on to the system.
“That kind of helps in management,” he says. “Sometimes, a patient is in the hospital and you can text the cardiologist, asking if the patient can be taken on for a procedure. That kind of communication, which would have taken longer or would not have happened, is happening now.
“Have we been able to directly link it to better outcomes?” he adds. “No, we haven’t looked at it that way. But what we have seen is that there’s always going to be a variation in how many people in a network actually will use it. ... There are going to be those high users, and there are going to be those providers who are going to be minimally using it.”
Videoconferencing
Pediatric hospitalists at the main hospital at Children’s National have been helping to provide care to children who are seen at five community sites. Dr. Smith says the communication at these sites, mostly from the ED, in which the pediatric hospitalists are helping make medical decisions, has been dramatically enhanced.

“The visual aspect of it changes the whole conversation,” she says. “You could tell them the exact same thing verbally and they are like, ‘OK, that’s fine,’ and there doesn’t seem to be a true understanding of what I’m trying to impart to you. Once people look at the child, all of a sudden there is a true shared mental model of, ‘OK, I understand what you’re doing. What’s going on?’”
Hospitalists also have been spearheading videoconferencing at diabetes clinics, to provide better care at community sites.
“We know what the need is. We know the gap in care,” Dr. Smith says. “We’ve been able to advocate and get those specialists brought out to the community via telemedicine, if it’s too difficult to get out on a regular basis.”
There are no hard data on the effects of the programs, but Dr. Smith says the improvement is noticeable.
“Anecdotally, we’ve seen a decrease in kids coming in with DKA (diabetic ketoacidosis) to the emergency room, so we’ve been able to change some of the trajectory. Many of those kids just didn’t have access to care. [For some], it would be a day’s trip for them to get to one of the academic centers to get follow up. They just wouldn’t go.”
EHR-Facilitated Calls
At Cincinnati Children’s, phone contact with community pediatricians at discharge is established with remarkable consistency: 98% to 99% of the time. The reason? A communication system, “Priority Link,” is connected to the EHR.

When the hospitalist signs a discharge order, the patient’s name is put in a queue. An operator sends out a page to inform the resident that the call is about to be made to the outpatient physician, making sure they’re ready for the call to be made.
“The key innovation was that we were trying to make sure that the inpatient side of it was really ready for the call, so we weren’t placing calls out to doctors and then we weren’t ready,” says Jeffrey Simmons, MD, MSc, associate director of clinical operations and quality in Cincinnati Children’s hospital medicine division.
He says there has been some pushback from pediatricians who feel the calls don’t provide any more value than the discharge summary itself. But the opportunity for questions and for a dialogue makes the calls worthwhile, Dr. Simmons notes. The system could be improved by tailoring communications to the community physicians’ preference—via fax or email, perhaps—and by having the call placed by physicians who are more knowledgeable about the details of the case.
Priority Link also is used to help community physicians with direct admissions for patients who don’t need to go to the ED. The operator coordinates a three-way call among the community physician, the hospitalist, and a nurse familiar with the bed situation.
“That three-way call is really great because we’re big and busy enough that sometimes we need that nurse manager on the phone, too, to No. 1, let us know if there really is a bed and, No. 2, coordinate with the nursing unit,” he says. TH
Tom Collins is a freelance writer in South Florida.
Reference
Pell JM, Mancuso M, Limon S, Oman K, Lin CT. Patient access to electronic health records during hospitalization. JAMA Intern Med. 2015;175(5):856-858. doi: 10.1001/jamainternmed.2015.121.
Sometimes, Communication Outside the Hospital Is the Problem
Yul Ejnes, MD, MACP, an internist at Coastal Medicine in R.I., and a past chair of the American College of Physician’s Board of Regents, points to the ACP’s “High Value Care” toolkit as a model for how primary care-hospitalist communication should take place.

The toolkit includes a suggested “agreement” between PCPs and the hospital care team, which calls for PCPs to provide pertinent information (i.e., reconciled medications lists, medical history, and advanced directives) to hospital teams upon notification of an admission. It also calls for establishing standard communication methods and discharge notifications and encourages hospitalists to keep PCPs updated on new developments, provide appropriate information to patients at discharge, and send a “concise discharge summary” to the PCP within 48 to 72 hours of discharge.
It’s a two-way street, Dr. Ejnes says. He also acknowledges that sometimes the problems are on the community physicians’ side. Phone calls can be highly valuable in this dynamic, but it is often difficult for internists to make or take those calls.
“Sitting where I am, in my office, I am certainly interested in what’s going on with my patients,” he says. “On the other hand, the inertia I have to overcome in order to get that information, when I’m in the middle of seeing a whole bunch of patients during my day, involves getting on the phone, punching some numbers, waiting for a call back, as opposed to having the information available on my screen automatically through some information technology solution.”
He has provided his staff with a list of contacts, including hospitalists, for whom he is to be interrupted in order to take calls.
Jeffrey Simmons, MD, MSc, of Cincinnati Children’s, says that in their effort to boost the reliability of placing calls to PCPs, his hospitalists found that confusion within primary care offices is a stumbling block.
“About half the time when we get complaints about this process, when we investigate, we learn that the major problem has been within the practice,” he says. “We may have made a call to Partner X and had a good conversation … [but] between then and when the patient sees Dr. Y, there’s been very little communication between Partner X and Partner Y.”
Setting up the right system is the key—on both ends, Dr. Ejnes says.
“It’s all about workflow,” he says. “If you can integrate these communications into the regular workflow of the physician, either community-based or hospitalist, it’s more likely to happen. Having the will to do it is the first step. But I think it’s got to be facilitated as much as possible.”
— Thomas R. Collins
As Karen Smith, MD, SFHM, chief of hospital medicine at Children’s National Health System in Washington, D.C., sees it, communication problems often arise at the first possible opportunity, when she’s trying to find out whom to call when she needs to inform a primary care physician or specialist about a hospitalized patient. Sometimes, that information isn’t readily available.
“Which specialist is on and available to talk?” she says.
Then there’s timing.
“By the time we can set up a time to actually talk to people, it’s after normal business hours,” Dr. Smith says. “People aren’t answering their office phones after five. …Your other choice is going through the answering service, but then you get a variety of people and not the person who knows this patient.”
Dr. Smith spearheaded an effort to reach out in a more reliable fashion to community physicians, with a goal of speaking to—or, more commonly, leaving messages with—at least 90% of hospitalized patients’ physicians. They reached the goal, but it was an eye-opening effort.
“The feedback I got from the hospitalists was it’s ‘just so difficult,’” Dr. Smith says. “I’m sitting on the phone waiting to get ahold of someone. Even trying to use administrative people and have them call and contact us, which is kind of complicated to do.”
Yul Ejnes, MD, MACP, a past chair of the board of regents of the American College of Physicians and an internist at Coastal Medical in R.I., says that if he were grading hospitalist communication with primary care providers on a poor-fair-good-excellent scale, he would give it a “fair.”
“It runs the spectrum from getting nothing—which is rare, I have to say—to getting at least a notification that your patient is in the hospital: ‘Here’s a contact number,’ sometimes with diagnosis,” he says. “And, much less commonly, getting a phone call. That usually occurs when there are questions.”
Dr. Ejnes says consistent communication is not as “robust as I would like it to be.”
“Some institutions do much better than others, in terms of the hospitalist always letting us know patients have come in,” he says. “With others, it doesn’t seem to be part of the institutional culture.”
There has to be a better way.
And, in fact, Dr. Smith and many other hospitalists are developing ways to better use technology to communicate more effectively with primary care, specialists, nurses, and patients. The goal is to make communication more routine, more effective, and more convenient for both parties, all the while—hopefully—improving patient care and strengthening working relationships.
Most of the approaches are not ultra-high tech. Too high tech might, in itself, be a potential barrier to communication for those who might be uncomfortable with new technology. Instead, the initiatives are mostly common sense tweaks to—or new, logical uses of—existing technology.
EHR-Embedded Communication
At Children’s National, Dr. Smith and colleagues use a standardized letter as part of a patient’s electronic health record (EHR). In addition to facts about the patient’s condition, the EHR includes information that makes it easier for physicians to communicate.
“What’s lovely with that is that [the letter] tells the provider the team that they’re on,” she said, adding that teams are divided by letter and color. “It has information on how you can reach the doctor. All of our doctors carry a phone around with them, and so it’s got that number.”
The EHR also includes a note suggesting that physicians avoid calling during rounds and gives them information on how to access the portal, so they can follow along with the patient’s care, should they choose to do so.
The amount of actual contact from primary care physicians? Scarce. Maybe one of 20 pediatricians will actually place a call to the hospitalist, but the response she has received has been positive, Dr. Smith says.
The EHR note also includes a sentence further characterizing the patient’s care, such as: Bobby C. was admitted with bronchiolitis. He’s doing fine; I anticipate he will go home tomorrow.
“Pediatricians have loved that,” she says. “They say, ‘I know exactly what my patient’s there for. I had the ability to call if I want.’”
Smarter Pages
At Vanderbilt University Medical Center in Nashville, Tenn., hospitalists noticed a frequent occurrence with pages: Many times, the hospitalist would only receive a phone number.
“With that, you don’t know which patient it’s about, who called you, how urgent it is, or what they need,” says researcher Sunil Kripalani, MD, MSc, SFHM, associate professor and chief of the section of hospital medicine at Vanderbilt.
It’s a tough spot for a busy hospitalist, who might be on the phone or at a bedside with another patient when three, four, or even five pages come through. The page might just be an FYI requiring no callback. It might be urgent. It might be the same page sent multiple times from different numbers (e.g. nursing moving to various phones). Many times, Dr. Kripalani and his hospitalists have had no way to know.
Now, Vanderbilt has established an online template for text pages, with the following basic information:
- Patient;
- Room number;
- Urgency level;
- Name of the sender;
- Callback number;
- Message; and
- Whether or not a callback is needed.
“That structure is very helpful for allowing physicians to triage which pages to call back and how quickly,” Dr. Kripalani says.
He acknowledges it isn’t “fancy bells and whistles.”
“Sometimes it’s doing the basic things well that makes the difference,” he adds.
The “structured pages” have allowed the nature of pages to be analyzed. Dr. Kripalani and colleagues have found that approximately 5% of pages were about a patient’s dietary status. If the patient was ordered not to receive anything by mouth, pages asked, when did that order expire and what diet should the patient resume?
Now, a prompt for that information is included in the hospital’s order entry system, which has cut the number of pages sent.
Vanderbilt is now looking at other, similar ways to streamline communication.
Patients and iPads
At the University of Colorado Hospital in Denver, researchers had an idea to facilitate communication and patient education: Patients are always inquiring about their discharge status and other facets of their hospitalization; what if they got their own tablet to follow along with everything in real time?1
The only real requirements for the study were that patients had to have Internet access at home and an understanding of how to work a web browser, says Jonathan Pell, MD, SFHM, assistant professor of internal medicine at the University of Colorado in Aurora and a hospitalist at University of Colorado Hospital. Patients were shown how to access their schedule for the day, their medication list and dosing schedule, and test results. Much of the information was delivered in real time, so patients who were told that if a lab result came back at a certain level they could be discharged could perhaps start preparing for that possibility earlier than they might have otherwise.
Researchers found that their patients worried less and reported less confusion. They also found that providing the tablets didn’t cause any increase in workload for doctors or nurses.
Providers and nurses expected that patients would notice medication errors, but that endpoint was not significant. Surprisingly, patients’ understanding of discharge times did not live up to expectations. But the results overall were encouraging enough that the effort will continue.
“We have these mixed results,” Dr. Pell says. “I think it’s good to get something out there in the literature and see what else people may be interested in doing. Our next step is to potentially open up notes to patients and let them see their doctor’s and nurse’s notes during their hospitalization.”
He says that, in some cases, communication with patients is the most crucial channel for hospitalists.
“For the very engaged patient [who has] a busy primary care doctor who’s hard to get in touch with,” he explains, “using the patient, informing them well, and getting them all the information they need is actually the best way to make sure that transition of care is smooth.”
Discharge, Facebook-Style
New England Inpatient Specialists (NEIS), a hospitalist group in North Andover, Mass., has an interesting approach to discharge. Instead of a nurse picking up the phone to make a follow-up appointment for a patient leaving the hospital, a secretary posts a message on “Chatter,” a secure tool similar to Facebook. The technology was developed by Salesforce.com, which offers platforms mainly designed to assist businesses with communication.
The idea behind Chatter is that the primary care office personnel can respond to a post at a time that’s convenient to them.
“All of this is so time-consuming. Why would you want somebody like an RN spending 15 to 20 minutes on the phone setting up an appointment when she could be on the floor?” says Sawad Thotathil, MD, vice president of performance and physician recruitment at NEIS. “Our program secretary will just post a discharge, and then somebody at the practice will look at it when they can and find out what associated information is needed and answer at their own convenience.”
Dr. Thotathil’s group also has been using the Imprivata Cortext secure text messaging system for more than a year, with what he deems “overall positive” results. About 60% of the practices with which NEIS staff need to communicate have signed on to the system.
“That kind of helps in management,” he says. “Sometimes, a patient is in the hospital and you can text the cardiologist, asking if the patient can be taken on for a procedure. That kind of communication, which would have taken longer or would not have happened, is happening now.
“Have we been able to directly link it to better outcomes?” he adds. “No, we haven’t looked at it that way. But what we have seen is that there’s always going to be a variation in how many people in a network actually will use it. ... There are going to be those high users, and there are going to be those providers who are going to be minimally using it.”
Videoconferencing
Pediatric hospitalists at the main hospital at Children’s National have been helping to provide care to children who are seen at five community sites. Dr. Smith says the communication at these sites, mostly from the ED, in which the pediatric hospitalists are helping make medical decisions, has been dramatically enhanced.
“The visual aspect of it changes the whole conversation,” she says. “You could tell them the exact same thing verbally and they are like, ‘OK, that’s fine,’ and there doesn’t seem to be a true understanding of what I’m trying to impart to you. Once people look at the child, all of a sudden there is a true shared mental model of, ‘OK, I understand what you’re doing. What’s going on?’”
Hospitalists also have been spearheading videoconferencing at diabetes clinics, to provide better care at community sites.
“We know what the need is. We know the gap in care,” Dr. Smith says. “We’ve been able to advocate and get those specialists brought out to the community via telemedicine, if it’s too difficult to get out on a regular basis.”
There are no hard data on the effects of the programs, but Dr. Smith says the improvement is noticeable.
“Anecdotally, we’ve seen a decrease in kids coming in with DKA (diabetic ketoacidosis) to the emergency room, so we’ve been able to change some of the trajectory. Many of those kids just didn’t have access to care. [For some], it would be a day’s trip for them to get to one of the academic centers to get follow up. They just wouldn’t go.”
EHR-Facilitated Calls
At Cincinnati Children’s, phone contact with community pediatricians at discharge is established with remarkable consistency: 98% to 99% of the time. The reason? A communication system, “Priority Link,” is connected to the EHR.
When the hospitalist signs a discharge order, the patient’s name is put in a queue. An operator sends out a page to inform the resident that the call is about to be made to the outpatient physician, making sure they’re ready for the call to be made.
“The key innovation was that we were trying to make sure that the inpatient side of it was really ready for the call, so we weren’t placing calls out to doctors and then we weren’t ready,” says Jeffrey Simmons, MD, MSc, associate director of clinical operations and quality in Cincinnati Children’s hospital medicine division.
He says there has been some pushback from pediatricians who feel the calls don’t provide any more value than the discharge summary itself. But the opportunity for questions and for a dialogue makes the calls worthwhile, Dr. Simmons notes. The system could be improved by tailoring communications to the community physicians’ preference—via fax or email, perhaps—and by having the call placed by physicians who are more knowledgeable about the details of the case.
Priority Link also is used to help community physicians with direct admissions for patients who don’t need to go to the ED. The operator coordinates a three-way call among the community physician, the hospitalist, and a nurse familiar with the bed situation.
“That three-way call is really great because we’re big and busy enough that sometimes we need that nurse manager on the phone, too, to No. 1, let us know if there really is a bed and, No. 2, coordinate with the nursing unit,” he says. TH
Tom Collins is a freelance writer in South Florida.
Reference
Pell JM, Mancuso M, Limon S, Oman K, Lin CT. Patient access to electronic health records during hospitalization. JAMA Intern Med. 2015;175(5):856-858. doi: 10.1001/jamainternmed.2015.121.
Sometimes, Communication Outside the Hospital Is the Problem
Yul Ejnes, MD, MACP, an internist at Coastal Medicine in R.I., and a past chair of the American College of Physician’s Board of Regents, points to the ACP’s “High Value Care” toolkit as a model for how primary care-hospitalist communication should take place.
The toolkit includes a suggested “agreement” between PCPs and the hospital care team, which calls for PCPs to provide pertinent information (i.e., reconciled medications lists, medical history, and advanced directives) to hospital teams upon notification of an admission. It also calls for establishing standard communication methods and discharge notifications and encourages hospitalists to keep PCPs updated on new developments, provide appropriate information to patients at discharge, and send a “concise discharge summary” to the PCP within 48 to 72 hours of discharge.
It’s a two-way street, Dr. Ejnes says. He also acknowledges that sometimes the problems are on the community physicians’ side. Phone calls can be highly valuable in this dynamic, but it is often difficult for internists to make or take those calls.
“Sitting where I am, in my office, I am certainly interested in what’s going on with my patients,” he says. “On the other hand, the inertia I have to overcome in order to get that information, when I’m in the middle of seeing a whole bunch of patients during my day, involves getting on the phone, punching some numbers, waiting for a call back, as opposed to having the information available on my screen automatically through some information technology solution.”
He has provided his staff with a list of contacts, including hospitalists, for whom he is to be interrupted in order to take calls.
Jeffrey Simmons, MD, MSc, of Cincinnati Children’s, says that in their effort to boost the reliability of placing calls to PCPs, his hospitalists found that confusion within primary care offices is a stumbling block.
“About half the time when we get complaints about this process, when we investigate, we learn that the major problem has been within the practice,” he says. “We may have made a call to Partner X and had a good conversation … [but] between then and when the patient sees Dr. Y, there’s been very little communication between Partner X and Partner Y.”
Setting up the right system is the key—on both ends, Dr. Ejnes says.
“It’s all about workflow,” he says. “If you can integrate these communications into the regular workflow of the physician, either community-based or hospitalist, it’s more likely to happen. Having the will to do it is the first step. But I think it’s got to be facilitated as much as possible.”
— Thomas R. Collins

QUIZ: When Should You Suspect Kawasaki Disease as the Cause of Fever in an Infant?
Kawasaki disease (KD) is an acute systemic vasculitis of unknown etiology that occurs in children. Because there is no specific diagnostic test or pathognomonic clinical feature, clinical diagnostic criteria have been established to guide physicians. When a patient presents with a history, examination, and laboratory findings consistent with KD without meeting the typical diagnostic standard, incomplete KD should be considered.
[WpProQuiz 4]
[WpProQuiz_toplist 4]
An Early Invasive Strategy for Elderly with Myocardial Infraction is Promising
NEW YORK (Reuters Health) - An early invasive strategy provides better outcomes than a conservative strategy in octogenarians with non-ST-elevation myocardial infarction
(NSTEMI) or unstable angina, according to the After Eighty clinical trial.
"Management of the very elderly with myocardial infarction (NSTE-ACS) is challenging, because they often present later, have atypical symptoms, and are a more heterogeneous group dueto comorbidities," Dr. Bjorn Bendz and Dr. Nicolai Tegn from Oslo University Hospital in Norway told Reuters Health in a joint email. "These factors may reduce the benefits and increase the risk of complications from invasive treatment."
Large randomized trials have demonstrated the superiority of an invasive strategy in this setting, but patients aged 80 years and over are underrepresented in these studies.
Dr. Bendz and Dr. Tegn and colleagues from 16 hospitals in Norway investigated whether patients aged 80 years or older would benefit from an early invasive strategy versus a
conservative strategy in terms of a composite primary endpoint of MI, need for urgent revascularization, and death.
The invasive strategy (n=229) included early coronary angiography with immediate assessment for ad hoc percutaneous coronary intervention (PCI), coronary artery bypass graft (CABG), or optimal medical treatment, whereas the conservative strategy (n=228) included optimal medical treatment alone.
In the invasive group, 107 underwent PCI and six had CABG, the researchers report in The Lancet, online January 12.
During follow-up, patients in the invasive group were significantly less likely to experience the primary endpoint (41% vs. 61%, p=0.0001).
Compared with patients in the conservative-strategy group, those in the invasive-strategy group were 48% less likely to experience MI and 81% less likely to require urgent revascularization. They were also 40% less likely to have a stroke and 11% less likely to die, but these latter differences were not significant.
Minor bleeding complications (but not major bleeding complications) were somewhat more common in the invasive strategy group (10%) than in the conservative strategy group (7%).
"The present results support an invasive strategy in patients over 80 years with NSTEMI and unstable angina," Dr.Bendz and Dr. Tegn said. "However, the efficacy was less with increasing age, and for patients older than 90 years we cannot conclude if an invasive strategy is beneficial. Thus, management of acute coronary syndrome (ACS) patients over 90 must be individually tailored, considering life expectancy, comorbid illnesses, bleeding risk, cognitive and functional status, and patient preference."
Dr. Peter Psaltis from the University of Adelaide in South Australia, who co-wrote an accompanying editorial, told Reuters Health by email, "The After-80 study now provides the direct
evidence we needed to support this 'early invasive' approach. Given how difficult it is to recruit very elderly patients to clinical studies - and this was reflected by the fact that almost 80% of screened patients were not actually enrolled into After-80 - the investigators deserve credit for taking this study on. Their study is especially important because in developed countries, we see so many 'very old' patients admitted to our cardiology and general medicine wards with ACS."
"In extrapolating the results of After-80 to real-world clinical practice, we firstly have to remember that 70-80% of patients who were screened for this study were ultimately not
enrolled," he reiterated. "There would have been many reasons why so many patients were excluded, but it does emphasize that the study's findings won't apply to everyone over the age of 80 who presents with ACS."
"As always, the decision making process needs to be individually tailored," Dr. Psaltis said. "The patient's pre-existing comorbid status, quality of life, cognitive function and personal wishes are all important factors that need to be taken into account."
"Moreover, we should not just consider its potential benefits in terms of whether it will reduce mortality or risk of recurrent infarcts," Dr. Psaltis added. "In certain individuals >90, an invasive approach may be taken to improve quality of life and symptom burden, help to keep patients in independent living at home, or reduce readmission rates to hospital or even
the use of anti-anginal medications that can be associated with debilitating side-effects."
Dr. Paul Erne from the University of Zurich in Switzerland, who heads the steering committee of the Acute Myocardial Infarction in Sweden (AMIS), stressed, "Conservative treatment
does not result in a poor outcome in every patient and we need to know much more about differential approach."
"However, active treatment remains a great option for part of the elderly patients," regardless of age, he told Reuters Health by email. "Please note the increasing number of patients
treated at age above 100 years which proves to be a good option if the patients want to live actively."
Dr. Rahul Potluri, founder of the ACALM (Algorithm for Comorbidities, Associations, Length of Stay and Mortality) Study Unit, Birmingham, U.K., recently reviewed the role of
angioplasty in octogenarian ACS patients.
He told Reuters Health by email, "This study is the most conclusive evidence to date, showing the benefits of an invasive approach in patients above the age of 80 with the most common types of ACS (namely NSTEMI and unstable angina). The findings are most surprising given that both the groups were very similar in terms of patient characteristics and medications taken, thus delineating the true benefit of the invasive strategy in the most controlled fashion and in a short follow-up period."
The study did not have commercial funding and the researchers declared no competing interests.
Tandem HSCT regimen may cure MM
![]()
Photo by Chad McNeeley
Tandem autologous/allogeneic hematopoietic stem cell transplant (HSCT) may cure multiple myeloma (MM), according to a phase 2 study.
The study included newly diagnosed patients who received induction therapy followed by an autograft and a non-myeloablative allograft from a matched sibling donor.
The patients have been followed for a median of 8.8 years.
The probability of progression-free survival at 10 years is 41%, and the overall survival is 62%.
The rate of chronic graft-vs-host disease (GVHD) is high, but the rate of non-relapse mortality is low.
“In many hospitals, doctors have abandoned the use of allografts for multiple myeloma due to the risk of toxicity and relapse,” said study author Jean Roy, MD, of the Maisonneuve-Rosemont Hospital and University of Montreal in Quebec, Canada.
“Our results, on the other hand, have led us to offer the treatment to more patients, especially younger patients and those with poorer prognoses.”
Dr Roy and his colleagues reported these results in Bone Marrow Transplantation.
The researchers assessed 92 patients newly diagnosed with MM between 2001 and 2010. Their median age was 52 (range, 39-64), and 97% had Durie–Salmon stage II or III disease.
Patients received an induction regimen consisting of vincristine, doxorubicin, and dexamethasone (2001–2007, n=75) or a bortezomib-based regimen (2008–2010, n=17).
After induction, patients underwent autologous HSCT using melphalan 200 mg/m2.
A median of 4 months later (range, 2-13), after complete clinical recovery, the patients received an allogeneic transplant from a 6/6 HLA-matched sibling donor. Fifty-seven percent of patients had achieved at least a very good partial response before the second transplant.
The allogeneic transplant was performed on an outpatient basis. The graft consisted of G-CSF-mobilized peripheral blood stem cells (target dose ≥ 4×10⁶ CD34+cells/kg).
The conditioning regimen consisted of fludarabine at 30 mg/m2 and cyclophosphamide at 300 mg/m2 for 5 days. GVHD prophylaxis was oral tacrolimus and mycophenolate mofetil.
Results
At a median follow-up of 8.8 years, 56 patients were still alive (and 36 had died).
Forty patients had no evidence of progression, including 11 patients who were still taking systemic immunosuppressive drugs for GVHD. The remaining 16 patients who were still alive had relapsed after allogeneic HSCT.
A total of 45 patients relapsed. Thirty-nine went on to receive treatment with at least 1 new drug (thalidomide, lenalidomide, bortezomib, or pomalidomide).
They received a median of 2 lines of therapy (range, 1–6), and their 5-year overall survival from first relapse was 49%. Ten of these patients were in very good partial response or greater at last follow-up.
Ten patients died from causes other than refractory MM—6 from refractory GVHD, 3 from lung adenocarcinoma (1 smoker), and 1 from invasive aspergillosis.
The cumulative incidence of extensive chronic GVHD was 79%. The cumulative incidence of grade 2-4 acute GVHD at 6 months was 9%. And 3 patients developed grade 3-4 acute GVHD.
Among the 56 patients who were still alive at last follow-up, the probability of being on any systemic immunosuppressive treatment for GVHD is 38% at 5 years and 22% at 10 years.
The probability of overall survival at 10 years is 62%, the probability of progression-free survival is 41%, and the cumulative incidence of non-relapse mortality is 10%. ![]()
EMA recommends therapy for bleeding disorder

The European Medicines Agency (EMA) has recommended marketing authorization for Coagadex to treat hereditary factor X deficiency, a rare bleeding disorder.
The active substance in Coagadex is coagulation factor X, a protein derived from human plasma.
Coagadex is intended to treat and prevent bleeding episodes and control bleeding during surgical procedures in patients with hereditary factor X deficiency.
If the European Commission follows the EMA’s recommendation, Coagadex will be the first specific replacement therapy approved in the European Union (EU) to treat patients with this disorder.
Current treatment for factor X deficiency in the EU includes replacement therapies that contain a mix of coagulation factors. These are associated with dosing problems and the risk of elevating other clotting factors, which may result in complications.
Due to the lack of specific treatment options for factor X deficiency, the EMA’s Committee for Medicinal Products for Human Use (CHMP) decided to speed up the evaluation of Coagadex and recommended marketing authorization following an accelerated assessment. This is one of the agency’s tools to speed up patient access to new medicines if they address an unmet medical need.
The CHMP based its recommendation for authorization of Coagadex on the results of 2 non-randomized studies.
The first trial included 16 patients who received Coagadex for pharmacokinetic evaluation, on-demand treatment and control of bleeding episodes, and/or perioperative management of minor surgical or dental procedures.
Coagadex was used to treat 208 bleeding episodes, and 187 of these episodes (in 15 patients) were evaluated for efficacy. Ninety-eight episodes were major bleeds, 88 were minor bleeds, and 1 was not assessed.
One hundred and fifty-five bleeds (83%) were treated with a single infusion of Coagadex, 28 (15%) were treated with 2 infusions, 3 bleeds (2%) required 3 infusions, and 1 bleed (0.5%) required 4 infusions. Four bleeding episodes in 2 patients were considered treatment failures.
The mean dose of Coagadex per infusion was 25.4 IU/kg, and the mean total dose was 30.4 IU/kg. The recommended dose of 25 IU/kg to treat a bleed was maintained for 14 of the 16 patients. The other 2 patients used doses of up to 30 IU/kg and 33 IU/kg.
There were 176 adverse events in this trial, but only 6 events in 2 patients were considered possibly related to Coagadex. This included 2 reports of infusion site erythema in 1 patient, 2 reports of fatigue in 1 patient, 1 report of back pain, and 1 report of infusion site pain.
The second trial included patients who received Coagadex for perioperative management. Five patients received Coagadex for 7 surgical procedures.
For major surgeries, a median of 13 infusions (range, 2-15) and a median cumulative dose of 181 IU/kg (range, 45-210 IU/kg) were required to maintain hemostasis.
For minor surgeries, a median of 2.5 infusions (range, 1-4) and a median cumulative dose of 89 IU/kg (range, 51-127 IU/kg) were required to maintain hemostasis.
There were no adverse events related to Coagadex in this trial.
The company developing Coagadex, Bio Products Laboratory, received scientific advice on the design of the trials from the CHMP. Scientific advice is one of the agency’s main tools to facilitate and stimulate research and development within the EU.
Because factor X deficiency is rare, Coagadex was designated as an orphan medicine by the EMA’s Committee for Orphan Medicinal Products. Orphan designation gives pharmaceutical companies access to incentives that encourage the development of medicines for patients with rare diseases.
The CHMP’s recommendation to approve Coagadex for use in the EU is an intermediary step on Coagadex’s path to patient access. The CHMP’s opinion will now be sent to the European Commission for the adoption of a decision on an EU-wide marketing authorization.
Once a marketing authorization has been granted, decisions about price and reimbursement will take place at the level of each member state, taking into account the potential role/use of this medicine in the context of the national health system of that country. ![]()
Who among us has not asked a patient to keep track of a mole?
“Keep an eye on that one, and call me if it changes,” is as much a stock phrase for dermatologists as “Wear your sunscreen.” Yet, how do patients know if a mole changes? I’m quite sure many of my patients wouldn’t notice if I shaved my head and grew a beard, let alone notice if 1 of 30 moles on their back changed color.
Mole Mapper is an iPhone app developed by the department of dermatology at Oregon Health and Science University (OHSU) to solve this problem. The app provides a framework for patients to photo, measure, and track their moles. With clear instructions, an anatomical map, and sophisticated markers, it is a significant aid for motivated patients who want medical-grade photos suitable for tracking.

To standardize the photos, the app prompts you to include a nickel, dime, or quarter in photos with nevi of interest. The user then calibrates the app by pinching onscreen circles overlying the photo such that they correspond exactly to the circumference of the coin and to the mole. Using a coin as a standard, the app then calculates the precise size of the mole regardless of the size of the photo. For example, photos taken 2 feet and 4 feet away both give the same diameter because both photos are calibrated by the dime in each.
The app was developed by a cancer biologist, Dan Webster, Ph.D., to help his wife monitor her moles between dermatology appointments. Interestingly, it was largely developed by a single person, a sign that creating apps is nearly entering into a DIY era. This increases the possibility for useful health care tools to be developed while also increasing the already crushing crowd of apps, few of which are truly useful.
The app’s functionality would not have been possible without the inclusion of Apple’s ResearchKit and Sage Bionetworks’ Bridge Server. ResearchKit provided open-source tools to facilitate informed consent over the phone and the ability to conduct participant surveys, among other activities. Bridge Server enabled the app to encrypt and securely transfer participant data from the phone to firewalled storage. The combination of these two software frameworks is paving the way for an exciting future of integrated technology and biomedical research.
According to Dan Webster, “ResearchKit is a game-changer because it provides an open-source platform for elegant informed consent, measurement tools, and participant data protection. The ability for participants to have so few barriers to contribute to a research study is the truly transformative aspect of ResearchKit, and we have seen unprecedented numbers of research study enrollees as a result.”
But that’s not all. The app is more than just a consumer tool for tracking – ResearchKit allows OHSU researchers to gather data on nevi, track them over time, and learn characteristics associated with melanoma from user-generated outcomes. This could significantly increase our understanding of melanoma and perhaps spawn an artificially intelligent app that learns to diagnose melanoma without human assistance.
Because of the institutional review board’s requirements for their research, users must be 18 years old to participate in the study. The app gracefully walks users through the consent process and even has a knowledge check at the end to ensure that they understood the risks and benefits of participating. The consent process is so streamlined that it ought to be a model for us to consent any patient for any reason.
To be clear, the app does not make diagnoses. It only provides a framework for patients to photograph their moles and track them. It also politely prompts users to rephotograph moles every 30 days so changes can be recorded.
There are apps with similar names, so be sure you have Mole Mapper from Sage Bionetworks. I tried it out to offer my experience here. Taking photos was as simple as any photo on an iPhone. Like any selfie, however, there are azimuth limits to the human arm – you can’t get shots in remote bodily corners easily. Also, placing a coin on yourself is easier said than done, unless you want to use your bubble gum to hold it in place while you take the shot. (I asked for assistance from my wife instead.)
The photos I took were accurate when compared with the measured diameter in real life, but there are still user-dependent adjustments that could lead to large artifacts. Making the measurement circles even slightly smaller or larger around the coin or the mole can lead to more than a millimeter of margins of error. If detecting melanoma requires less than 1-mm error in mole changes, then this could limit its usefulness.
Whether or not it leads to an app that automatically diagnoses melanoma from patient mole selfies, Mole Mapper has value. Any tool that empowers patients to be actively involved in their care and to meticulously monitor their moles will surely help us in keeping them safe.
Dr. Benabio is a partner physician in the department of dermatology of the Southern California Permanente Group in San Diego, and a volunteer clinical assistant professor at the University of California, San Diego. Dr. Benabio is @dermdoc on Twitter. He has no conflicts relating to the topic of this column.
“Keep an eye on that one, and call me if it changes,” is as much a stock phrase for dermatologists as “Wear your sunscreen.” Yet, how do patients know if a mole changes? I’m quite sure many of my patients wouldn’t notice if I shaved my head and grew a beard, let alone notice if 1 of 30 moles on their back changed color.
Mole Mapper is an iPhone app developed by the department of dermatology at Oregon Health and Science University (OHSU) to solve this problem. The app provides a framework for patients to photo, measure, and track their moles. With clear instructions, an anatomical map, and sophisticated markers, it is a significant aid for motivated patients who want medical-grade photos suitable for tracking.
To standardize the photos, the app prompts you to include a nickel, dime, or quarter in photos with nevi of interest. The user then calibrates the app by pinching onscreen circles overlying the photo such that they correspond exactly to the circumference of the coin and to the mole. Using a coin as a standard, the app then calculates the precise size of the mole regardless of the size of the photo. For example, photos taken 2 feet and 4 feet away both give the same diameter because both photos are calibrated by the dime in each.
The app was developed by a cancer biologist, Dan Webster, Ph.D., to help his wife monitor her moles between dermatology appointments. Interestingly, it was largely developed by a single person, a sign that creating apps is nearly entering into a DIY era. This increases the possibility for useful health care tools to be developed while also increasing the already crushing crowd of apps, few of which are truly useful.
The app’s functionality would not have been possible without the inclusion of Apple’s ResearchKit and Sage Bionetworks’ Bridge Server. ResearchKit provided open-source tools to facilitate informed consent over the phone and the ability to conduct participant surveys, among other activities. Bridge Server enabled the app to encrypt and securely transfer participant data from the phone to firewalled storage. The combination of these two software frameworks is paving the way for an exciting future of integrated technology and biomedical research.
According to Dan Webster, “ResearchKit is a game-changer because it provides an open-source platform for elegant informed consent, measurement tools, and participant data protection. The ability for participants to have so few barriers to contribute to a research study is the truly transformative aspect of ResearchKit, and we have seen unprecedented numbers of research study enrollees as a result.”
But that’s not all. The app is more than just a consumer tool for tracking – ResearchKit allows OHSU researchers to gather data on nevi, track them over time, and learn characteristics associated with melanoma from user-generated outcomes. This could significantly increase our understanding of melanoma and perhaps spawn an artificially intelligent app that learns to diagnose melanoma without human assistance.
Because of the institutional review board’s requirements for their research, users must be 18 years old to participate in the study. The app gracefully walks users through the consent process and even has a knowledge check at the end to ensure that they understood the risks and benefits of participating. The consent process is so streamlined that it ought to be a model for us to consent any patient for any reason.
To be clear, the app does not make diagnoses. It only provides a framework for patients to photograph their moles and track them. It also politely prompts users to rephotograph moles every 30 days so changes can be recorded.
There are apps with similar names, so be sure you have Mole Mapper from Sage Bionetworks. I tried it out to offer my experience here. Taking photos was as simple as any photo on an iPhone. Like any selfie, however, there are azimuth limits to the human arm – you can’t get shots in remote bodily corners easily. Also, placing a coin on yourself is easier said than done, unless you want to use your bubble gum to hold it in place while you take the shot. (I asked for assistance from my wife instead.)
The photos I took were accurate when compared with the measured diameter in real life, but there are still user-dependent adjustments that could lead to large artifacts. Making the measurement circles even slightly smaller or larger around the coin or the mole can lead to more than a millimeter of margins of error. If detecting melanoma requires less than 1-mm error in mole changes, then this could limit its usefulness.
Whether or not it leads to an app that automatically diagnoses melanoma from patient mole selfies, Mole Mapper has value. Any tool that empowers patients to be actively involved in their care and to meticulously monitor their moles will surely help us in keeping them safe.
Dr. Benabio is a partner physician in the department of dermatology of the Southern California Permanente Group in San Diego, and a volunteer clinical assistant professor at the University of California, San Diego. Dr. Benabio is @dermdoc on Twitter. He has no conflicts relating to the topic of this column.

Certain hairstyles can predispose patients to traction alopecia
ORLANDO – When it comes to preventing alopecia, it may be best to advise patients against certain trendy hairstyles that can cause early hair loss.
At the Orlando Dermatology Aesthetic and Clinical Conference, Dr. Wendy Roberts, a dermatologist practicing in Rancho Mirage, Calif., spoke about the risks of traction alopecia associated with some hairstyles and why it’s in patients’ best interest to avoid them if they don’t want to experience premature hair loss.

Dr. Roberts brings up the topic of hair loss with patients during the full-body exam. Full-body skin exams are “opportunities for us, as the skin and hair experts, to speak to our patients about hair loss, [but] it’s rarely asked about,” she said. “Typically, what I do is start my full-body skin exam from the head and I always ask the question right away ‘How’s your hair? Are you having any problems with your hair? How’s your scalp?’ And about 50% of the time, there’s a positive answer or an interest in learning more about it.”
To avoid traction alopecia, caused frequently by intense pulling or pressure on the hair follicles, patients should be advised against braiding their hair or, for male patients, styling their hair in a “man bun.” For braids, the tightness of the braid and pulling along the hairlines will cause intense pressure on follicles over time that can lead to hair loss. For the man bun, Dr. Roberts noted that dermatologists will likely see an uptick in male patients with traction alopecia as this hairstyle becomes more popular.
In the evaluation and treatment of traction alopecia – as with any form of alopecia – clinical presentation, ethnicity, and the age of the patient should be considered, Dr. Roberts said. Additionally, collection of evidence – hair pulls, biopsy, dermoscopy, and lab work should be obtained.
Labs will check for iron levels and anemia, thyroid disease, vitamin D deficiency, and perhaps signs of a connective tissue disorder, she noted. “It’s staggering the amount of African-American women who are deficient in vitamin D, [and] there is some soft evidence that perhaps vitamin D deficiency may be a culprit in some of the clinical signs of discoid lupus erythematosus, [so] check the vitamin D and zinc levels.”
After making a diagnosis, it is important to quickly begin rigorous treatment of the alopecia. Aggressive treatment is “the bottom line,” Dr. Roberts emphasized, “because people are losing their hair and when they come to you, they’ve really had enough.”
She did not report any relevant financial disclosures.
ORLANDO – When it comes to preventing alopecia, it may be best to advise patients against certain trendy hairstyles that can cause early hair loss.
At the Orlando Dermatology Aesthetic and Clinical Conference, Dr. Wendy Roberts, a dermatologist practicing in Rancho Mirage, Calif., spoke about the risks of traction alopecia associated with some hairstyles and why it’s in patients’ best interest to avoid them if they don’t want to experience premature hair loss.
Dr. Roberts brings up the topic of hair loss with patients during the full-body exam. Full-body skin exams are “opportunities for us, as the skin and hair experts, to speak to our patients about hair loss, [but] it’s rarely asked about,” she said. “Typically, what I do is start my full-body skin exam from the head and I always ask the question right away ‘How’s your hair? Are you having any problems with your hair? How’s your scalp?’ And about 50% of the time, there’s a positive answer or an interest in learning more about it.”
To avoid traction alopecia, caused frequently by intense pulling or pressure on the hair follicles, patients should be advised against braiding their hair or, for male patients, styling their hair in a “man bun.” For braids, the tightness of the braid and pulling along the hairlines will cause intense pressure on follicles over time that can lead to hair loss. For the man bun, Dr. Roberts noted that dermatologists will likely see an uptick in male patients with traction alopecia as this hairstyle becomes more popular.
In the evaluation and treatment of traction alopecia – as with any form of alopecia – clinical presentation, ethnicity, and the age of the patient should be considered, Dr. Roberts said. Additionally, collection of evidence – hair pulls, biopsy, dermoscopy, and lab work should be obtained.
Labs will check for iron levels and anemia, thyroid disease, vitamin D deficiency, and perhaps signs of a connective tissue disorder, she noted. “It’s staggering the amount of African-American women who are deficient in vitamin D, [and] there is some soft evidence that perhaps vitamin D deficiency may be a culprit in some of the clinical signs of discoid lupus erythematosus, [so] check the vitamin D and zinc levels.”
After making a diagnosis, it is important to quickly begin rigorous treatment of the alopecia. Aggressive treatment is “the bottom line,” Dr. Roberts emphasized, “because people are losing their hair and when they come to you, they’ve really had enough.”
She did not report any relevant financial disclosures.
EXPERT ANALYSIS FROM THE ODAC CONFERENCE

Nonpharmacologic Treatment of Chronic Pain—A Critical Domains Approach
From the Department of Anesthesiology, University of Michigan, Ann Arbor, MI.
Abstract
- Objective: To provide an overview of the critical treatment domains for patients with chronic pain and describe nonpharmacologic strategies by which these domains can be addressed.
- Methods: A literature review was conducted to evaluate the evidence underlying commonly used nonpharmacologic strategies for the treatment of chronic pain, with a focus on interventions that require patient engagement.
- Results: Nonpharmacologic interventions that actively engage the patient in pain management, such as exercise, behavioral activation, sleep hygiene, and stress management, are relatively easy to implement and do not necessarily require the expertise of mental health professionals. Nonpharmacologic strategies can directly address pain and also address secondary complications, and thus serve to enhance treatment outcomes.
- Conclusion: The critical domains approach can be used to organize a comprehensive nonpharmacologic approach to treating widespread chronic pain.
According to the Institute of Medicine (IOM), chronic pain affects more Americans than coronary heart disease, diabetes, and cancer combined at an estimated cost of $635 billion per year [1]. While it has been demonstrated that we have reasonably good ability to reduce acute pain, providing pharmacologic treatment with even modest effects when addressing chronic pain remains challenging [1]. The ability to treat one form of pain successfully but not the other stems from the fact that chronic pain is not a simple extension of acute pain [2,3]; rather, the mechanisms differ and so must the treatments. The IOM report called for a cultural transformation in how pain is understood, assessed, and treated. In response, the National Pain Strategy [4] was developed. It was recommended that efficacious self-management strategies be used for individuals with chronic pain; such strategies are largely nonpharmacologic [4].
This article presents an approach to addressing chronic pain using nonpharmacologic strategies. While a number of nonpharmacologic treatments involve patients as passive recipients (eg, massage, acupuncture, balneotherapy or spa treatments), most require the patient to be engaged, eg, to exert physical energy, learn a new skill, and/or change a behavior. The approach presented here is organized around addressing critical domains, including the need to increase activity, deal with psychiatric comorbidities, address sleep problems, and tackle stress. The strategies suggested will be those that have the best evidence base and are predominantly ones that can be deployed by physicians and other health care professionals who do not necessarily have specialized training in behavioral health. A case is presented to illustrate this approach.
Case Presentation
Lisa is a 42-year-old Caucasian woman with a 2-year history of chronic low back pain presenting to a primary care clinic. She reported that the back pain began when she was working as an office manager in a busy dental clinic. The onset was sudden, occurring when she lifted a heavy box of copier paper using a “leaning and twisting motion.” The pain is described as constant (rated as 5 out of 10) and she experiences periods of more intense pain or “flares” (rated as 9 out of 10); Lisa noted that “10 is reserved for childbirth.” The flares seem to coincide with periods of stress and can result in up to 2 days of immobility, causing her to miss work at the dental office.
The pain is described as deep, aching, and throbbing but does not radiate to her legs. It is made worse by sitting still for longer than an hour and gets better if she keeps moving and gets a good night of sleep. Her sleep is generally disturbed as she has trouble falling asleep and when she does sleep, she usually wakes up feeling unrefreshed and extremely irritable. Moreover, while she knows that activity makes her pain better, Lisa can rarely find the energy or motivation to exercise.
Various evaluations by specialists have been obtained and studies conducted, including a recent MRI. All were found to be negative for a clear-cut pathology. A visit to a rheumatologist 5 years ago resulted in a diagnosis of fibromyalgia that Lisa does not accept. Upon probing, she detailed what turns out to be an almost 20-year history of chronic pain. The back pain is only the latest diagnosis in an extensive list of painful conditions including premenstrual syndrome (PMS), headache, temporomandibular joint disorder (TMJ), and fibromyalgia. There are no aspects of her history or presentation that suggest a diagnosis other than chronic musculoskeletal pain.
Lisa is a divorced mother of 2 adolescent children who are generally well-adjusted if not age-appropriately defiant. She is overweight (body mass index = 29) and admits to overeating when under stress. She says that the back pain has disrupted every aspect of her life and work is the only thing that gets adequate attention. Her salary is critical to her family’s financial stability, thus it is a priority. Lisa noted that she saves all of her energy for her job and has “nothing left in the tank” for her children or herself. She notes that, “I have zero joy in my life—I rarely go anywhere fun with my kids anymore, putter in my garden, and forget about going on dates. I can’t remember the last enjoyable thing I did!”
What are aspects to consider in addressing this patient’s symptoms?
Lisa’s case is likely recognizable—she presents with a long history of pain in multiple areas of her body (eg, low back pain, PMS, headache, TMJ) without clear-cut pathology. She has multiple physical and social problems and limited resources. The diagnosis of fibromyalgia is likely correct. The low back pain is probably another manifestation of a broader “centralized pain” condition [5,6]. The term centralized pain refers to the amplification of pain via changes in the central nervous system [7,8]. This does not mean that peripheral nociceptive input (ie, tissue damage or inflammation) plays no role in the pain; however, it implies that any painful stimulus is experienced with greater intensity than would be expected [5,6]. Further, psychological, behavioral, and social elements tend to be key factors in centralized pain states due in part to the exhausting challenge of living with chronic pain, as well as genetic factors that predispose to both pain and mood disturbances [9].
Due to the often complex nature of chronic pain, successful treatment usually requires addressing multiple areas of concern, including addressing behavioral, cognitive, and affective processes. It is suggested that a plan for nonpharmacologic pain management could be built around 6 domains represented by the acronym ExPRESS [10], namely Exercise, Psychological distress, Regaining function, Emotional well-being, Sleep hygiene, and Stress management. This article provides a review of the literature that focuses on systematic reviews and meta-analyses to summarize a massive literature largely supporting the use of nonpharmacologic strategies such as exercise, cognitive-behavioral therapy, mindfulness-based treatments, behavioral self-management, resilience-based interventions, and education to address the ExPRESS [10] domains using Lisa’s case as an example.
How effective is exercise for treating chronic pain and how should it be integrated into treatment?
Exercise
Over the last 5 years, a number of meta-analyses have been conducted to evaluate a robust literature regarding exercise interventions for the treatment of chronic pain [11–14]. The evidence is strong that patients with chronic pain benefit from increased physical activity and in many cases the effect size is quite substantial [14]. Meta-analytic data suggest that aerobic exercise results in significantly less pain and disability [13], improved physical fitness [14], less fatigue and better mood [14]. Exercise can be land-based or water-based [14], be conducted at a slight to moderate intensity and/or even involve only a program of walking [12]. Most established guidelines highlight the benefits of including exercise as part of the nonpharmacologic management of patients with chronic pain [15–18].
Data suggest that chronic pain patients should begin exercise training slowly starting at levels below capacity and increase duration and intensity over time until patients are exercising at low to moderate intensity (ie, 50% to 70% of age-adjusted maximum heart rate) for 20 to 30 minutes per session 2 to 3 times per week [19].
Obesity and deconditioning are common and are thought to contribute to pain sensitivity, poor sleep, and depressed mood [20]. Lisa is overweight and inactive. She injured her back and reports generally avoiding any form of exercise. Getting her moving will be imperative as an increase in physical activity could not only help her to lose weight, but could have the added benefits of decreasing her pain and stiffness, helping her sleep better and improving her mood and self-esteem. Yet, she reports not having the time or motivation.
A reasonable approach would be to not prescribe formal exercise at first but rather encourage small and immediate changes in how she already goes about her day. One concrete step would be to encourage her to stand up and stretch every 20 minutes or so while working at her computer. This is something that she cites as directly contributing to her pain. Next, an increase in physical activity such as adding a few steps every day and doing regular activities with more vigor would be a great initial step.
One of the most formidable barriers to getting patients to exercise is the perception that they must go to the gym and begin a formal program in order to achieve any benefit. As an employed single mother with two children Lisa likely lacks the time and resources for a formal exercise program. She could instead, begin a walking program that starts with reasonable goals (eg, 6000 steps per day) and builds at a slow and steady pace (eg, add 100 steps per day). Activity trackers range in price, but a simple pedometer can be found for under $10. By initiating such a walking program, the things she does already such as chores around the house all count as physical activity. She could do these with more energy and mindfulness and incrementally add activity over time.
Once a new habit of increased physical activity has been established, the strategy of branching out into new physical activities (or even more formal exercise) is usually more successful especially if they are enjoyable and feasible (ie, affordable, not too time consuming). The need to engage in more physical activity could be the impetus to encourage Lisa to do more activities with her children—walking to the park, flying a kite, and exploring the science museum are all activities that can provide physical, emotional and social benefits simultaneously.
What interventions are helpful in addressing psychiatric comorbidity?
Psychological Distress
Comorbidity with mood and anxiety disorders is often observed and complicates treatment in patients with chronic pain states [21–23]. Patients with centralized pain conditions like fibromyalgia tend to have even higher rates of psychiatric comorbidity than those with other pain conditions like arthritis alone [24–26]. While estimates vary widely, we have recently reported that 36.2% of patients evaluated in our tertiary care setting meet case criteria for depression [27]. Such psychiatric comorbidity has been shown to be associated with increased pain, worse functioning, higher costs and increased use of opioids [27–30]. Further, suicidal ideation is common in chronic pain populations, especially those with depression and anxiety, and should be carefully evaluated if suspected [31]. The presence of psychiatric comorbidity takes a toll on the individual and society. One study found that pain patients with comorbid depression utilized twice the resources that other patients without depression utilized [32]. Perhaps the most troubling element is that psychiatric comorbidity is too often not adequately addressed in medical settings [33].
Assessing for depression using a standardized measure like the PHQ-9 [34] or anxiety using the GAD-7 [35] can provide a sense of the severity of the psychiatric symptoms. More severe forms of depression and anxiety may require referral, but more mild depressive and/or anxiety symptoms may be treated by the medical personnel the patient already knows and trusts. Nonpharmacologic strategies that can be used to address depression, anxiety, and even pain in chronic pain populations include cognitive-behavioral therapy, exercise/physical activity, regulating sleep and behavioral activation (ie, getting patients engaged with valued activities, social support).
Perhaps the most effective strategy to address depression, anxiety, and pain in chronic pain populations is cognitive-behavioral therapy (CBT) [36–38]. CBT for pain consists of both cognitive and behavioral therapy interventions. Cognitive therapy proposes that modifying maladaptive thoughts will result in changes in emotions and behavior [39]. Thus, errors in thinking like catastrophizing, overgeneralizing, and minimizing positives are confronted and changed to more realistic and helpful thoughts. This results in less emotional distress and fewer self-defeating behaviors. In cognitive therapy for chronic pain, catastrophic thoughts such as “My pain is terrible and nothing I do helps” are replaced by more adaptive thoughts like “Although my pain is severe, there still are a few things I can do to make it a little better.” Several behavioral techniques are also employed such as behavioral activation (getting patients moving again), activity pacing (not overdoing it on days patients feel good and remaining active on days they feel bad), sleep hygiene (identifying then changing behaviors know to disrupt sleep), and relaxation skills (eg, breathing, imagery, progressive muscle relaxation). Meta-analyses have shown that CBT has empirical support for its effectiveness in treating patients with chronic pain [40,41].
During the visit, Lisa reported a loss of joy in her life and then began crying. Such a report should prompt a more formal exploration of the potential for depression. She would likely benefit from antidepressant medication and behavioral intervention. The physical activity prescribed above will also pertain to treating her depressive symptoms as will strategies to improve her emotional well-being, sleep and stress noted below. Perhaps the most beneficial strategy would be to refer her to CBT for pain and depressive symptoms. CBT for pain would help Lisa acquire the skills required to address many ExPRESS [10] domains including increasing physical activity, improving mood, decreasing stress, and improving sleep.
What strategy can be recommended to help patients regain function?
Regaining Function
Pain is disruptive. Patients with pain may avoid activity due to fear of re-injury or making the pain worse. Pain may keep them awake at night and lead to daytime fatigue. Pain can be so bad that a patient cannot even do simple tasks, One of the most important goals in successfully managing pain is to move away from trying to cure the pain and instead focus on regaining function—helping the patient do some of the things he/she really wants to do despite the pain. The patient may not be able to all the things he/she used to do, but new ways to do many of these activities can be found. Patients can also identify new rewarding activities to do now that things have changed.
To regain function, an evidence-based strategy comes from behavior therapy and is known as graded activation [42–46]. Here the patient is assigned one very small, manageable and incremental step towards achieving a goal. As these small goals are met, the patient feels motivated to engage in more and larger goals.
Lisa specifically mentioned giving up valued activities in light of her chronic pain. To help her re-engage a graded task assignment approach can be taken. For example, Lisa would be encouraged to first identify an activity she would like to get back to doing again. If she were to say “gardening,” then she is to next identify one small, specific, and easily achievable goal for the short term, such as “garden for 20 minutes at least once in the next week.” Help her identify the roadblocks to completing this small goal and brainstorm solutions such as “My kids have soccer and basketball practices 5 days next week so I will ask my ex-husband take them to practice at least one day next week so I can spend time in my garden.” Lisa will be told to schedule time to garden as if it were an appointment with a doctor.
Another important issue to consider is the tendency for inconsistent levels of activities across days that are predicated on how one feels that particular day. On “good days” often patients inadvertently engage in more activity than personal limitations allow and as a consequence experience several “bad days” of pain and other symptom flare up which can result in lost productivity and worse self-esteem. The goal is to have patients engage in a moderate amount of activity every day and avoid activity “binges” or days with little of no activity. Graded activation is a method of pacing that can improve physical functioning while minimizing the likelihood of pain flare-ups.
What simple strategies can be used to improve patients’ emotional well-being?
Emotional Well-Being
Psychological distress and emotional well-being occur along a continuum. Eliminating psychological distress only returns one to a state of being without distress. That is not the same as experiencing emotional well-being or happiness. People with chronic pain who also have higher levels of emotional well-being (or happiness) have decreased pain severity, fewer symptoms, better levels of functioning, and greater life satisfaction [47–49].
Recent studies provide preliminary evidence suggesting that resilience-based interventions such as keeping a gratitude journal or scheduling time to engage in pleasant activities boast equivalence or even superiority to CBT for the treatment of mood with effects that persist over time [50,51]. Two recent meta-analyses have shown that resilience-based interventions have been used to treat healthy individuals and a range of clinical conditions with a mean effect size for improving well-being ranging between 0.34 to 0.61 (ie, moderate-large effects [Cohen’s d]) [52,53]. Positive activities interventions are thought to function by increasing positive affect, which in turn, enables creativity, problem-solving, perspective-taking, and other beneficial states [54]. Such states are conducive to better mood [55,56], behavioral activation/increased physical activity [57–60], better sleep [61–63], increased social support [54,64] and physiological changes (eg, improved vagal tone, lower blood pressure, more adaptive immune responses) [57,65–69]. Recent studies have successfully adapted resilience-based interventions and shown them to be effective for individuals with pain [70–72]. Resilience-based interventions may be particularly helpful for chronic pain patients given that depression and sleep disturbances are frequent comorbidities [5,21–26,28,73,74].
Lisa stated, “I have zero joy in my life…” and later burst into tears. It is easy to surmise that her emotional well-being is quite poor. She also noted that she saves all of her energy for her job and has “nothing left in the tank” for her children or herself. This is a common picture for individuals with chronic pain. Valued life activities like spending quality time with loved ones, going to sporting events or doing a hobby are put aside in favor of obligatory (eg, activities of daily living) and committed (eg, work, school) activities. While this strategy might help one survive, it certainly is not conducive to thriving. To help Lisa improve her emotional well-being, there are good data supporting pleasant activity scheduling amongst other strategies. For pleasant activity scheduling Lisa would be directed to set aside time a few days a week (at least an hour) to do things that she enjoys. This time should be placed on her calendar and treated with the same level of commitment as going to work or to an appointment with her physician.
What nonpharmacologic options are available to help improve patients’ sleep?
Sleep
Lisa indicated that she has trouble falling asleep and then when she does sleep, she usually wakes up feeling unrefreshed and irritable. This is a common complaint amongst individuals with chronic pain who often report difficulty falling asleep, being awakened by pain or discomfort and awakening feeling unrefreshed and unrestored [75]. Sleep, pain and mood form a symptomatic triad such that when one aspect is affected the others are impacted. For example, when Lisa does not sleep well, her pain and mood worsen, as well. Conversely, when her pain is better, she likely sleeps better and wakes up feeling less irritable and experiences less pain.
Behavioral strategies for improving sleep, if used on a regular basis, can help individuals get needed restorative sleep with the additional benefits of improving mood, pain, fatigue, and mental clarity [76]. Some of these behavioral strategies focus on maintaining regular sleep routines (go to bed at the same time every night even on weekends), engaging in sleep conducive behaviors (eg, attempting to sleep only when in feeling sleepy), and avoiding stimulating activities (eg, watching action movies, or consuming nicotine or caffeine). Studies have shown that behavioral strategies targeting sleep appear to have a direct impact on pain symptoms and on functional interference resulting from nonrestorative sleep [77,78].
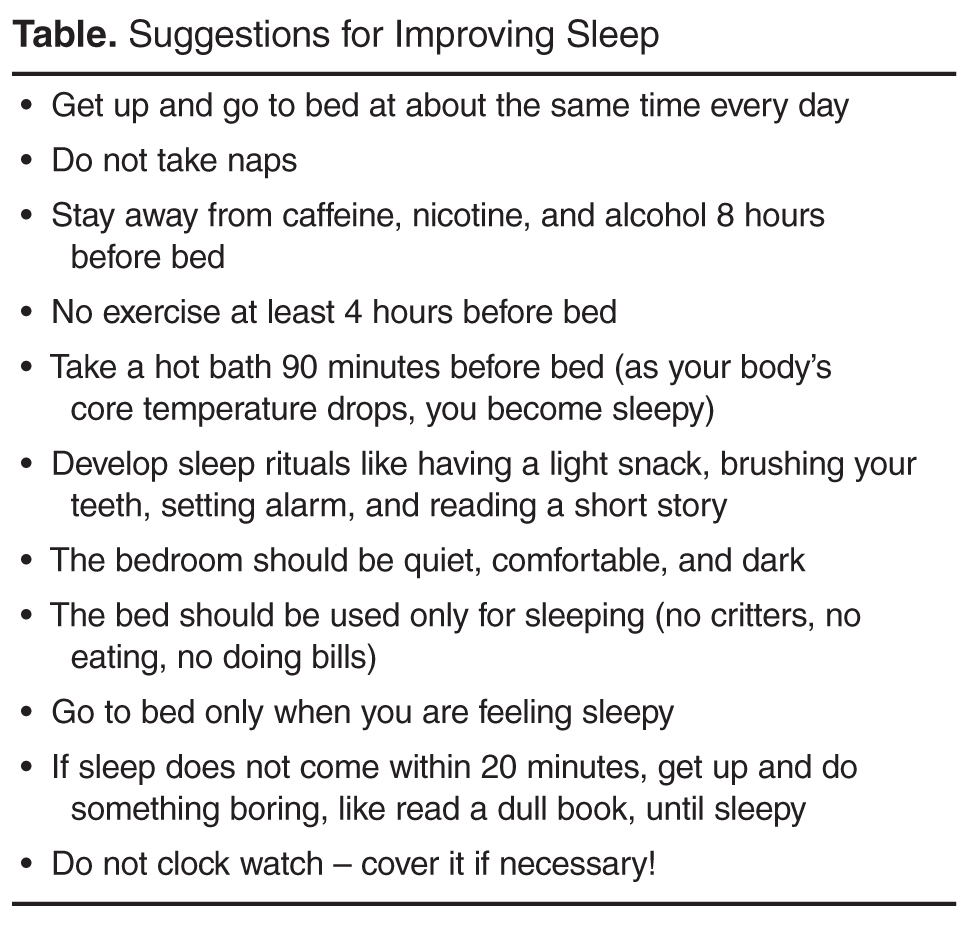
What stress reduction strategies can be recommended to the patient?
Stress
Stress management has long been a target of treatment in patients with chronic pain. Progressive muscle relaxation (PRM) [79] and autogenic training have typically served as an important foundation of behavioral intervention for chronic pain [80] although there are no randomized controlled trials for PRM as a stand-alone intervention and two separate trials of autogenic training failed to find superiority for this intervention [81,82]. Despite the lack of direct evidence, clinical experience and the knowledge that both relaxation techniques are commonly part of CBT for chronic pain, their efficacy is generally accepted.
An emerging area of nonpharmacologic treatment is mindfulness-based interventions [83], which can include mindfulness-based stress reduction (MBSR) and Acceptance and Commitment Therapy [84], which can be considered a hybrid between mindfulness meditation and CBT. These interventions are still relatively new and larger, better controlled studies are needed. In MBSR, the patient is directed to focus on one thing such as a sound, a pleasant scene or their own breathing. The practitioner is encouraged to keep thoughts present oriented and analytical concerns are to be gently dismissed in favor of focusing on the sounds, scene, or breath. A recent meta-analysis evaluating 15 studies in clinical populations reported that there were small to medium effect sizes for patients with chronic pain [85]. In another new meta-analysis evaluating only studies in chronic pain the authors reported that sleep quality and pain acceptance were the 2 variables with the largest effect sizes based on the 11 studies they evaluated [83]. Similarly, a meta-analysis that included both MBSR and ACT found that 22 studies of varying quality suggest significant but small effect sizes for pain (ES = 0.37) and depression (ES = 0.32) [86]. They concluded the mindfulness-based treatments were not superior to CBT but could be a viable alternative.
For Lisa and many other chronic pain patients, the symptom flares seem to coincide with periods of stress. These flare ups are not inconsequential and have cost her days of lost productivity and potentially put her employment at risk. Moreover, she has identified stress as a trigger for over-eating which certainly contributes to her weight problems and low self-esteem. MBSR can be learned in a structured class or online--many of the principles can be taught by lay instructors.
Summary
While it is likely that health care professionals will continue to rely on pharmacological therapies in treating chronic pain, it is important to be aware that reliance on medications and procedural interventions alone is unlikely to bring adequate relief to individuals living with chronic pain [1]. Optimal pain management appears to be achieved by using a combination of both pharmacologic and nonpharmacologic approaches. Nonpharmacologic interventions that actively engage the patient in pain management such as exercise, behavioral activation, sleep hygiene and stress management are relatively easy to implement and do not necessarily require the expertise of mental health professionals. The challenge is considering pain in its biopsychosocial contexts and defining an approach that is both comprehensive and feasible. Using the ExPRESS domains to help guide care can provide a road map.
Corresponding author: Afton L. Hassett, PsyD, 24 Frank Lloyd Wright Drive, Lobby M, CPFRC, Ann Arbor, MI 48106, [email protected].
1. Institute of Medicine. Relieving pain in America a blueprint for transforming prevention, care, education, and research. In. Washington, DC: National Academy of Sciences; 2011.
2. Latremoliere A, Woolf CJ. Central sensitization: a generator of pain hypersensitivity by central neural plasticity. J Pain 2009;10:895–926.
3. Clauw DJ. Fibromyalgia: a clinical review. JAMA 2014;311:1547–55.
4. National Pain Strategy. A Comprehensive Population Health-Level Strategy for Pain. 2015. Accessed at http://iprcc.nih.gov/docs/DraftHHSNationalPainStrategy.pdf.
5. Brummett CM, Goesling J, Tsodikov A, et al. Prevalence of the fibromyalgia phenotype in spine pain patients presenting to a tertiary care pain clinic and the potential treatment implications. Arthritis Rheum 2013.
6. Williams DA, Clauw DJ. Understanding fibromyalgia: lessons from the broader pain research community. J Pain 2009;10:777-91.
7. Clauw DJ. Fibromyalgia: a clinical review. JAMA 2014;311:1547–55.
8. Woolf CJ. Central sensitization: implications for the diagnosis and treatment of pain. Pain 2011;152:S2–15.
9. Goesling J, Clauw DJ, Hassett AL. Pain and depression: an integrative review of neurobiological and psychological factors. Curr Psychiatry Rep 2013;15:421.
10. Hassett AL, Gevirtz RN. Nonpharmacologic treatment for fibromyalgia: patient education, cognitive-behavioral therapy, relaxation techniques, and complementary and alternative medicine. Rheum Dis Clin North Am 2009;35:393–407.
11. Searle A, Spink M, Ho A, Chuter V. Exercise interventions for the treatment of chronic low back pain: a systematic review and meta-analysis of randomised controlled trials. Clin Rehabil 2015;29:1155–67.
12. O’Connor SR, Tully MA, Ryan B, et al. Walking exercise for chronic musculoskeletal pain: systematic review and meta-analysis. Arch Phys Med Rehabil 2015;96:724-34 e3.
13. Meng XG, Yue SW. Efficacy of aerobic exercise for treatment of chronic low back pain: a meta-analysis. Am J Phys Med Rehabil 2015;94:358–65.
14. Hauser W, Klose P, Langhorst J, et al. Efficacy of different types of aerobic exercise in fibromyalgia syndrome: a systematic review and meta-analysis of randomised controlled trials. Arthritis Res Ther 2010;12:R79.
15. Burckhardt CS, Goldenberg D, Crofford L, et al. Guideline for the management of fibromyalgia syndrome. Pain in adults and children. Glenview, IL: American Pain Society; 2005.
16. Carville SF, Arendt-Nielsen S, Bliddal H, et al. EULAR evidence-based recommendations for the management of fibromyalgia syndrome. Ann Rheum Dis 2008;67:536–41.
17. Chou R, Huffman LH, American Pain Society, American College of Pain Medicine. Nonpharmacologic therapies for acute and chronic low back pain: a review of the evidence for an American Pain Society/American College of Physicians clinical practice guideline. Ann Intern Med 2007;147:492–504.
18. Chou R, Qaseem A, Snow V, , Clinical Efficacy Assessment Subcommittee of the American College of Physicians, American College of Pain Medicine, American Pain Society low back pain guidelines P. Diagnosis and treatment of low back pain: a joint clinical practice guideline from the American College of Physicians and the American Pain Society. Ann Intern Med 2007;147:478–91.
19. Hauser W, Klose P, Langhorst J, et al. Efficacy of different types of aerobic exercise in fibromyalgia syndrome: a systematic review and meta-analysis of randomised controlled trials. Arthritis Res Ther;12:R79.
20. Okifuji A, Donaldson GW, Barck L, Fine PG. Relationship between fibromyalgia and obesity in pain, function, mood and sleep. J Pain 2010.
21. Gore M, Sadosky A, Stacey BR, et al. The burden of chronic low back pain: clinical comorbidities, treatment patterns, and health care costs in usual care settings. Spine 2012;37:E668-77.
22. Von Korff M, Crane P, Lane M, et al. Chronic spinal pain and physical-mental comorbidity in the United States: results from the national comorbidity survey replication. Pain 2005;113:331–9.
23. Reme SE, Tangen T, Moe T, Eriksen HR. Prevalence of psychiatric disorders in sick listed chronic low back pain patients. Eur J Pain 2011;15:1075–80.
24. Arnold LM, Hudson JI, Keck PE, et al. Comorbidity of fibromyalgia and psychiatric disorders. J Clin Psychiatry 2006;67:1219–25.
25. Hassett AL, Radvanski DC, Buyske S, et al. Psychiatric comorbidity and other psychological factors in patients with “chronic Lyme disease”. Am J Med 2009;122:843–50.
26. Epstein SA, Kay G, Clauw D, et al. Psychiatric disorders in patients with fibromyalgia. A multicenter investigation. Psychosomatics 1999;40:57–63.
27. Goesling J, Henry MJ, Moser SE, et al. Symptoms of depression are associated with opioid use regardless of pain severity and physical functioning among treatment-seeking patients with chronic pain. J Pain 2015;16:844–51.
28. Hassett AL, Cone JD, Patella SJ, Sigal LH. The role of catastrophizing in the pain and depression of women with fibromyalgia syndrome. Arthritis Rheum 2000;43:2493–500.
29. Giesecke T, Williams DA, Harris RE, et al. Subgroupings of fibromyalgia patients on the basis of pressure pain thresholds and psychological factors. Arthritis Rheum 2003;48:2916–22.
30. Walen HR, Cronan PA, Bigatti SM. Factors associated with healthcare costs in women with fibromyalgia. Am J Manag Care 2001;7 Spec No:SP39-47.
31. Hassett AL, Aquino JK, Ilgen MA. The risk of suicide mortality in chronic pain patients. Curr Pain Headache Rep 2014;18:436.
32. Robinson RL, Birnbaum HG, Morley MA, et al. Depression and fibromyalgia: treatment and cost when diagnosed separately or concurrently. J Rheumatol 2004;31:1621–9.
33. Fitzcharles MA. In: Canadian Rheumatology Association’s 64th Annual Meeting; 2009.
34. Kroenke K, Spitzer RL, Williams JB. The PHQ-9: validity of a brief depression severity measure. J Gen Intern Med 2001;16:606-13.
35. Spitzer RL, Kroenke K, Williams JB, Lowe B. A brief measure for assessing generalized anxiety disorder: the GAD-7. Arch Intern Med 2006;166:1092–7.
36. Morley S, Eccleston C, Williams A. Systematic review and meta-analysis of randomized controlled trials of cognitive behaviour therapy and behaviour therapy for chronic pain in adults, excluding headache. Pain 1999;80:1–13.
37. Hoffman BM, Papas RK, Chatkoff DK, Kerns RD. Meta-analysis of psychological interventions for chronic low back pain. Health Psychol 2007;26:1–9.
39. Bernardy K, Fuber N, Kollner V, Hauser W. Efficacy of cognitive-behavioral therapies in fibromyalgia syndrome - a systematic review and metaanalysis of randomized controlled trials. J Rheumatol 2010;37:1991–2005.
39. Beck JS. Cognitive therapy: basics and beyond. New York: Guilford Press; 1995.
40. Bernardy K, Füber N, Köllner V, Häuser W. Efficacy of cognitive-behavioral therapies in fibromyalgia syndrome - a systematic review and metaanalysis of randomized controlled trials. J Rheumatol 2010;37:1991–2005.
41. Bernardy K, Klose P, Busch AJ, et al. Cognitive behavioural therapies for fibromyalgia. Cochrane Database Syst Rev 2013;9:CD009796.
42. Nielson WR, Walker C, McCain GA. Cognitive behavioral treatment of fibromyalgia syndrome: preliminary findings. J Rheumatol 1992;19:98–103.
43. Nicassio PM, Radojevic V, Weisman MH, et al. A comparison of behavioral and educational interventions for fibromyalgia. J Rheumatol 1997;24:2000–7.
44. Williams DA, Cary MA, Groner KH, et al. Improving physical functional status in patients with fibromyalgia: a brief cognitive behavioral intervention. J Rheumatol 2002;29:1280–6.
45. Lindstrom I, Ohlund C, Eek C, et al. Mobility, strength, and fitness after a graded activity program for patients with subacute low back pain. A randomized prospective clinical study with a behavioral therapy approach. Spine 1992;17:641–52.
46. Lindstrom I, Ohlund C, Eek C, et al. The effect of graded activity on patients with subacute low back pain: a randomized prospective clinical study with an operant-conditioning behavioral approach. Phys Ther 1992;72:279-90; discussion 91–3.
47. McAllister SJ, Vincent A, Hassett AL, et al. Psychological resilience, affective mechanisms and symptom burden in a tertiary-care sample of patients with fibromyalgia. Stress Health 2015;31:299–305.
48. Toussaint LL, Vincent A, McAllister SJ, et al. A comparison of fibromyalgia symptoms in patients with healthy versus depressive, low and reactive affect balance styles. Scand J Pain 2014;5:161–6.
49. Hassett AL, Simonelli LE, Radvanski DC, et al. The relationship between affect balance style and clinical outcomes in fibromyalgia. Arthritis Rheum 2008;59:833–40.
50. Zamirinejad S, Hojjat SK, Golzari M, et al. Effectiveness of resilience training versus cognitive therapy on reduction of depression in female iranian college students. Issues Ment Health Nurs 2014;35:480–8.
51. Asgharipoor N, Asgharnejad Farid A, Arshadi H, Sahebi A. A comparative study on the effectiveness of positive psychotherapy and group cognitive-behavioral therapy for the patients suffering from major depressive disorder. Iran J Psychiatry Behav Sci 2012;6:33–41.
52. Sin NL, Lyubomirsky S. Enhancing well-being and alleviating depressive symptoms with positive psychology interventions: a practice-friendly meta-analysis. J Clin Psychol 2009;65:467–87.
53. Bolier L, Haverman M, Westerhof GJ, et al. Positive psychology interventions: a meta-analysis of randomized controlled studies. BMC Public Health 2013;13:119.
54. Fredrickson BL. The role of positive emotions in positive psychology. The broaden-and-build theory of positive emotions. Am Psychol 2001;56:218–26.
55. Seligman ME, Steen TA, Park N, Peterson C. Positive psychology progress: empirical validation of interventions. Am Psychol 2005;60:410–21.
56. Seligman ME, Rashid T, Parks AC. Positive psychotherapy. Am Psychol 2006;61:774–88.
57. White DK, Keysor JJ, Neogi T, et al. When it hurts, a positive attitude may help: association of positive affect with daily walking in knee osteoarthritis. Results from a multicenter longitudinal cohort study. Arthritis Care Res (Hoboken) 2012;64:1312–9.
58. Strine TW, Chapman DP, Balluz LS, et al. The associations between life satisfaction and health-related quality of life, chronic illness, and health behaviors among U.S. community-dwelling adults. J Community Health 2008;33:40–50.
59. Grant N, Wardle J, Steptoe A. The relationship between life satisfaction and health behavior: a cross-cultural analysis of young adults. Int J Behav Med 2009;16:259–68.
60. Baruth M, Lee DC, Sui X, et al. Emotional outlook on life predicts increases in physical activity among initially inactive men. Health Educ Behav 2011;38:150–8.
61. Kalmbach DA, Pillai V, Roth T, Drake CL. The interplay between daily affect and sleep: a 2-week study of young women. J Sleep Res 2014;23:636–45.
62. Simor P, Krietsch KN, Koteles F, McCrae CS. Day-to-day variation of subjective sleep quality and emotional states among healthy university students-a 1-week prospective study. Int J Behav Med 2015;22:625–34.
63. von Kanel R, Mausbach BT, Ancoli-Israel S, et al. Positive affect and sleep in spousal Alzheimer caregivers: a longitudinal study. Behav Sleep Med 2014;12:358–72.
64. Cohn MA, Fredrickson BL, Brown SL, et al. Happiness unpacked: positive emotions increase life satisfaction by building resilience. Emotion 2009;9:361–8.
65. Ostir GV, Berges IM, Markides KS, Ottenbacher KJ. Hypertension in older adults and the role of positive emotions. Psychosom Med 2006;68:727–33.
66. Stone AA, Cox DS, Valdimarsdottir H, et al. Evidence that secretory IgA antibody is associated with daily mood. J Pers Soc Psychol 1987;52:988–93.
67. Steptoe A, Wardle J, Marmot M. Positive affect and health-related neuroendocrine, cardiovascular, and inflammatory processes. Proc Natl Acad Sci U S A 2005;102:6508–12.
68. Kok BE, Coffey KA, Cohn MA, et al. How positive emotions build physical health: perceived positive social connections account for the upward spiral between positive emotions and vagal tone. Psychol Sci 2013;24:1123–32.
69. Bhattacharyya MR, Whitehead DL, Rakhit R, Steptoe A. Depressed mood, positive affect, and heart rate variability in patients with suspected coronary artery disease. Psychosom Med 2008;70:1020–7.
70. Hausmann LR, Parks A, Youk AO, Kwoh CK. Reduction of bodily pain in response to an online positive activities intervention. J Pain 2014;15:560–7.
71. Muller R, Gertz KJ, Molton IR, et al. Effects of a tailored positive psychology intervention on well-being and pain in individuals with chronic pain and a physical disability: a feasibility trial. Clin J Pain 2015.
72. Flink IK, Smeets E, Bergbom S, Peters ML. Happy despite pain: Pilot study of a positive pscyhology intervention for patients with chronic pain. Scandinavian Jounral of Pain 2015;7:71–9.
73. Hassett AL, Radvanski DC, Buyske S, et al. Role of psychiatric comorbidity in chronic Lyme disease. Arthritis Rheum 2008;59:1742–9.
74. Choy EH. The role of sleep in pain and fibromyalgia. Nat Rev Rheumatol 2015;11:513–20.
75. Fishbain DA, Cole B, Lewis JE, Gao J. What is the evidence for chronic pain being etiologically associated with the DSM-IV category of sleep disorder due to a general medical condition? A structured evidence-based review. Pain Med 2010;11:158–79.
76. Morin CM, Culbert JP, Schwartz SM. Nonpharmacological interventions for insomnia: A meta-analysis of treatment efficacy Am J Psychiatry 1994;151:1172–80.
77. Affleck G, Urrows S, Tennen H, et al. Sequential daily relations of sleep, pain intensity, and attention to pain among women with fibromyalgia. Pain 1996;68:363–8.
78. Edinger JD, Wohlgemuth WK, Krystal AD, Rice JR. Behavioral insomnia therapy for fibromyalgia patients: a randomized clinical trial. Arch Intern Med 2005;165:2527–35.
79. Jacobson E. Progressive relaxation. Chicago: University of Chicago Press; 1938.
80. van Tulder MW, Koes B, Malmivaara A. Outcome of non-invasive treatment modalities on back pain: an evidence-based review. Eur Spine J 2006;15 Suppl 1:S64–81.
81. Keel PJ, Bodoky C, Gerhard U, Muller W. Comparison of integrated group therapy and group relaxation training for fibromyalgia. Clin J Pain 1998;14:232–8.
82. Rucco V, Feruglio C, Genco F, Mosanghini R. [Autogenic training versus Erickson’s analogical technique in treatment of fibromyalgia syndrome]. Riv Eur Sci Med Farmacol 1995;17:41–50.
83. Bawa FL, Mercer SW, Atherton RJ, et al. Does mindfulness improve outcomes in patients with chronic pain? Systematic review and meta-analysis. Br J Gen Pract 2015;65:e387–400.
84. Ost LG. The efficacy of acceptance and commitment therapy: an updated systematic review and meta-analysis. Behav Res Ther 2014;61:105–21.
85. Crowe M, Jordan J, Burrell B, et al. Mindfulness-based stress reduction for long-term physical conditions: a systematic review. Aust N Z J Psychiatry 2015.
86. Veehof MM, Oskam MJ, Schreurs KM, Bohlmeijer ET. Acceptance-based interventions for the treatment of chronic pain: a systematic review and meta-analysis. Pain 2011;152:533–42.
From the Department of Anesthesiology, University of Michigan, Ann Arbor, MI.
Abstract
- Objective: To provide an overview of the critical treatment domains for patients with chronic pain and describe nonpharmacologic strategies by which these domains can be addressed.
- Methods: A literature review was conducted to evaluate the evidence underlying commonly used nonpharmacologic strategies for the treatment of chronic pain, with a focus on interventions that require patient engagement.
- Results: Nonpharmacologic interventions that actively engage the patient in pain management, such as exercise, behavioral activation, sleep hygiene, and stress management, are relatively easy to implement and do not necessarily require the expertise of mental health professionals. Nonpharmacologic strategies can directly address pain and also address secondary complications, and thus serve to enhance treatment outcomes.
- Conclusion: The critical domains approach can be used to organize a comprehensive nonpharmacologic approach to treating widespread chronic pain.
According to the Institute of Medicine (IOM), chronic pain affects more Americans than coronary heart disease, diabetes, and cancer combined at an estimated cost of $635 billion per year [1]. While it has been demonstrated that we have reasonably good ability to reduce acute pain, providing pharmacologic treatment with even modest effects when addressing chronic pain remains challenging [1]. The ability to treat one form of pain successfully but not the other stems from the fact that chronic pain is not a simple extension of acute pain [2,3]; rather, the mechanisms differ and so must the treatments. The IOM report called for a cultural transformation in how pain is understood, assessed, and treated. In response, the National Pain Strategy [4] was developed. It was recommended that efficacious self-management strategies be used for individuals with chronic pain; such strategies are largely nonpharmacologic [4].
This article presents an approach to addressing chronic pain using nonpharmacologic strategies. While a number of nonpharmacologic treatments involve patients as passive recipients (eg, massage, acupuncture, balneotherapy or spa treatments), most require the patient to be engaged, eg, to exert physical energy, learn a new skill, and/or change a behavior. The approach presented here is organized around addressing critical domains, including the need to increase activity, deal with psychiatric comorbidities, address sleep problems, and tackle stress. The strategies suggested will be those that have the best evidence base and are predominantly ones that can be deployed by physicians and other health care professionals who do not necessarily have specialized training in behavioral health. A case is presented to illustrate this approach.
Case Presentation
Lisa is a 42-year-old Caucasian woman with a 2-year history of chronic low back pain presenting to a primary care clinic. She reported that the back pain began when she was working as an office manager in a busy dental clinic. The onset was sudden, occurring when she lifted a heavy box of copier paper using a “leaning and twisting motion.” The pain is described as constant (rated as 5 out of 10) and she experiences periods of more intense pain or “flares” (rated as 9 out of 10); Lisa noted that “10 is reserved for childbirth.” The flares seem to coincide with periods of stress and can result in up to 2 days of immobility, causing her to miss work at the dental office.
The pain is described as deep, aching, and throbbing but does not radiate to her legs. It is made worse by sitting still for longer than an hour and gets better if she keeps moving and gets a good night of sleep. Her sleep is generally disturbed as she has trouble falling asleep and when she does sleep, she usually wakes up feeling unrefreshed and extremely irritable. Moreover, while she knows that activity makes her pain better, Lisa can rarely find the energy or motivation to exercise.
Various evaluations by specialists have been obtained and studies conducted, including a recent MRI. All were found to be negative for a clear-cut pathology. A visit to a rheumatologist 5 years ago resulted in a diagnosis of fibromyalgia that Lisa does not accept. Upon probing, she detailed what turns out to be an almost 20-year history of chronic pain. The back pain is only the latest diagnosis in an extensive list of painful conditions including premenstrual syndrome (PMS), headache, temporomandibular joint disorder (TMJ), and fibromyalgia. There are no aspects of her history or presentation that suggest a diagnosis other than chronic musculoskeletal pain.
Lisa is a divorced mother of 2 adolescent children who are generally well-adjusted if not age-appropriately defiant. She is overweight (body mass index = 29) and admits to overeating when under stress. She says that the back pain has disrupted every aspect of her life and work is the only thing that gets adequate attention. Her salary is critical to her family’s financial stability, thus it is a priority. Lisa noted that she saves all of her energy for her job and has “nothing left in the tank” for her children or herself. She notes that, “I have zero joy in my life—I rarely go anywhere fun with my kids anymore, putter in my garden, and forget about going on dates. I can’t remember the last enjoyable thing I did!”
What are aspects to consider in addressing this patient’s symptoms?
Lisa’s case is likely recognizable—she presents with a long history of pain in multiple areas of her body (eg, low back pain, PMS, headache, TMJ) without clear-cut pathology. She has multiple physical and social problems and limited resources. The diagnosis of fibromyalgia is likely correct. The low back pain is probably another manifestation of a broader “centralized pain” condition [5,6]. The term centralized pain refers to the amplification of pain via changes in the central nervous system [7,8]. This does not mean that peripheral nociceptive input (ie, tissue damage or inflammation) plays no role in the pain; however, it implies that any painful stimulus is experienced with greater intensity than would be expected [5,6]. Further, psychological, behavioral, and social elements tend to be key factors in centralized pain states due in part to the exhausting challenge of living with chronic pain, as well as genetic factors that predispose to both pain and mood disturbances [9].
Due to the often complex nature of chronic pain, successful treatment usually requires addressing multiple areas of concern, including addressing behavioral, cognitive, and affective processes. It is suggested that a plan for nonpharmacologic pain management could be built around 6 domains represented by the acronym ExPRESS [10], namely Exercise, Psychological distress, Regaining function, Emotional well-being, Sleep hygiene, and Stress management. This article provides a review of the literature that focuses on systematic reviews and meta-analyses to summarize a massive literature largely supporting the use of nonpharmacologic strategies such as exercise, cognitive-behavioral therapy, mindfulness-based treatments, behavioral self-management, resilience-based interventions, and education to address the ExPRESS [10] domains using Lisa’s case as an example.
How effective is exercise for treating chronic pain and how should it be integrated into treatment?
Exercise
Over the last 5 years, a number of meta-analyses have been conducted to evaluate a robust literature regarding exercise interventions for the treatment of chronic pain [11–14]. The evidence is strong that patients with chronic pain benefit from increased physical activity and in many cases the effect size is quite substantial [14]. Meta-analytic data suggest that aerobic exercise results in significantly less pain and disability [13], improved physical fitness [14], less fatigue and better mood [14]. Exercise can be land-based or water-based [14], be conducted at a slight to moderate intensity and/or even involve only a program of walking [12]. Most established guidelines highlight the benefits of including exercise as part of the nonpharmacologic management of patients with chronic pain [15–18].
Data suggest that chronic pain patients should begin exercise training slowly starting at levels below capacity and increase duration and intensity over time until patients are exercising at low to moderate intensity (ie, 50% to 70% of age-adjusted maximum heart rate) for 20 to 30 minutes per session 2 to 3 times per week [19].
Obesity and deconditioning are common and are thought to contribute to pain sensitivity, poor sleep, and depressed mood [20]. Lisa is overweight and inactive. She injured her back and reports generally avoiding any form of exercise. Getting her moving will be imperative as an increase in physical activity could not only help her to lose weight, but could have the added benefits of decreasing her pain and stiffness, helping her sleep better and improving her mood and self-esteem. Yet, she reports not having the time or motivation.
A reasonable approach would be to not prescribe formal exercise at first but rather encourage small and immediate changes in how she already goes about her day. One concrete step would be to encourage her to stand up and stretch every 20 minutes or so while working at her computer. This is something that she cites as directly contributing to her pain. Next, an increase in physical activity such as adding a few steps every day and doing regular activities with more vigor would be a great initial step.
One of the most formidable barriers to getting patients to exercise is the perception that they must go to the gym and begin a formal program in order to achieve any benefit. As an employed single mother with two children Lisa likely lacks the time and resources for a formal exercise program. She could instead, begin a walking program that starts with reasonable goals (eg, 6000 steps per day) and builds at a slow and steady pace (eg, add 100 steps per day). Activity trackers range in price, but a simple pedometer can be found for under $10. By initiating such a walking program, the things she does already such as chores around the house all count as physical activity. She could do these with more energy and mindfulness and incrementally add activity over time.
Once a new habit of increased physical activity has been established, the strategy of branching out into new physical activities (or even more formal exercise) is usually more successful especially if they are enjoyable and feasible (ie, affordable, not too time consuming). The need to engage in more physical activity could be the impetus to encourage Lisa to do more activities with her children—walking to the park, flying a kite, and exploring the science museum are all activities that can provide physical, emotional and social benefits simultaneously.
What interventions are helpful in addressing psychiatric comorbidity?
Psychological Distress
Comorbidity with mood and anxiety disorders is often observed and complicates treatment in patients with chronic pain states [21–23]. Patients with centralized pain conditions like fibromyalgia tend to have even higher rates of psychiatric comorbidity than those with other pain conditions like arthritis alone [24–26]. While estimates vary widely, we have recently reported that 36.2% of patients evaluated in our tertiary care setting meet case criteria for depression [27]. Such psychiatric comorbidity has been shown to be associated with increased pain, worse functioning, higher costs and increased use of opioids [27–30]. Further, suicidal ideation is common in chronic pain populations, especially those with depression and anxiety, and should be carefully evaluated if suspected [31]. The presence of psychiatric comorbidity takes a toll on the individual and society. One study found that pain patients with comorbid depression utilized twice the resources that other patients without depression utilized [32]. Perhaps the most troubling element is that psychiatric comorbidity is too often not adequately addressed in medical settings [33].
Assessing for depression using a standardized measure like the PHQ-9 [34] or anxiety using the GAD-7 [35] can provide a sense of the severity of the psychiatric symptoms. More severe forms of depression and anxiety may require referral, but more mild depressive and/or anxiety symptoms may be treated by the medical personnel the patient already knows and trusts. Nonpharmacologic strategies that can be used to address depression, anxiety, and even pain in chronic pain populations include cognitive-behavioral therapy, exercise/physical activity, regulating sleep and behavioral activation (ie, getting patients engaged with valued activities, social support).
Perhaps the most effective strategy to address depression, anxiety, and pain in chronic pain populations is cognitive-behavioral therapy (CBT) [36–38]. CBT for pain consists of both cognitive and behavioral therapy interventions. Cognitive therapy proposes that modifying maladaptive thoughts will result in changes in emotions and behavior [39]. Thus, errors in thinking like catastrophizing, overgeneralizing, and minimizing positives are confronted and changed to more realistic and helpful thoughts. This results in less emotional distress and fewer self-defeating behaviors. In cognitive therapy for chronic pain, catastrophic thoughts such as “My pain is terrible and nothing I do helps” are replaced by more adaptive thoughts like “Although my pain is severe, there still are a few things I can do to make it a little better.” Several behavioral techniques are also employed such as behavioral activation (getting patients moving again), activity pacing (not overdoing it on days patients feel good and remaining active on days they feel bad), sleep hygiene (identifying then changing behaviors know to disrupt sleep), and relaxation skills (eg, breathing, imagery, progressive muscle relaxation). Meta-analyses have shown that CBT has empirical support for its effectiveness in treating patients with chronic pain [40,41].
During the visit, Lisa reported a loss of joy in her life and then began crying. Such a report should prompt a more formal exploration of the potential for depression. She would likely benefit from antidepressant medication and behavioral intervention. The physical activity prescribed above will also pertain to treating her depressive symptoms as will strategies to improve her emotional well-being, sleep and stress noted below. Perhaps the most beneficial strategy would be to refer her to CBT for pain and depressive symptoms. CBT for pain would help Lisa acquire the skills required to address many ExPRESS [10] domains including increasing physical activity, improving mood, decreasing stress, and improving sleep.
What strategy can be recommended to help patients regain function?
Regaining Function
Pain is disruptive. Patients with pain may avoid activity due to fear of re-injury or making the pain worse. Pain may keep them awake at night and lead to daytime fatigue. Pain can be so bad that a patient cannot even do simple tasks, One of the most important goals in successfully managing pain is to move away from trying to cure the pain and instead focus on regaining function—helping the patient do some of the things he/she really wants to do despite the pain. The patient may not be able to all the things he/she used to do, but new ways to do many of these activities can be found. Patients can also identify new rewarding activities to do now that things have changed.
To regain function, an evidence-based strategy comes from behavior therapy and is known as graded activation [42–46]. Here the patient is assigned one very small, manageable and incremental step towards achieving a goal. As these small goals are met, the patient feels motivated to engage in more and larger goals.
Lisa specifically mentioned giving up valued activities in light of her chronic pain. To help her re-engage a graded task assignment approach can be taken. For example, Lisa would be encouraged to first identify an activity she would like to get back to doing again. If she were to say “gardening,” then she is to next identify one small, specific, and easily achievable goal for the short term, such as “garden for 20 minutes at least once in the next week.” Help her identify the roadblocks to completing this small goal and brainstorm solutions such as “My kids have soccer and basketball practices 5 days next week so I will ask my ex-husband take them to practice at least one day next week so I can spend time in my garden.” Lisa will be told to schedule time to garden as if it were an appointment with a doctor.
Another important issue to consider is the tendency for inconsistent levels of activities across days that are predicated on how one feels that particular day. On “good days” often patients inadvertently engage in more activity than personal limitations allow and as a consequence experience several “bad days” of pain and other symptom flare up which can result in lost productivity and worse self-esteem. The goal is to have patients engage in a moderate amount of activity every day and avoid activity “binges” or days with little of no activity. Graded activation is a method of pacing that can improve physical functioning while minimizing the likelihood of pain flare-ups.
What simple strategies can be used to improve patients’ emotional well-being?
Emotional Well-Being
Psychological distress and emotional well-being occur along a continuum. Eliminating psychological distress only returns one to a state of being without distress. That is not the same as experiencing emotional well-being or happiness. People with chronic pain who also have higher levels of emotional well-being (or happiness) have decreased pain severity, fewer symptoms, better levels of functioning, and greater life satisfaction [47–49].
Recent studies provide preliminary evidence suggesting that resilience-based interventions such as keeping a gratitude journal or scheduling time to engage in pleasant activities boast equivalence or even superiority to CBT for the treatment of mood with effects that persist over time [50,51]. Two recent meta-analyses have shown that resilience-based interventions have been used to treat healthy individuals and a range of clinical conditions with a mean effect size for improving well-being ranging between 0.34 to 0.61 (ie, moderate-large effects [Cohen’s d]) [52,53]. Positive activities interventions are thought to function by increasing positive affect, which in turn, enables creativity, problem-solving, perspective-taking, and other beneficial states [54]. Such states are conducive to better mood [55,56], behavioral activation/increased physical activity [57–60], better sleep [61–63], increased social support [54,64] and physiological changes (eg, improved vagal tone, lower blood pressure, more adaptive immune responses) [57,65–69]. Recent studies have successfully adapted resilience-based interventions and shown them to be effective for individuals with pain [70–72]. Resilience-based interventions may be particularly helpful for chronic pain patients given that depression and sleep disturbances are frequent comorbidities [5,21–26,28,73,74].
Lisa stated, “I have zero joy in my life…” and later burst into tears. It is easy to surmise that her emotional well-being is quite poor. She also noted that she saves all of her energy for her job and has “nothing left in the tank” for her children or herself. This is a common picture for individuals with chronic pain. Valued life activities like spending quality time with loved ones, going to sporting events or doing a hobby are put aside in favor of obligatory (eg, activities of daily living) and committed (eg, work, school) activities. While this strategy might help one survive, it certainly is not conducive to thriving. To help Lisa improve her emotional well-being, there are good data supporting pleasant activity scheduling amongst other strategies. For pleasant activity scheduling Lisa would be directed to set aside time a few days a week (at least an hour) to do things that she enjoys. This time should be placed on her calendar and treated with the same level of commitment as going to work or to an appointment with her physician.
What nonpharmacologic options are available to help improve patients’ sleep?
Sleep
Lisa indicated that she has trouble falling asleep and then when she does sleep, she usually wakes up feeling unrefreshed and irritable. This is a common complaint amongst individuals with chronic pain who often report difficulty falling asleep, being awakened by pain or discomfort and awakening feeling unrefreshed and unrestored [75]. Sleep, pain and mood form a symptomatic triad such that when one aspect is affected the others are impacted. For example, when Lisa does not sleep well, her pain and mood worsen, as well. Conversely, when her pain is better, she likely sleeps better and wakes up feeling less irritable and experiences less pain.
Behavioral strategies for improving sleep, if used on a regular basis, can help individuals get needed restorative sleep with the additional benefits of improving mood, pain, fatigue, and mental clarity [76]. Some of these behavioral strategies focus on maintaining regular sleep routines (go to bed at the same time every night even on weekends), engaging in sleep conducive behaviors (eg, attempting to sleep only when in feeling sleepy), and avoiding stimulating activities (eg, watching action movies, or consuming nicotine or caffeine). Studies have shown that behavioral strategies targeting sleep appear to have a direct impact on pain symptoms and on functional interference resulting from nonrestorative sleep [77,78].
What stress reduction strategies can be recommended to the patient?
Stress
Stress management has long been a target of treatment in patients with chronic pain. Progressive muscle relaxation (PRM) [79] and autogenic training have typically served as an important foundation of behavioral intervention for chronic pain [80] although there are no randomized controlled trials for PRM as a stand-alone intervention and two separate trials of autogenic training failed to find superiority for this intervention [81,82]. Despite the lack of direct evidence, clinical experience and the knowledge that both relaxation techniques are commonly part of CBT for chronic pain, their efficacy is generally accepted.
An emerging area of nonpharmacologic treatment is mindfulness-based interventions [83], which can include mindfulness-based stress reduction (MBSR) and Acceptance and Commitment Therapy [84], which can be considered a hybrid between mindfulness meditation and CBT. These interventions are still relatively new and larger, better controlled studies are needed. In MBSR, the patient is directed to focus on one thing such as a sound, a pleasant scene or their own breathing. The practitioner is encouraged to keep thoughts present oriented and analytical concerns are to be gently dismissed in favor of focusing on the sounds, scene, or breath. A recent meta-analysis evaluating 15 studies in clinical populations reported that there were small to medium effect sizes for patients with chronic pain [85]. In another new meta-analysis evaluating only studies in chronic pain the authors reported that sleep quality and pain acceptance were the 2 variables with the largest effect sizes based on the 11 studies they evaluated [83]. Similarly, a meta-analysis that included both MBSR and ACT found that 22 studies of varying quality suggest significant but small effect sizes for pain (ES = 0.37) and depression (ES = 0.32) [86]. They concluded the mindfulness-based treatments were not superior to CBT but could be a viable alternative.
For Lisa and many other chronic pain patients, the symptom flares seem to coincide with periods of stress. These flare ups are not inconsequential and have cost her days of lost productivity and potentially put her employment at risk. Moreover, she has identified stress as a trigger for over-eating which certainly contributes to her weight problems and low self-esteem. MBSR can be learned in a structured class or online--many of the principles can be taught by lay instructors.
Summary
While it is likely that health care professionals will continue to rely on pharmacological therapies in treating chronic pain, it is important to be aware that reliance on medications and procedural interventions alone is unlikely to bring adequate relief to individuals living with chronic pain [1]. Optimal pain management appears to be achieved by using a combination of both pharmacologic and nonpharmacologic approaches. Nonpharmacologic interventions that actively engage the patient in pain management such as exercise, behavioral activation, sleep hygiene and stress management are relatively easy to implement and do not necessarily require the expertise of mental health professionals. The challenge is considering pain in its biopsychosocial contexts and defining an approach that is both comprehensive and feasible. Using the ExPRESS domains to help guide care can provide a road map.
Corresponding author: Afton L. Hassett, PsyD, 24 Frank Lloyd Wright Drive, Lobby M, CPFRC, Ann Arbor, MI 48106, [email protected].
1. Institute of Medicine. Relieving pain in America a blueprint for transforming prevention, care, education, and research. In. Washington, DC: National Academy of Sciences; 2011.
2. Latremoliere A, Woolf CJ. Central sensitization: a generator of pain hypersensitivity by central neural plasticity. J Pain 2009;10:895–926.
3. Clauw DJ. Fibromyalgia: a clinical review. JAMA 2014;311:1547–55.
4. National Pain Strategy. A Comprehensive Population Health-Level Strategy for Pain. 2015. Accessed at http://iprcc.nih.gov/docs/DraftHHSNationalPainStrategy.pdf.
5. Brummett CM, Goesling J, Tsodikov A, et al. Prevalence of the fibromyalgia phenotype in spine pain patients presenting to a tertiary care pain clinic and the potential treatment implications. Arthritis Rheum 2013.
6. Williams DA, Clauw DJ. Understanding fibromyalgia: lessons from the broader pain research community. J Pain 2009;10:777-91.
7. Clauw DJ. Fibromyalgia: a clinical review. JAMA 2014;311:1547–55.
8. Woolf CJ. Central sensitization: implications for the diagnosis and treatment of pain. Pain 2011;152:S2–15.
9. Goesling J, Clauw DJ, Hassett AL. Pain and depression: an integrative review of neurobiological and psychological factors. Curr Psychiatry Rep 2013;15:421.
10. Hassett AL, Gevirtz RN. Nonpharmacologic treatment for fibromyalgia: patient education, cognitive-behavioral therapy, relaxation techniques, and complementary and alternative medicine. Rheum Dis Clin North Am 2009;35:393–407.
11. Searle A, Spink M, Ho A, Chuter V. Exercise interventions for the treatment of chronic low back pain: a systematic review and meta-analysis of randomised controlled trials. Clin Rehabil 2015;29:1155–67.
12. O’Connor SR, Tully MA, Ryan B, et al. Walking exercise for chronic musculoskeletal pain: systematic review and meta-analysis. Arch Phys Med Rehabil 2015;96:724-34 e3.
13. Meng XG, Yue SW. Efficacy of aerobic exercise for treatment of chronic low back pain: a meta-analysis. Am J Phys Med Rehabil 2015;94:358–65.
14. Hauser W, Klose P, Langhorst J, et al. Efficacy of different types of aerobic exercise in fibromyalgia syndrome: a systematic review and meta-analysis of randomised controlled trials. Arthritis Res Ther 2010;12:R79.
15. Burckhardt CS, Goldenberg D, Crofford L, et al. Guideline for the management of fibromyalgia syndrome. Pain in adults and children. Glenview, IL: American Pain Society; 2005.
16. Carville SF, Arendt-Nielsen S, Bliddal H, et al. EULAR evidence-based recommendations for the management of fibromyalgia syndrome. Ann Rheum Dis 2008;67:536–41.
17. Chou R, Huffman LH, American Pain Society, American College of Pain Medicine. Nonpharmacologic therapies for acute and chronic low back pain: a review of the evidence for an American Pain Society/American College of Physicians clinical practice guideline. Ann Intern Med 2007;147:492–504.
18. Chou R, Qaseem A, Snow V, , Clinical Efficacy Assessment Subcommittee of the American College of Physicians, American College of Pain Medicine, American Pain Society low back pain guidelines P. Diagnosis and treatment of low back pain: a joint clinical practice guideline from the American College of Physicians and the American Pain Society. Ann Intern Med 2007;147:478–91.
19. Hauser W, Klose P, Langhorst J, et al. Efficacy of different types of aerobic exercise in fibromyalgia syndrome: a systematic review and meta-analysis of randomised controlled trials. Arthritis Res Ther;12:R79.
20. Okifuji A, Donaldson GW, Barck L, Fine PG. Relationship between fibromyalgia and obesity in pain, function, mood and sleep. J Pain 2010.
21. Gore M, Sadosky A, Stacey BR, et al. The burden of chronic low back pain: clinical comorbidities, treatment patterns, and health care costs in usual care settings. Spine 2012;37:E668-77.
22. Von Korff M, Crane P, Lane M, et al. Chronic spinal pain and physical-mental comorbidity in the United States: results from the national comorbidity survey replication. Pain 2005;113:331–9.
23. Reme SE, Tangen T, Moe T, Eriksen HR. Prevalence of psychiatric disorders in sick listed chronic low back pain patients. Eur J Pain 2011;15:1075–80.
24. Arnold LM, Hudson JI, Keck PE, et al. Comorbidity of fibromyalgia and psychiatric disorders. J Clin Psychiatry 2006;67:1219–25.
25. Hassett AL, Radvanski DC, Buyske S, et al. Psychiatric comorbidity and other psychological factors in patients with “chronic Lyme disease”. Am J Med 2009;122:843–50.
26. Epstein SA, Kay G, Clauw D, et al. Psychiatric disorders in patients with fibromyalgia. A multicenter investigation. Psychosomatics 1999;40:57–63.
27. Goesling J, Henry MJ, Moser SE, et al. Symptoms of depression are associated with opioid use regardless of pain severity and physical functioning among treatment-seeking patients with chronic pain. J Pain 2015;16:844–51.
28. Hassett AL, Cone JD, Patella SJ, Sigal LH. The role of catastrophizing in the pain and depression of women with fibromyalgia syndrome. Arthritis Rheum 2000;43:2493–500.
29. Giesecke T, Williams DA, Harris RE, et al. Subgroupings of fibromyalgia patients on the basis of pressure pain thresholds and psychological factors. Arthritis Rheum 2003;48:2916–22.
30. Walen HR, Cronan PA, Bigatti SM. Factors associated with healthcare costs in women with fibromyalgia. Am J Manag Care 2001;7 Spec No:SP39-47.
31. Hassett AL, Aquino JK, Ilgen MA. The risk of suicide mortality in chronic pain patients. Curr Pain Headache Rep 2014;18:436.
32. Robinson RL, Birnbaum HG, Morley MA, et al. Depression and fibromyalgia: treatment and cost when diagnosed separately or concurrently. J Rheumatol 2004;31:1621–9.
33. Fitzcharles MA. In: Canadian Rheumatology Association’s 64th Annual Meeting; 2009.
34. Kroenke K, Spitzer RL, Williams JB. The PHQ-9: validity of a brief depression severity measure. J Gen Intern Med 2001;16:606-13.
35. Spitzer RL, Kroenke K, Williams JB, Lowe B. A brief measure for assessing generalized anxiety disorder: the GAD-7. Arch Intern Med 2006;166:1092–7.
36. Morley S, Eccleston C, Williams A. Systematic review and meta-analysis of randomized controlled trials of cognitive behaviour therapy and behaviour therapy for chronic pain in adults, excluding headache. Pain 1999;80:1–13.
37. Hoffman BM, Papas RK, Chatkoff DK, Kerns RD. Meta-analysis of psychological interventions for chronic low back pain. Health Psychol 2007;26:1–9.
39. Bernardy K, Fuber N, Kollner V, Hauser W. Efficacy of cognitive-behavioral therapies in fibromyalgia syndrome - a systematic review and metaanalysis of randomized controlled trials. J Rheumatol 2010;37:1991–2005.
39. Beck JS. Cognitive therapy: basics and beyond. New York: Guilford Press; 1995.
40. Bernardy K, Füber N, Köllner V, Häuser W. Efficacy of cognitive-behavioral therapies in fibromyalgia syndrome - a systematic review and metaanalysis of randomized controlled trials. J Rheumatol 2010;37:1991–2005.
41. Bernardy K, Klose P, Busch AJ, et al. Cognitive behavioural therapies for fibromyalgia. Cochrane Database Syst Rev 2013;9:CD009796.
42. Nielson WR, Walker C, McCain GA. Cognitive behavioral treatment of fibromyalgia syndrome: preliminary findings. J Rheumatol 1992;19:98–103.
43. Nicassio PM, Radojevic V, Weisman MH, et al. A comparison of behavioral and educational interventions for fibromyalgia. J Rheumatol 1997;24:2000–7.
44. Williams DA, Cary MA, Groner KH, et al. Improving physical functional status in patients with fibromyalgia: a brief cognitive behavioral intervention. J Rheumatol 2002;29:1280–6.
45. Lindstrom I, Ohlund C, Eek C, et al. Mobility, strength, and fitness after a graded activity program for patients with subacute low back pain. A randomized prospective clinical study with a behavioral therapy approach. Spine 1992;17:641–52.
46. Lindstrom I, Ohlund C, Eek C, et al. The effect of graded activity on patients with subacute low back pain: a randomized prospective clinical study with an operant-conditioning behavioral approach. Phys Ther 1992;72:279-90; discussion 91–3.
47. McAllister SJ, Vincent A, Hassett AL, et al. Psychological resilience, affective mechanisms and symptom burden in a tertiary-care sample of patients with fibromyalgia. Stress Health 2015;31:299–305.
48. Toussaint LL, Vincent A, McAllister SJ, et al. A comparison of fibromyalgia symptoms in patients with healthy versus depressive, low and reactive affect balance styles. Scand J Pain 2014;5:161–6.
49. Hassett AL, Simonelli LE, Radvanski DC, et al. The relationship between affect balance style and clinical outcomes in fibromyalgia. Arthritis Rheum 2008;59:833–40.
50. Zamirinejad S, Hojjat SK, Golzari M, et al. Effectiveness of resilience training versus cognitive therapy on reduction of depression in female iranian college students. Issues Ment Health Nurs 2014;35:480–8.
51. Asgharipoor N, Asgharnejad Farid A, Arshadi H, Sahebi A. A comparative study on the effectiveness of positive psychotherapy and group cognitive-behavioral therapy for the patients suffering from major depressive disorder. Iran J Psychiatry Behav Sci 2012;6:33–41.
52. Sin NL, Lyubomirsky S. Enhancing well-being and alleviating depressive symptoms with positive psychology interventions: a practice-friendly meta-analysis. J Clin Psychol 2009;65:467–87.
53. Bolier L, Haverman M, Westerhof GJ, et al. Positive psychology interventions: a meta-analysis of randomized controlled studies. BMC Public Health 2013;13:119.
54. Fredrickson BL. The role of positive emotions in positive psychology. The broaden-and-build theory of positive emotions. Am Psychol 2001;56:218–26.
55. Seligman ME, Steen TA, Park N, Peterson C. Positive psychology progress: empirical validation of interventions. Am Psychol 2005;60:410–21.
56. Seligman ME, Rashid T, Parks AC. Positive psychotherapy. Am Psychol 2006;61:774–88.
57. White DK, Keysor JJ, Neogi T, et al. When it hurts, a positive attitude may help: association of positive affect with daily walking in knee osteoarthritis. Results from a multicenter longitudinal cohort study. Arthritis Care Res (Hoboken) 2012;64:1312–9.
58. Strine TW, Chapman DP, Balluz LS, et al. The associations between life satisfaction and health-related quality of life, chronic illness, and health behaviors among U.S. community-dwelling adults. J Community Health 2008;33:40–50.
59. Grant N, Wardle J, Steptoe A. The relationship between life satisfaction and health behavior: a cross-cultural analysis of young adults. Int J Behav Med 2009;16:259–68.
60. Baruth M, Lee DC, Sui X, et al. Emotional outlook on life predicts increases in physical activity among initially inactive men. Health Educ Behav 2011;38:150–8.
61. Kalmbach DA, Pillai V, Roth T, Drake CL. The interplay between daily affect and sleep: a 2-week study of young women. J Sleep Res 2014;23:636–45.
62. Simor P, Krietsch KN, Koteles F, McCrae CS. Day-to-day variation of subjective sleep quality and emotional states among healthy university students-a 1-week prospective study. Int J Behav Med 2015;22:625–34.
63. von Kanel R, Mausbach BT, Ancoli-Israel S, et al. Positive affect and sleep in spousal Alzheimer caregivers: a longitudinal study. Behav Sleep Med 2014;12:358–72.
64. Cohn MA, Fredrickson BL, Brown SL, et al. Happiness unpacked: positive emotions increase life satisfaction by building resilience. Emotion 2009;9:361–8.
65. Ostir GV, Berges IM, Markides KS, Ottenbacher KJ. Hypertension in older adults and the role of positive emotions. Psychosom Med 2006;68:727–33.
66. Stone AA, Cox DS, Valdimarsdottir H, et al. Evidence that secretory IgA antibody is associated with daily mood. J Pers Soc Psychol 1987;52:988–93.
67. Steptoe A, Wardle J, Marmot M. Positive affect and health-related neuroendocrine, cardiovascular, and inflammatory processes. Proc Natl Acad Sci U S A 2005;102:6508–12.
68. Kok BE, Coffey KA, Cohn MA, et al. How positive emotions build physical health: perceived positive social connections account for the upward spiral between positive emotions and vagal tone. Psychol Sci 2013;24:1123–32.
69. Bhattacharyya MR, Whitehead DL, Rakhit R, Steptoe A. Depressed mood, positive affect, and heart rate variability in patients with suspected coronary artery disease. Psychosom Med 2008;70:1020–7.
70. Hausmann LR, Parks A, Youk AO, Kwoh CK. Reduction of bodily pain in response to an online positive activities intervention. J Pain 2014;15:560–7.
71. Muller R, Gertz KJ, Molton IR, et al. Effects of a tailored positive psychology intervention on well-being and pain in individuals with chronic pain and a physical disability: a feasibility trial. Clin J Pain 2015.
72. Flink IK, Smeets E, Bergbom S, Peters ML. Happy despite pain: Pilot study of a positive pscyhology intervention for patients with chronic pain. Scandinavian Jounral of Pain 2015;7:71–9.
73. Hassett AL, Radvanski DC, Buyske S, et al. Role of psychiatric comorbidity in chronic Lyme disease. Arthritis Rheum 2008;59:1742–9.
74. Choy EH. The role of sleep in pain and fibromyalgia. Nat Rev Rheumatol 2015;11:513–20.
75. Fishbain DA, Cole B, Lewis JE, Gao J. What is the evidence for chronic pain being etiologically associated with the DSM-IV category of sleep disorder due to a general medical condition? A structured evidence-based review. Pain Med 2010;11:158–79.
76. Morin CM, Culbert JP, Schwartz SM. Nonpharmacological interventions for insomnia: A meta-analysis of treatment efficacy Am J Psychiatry 1994;151:1172–80.
77. Affleck G, Urrows S, Tennen H, et al. Sequential daily relations of sleep, pain intensity, and attention to pain among women with fibromyalgia. Pain 1996;68:363–8.
78. Edinger JD, Wohlgemuth WK, Krystal AD, Rice JR. Behavioral insomnia therapy for fibromyalgia patients: a randomized clinical trial. Arch Intern Med 2005;165:2527–35.
79. Jacobson E. Progressive relaxation. Chicago: University of Chicago Press; 1938.
80. van Tulder MW, Koes B, Malmivaara A. Outcome of non-invasive treatment modalities on back pain: an evidence-based review. Eur Spine J 2006;15 Suppl 1:S64–81.
81. Keel PJ, Bodoky C, Gerhard U, Muller W. Comparison of integrated group therapy and group relaxation training for fibromyalgia. Clin J Pain 1998;14:232–8.
82. Rucco V, Feruglio C, Genco F, Mosanghini R. [Autogenic training versus Erickson’s analogical technique in treatment of fibromyalgia syndrome]. Riv Eur Sci Med Farmacol 1995;17:41–50.
83. Bawa FL, Mercer SW, Atherton RJ, et al. Does mindfulness improve outcomes in patients with chronic pain? Systematic review and meta-analysis. Br J Gen Pract 2015;65:e387–400.
84. Ost LG. The efficacy of acceptance and commitment therapy: an updated systematic review and meta-analysis. Behav Res Ther 2014;61:105–21.
85. Crowe M, Jordan J, Burrell B, et al. Mindfulness-based stress reduction for long-term physical conditions: a systematic review. Aust N Z J Psychiatry 2015.
86. Veehof MM, Oskam MJ, Schreurs KM, Bohlmeijer ET. Acceptance-based interventions for the treatment of chronic pain: a systematic review and meta-analysis. Pain 2011;152:533–42.
Clinician Telephone Training to Reduce Family Tobacco Use: Analysis of Transcribed Recordings
From the Massachusetts General Hospital for Children, Boston, MA (Walters, Drehmer, Nabi-Burza, Winickoff), the University of Rochester School of Medicine, Rochester, NY (Ossip), and the American Academy of Pediatrics Julius B. Richmond Center of Excellence, Elk Grove Village, IL (Whitmore, Gorzkowski). †Deceased 31 December 2015.
Abstract
- Background: Family tobacco use and exposure are significant threats to the health of children and their families. However, few pediatric clinicians address family tobacco use and exposure in a routine and effective manner. The Clinical Effort Against Secondhand Smoke Exposure (CEASE) intervention was developed to tackle this gap between clinical need and clinical practice.
- Objective: To review the main considerations and questions that clinicians and office staff expressed during telephone training to participate in CEASE.
- Methods: This study was conducted in pediatric practices in 5 US states. Practices were recruited by the American Academy of Pediatrics (10 intervention, 10 control). Ten training calls were recorded and transcribed. The data was then coded inductively based on themes found in the transcripts.
- Results: The data revealed that clinicians and staff were concerned about prescribing, dosing, and insurance coverage of nicotine replacement therapy; motivation for and methods to help families become tobacco-free; and the impact of the intervention on practice operations.
- Conclusion: While the majority of clinicians and office staff were interested and enthusiastic about helping families become tobacco-free, they expressed concerns that could threaten implementation of family tobacco control strategies.
The devastating health consequences of smoking and exposure to tobacco smoke have been well demonstrated. As declared in the 2006 Surgeon General’s Report, there is no safe level of exposure to tobacco [1]. Children are especially at risk for exposure to toxins and toxicants in tobacco smoke [1,2]. Exposure to tobacco smoke is associated with higher levels of asthma, increased risk of sudden infant death syndrome, increased rates of upper respiratory infections, and behavioral issues [3–5]. Recent research shows that over 70% of children in the United States have some level of exposure to tobacco smoke [6]; parents and other family members are commonly the cause of this exposure, especially in young children. Children and parents benefit when parents stop smoking; parent life expectancy increases by an average of 7 years [7], the risk of tobacco-related poor pregnancy outcomes is reduced, and future children are spared from exposure to tobacco smoke [8].
There is a growing movement to address tobacco use and exposure in the pediatric office setting; the 2015 American Academy of Pediatrics tobacco policy statement Clinical Practice Policy to Protect Children From Tobacco, Nicotine, and Tobacco Smoke recommends that pediatricians ask about children’s exposure to tobacco and address parental tobacco use by implementing office-wide systems to deliver advice, counseling, referral to cessation resources, and smoking cessation medication to smokers [9].
Despite significant risks of tobacco smoke exposure to children, we found in a previous paper that only 3.5% of parents in control practices received any tobacco control assistance [10]. Through a systematic and ongoing line of research, the Clinical Effort Against Secondhand Smoke Exposure (CEASE) intervention was developed to tackle this gap between clinical need and clinical practice. The CEASE intervention has been successfully shown to train and equip pediatric officesfrom a distance to address family tobacco use within existing office systems [10–14]. An enhanced CEASE intervention is undergoing testing in pediatric practices in 5 US states.
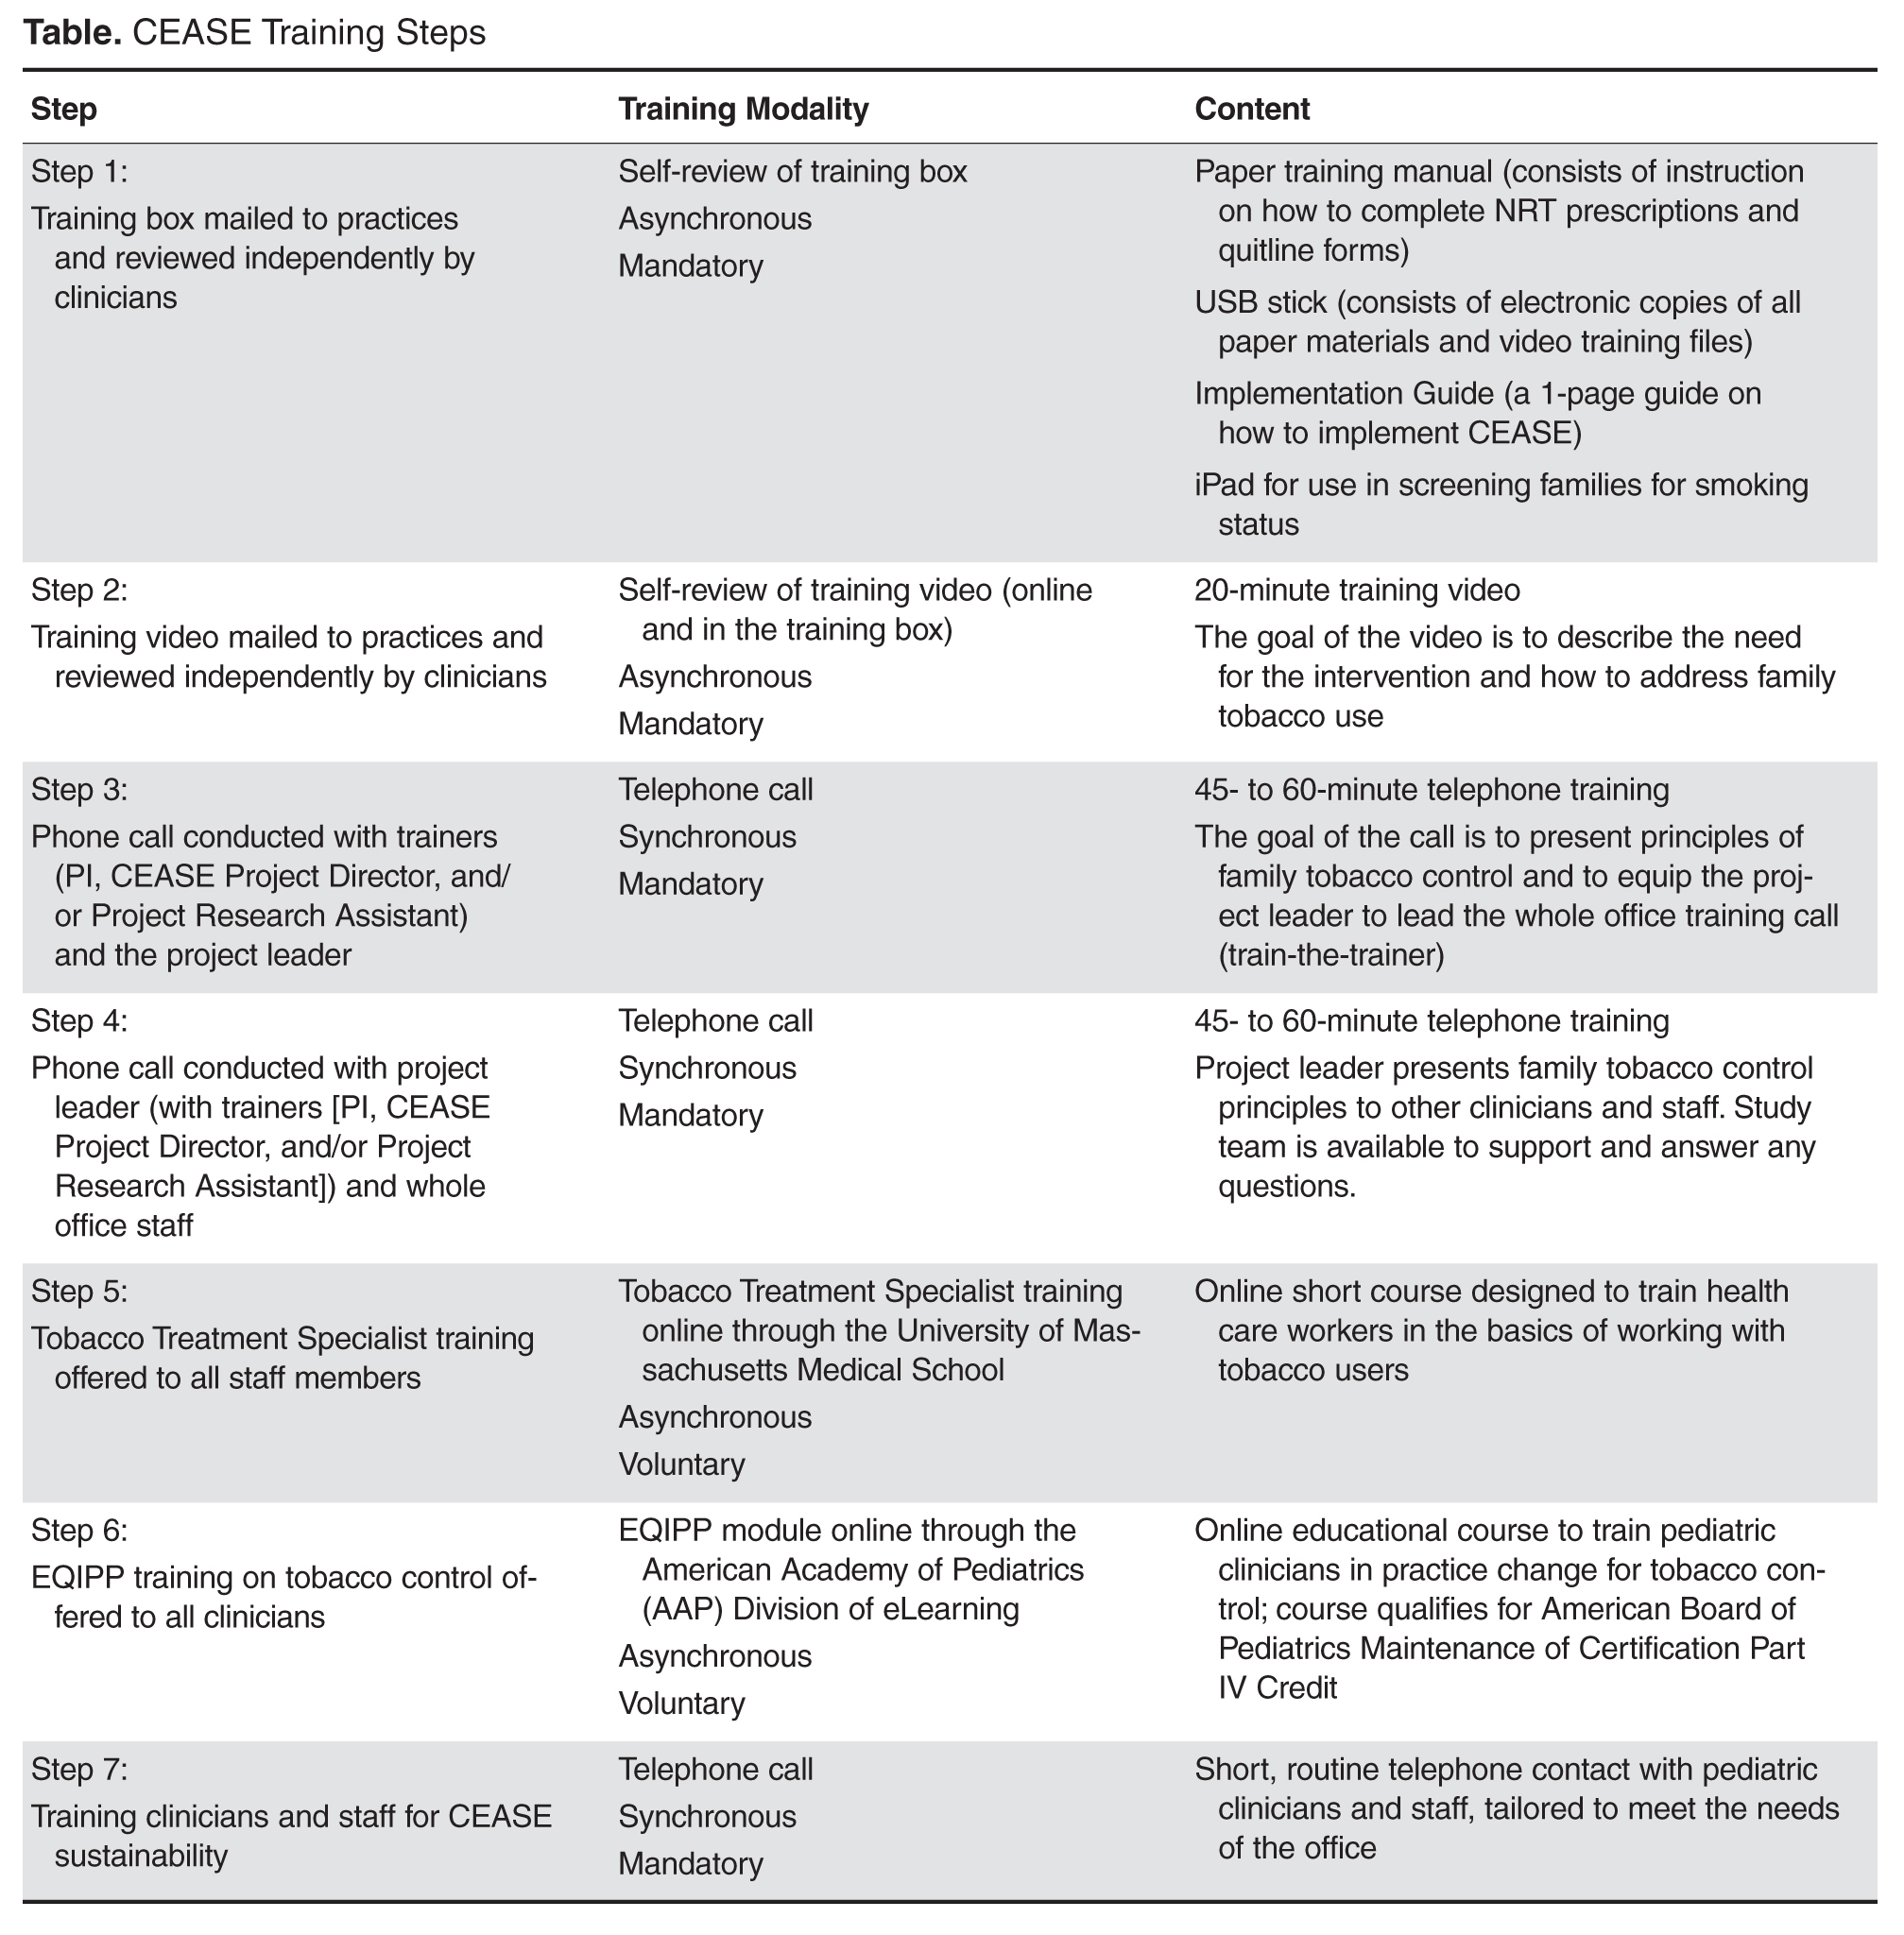
One of the more innovative aspects of CEASE has been the use of training calls. In studies of CEASE, the peer-to-peer call was conducted by the principal investigator with the project leader at the practice using a train-the-trainer model. After the project leader was trained through the peer-to-peer call, the project leader then led the whole office training call, with the support of CEASE staff by phone. The training calls worked in conjunction with the other aspects of the training, as shown in the Table. The training calls for the practices provided a valuable research opportunity. We examined the concerns and issues that clinicians and office staff had about implementing an office-wide tobacco control program through a qualitative analysis of the call transcripts. This paper outlines the main considerations and questions that clinicians and office staff expressed during the training calls. Understanding the points of view of clinicians and staff will help researchers and clinical educators strengthen the design of tobacco control interventions.
Methods
Study Aims
The data for this paper were collected as part of a larger mixed-methods controlled trial. The overarching aims of the trial were to study implementation and sustainability of tobacco-control services delivered at the clinic level, to facilitate behavior change among parents and evaluate cost-per-quit among parents who smoke, and to study systems changes and the processes that affect them at the practice level. The study was conducted in 5 intervention and 5 control pediatric primary care practices in 5 states; this paper reports on data collected in intervention practices and focuses on understanding the systems changes and processes that are instituted when implementing a tobacco control program at the clinician and practice level.
Practice Recruitment and Eligibility
Practices were recruited through the American Academy of Pediatrics using direct emails, newsletter/listserv articles, phone calls to members, and in-person recruitment at national meetings. Eligible practices were located in a non–hospital-based setting, had an average patient flow of at least 50 patients per day, used an electronic medical record (EMR) system, and were matched in each state based on practice size and smoking rate. Interested practices also had to be willing to host a research assistant to collect exit interview data from parents. Practices were excluded if they took part in previous CEASE studies or were actively enrolling participants into other tobacco control research studies. Based on these criteria, 18 eligible practices from Indiana, North Carolina, Ohio, Tennessee, Michigan, and Virginia agreed to participate in the study. Of the 6 states, one state was chosen as a replacement state. Five practices from the remaining states were assigned to the intervention group, 5 to the control group, and 5 were assigned to the replacement group in case an intervention or control practice in their state withdrew from the study. Each intervention practice participated in a peer-to-peer training call and a whole office training call. Data analyzed in this paper was collected from all 10 intervention practice training calls.
Training Calls Data Collection
The peer-to-peer and whole office training calls were recorded and transcribed. Permission to record the calls was requested by the trainer (the principal investigator of the study) and given verbally by each person being trained. The training call recordings were then transcribed verbatim by a commercial service; the transcriptions were spot-checked for accuracy.
The transcripts were first read closely by the first author (BHW), then coded inductively into relevant themes that emerged from the calls. The inductive coding was guided by the questions and concerns that the clinicians raised during the training, as well as the ways in which the trainer addressed these concerns and tailored the training to the needs and interests of the pediatric clinicians [26]. The coding was reviewed and confirmed by the other study team members.
After the data were coded into themes, the coded data were analyzed by the first author using qualitative description. Qualitative description is a method of analyzing coded qualitative data by looking at the words and meanings expressed by respondents [27]. Through this method of analysis, we were able to understand what concerns the clinicians and staff voiced about aspects of the CEASE intervention.
Ethics
The study was approved institutional review boards at Massachusetts General Hospital, the AAP, and the health care practices that required local IRB approval. The quotes used in this paper have been anonymized and cleaned to remove any identifying information, such as location and names.
Peer-to-Peer Training Calls
The peer-to-peer training calls were conducted after training and study materials arrived. The project leader (a pediatrician in the practice who was interested in spearheading the CEASE intervention) was asked to watch the training video. Using an evidence-based, previously developed call script [28], the principal investigator trained the project leader in key aspects of addressing family tobacco use and exposure, such as using an electronic tablet screener survey to identify family members who smoke, exploring techniques for prescribing or recommending NRT, and identifying ways to connect family members to free tobacco cessation counseling and support services. On occasion, other staff from the pediatric office (eg, a nurse or office manager) joined the call.
The principal investigator presented information, clarified points in the video, explained the materials, and asked questions and elicited relevant experiences from the project leader. In addition to teaching the project leader about the tobacco control strategies used in CEASE, the peer-to-peer calls prepared the project leader to train the rest of their own practice clinicians and staff in the CEASE intervention.
Whole Office Training Calls
Each practice’s local project leader led the whole office training calls, but CEASE study staff were on the call to introduce themselves to office staff, answer any questions that staff may have raised that the project leader could not answer, give information about data collection, and to generally support the implementation of the CEASE intervention and research program. During this call, the project leader watched the video with the group and tailored the training for his or her practice, focusing on issues of relevance for patients and staff.
Training Calls as Research Data
As many practices struggle with research burden [29], finding innovative and unobtrusive methods of collecting data is especially useful for research teams and participating practices. During both calls, clinicians and staff were asked open-ended questions to learn about their concerns regarding intervention implementation, share their own experiences with tobacco and tobacco control, and explore practice-specific methods to address family smoking. CEASE staff used this opportunity to help practices tailor the intervention to the local setting, such as by offering quitline enrollment sheets in another language. Clinician and staff answers to open-ended questions provided qualitative data for this manuscript.
Results and Discussion
The research team used training call data to explore clinician and staff concerns and desires related to family-centered tobacco control. The most common themes were: (1) prescribing, dosing, and insurance coverage of NRT, (2) motivation for and methods to help families become tobacco-free, and (3) the impact of the CEASE intervention on the day-to-day operations of the practice.
Nicotine Replacement Therapy
Prescribing or recommending NRT is one of the best ways to help families become tobacco-free and is a crucial component of the CEASE intervention [30–32]. Through the telephone trainings, clinicians and staff were trained to prescribe NRT using pre-printed prescription sheets, presented information about the effectiveness of NRT for smoking cessation, and referred to an information sheet on NRT to answer other questions as needed.
During the calls, it became clear that the pediatric clinicians were interested in prescribing NRT to help smokers quit, but lacked the skills and knowledge to do so:
I’m writing all this down [about NRT], because I don’t know any of this. (IN peer-to-peer)
Is 4 mg the strongest the gum comes in? (NC whole office)
This lack of knowledge may be a barrier to prescribing NRT in the pediatric setting. A national survey revealed that while smoking parents would accept prescriptions for NRT from their child’s doctor, very few received a prescription [33]. The calls provided an opportunity to have clinicians’ questions about NRT be answered by a pediatric tobacco control expert.
Clinicians were interested in helping parents stop smoking with medication, but were worried about access to medication; one of the most common questions voiced was not about how or why to prescribe NRT but how to help low-income parents get NRT for free or low-cost.
Some people—they don’t have insurance, so, how much it costs, they need to know that. (TN peer-to-peer)
I just know I’ve got a bunch ... Obamacare doesn’t work down here, so—I’ve still got families who don’t have any insurance, and you’re like, “Oh, I was hoping you could get something,” and they’re like, “Well, we can’t.” I have a fair number of kids who—are on some type of insurance, but the parents don’t have any coverage for NRT. (VA peer-to-peer)
While NRT is covered under the Affordable Care Act, many states have not expanded their Medicaid coverage [34]; this leaves many low-income families without access to health insurance or to free or low-cost NRT. While NRT remains one of the best and most common smoking cessation tools [35] there was no way to reassure practices that parents would be able to obtain the prescribed NRT without guaranteed coverage. In a previous study, the cost of NRT was seen by smokers as a barrier to using NRT to quit smoking [32]. Clinicians’ concerns about the cost of NRT reveal an understanding of the needs and issues relevant to their patient population.
Motivation for and Methods to Help Families Become Tobacco-Free
Clinicians and office staff were motivated to help families become tobacco-free and were interested in various ways to do so. The motivation and interest were personal, clinical, and organizational, relating to the ways in which care in the pediatric office could be altered to address tobacco in a more systematic way.
Motivation
The interest in smoking cessation stems from the desire to protect children from the harmful effects tobacco smoke and to prevent children themselves from taking up smoking:
We’d always talked about the smoking, and the parents finally quit. Probably not like I helped them—I just had been harping on them—but by that point the boy was smoking. When he was little he was like, “Oh, that’s nasty. I can’t believe my parents smoke.” Then by the time he was 14-15 and the parents actually did manage to quit, he was smoking, and I was like, “Ugh, really?” (VA peer-to-peer)
I totally understand the dire need for this project, in both the tobacco in the households, as well as the teenagers smoking. I heard one stat[istic], that one of our high schools had 80% of children using tobacco products… And that’s on my watch… I understand and I share the same passion that you do, for personal reasons, as well as reasons to help the whole community. (NC peer-to-peer)
Pediatricians saw themselves as responsible for protecting children’s health through reducing their tobacco smoke exposure, for working to prevent teen smoking, and for the overall health of their communities. Helping prevent childhood exposure to tobacco smoke and teen smoking initiation are crucial tasks for pediatricians; the 2015 AAP tobacco policy statement strongly recommends that pediatric offices include tobacco use prevention messages when talking to children and teens to help prevent smoking initiation, as well as helping families establish smoking bans for homes and cars [36]. By participating in the CEASE telephone trainings, clinicians and office staff were learning skills and tools to help them act on their motivation to protect families from the harms of tobacco.
Strategies
Pediatricians and office staff were interested in learning specific strategies and tools to help parents stop smoking. Practices wanted to know how and when to set a quit date with families, how to use services to help families become smoke-free, and how to tailor assistance to specific populations.
Yeah, we’re wondering about other languages, because we do have a large Hispanic patient population and a sizable group of folks that come from Saudi Arabia, and I know that some of them do smoke. (TN peer-to-peer)
Set[ting] a quit date for the patient —so how long we want to set the date? 6 months, 3 months, 1 year, 2 years, what? (TN peer-to-peer)
If you have a mom who lives with grandma and grandpa, the mom may not smoke but grandma and grandpa smoke, but they still live in that home… But anyone who comes in, we’re going to help. Does that sound right? (VA peer-to-peer)
By participating in the study, the clinicians and office staff were actively seeking to improve their knowledge of tobacco-related issues; past research has shown that pediatric residents saw lack of training in tobacco control as a key reason for inconsistent tobacco control outreach and intervention [37]. The training calls were an opportunity to gain information more specifically related to the pediatric practice’s population and office setting, building upon the other CEASE training materials. The training calls were also a chance for the CEASE research team to adapt strategies and tools to the practices, for example by providing materials that met the practices’ needs.
Impact of Intervention on Day-To-Day Operations
The training calls revealed that integrating CEASE into office workflows was a major concern. Integrating preventive services into routine office practice is a frequent concern of primary care providers [38–41]. These concerns about office flow reflect worries about financing [42] and benchmarking [43–45].
I think they’re going to have some of the same questions [that I initially had] in terms of how this might work with workflow. But as we’ve talked through all of this, I think we can make it work, and make it just sort of incorporated as part of our everyday questions that we ask. And it shouldn’t really slow things down. And I think that’ll be the main thing the providers would be focusing on is, how’s this going to impact me and all the other things I have to do in the course of a visit? This [phone call] answers a lot of questions I had in terms of that. (IN peer-to-peer)
As wait time was a performance measure for many of the practices, the clinicians and staff were hesitant to add any activities to check-in that might increase wait time.
I know, so especially, we’re trying to do a care team right now... don’t want them to spend too much time in the waiting room. (OH whole office)
During the calls, clinicians and office staff were asked to reflect on their practices and discuss ways that their practice would implement the CEASE intervention. This moment of reflection is a benefit of research participation, as it allows practices to improve the care they provide [46]. The calls allowed for on-the-spot tailoring of the intervention to meet the specific needs of the practice, an opportunity for the research staff and practice to work together to make the intervention fit their particular office situation and flow. Data collected from the training calls were also reviewed during the CEASE implementation process to support practices with specific concerns.
Strengths and Limitations
As these data were collected during training calls and subject to social desirability bias, the concerns raised may not be an exhaustive list of all concerns that clinicians and office staff had. However, the concerns that were raised by clinicians became a natural and essential part of the training process. As the practices’ initial concerns were identified early in the study, it was possible to address these concerns throughout the early implementation phases of CEASE. Transcribing calls and analyzing training call data as quickly as possible during the training phases of an intervention could prove beneficial for strengthening the implementation.
Dedicating the extra time and effort to record the training calls as a source of data formalized and strengthened the implementation process. By recording training calls, the study team was able to document the practices’ concerns and share them among the research team, including those who were not on training calls. This effort was a significant source of quality improvement data for the research team and helped ensure that we were responsive to the articulated needs of clinicians and practices.
Conclusion
The training call data revealed both the concerns as well as the interests of child health care clinicians in regard to addressing family tobacco use. While the majority of clinicians and office staff were interested and enthusiastic about helping families become tobacco free, they expressed concerns that could threaten full implementation of family tobacco control strategies. These concerns and interests related to the coverage and affordability of NRT, integrating tobacco control strategies into the practice flow, and learning strategies to address family-wide tobacco use, such as helping grandparents quit smoking or addressing tobacco use with those who were not native English speakers. The concerns and interests of clinicians and office staff revealed that they were genuinely interested in learning ways to tailor strategies to address tobacco use for their practices and patient populations. By recording the training calls, the study team was better able to help them tailor the intervention to their practice, both during the calls and during subsequent implementation by providing new materials and additional information on subjects of concern to the practice. Carefully documenting training calls with health care practices are an ideal opportunity to collect information on issues that may impact full implementation of future interventions.
Corresponding author: Jonathan P. Winickoff, [email protected]
1. U.S. Department of Health and Human Services. The health consequences of involuntary tobacco smoke: a report of the Surgeon General. 2006.
2. Rauh VA, Whyatt RM, Garfinkel R, et al. Developmental effects of exposure to environmental tobacco smoke and material hardship among inner-city children. Neurotoxicol Teratol 2004;26:373–85.
3. Polanska K, Hanke W, Ronchetti R, et al. Environmental tobacco smoke exposure and children’s health. Acta Paediatr Suppl 2006;95:86–92.
4. American Academy of Pediatrics, Committee on Substance Abuse. Tobacco’s toll: implications for the pediatrician. Pediatrics 2001;107:794–8.
5. U.S. Department of Health and Human Services. Children and secondhand smoke exposure. Excerpts from the health consequences of involuntary exposure to tobacco smoke: a report of the Surgeon General. Atlanta, GA: US Department of Health and Human Services, Centers for Disease Control and Prevention, Coordinating Center for Health Promotion, National Center for Chronic Disease Prevention and Health Promotion, Office on Smoking and Health. 2007.
6. Wilson KM, Klein JD, Blumkin AK, et al. Tobacco-smoke exposure in children who live in multiunit housing. Pediatrics 2011;127:85–92.
7. Taylor SM, Ross NA, Cummings KM, et al. Community intervention trial for smoking cessation (COMMIT): changes in community attitudes toward cigarette smoking. Health Educ Res 1998;13:109-22.
8. Winickoff JP, Healey EA, Regan S, et al. Using the postpartum hospital stay to address mothers’ and fathers’ smoking: the NEWS study. Pediatrics 2010;125:518–25.
9. American Academy of Pediatrics, Section on Tobacco Control. Policy statement: Clinical practice policy to protect children from tobacco, nicotine, and tobacco smoke. Pediatrics 2015;136:1008–17.
10. Winickoff JP, Nabi-Burza E, Chang Y, et al. Implementation of a parental tobacco control intervention in pediatric practice. Pediatrics 2013;132:109–17.
11. Ossip DJ, Chang Y, Nabi-Burza E, et al. Strict smoke-free home policies among smoking parents in pediatric settings. Acad Pediatr 2013;13:517–23.
12. Winickoff JP, Park ER, Hipple BJ, et al. Clinical effort against secondhand smoke exposure: development of framework and intervention. Pediatrics 2008;122:e363–e75.
13. Nabi-Burza E, Winickoff JP, Finch S, Regan S. Triple tobacco screen: opportunity to help families become smokefree. Am J Prev Med 2013;45:728–31.
14. Winickoff JP. Pediatrician-led program increases provision of smoking cessation support, boosts quit rates among parents. Innovations in Medicine 2011. Accessed 24 Nov 2015 at https://innovations.ahrq.gov/profiles/pediatrician-led-program-increases-provision-smoking-cessation-support-boosts-quit-rates.
15. Fiore MC, Bailey WC, Cohen SJ. Treating tobacco use and dependence. Rockville, MD: US Department of Health and Human Services, Public Health Service; 2000.
16. Winickoff JP, Nabi-Burza E, Chang Y, et al. Sustainability of a parental tobacco control intervention in pediatric practice. Pediatrics 2014;134:933-41.
17. Moore D, Aveyard P, Connock M, et al. Effectiveness and safety of nicotine replacement therapy assisted reduction to stop smoking: systematic review and meta-analysis. BMJ 2009;338:b1024.
18. Aveyard P, Wang D, Connock M, et al. Assessing the outcomes of prolonged cessation-induction and aid-to-cessation trials: floating prolonged abstinence. Nicotine Tob Res 2009;11:475–80.
19. Asfar T, Ebbert JO, Klesges RC, Relyea GE. Do smoking reduction interventions promote cessation in smokers not ready to quit? Addict Behav 2011;36:764–8.
20.Curry SJ, Grothaus LC, McAfee T, Pabiniak C. Use and cost effectiveness of smoking-cessation services under four insurance plans in a health maintenance organization. N Engl J Med 1998;339:673–9.
21. Abroms LC, Ahuja M, Kodl Y, et al. Text2Quit: Results from a pilot test of a personalized, interactive mobile health smoking cessation program. J Health Commun 2012;17 Suppl 1:44-53.
22. Curry SJ, Ludman EJ, Graham E, et al. Pediatric-based smoking cessation intervention for low-income women: a randomized trial. Arch Pediatr Adolesc Med 2003;157:295–302.
23. Orleans CT, Schoenbach VJ, Wagner EH. Self-help quit smoking interventions: effects of self-help materials, social support materials, social support instructions and telephone counseling. J Consult Clin Psychol 1991;59:439–48.
24. An LC, Zhu SH, Nelson DB, et al. Benefits of telephone care over primary care for smoking cessation: a randomized trial. Arch Intern Med 2006;166:536–42.
25. Warner DO, Klesges RC, Dale LC, et al. Clinician-delivered intervention to facilitate tobacco quitline use by surgical patients. Anesthesiology 2011;114:847–55.
26. Creswell, JW. Qualitative inquiry and research design: choosing among five approaches. 2nd ed. Thousand Oaks, CA: Sage; 2007.
27. Sandelowski M. Focus on research methods: whatever happened to qualitative description. Res Nurs Health 2000;23:334–40.
28. Winickoff JP, Hipple B, Drehmer J, et al. The clinical effort against secondhand smoke exposure (CEASE) intervention: A decade of lessons learned. J Clin Outcomes Manag 2012;19:414–9.
29. Clark T, Sinclair R. The costs and benefits of acting as a research site. Evid Policy A J Res Debate Pract 2008;4:105–19.
30. Zhu S, Melcer T, Sun J. Smoking cessation with and without assistance: a population-based analysis. Am J Prev Med 2000;18:305–11.
31. Gilpin EA, Messer K, Pierce JP. Population effectiveness of pharmaceutical aids for smoking cessation: what is associated with increased success? Nicotine Tob Res 2006;8:661–9.
32. Cokkinides VE, Ward E, Jemal A, Thun MJ. Under-use of smoking-cessation treatments: results from the National Health Interview Survey, 2000. Am J Prev Med 2005;28:119–22.
33. Winickoff JP, Tanski SE, McMillen RC, et al. Child health care clinicians’ use of medications to help parents quit smoking: a national parent survey. Pediatrics 2005;115:1013–7.
34. Kaiser Family Foundation. Status of state action on the medicaid expansion decision. Available at http://kff.org/health-reform/state-indicator/state-activity-around-expanding-medicaid-under-the-affordable-care-act/.
35. U.S. Department of Health and Human Services. The health consequences of smoking- 50 years of progress: a report of the Surgeon General. 2014.
36. American Academy of Pediatrics, Section on Tobacco Control. Policy statement: Public policy to protect children from tobacco, nicotine, and tobacco smoke. Pediatrics 2015;136:998–1007.
37. Collins BN, Levin KP, Bryant-Stephens T. Pediatricians’ practices and attitudes about environmental tobacco smoke and parental smoking. J Pediatr 2007;150:547–52.
38. Leininger LS, Finn L, Dickey L, et al. An office system for organizing preventive services: a report by the American Cancer Society Advisory Group on Preventive Health Care Reminder Systems. Arch Fam Med 1996;5:108–15.
39. Swartz SH, Hays JT. Office-based intervention for tobacco dependence. Med Clin North Am 2004;88:1623–41.
40. Bordley WC, Margolis PA, Stuart J, et al. Improving preventive service delivery through office systems. Pediatrics 2001;108:E41.
41. Schoen C, Osborn R, Huynh PT, et al. On the front lines of care: primary care doctors’ office systems, experiences, and views in seven countries. Health Aff (Millwood) 25:w555–w71.
42. Rigotti NA, Quinn VP, Stevens VJ, et al. Tobacco-control policies in 11 leading managed care organizations: progress and challenges. Eff Clin Pract 2002;5:130–6.
43. Curry SJ. Organizational interventions to encourage guideline implementation. Chest 2000;118(2 Suppl):40S–6S.
44. Berg M, Meijerink Y, Gras M, et al. Feasibility first: developing public performance indicators on patient safety and clinical effectiveness for Dutch hospitals. Health Policy 2005;75:59–73.
45. Gandhi TK, Puopolo a L, Dasse P, et al. Obstacles to collaborative quality improvement: the case of ambulatory general medical care. Int J Qual Health Care 2000;12:115–23.
46. Mol A. Proving or improving: on health care research as a form of self-reflection. Qual Health Res 2006;16:405–14.
From the Massachusetts General Hospital for Children, Boston, MA (Walters, Drehmer, Nabi-Burza, Winickoff), the University of Rochester School of Medicine, Rochester, NY (Ossip), and the American Academy of Pediatrics Julius B. Richmond Center of Excellence, Elk Grove Village, IL (Whitmore, Gorzkowski). †Deceased 31 December 2015.
Abstract
- Background: Family tobacco use and exposure are significant threats to the health of children and their families. However, few pediatric clinicians address family tobacco use and exposure in a routine and effective manner. The Clinical Effort Against Secondhand Smoke Exposure (CEASE) intervention was developed to tackle this gap between clinical need and clinical practice.
- Objective: To review the main considerations and questions that clinicians and office staff expressed during telephone training to participate in CEASE.
- Methods: This study was conducted in pediatric practices in 5 US states. Practices were recruited by the American Academy of Pediatrics (10 intervention, 10 control). Ten training calls were recorded and transcribed. The data was then coded inductively based on themes found in the transcripts.
- Results: The data revealed that clinicians and staff were concerned about prescribing, dosing, and insurance coverage of nicotine replacement therapy; motivation for and methods to help families become tobacco-free; and the impact of the intervention on practice operations.
- Conclusion: While the majority of clinicians and office staff were interested and enthusiastic about helping families become tobacco-free, they expressed concerns that could threaten implementation of family tobacco control strategies.
The devastating health consequences of smoking and exposure to tobacco smoke have been well demonstrated. As declared in the 2006 Surgeon General’s Report, there is no safe level of exposure to tobacco [1]. Children are especially at risk for exposure to toxins and toxicants in tobacco smoke [1,2]. Exposure to tobacco smoke is associated with higher levels of asthma, increased risk of sudden infant death syndrome, increased rates of upper respiratory infections, and behavioral issues [3–5]. Recent research shows that over 70% of children in the United States have some level of exposure to tobacco smoke [6]; parents and other family members are commonly the cause of this exposure, especially in young children. Children and parents benefit when parents stop smoking; parent life expectancy increases by an average of 7 years [7], the risk of tobacco-related poor pregnancy outcomes is reduced, and future children are spared from exposure to tobacco smoke [8].
There is a growing movement to address tobacco use and exposure in the pediatric office setting; the 2015 American Academy of Pediatrics tobacco policy statement Clinical Practice Policy to Protect Children From Tobacco, Nicotine, and Tobacco Smoke recommends that pediatricians ask about children’s exposure to tobacco and address parental tobacco use by implementing office-wide systems to deliver advice, counseling, referral to cessation resources, and smoking cessation medication to smokers [9].
Despite significant risks of tobacco smoke exposure to children, we found in a previous paper that only 3.5% of parents in control practices received any tobacco control assistance [10]. Through a systematic and ongoing line of research, the Clinical Effort Against Secondhand Smoke Exposure (CEASE) intervention was developed to tackle this gap between clinical need and clinical practice. The CEASE intervention has been successfully shown to train and equip pediatric officesfrom a distance to address family tobacco use within existing office systems [10–14]. An enhanced CEASE intervention is undergoing testing in pediatric practices in 5 US states.
One of the more innovative aspects of CEASE has been the use of training calls. In studies of CEASE, the peer-to-peer call was conducted by the principal investigator with the project leader at the practice using a train-the-trainer model. After the project leader was trained through the peer-to-peer call, the project leader then led the whole office training call, with the support of CEASE staff by phone. The training calls worked in conjunction with the other aspects of the training, as shown in the Table. The training calls for the practices provided a valuable research opportunity. We examined the concerns and issues that clinicians and office staff had about implementing an office-wide tobacco control program through a qualitative analysis of the call transcripts. This paper outlines the main considerations and questions that clinicians and office staff expressed during the training calls. Understanding the points of view of clinicians and staff will help researchers and clinical educators strengthen the design of tobacco control interventions.
Methods
Study Aims
The data for this paper were collected as part of a larger mixed-methods controlled trial. The overarching aims of the trial were to study implementation and sustainability of tobacco-control services delivered at the clinic level, to facilitate behavior change among parents and evaluate cost-per-quit among parents who smoke, and to study systems changes and the processes that affect them at the practice level. The study was conducted in 5 intervention and 5 control pediatric primary care practices in 5 states; this paper reports on data collected in intervention practices and focuses on understanding the systems changes and processes that are instituted when implementing a tobacco control program at the clinician and practice level.
Practice Recruitment and Eligibility
Practices were recruited through the American Academy of Pediatrics using direct emails, newsletter/listserv articles, phone calls to members, and in-person recruitment at national meetings. Eligible practices were located in a non–hospital-based setting, had an average patient flow of at least 50 patients per day, used an electronic medical record (EMR) system, and were matched in each state based on practice size and smoking rate. Interested practices also had to be willing to host a research assistant to collect exit interview data from parents. Practices were excluded if they took part in previous CEASE studies or were actively enrolling participants into other tobacco control research studies. Based on these criteria, 18 eligible practices from Indiana, North Carolina, Ohio, Tennessee, Michigan, and Virginia agreed to participate in the study. Of the 6 states, one state was chosen as a replacement state. Five practices from the remaining states were assigned to the intervention group, 5 to the control group, and 5 were assigned to the replacement group in case an intervention or control practice in their state withdrew from the study. Each intervention practice participated in a peer-to-peer training call and a whole office training call. Data analyzed in this paper was collected from all 10 intervention practice training calls.
Training Calls Data Collection
The peer-to-peer and whole office training calls were recorded and transcribed. Permission to record the calls was requested by the trainer (the principal investigator of the study) and given verbally by each person being trained. The training call recordings were then transcribed verbatim by a commercial service; the transcriptions were spot-checked for accuracy.
The transcripts were first read closely by the first author (BHW), then coded inductively into relevant themes that emerged from the calls. The inductive coding was guided by the questions and concerns that the clinicians raised during the training, as well as the ways in which the trainer addressed these concerns and tailored the training to the needs and interests of the pediatric clinicians [26]. The coding was reviewed and confirmed by the other study team members.
After the data were coded into themes, the coded data were analyzed by the first author using qualitative description. Qualitative description is a method of analyzing coded qualitative data by looking at the words and meanings expressed by respondents [27]. Through this method of analysis, we were able to understand what concerns the clinicians and staff voiced about aspects of the CEASE intervention.
Ethics
The study was approved institutional review boards at Massachusetts General Hospital, the AAP, and the health care practices that required local IRB approval. The quotes used in this paper have been anonymized and cleaned to remove any identifying information, such as location and names.
Peer-to-Peer Training Calls
The peer-to-peer training calls were conducted after training and study materials arrived. The project leader (a pediatrician in the practice who was interested in spearheading the CEASE intervention) was asked to watch the training video. Using an evidence-based, previously developed call script [28], the principal investigator trained the project leader in key aspects of addressing family tobacco use and exposure, such as using an electronic tablet screener survey to identify family members who smoke, exploring techniques for prescribing or recommending NRT, and identifying ways to connect family members to free tobacco cessation counseling and support services. On occasion, other staff from the pediatric office (eg, a nurse or office manager) joined the call.
The principal investigator presented information, clarified points in the video, explained the materials, and asked questions and elicited relevant experiences from the project leader. In addition to teaching the project leader about the tobacco control strategies used in CEASE, the peer-to-peer calls prepared the project leader to train the rest of their own practice clinicians and staff in the CEASE intervention.
Whole Office Training Calls
Each practice’s local project leader led the whole office training calls, but CEASE study staff were on the call to introduce themselves to office staff, answer any questions that staff may have raised that the project leader could not answer, give information about data collection, and to generally support the implementation of the CEASE intervention and research program. During this call, the project leader watched the video with the group and tailored the training for his or her practice, focusing on issues of relevance for patients and staff.
Training Calls as Research Data
As many practices struggle with research burden [29], finding innovative and unobtrusive methods of collecting data is especially useful for research teams and participating practices. During both calls, clinicians and staff were asked open-ended questions to learn about their concerns regarding intervention implementation, share their own experiences with tobacco and tobacco control, and explore practice-specific methods to address family smoking. CEASE staff used this opportunity to help practices tailor the intervention to the local setting, such as by offering quitline enrollment sheets in another language. Clinician and staff answers to open-ended questions provided qualitative data for this manuscript.
Results and Discussion
The research team used training call data to explore clinician and staff concerns and desires related to family-centered tobacco control. The most common themes were: (1) prescribing, dosing, and insurance coverage of NRT, (2) motivation for and methods to help families become tobacco-free, and (3) the impact of the CEASE intervention on the day-to-day operations of the practice.
Nicotine Replacement Therapy
Prescribing or recommending NRT is one of the best ways to help families become tobacco-free and is a crucial component of the CEASE intervention [30–32]. Through the telephone trainings, clinicians and staff were trained to prescribe NRT using pre-printed prescription sheets, presented information about the effectiveness of NRT for smoking cessation, and referred to an information sheet on NRT to answer other questions as needed.
During the calls, it became clear that the pediatric clinicians were interested in prescribing NRT to help smokers quit, but lacked the skills and knowledge to do so:
I’m writing all this down [about NRT], because I don’t know any of this. (IN peer-to-peer)
Is 4 mg the strongest the gum comes in? (NC whole office)
This lack of knowledge may be a barrier to prescribing NRT in the pediatric setting. A national survey revealed that while smoking parents would accept prescriptions for NRT from their child’s doctor, very few received a prescription [33]. The calls provided an opportunity to have clinicians’ questions about NRT be answered by a pediatric tobacco control expert.
Clinicians were interested in helping parents stop smoking with medication, but were worried about access to medication; one of the most common questions voiced was not about how or why to prescribe NRT but how to help low-income parents get NRT for free or low-cost.
Some people—they don’t have insurance, so, how much it costs, they need to know that. (TN peer-to-peer)
I just know I’ve got a bunch ... Obamacare doesn’t work down here, so—I’ve still got families who don’t have any insurance, and you’re like, “Oh, I was hoping you could get something,” and they’re like, “Well, we can’t.” I have a fair number of kids who—are on some type of insurance, but the parents don’t have any coverage for NRT. (VA peer-to-peer)
While NRT is covered under the Affordable Care Act, many states have not expanded their Medicaid coverage [34]; this leaves many low-income families without access to health insurance or to free or low-cost NRT. While NRT remains one of the best and most common smoking cessation tools [35] there was no way to reassure practices that parents would be able to obtain the prescribed NRT without guaranteed coverage. In a previous study, the cost of NRT was seen by smokers as a barrier to using NRT to quit smoking [32]. Clinicians’ concerns about the cost of NRT reveal an understanding of the needs and issues relevant to their patient population.
Motivation for and Methods to Help Families Become Tobacco-Free
Clinicians and office staff were motivated to help families become tobacco-free and were interested in various ways to do so. The motivation and interest were personal, clinical, and organizational, relating to the ways in which care in the pediatric office could be altered to address tobacco in a more systematic way.
Motivation
The interest in smoking cessation stems from the desire to protect children from the harmful effects tobacco smoke and to prevent children themselves from taking up smoking:
We’d always talked about the smoking, and the parents finally quit. Probably not like I helped them—I just had been harping on them—but by that point the boy was smoking. When he was little he was like, “Oh, that’s nasty. I can’t believe my parents smoke.” Then by the time he was 14-15 and the parents actually did manage to quit, he was smoking, and I was like, “Ugh, really?” (VA peer-to-peer)
I totally understand the dire need for this project, in both the tobacco in the households, as well as the teenagers smoking. I heard one stat[istic], that one of our high schools had 80% of children using tobacco products… And that’s on my watch… I understand and I share the same passion that you do, for personal reasons, as well as reasons to help the whole community. (NC peer-to-peer)
Pediatricians saw themselves as responsible for protecting children’s health through reducing their tobacco smoke exposure, for working to prevent teen smoking, and for the overall health of their communities. Helping prevent childhood exposure to tobacco smoke and teen smoking initiation are crucial tasks for pediatricians; the 2015 AAP tobacco policy statement strongly recommends that pediatric offices include tobacco use prevention messages when talking to children and teens to help prevent smoking initiation, as well as helping families establish smoking bans for homes and cars [36]. By participating in the CEASE telephone trainings, clinicians and office staff were learning skills and tools to help them act on their motivation to protect families from the harms of tobacco.
Strategies
Pediatricians and office staff were interested in learning specific strategies and tools to help parents stop smoking. Practices wanted to know how and when to set a quit date with families, how to use services to help families become smoke-free, and how to tailor assistance to specific populations.
Yeah, we’re wondering about other languages, because we do have a large Hispanic patient population and a sizable group of folks that come from Saudi Arabia, and I know that some of them do smoke. (TN peer-to-peer)
Set[ting] a quit date for the patient —so how long we want to set the date? 6 months, 3 months, 1 year, 2 years, what? (TN peer-to-peer)
If you have a mom who lives with grandma and grandpa, the mom may not smoke but grandma and grandpa smoke, but they still live in that home… But anyone who comes in, we’re going to help. Does that sound right? (VA peer-to-peer)
By participating in the study, the clinicians and office staff were actively seeking to improve their knowledge of tobacco-related issues; past research has shown that pediatric residents saw lack of training in tobacco control as a key reason for inconsistent tobacco control outreach and intervention [37]. The training calls were an opportunity to gain information more specifically related to the pediatric practice’s population and office setting, building upon the other CEASE training materials. The training calls were also a chance for the CEASE research team to adapt strategies and tools to the practices, for example by providing materials that met the practices’ needs.
Impact of Intervention on Day-To-Day Operations
The training calls revealed that integrating CEASE into office workflows was a major concern. Integrating preventive services into routine office practice is a frequent concern of primary care providers [38–41]. These concerns about office flow reflect worries about financing [42] and benchmarking [43–45].
I think they’re going to have some of the same questions [that I initially had] in terms of how this might work with workflow. But as we’ve talked through all of this, I think we can make it work, and make it just sort of incorporated as part of our everyday questions that we ask. And it shouldn’t really slow things down. And I think that’ll be the main thing the providers would be focusing on is, how’s this going to impact me and all the other things I have to do in the course of a visit? This [phone call] answers a lot of questions I had in terms of that. (IN peer-to-peer)
As wait time was a performance measure for many of the practices, the clinicians and staff were hesitant to add any activities to check-in that might increase wait time.
I know, so especially, we’re trying to do a care team right now... don’t want them to spend too much time in the waiting room. (OH whole office)
During the calls, clinicians and office staff were asked to reflect on their practices and discuss ways that their practice would implement the CEASE intervention. This moment of reflection is a benefit of research participation, as it allows practices to improve the care they provide [46]. The calls allowed for on-the-spot tailoring of the intervention to meet the specific needs of the practice, an opportunity for the research staff and practice to work together to make the intervention fit their particular office situation and flow. Data collected from the training calls were also reviewed during the CEASE implementation process to support practices with specific concerns.
Strengths and Limitations
As these data were collected during training calls and subject to social desirability bias, the concerns raised may not be an exhaustive list of all concerns that clinicians and office staff had. However, the concerns that were raised by clinicians became a natural and essential part of the training process. As the practices’ initial concerns were identified early in the study, it was possible to address these concerns throughout the early implementation phases of CEASE. Transcribing calls and analyzing training call data as quickly as possible during the training phases of an intervention could prove beneficial for strengthening the implementation.
Dedicating the extra time and effort to record the training calls as a source of data formalized and strengthened the implementation process. By recording training calls, the study team was able to document the practices’ concerns and share them among the research team, including those who were not on training calls. This effort was a significant source of quality improvement data for the research team and helped ensure that we were responsive to the articulated needs of clinicians and practices.
Conclusion
The training call data revealed both the concerns as well as the interests of child health care clinicians in regard to addressing family tobacco use. While the majority of clinicians and office staff were interested and enthusiastic about helping families become tobacco free, they expressed concerns that could threaten full implementation of family tobacco control strategies. These concerns and interests related to the coverage and affordability of NRT, integrating tobacco control strategies into the practice flow, and learning strategies to address family-wide tobacco use, such as helping grandparents quit smoking or addressing tobacco use with those who were not native English speakers. The concerns and interests of clinicians and office staff revealed that they were genuinely interested in learning ways to tailor strategies to address tobacco use for their practices and patient populations. By recording the training calls, the study team was better able to help them tailor the intervention to their practice, both during the calls and during subsequent implementation by providing new materials and additional information on subjects of concern to the practice. Carefully documenting training calls with health care practices are an ideal opportunity to collect information on issues that may impact full implementation of future interventions.
Corresponding author: Jonathan P. Winickoff, [email protected]
1. U.S. Department of Health and Human Services. The health consequences of involuntary tobacco smoke: a report of the Surgeon General. 2006.
2. Rauh VA, Whyatt RM, Garfinkel R, et al. Developmental effects of exposure to environmental tobacco smoke and material hardship among inner-city children. Neurotoxicol Teratol 2004;26:373–85.
3. Polanska K, Hanke W, Ronchetti R, et al. Environmental tobacco smoke exposure and children’s health. Acta Paediatr Suppl 2006;95:86–92.
4. American Academy of Pediatrics, Committee on Substance Abuse. Tobacco’s toll: implications for the pediatrician. Pediatrics 2001;107:794–8.
5. U.S. Department of Health and Human Services. Children and secondhand smoke exposure. Excerpts from the health consequences of involuntary exposure to tobacco smoke: a report of the Surgeon General. Atlanta, GA: US Department of Health and Human Services, Centers for Disease Control and Prevention, Coordinating Center for Health Promotion, National Center for Chronic Disease Prevention and Health Promotion, Office on Smoking and Health. 2007.
6. Wilson KM, Klein JD, Blumkin AK, et al. Tobacco-smoke exposure in children who live in multiunit housing. Pediatrics 2011;127:85–92.
7. Taylor SM, Ross NA, Cummings KM, et al. Community intervention trial for smoking cessation (COMMIT): changes in community attitudes toward cigarette smoking. Health Educ Res 1998;13:109-22.
8. Winickoff JP, Healey EA, Regan S, et al. Using the postpartum hospital stay to address mothers’ and fathers’ smoking: the NEWS study. Pediatrics 2010;125:518–25.
9. American Academy of Pediatrics, Section on Tobacco Control. Policy statement: Clinical practice policy to protect children from tobacco, nicotine, and tobacco smoke. Pediatrics 2015;136:1008–17.
10. Winickoff JP, Nabi-Burza E, Chang Y, et al. Implementation of a parental tobacco control intervention in pediatric practice. Pediatrics 2013;132:109–17.
11. Ossip DJ, Chang Y, Nabi-Burza E, et al. Strict smoke-free home policies among smoking parents in pediatric settings. Acad Pediatr 2013;13:517–23.
12. Winickoff JP, Park ER, Hipple BJ, et al. Clinical effort against secondhand smoke exposure: development of framework and intervention. Pediatrics 2008;122:e363–e75.
13. Nabi-Burza E, Winickoff JP, Finch S, Regan S. Triple tobacco screen: opportunity to help families become smokefree. Am J Prev Med 2013;45:728–31.
14. Winickoff JP. Pediatrician-led program increases provision of smoking cessation support, boosts quit rates among parents. Innovations in Medicine 2011. Accessed 24 Nov 2015 at https://innovations.ahrq.gov/profiles/pediatrician-led-program-increases-provision-smoking-cessation-support-boosts-quit-rates.
15. Fiore MC, Bailey WC, Cohen SJ. Treating tobacco use and dependence. Rockville, MD: US Department of Health and Human Services, Public Health Service; 2000.
16. Winickoff JP, Nabi-Burza E, Chang Y, et al. Sustainability of a parental tobacco control intervention in pediatric practice. Pediatrics 2014;134:933-41.
17. Moore D, Aveyard P, Connock M, et al. Effectiveness and safety of nicotine replacement therapy assisted reduction to stop smoking: systematic review and meta-analysis. BMJ 2009;338:b1024.
18. Aveyard P, Wang D, Connock M, et al. Assessing the outcomes of prolonged cessation-induction and aid-to-cessation trials: floating prolonged abstinence. Nicotine Tob Res 2009;11:475–80.
19. Asfar T, Ebbert JO, Klesges RC, Relyea GE. Do smoking reduction interventions promote cessation in smokers not ready to quit? Addict Behav 2011;36:764–8.
20.Curry SJ, Grothaus LC, McAfee T, Pabiniak C. Use and cost effectiveness of smoking-cessation services under four insurance plans in a health maintenance organization. N Engl J Med 1998;339:673–9.
21. Abroms LC, Ahuja M, Kodl Y, et al. Text2Quit: Results from a pilot test of a personalized, interactive mobile health smoking cessation program. J Health Commun 2012;17 Suppl 1:44-53.
22. Curry SJ, Ludman EJ, Graham E, et al. Pediatric-based smoking cessation intervention for low-income women: a randomized trial. Arch Pediatr Adolesc Med 2003;157:295–302.
23. Orleans CT, Schoenbach VJ, Wagner EH. Self-help quit smoking interventions: effects of self-help materials, social support materials, social support instructions and telephone counseling. J Consult Clin Psychol 1991;59:439–48.
24. An LC, Zhu SH, Nelson DB, et al. Benefits of telephone care over primary care for smoking cessation: a randomized trial. Arch Intern Med 2006;166:536–42.
25. Warner DO, Klesges RC, Dale LC, et al. Clinician-delivered intervention to facilitate tobacco quitline use by surgical patients. Anesthesiology 2011;114:847–55.
26. Creswell, JW. Qualitative inquiry and research design: choosing among five approaches. 2nd ed. Thousand Oaks, CA: Sage; 2007.
27. Sandelowski M. Focus on research methods: whatever happened to qualitative description. Res Nurs Health 2000;23:334–40.
28. Winickoff JP, Hipple B, Drehmer J, et al. The clinical effort against secondhand smoke exposure (CEASE) intervention: A decade of lessons learned. J Clin Outcomes Manag 2012;19:414–9.
29. Clark T, Sinclair R. The costs and benefits of acting as a research site. Evid Policy A J Res Debate Pract 2008;4:105–19.
30. Zhu S, Melcer T, Sun J. Smoking cessation with and without assistance: a population-based analysis. Am J Prev Med 2000;18:305–11.
31. Gilpin EA, Messer K, Pierce JP. Population effectiveness of pharmaceutical aids for smoking cessation: what is associated with increased success? Nicotine Tob Res 2006;8:661–9.
32. Cokkinides VE, Ward E, Jemal A, Thun MJ. Under-use of smoking-cessation treatments: results from the National Health Interview Survey, 2000. Am J Prev Med 2005;28:119–22.
33. Winickoff JP, Tanski SE, McMillen RC, et al. Child health care clinicians’ use of medications to help parents quit smoking: a national parent survey. Pediatrics 2005;115:1013–7.
34. Kaiser Family Foundation. Status of state action on the medicaid expansion decision. Available at http://kff.org/health-reform/state-indicator/state-activity-around-expanding-medicaid-under-the-affordable-care-act/.
35. U.S. Department of Health and Human Services. The health consequences of smoking- 50 years of progress: a report of the Surgeon General. 2014.
36. American Academy of Pediatrics, Section on Tobacco Control. Policy statement: Public policy to protect children from tobacco, nicotine, and tobacco smoke. Pediatrics 2015;136:998–1007.
37. Collins BN, Levin KP, Bryant-Stephens T. Pediatricians’ practices and attitudes about environmental tobacco smoke and parental smoking. J Pediatr 2007;150:547–52.
38. Leininger LS, Finn L, Dickey L, et al. An office system for organizing preventive services: a report by the American Cancer Society Advisory Group on Preventive Health Care Reminder Systems. Arch Fam Med 1996;5:108–15.
39. Swartz SH, Hays JT. Office-based intervention for tobacco dependence. Med Clin North Am 2004;88:1623–41.
40. Bordley WC, Margolis PA, Stuart J, et al. Improving preventive service delivery through office systems. Pediatrics 2001;108:E41.
41. Schoen C, Osborn R, Huynh PT, et al. On the front lines of care: primary care doctors’ office systems, experiences, and views in seven countries. Health Aff (Millwood) 25:w555–w71.
42. Rigotti NA, Quinn VP, Stevens VJ, et al. Tobacco-control policies in 11 leading managed care organizations: progress and challenges. Eff Clin Pract 2002;5:130–6.
43. Curry SJ. Organizational interventions to encourage guideline implementation. Chest 2000;118(2 Suppl):40S–6S.
44. Berg M, Meijerink Y, Gras M, et al. Feasibility first: developing public performance indicators on patient safety and clinical effectiveness for Dutch hospitals. Health Policy 2005;75:59–73.
45. Gandhi TK, Puopolo a L, Dasse P, et al. Obstacles to collaborative quality improvement: the case of ambulatory general medical care. Int J Qual Health Care 2000;12:115–23.
46. Mol A. Proving or improving: on health care research as a form of self-reflection. Qual Health Res 2006;16:405–14.