User login
Biosimilar infliximab gains FDA Advisory Committee endorsement
A biosimilar agent to Remicade, the brand-name and reference form of infliximab, stayed on track to become the second biosimilar drug to enter the U.S. market when the Arthritis Advisory Committee of the Food and Drug Administration voted overwhelmingly in favor of licensure of the biosimilar at a meeting on Feb. 9.
The vote was 21 in favor and 3 against, with no abstentions.
Because of the way the FDA staff worded the question that the Advisory Committee voted on, the panel not only was in favor of approving biosimilar licensure but also recommended that license for six of the seven diverse indications that Remicade currently has: treatment of rheumatoid arthritis, ankylosing spondylitis, psoriatic arthritis, plaque psoriasis, adult and pediatric Crohn’s disease, and adult ulcerative colitis. The panel did not vote on licensing the biosimilar for treatment of pediatric ulcerative colitis because that specific indication for Remicade remains on patent for a few more years.
The broad range of indications for which the Committee recommended approval was notable because the formulation of biosimilar infliximab under review, manufactured by Celltrion and known in the United States as CT-P13, had been clinically studied only in patients with rheumatoid arthritis or ankylosing spondylitis. The other four recommended indications represented extrapolations, based on the totality of biosimilar evidence presented at the meeting by both Celltrion staffers and consultants as well as analyses presented by FDA staff members.
The overall thrust of the extrapolation issue was that if biosimilarity to Remicade was proven by a range of preclinical and clinical testing, and if safety and efficacy similar to Remicade was shown in trials that enrolled only patients with rheumatoid arthritis or ankylosing spondylitis, then the safety and efficacy previously proven for Remicade for the other indications could be reasonably extrapolated to apply to CT-P13 also, even though CT-P13 was never tested on patients with those conditions. This turned out to often be the key issue that panel members grappled with as they decided whether to vote in favor of the question the FDA asked them to address.
“Many of us are uncomfortable with this new pathway” of extrapolation, said panel member Dr. Beth L. Jonas, a rheumatologist at the University of North Carolina at Chapel Hill.
“I feel we’re taking a risk” with the extrapolations, said Dr. Mary E. Maloney, professor of medicine and chief of dermatology at the University of Massachusetts in Worcester. “We have a responsibility to take a risk to provide biosimilars to patients and to reduce their cost” for needed treatments, she said during the Committee’s discussion of their votes.
“Biosimilar is a new concept, but it’s the future of how we will look at drugs,” explained panel member Dr. Wilma Bergfeld, professor of dermatology at the Cleveland Clinic.
CT-P13 is currently marketed in many other countries worldwide under the brand names Remsima or Inflectra.
The FDA’s staff was clearly behind this application. After summarizing the agency’s internal analysis of the data submitted by Celltrion, Dr. Nikolay Nikolov, clinical team leader for the FDA’s Division of Pulmonary, Allergy and Rheumatology Products, concluded that “the totality of evidence provided by the applicant supports a conclusion that CT-P13 is biosimilar to U.S.-licensed Remicade,” and that “scientific justification for extrapolating the clinical data supports a finding of biosimilarity for all indications for which U.S.-licensed Remicade is licensed.” The FDA’s position makes it seem very likely that the agency will accept the Advisory Committee’s vote and grant CT-P13 license for U.S. marketing in the near future.
CT-P13 also received support during the public comment period of the Committee’s deliberations. At that time, Dr. Gideon P. Smith, a dermatologist at Massachusetts General Hospital in Boston spoke on behalf of the American Academy of Dermatology Association. “Biologics are some of the most important recent developments in treating plaque psoriasis, but cost is an important issue. We hope that biosimilars will decrease the cost of this treatment,” Dr. Smith said. “Infliximab is a complex molecule with a complex production process. We are concerned about the safety and efficacy of treatment. The AADA supports approval based on reducing cost and improving patient access. However, we strongly recommend caution through long-term postmarketing surveillance and using registry data to identify issues of immunogenicity, efficacy, and safety that were not seen in the clinical trials.”
The drug also received support from Dr. Angus B. Worthing, who represented the American College of Rheumatology. “Biosimilars may be the only tool to keep prices of biologics within reason,” said Dr. Worthing, a rheumatologist in Washington. But he also stressed that “extrapolation should be done with caution and not routinely granted.”
CT-P13 has the potential to make a fairly widely used biologic significantly more affordable. In countries where it has come onto the market, it’s been priced at roughly 30% below the prevailing cost of Remicade prior to this competition.
“Infliximab is an extremely important tool in our armamentarium for treatment of both ulcerative colitis and Crohn’s disease,” commented Dr. Stephen B. Hanauer, professor of gastroenterology and hepatology at Northwestern University in Chicago. “Biologic therapies account for an increasing proportion of health care costs for chronic diseases such as inflammatory bowel disease and reducing these costs will be important as increasing numbers of patients are benefiting from long-term biologic therapies. Having reviewed the extensive preclinical and clinical data with CT-P13, I am comfortable with potential substitution or switching as long as physicians are aware of the change and can track any potential reactions to the administered product,” he said in an interview.
“Infliximab is currently used by U.S. rheumatologists to treat certain patients with rheumatoid arthritis, ankylosing spondylitis, and psoriatic arthritis. It is not the most-widely used tumor necrosis factor inhibitor, which is adalimumab, but it is often used. After FDA approval, biosimilar infliximab is anticipated to be priced lower than Remicade and that would likely increase use of infliximab for rheumatologic conditions,” said Dr. Jonathan Kay, a rheumatologist and professor of medicine at the University of Massachusetts in Worcester. “The clinical experience with CT-P13 in trials and in routine use in other countries show no significant loss of efficacy or any other major problem when changing patients from Remicade to CT-P13. All the data suggest that CT-P13 is highly similar to the reference product. It’s almost akin to comparing one lot of Remicade to another lot of Remicade. I personally would not have a problem initiating a patient on CT-P13 if infliximab was the appropriate drug to use,” Dr. Kay said in an interview.
Dr. Hanauer has been a consultant to Celltrion. Dr. Kay has been a consultant to several drug companies.
On Twitter @mitchelzoler
A Case of Bloom Syndrome With Uncommon Clinical Manifestations Confirmed on Genetic Testing
Bloom syndrome, also called congenital telangiectatic erythema and stunted growth, was first described by David Bloom in 1954.1 It is a rare autosomal-recessive disorder (Online Mendelian Inheritance in Man 210900) characterized by specific clinical manifestations including photosensitivity, telangiectatic facial erythema, proportionate growth deficiency, hypogonadism, immunodeficiency, and a tendency to develop various malignancies.2 Linkage analysis revealed that the Bloom syndrome gene locus resides on chromosome arm 15q26.1,3 and the BLM gene in this region has been identified as being responsible for the development of Bloom syndrome.4,5 We report the case of a 12-year-old Chinese girl with Bloom syndrome and detected BLM gene. The evaluation was approved by the Institutional Ethical Review Boards of Institute of Dermatology, Chinese Academy of Medical Sciences and Peking Union Medical College (Beijing, China).
Case Report
We evaluated a Bloom syndrome family, which consisted of the patient and her parents. The patient was a 12-year-old Chinese girl who was apparently healthy until 3 months of age when her parents noticed an erythematous eruption with blisters on the face. Exacerbation after exposure to sunlight is usual, which results in the eruption becoming prominent in summer and fainter in winter.2 Gradually, the patient’s skin lesions became more progressive, extending to the forehead, nose, and ears, with oozing, crusting, atrophy, and telangiectases developing on the face despite treatment. In the last 3 years, no blisters were present on the patient’s face because of her efforts to avoid sun exposure. She had no history of recurrent infections.
On physical examination, the patient was generally healthy with normal intelligence and short stature. She weighed 26 kg and was approximately 122-cm tall. Telangiectatic erythema and slight scaling were noted on the face, which simulated lupus erythematosus (Figures 1A and 1B). She had additional abnormalities including alopecia areata (Figure 1C), eyebrow hair loss, flat nose, reticular pigmentation on the forehead and trunk, and finger swelling. The distal phalanges on all 10 fingers became short and sharpened and the fingernails became wider than they were long (Figure 1D). Laboratory investigations, including a complete blood cell count, liver and kidney function tests, stool examination, serum complement, and albumin and globulin levels, were within reference range.

After informed consent was obtained, a mutation analysis of the BLM gene was performed in the patient and her parents. We used a genomic DNA purification kit to extract genomic DNA from peripheral blood according to the manufacturer’s protocol. Genomic DNA was used to amplify the exons of the BLM gene with intron flanking sequences by polymerase chain reaction with the primer described elsewhere.6 After the amplification, the polymerase chain reaction products were purified and the BLM gene was sequenced. Sequence comparisons and analysis were performed using Phred/Phrap/Consed version 12.0.
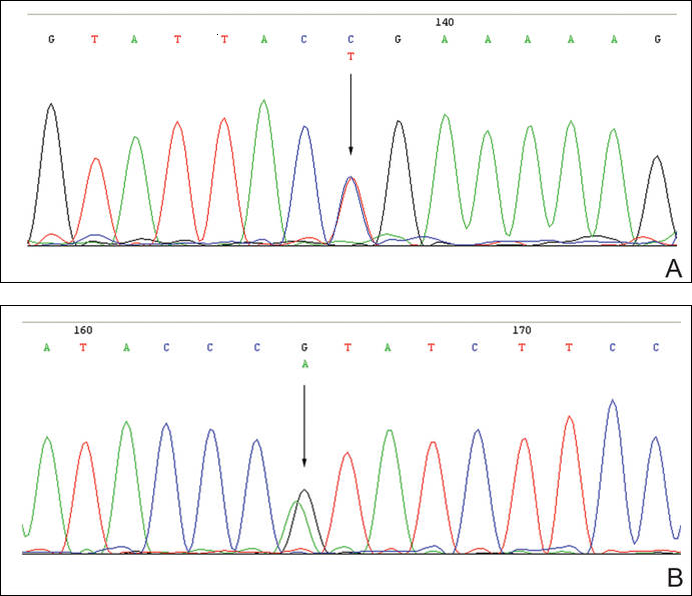
The patient was found to carry changes in 2 heterozygous nucleotide sites, including c.2603C>T in exon 13 and c.3961G>A in exon 21 of the BLM gene. The patient’s father was found to carry c.2603C>T and her mother carried c.3961G>A (Figure 2).
Comment
Patients with Bloom syndrome have a characteristic clinical appearance that typically includes photosensitivity, telangiectatic facial erythema, and growth deficiency. Telangiectatic erythema of the face develops during infancy or early childhood as red macules or plaques and may simulate lupus erythematosus. The lesions are described as a butterfly rash affecting the bridge of the nose and cheeks but also may involve the margins of the eyelids, forehead, ears, and sometimes the dorsa of the hands and forearms. Moderate and proportionate growth deficiencies develop both in utero and postnatally. Patients with Bloom syndrome characteristically have narrow, slender, distinct facial features with micrognathism and a relatively prominent nose. They usually may have mild microcephaly, meaning the head is longer and narrower than normal.2,7-10
German and Takebe11 reported 14 Japanese patients with Bloom syndrome. The phenotype differs somewhat from most cases recognized elsewhere in that dolichocephaly was a less constant feature, the facial skin was less prominent, and life-threatening infections were less common. Our patient had typical telangiectatic facial erythema without microcephaly, dolichocephaly, or any infections. She also had some uncommon manifestations such as alopecia areata, eyebrow hair loss, flat nose, reticular pigmentation, and short sharpened distal phalanges with fingernails that were wider than they were long. Although she had no recurrent infections and laboratory tests were within reference range, the alopecia areata and eyebrow hair loss may be associated with an abnormal immune response. The reasons for the short sharpened distal phalanges and the fingernail findings are unclear. The presence of reticular pigmentation also is unclear but may be associated with photosensitivity. Since the BLM gene was discovered to be the disease-causing gene of Bloom syndrome in 1995,4,5 approximately 70 mutations were reported. The BLM gene encodes for the Bloom syndrome protein, a DNA helicase of the highly conserved RecQ subfamily of helicases, a group of nuclear proteins important in the maintenance of genomic stability.12
Mutation analysis of the BLM gene in our patient showed changes in 2 heterozygous nucleotide sites, including c.2603C>T in exon 13 and c.3961G>A in exon 21 of the BLM gene, which altered proline residue with leucine residue at 868 and valine residue with isoleucine residue at 1321, respectively. According to GenBank,13,14 c.2603C>T and c.3961G>A are single nucleotide polymorphisms of the BLM gene. The genotypic distribution of International HapMap Project15 showed that C=602/602 and T=0/602 on c.2603 in 301 unrelated Chinese patients and G=585/602 and A=17/602 on c.3961 in 301 unrelated Chinese patients. Because of the low prevalence of genotypes c.2603T and c.3961A in China, the relationship between clinical features and c.2603C>T and c.3961G>A of the BLM gene in our patient requires further study.
In conclusion, we report a patient with Bloom syndrome with uncommon clinical manifestations. Our findings indicate that c.2603C>T and c.3961G>A of the BLM gene may be the pathogenic nature for Bloom syndrome in China.
Acknowledgments
The authors would like to thank the patient and her family for their participation in the study. The authors also thank Li Qi, BA, Beijing, China, for his contribution to the review of the data in the literature.
- Bloom D. Congenital telangiectatic erythema resembling lupus erythematosus in dwarfs; probably a syndrome entity. AMA Am J Dis Child. 1954;88:754-758.
- German J. Bloom’s syndrome, I: genetical and clinical observations in the first twenty-seven patients. Am J Hum Genet. 1969;21:196-227.
- German J, Roe AM, Leppert MF, et al. Bloom syndrome: an analysis of consanguineous families assigns the locus mutated to chromosome band 15q26.1. Proc Natl Acad Sci U S A. 1994;91:6669-6673.
- Passarge E. A DNA helicase in full Bloom. Nat Genet. 1995;11:356-357.
- Ellis NA, Groden J, Ye TZ, et al. The Bloom’s syndrome gene product is homologous to RecQ helicases. Cell. 1995;83:655-666.
- German J, Sanz MM, Ciocci S, et al. Syndrome-causing mutations of the BLM gene in persons in the Bloom’s Syndrome Registry. Hum Mutat. 2007;28:743-753.
- Landau JW, Sasaki MS, Newcomer VD, et al. Bloom’s syndrome: the syndrome of telangiectatic erythema and growth retardation. Arch Dermatol. 1966;94:687-694.
- Gretzula JC, Hevia O, Weber PJ. Bloom’s syndrome. J Am Acad Dermatol. 1987;17:479-488.
- Passarge E. Bloom’s syndrome: the German experience. Ann Genet. 1991;34:179-197.
- German J. Bloom’s syndrome. Dermatol Clin. 1995;13:7-18.
- German J, Takebe H. Bloom’s syndrome, XIV: the disorder in Japan. Clin Genet. 1989;35:93-110.
- Bennett RJ, Keck JL. Structure and function of RecQ DNA helicases. Crit Rev Biochem Mol Biol. 2004;39:79-97.
- Reference SNP (refSNP) Cluster Report: rs2227935. National Center for Biotechnology Information website. http://www.ncbi.nlm.nih.gov/SNP/snp_ref.cgi?rs=2227935. Accessed February 3, 2016.
- Reference SNP (refSNP) Cluster Report: rs7167216. National Center for Biotechnology Information website. http://www.ncbi.nlm.nih.gov/SNP/snp_ref.cgi?rs=7167216. Accessed February 3, 2016.
- Homo sapiens:GRCh37.p13 (GCF_000001405.25)Chr 1 (NC_000001.10):1 - 249.3M. National Center for Biotechnology Information website. http://www.ncbi.nlm.nih.gov/variationtools/1000genomes/?=%EF%BC%86=. Accessed February 3, 2016.
Bloom syndrome, also called congenital telangiectatic erythema and stunted growth, was first described by David Bloom in 1954.1 It is a rare autosomal-recessive disorder (Online Mendelian Inheritance in Man 210900) characterized by specific clinical manifestations including photosensitivity, telangiectatic facial erythema, proportionate growth deficiency, hypogonadism, immunodeficiency, and a tendency to develop various malignancies.2 Linkage analysis revealed that the Bloom syndrome gene locus resides on chromosome arm 15q26.1,3 and the BLM gene in this region has been identified as being responsible for the development of Bloom syndrome.4,5 We report the case of a 12-year-old Chinese girl with Bloom syndrome and detected BLM gene. The evaluation was approved by the Institutional Ethical Review Boards of Institute of Dermatology, Chinese Academy of Medical Sciences and Peking Union Medical College (Beijing, China).
Case Report
We evaluated a Bloom syndrome family, which consisted of the patient and her parents. The patient was a 12-year-old Chinese girl who was apparently healthy until 3 months of age when her parents noticed an erythematous eruption with blisters on the face. Exacerbation after exposure to sunlight is usual, which results in the eruption becoming prominent in summer and fainter in winter.2 Gradually, the patient’s skin lesions became more progressive, extending to the forehead, nose, and ears, with oozing, crusting, atrophy, and telangiectases developing on the face despite treatment. In the last 3 years, no blisters were present on the patient’s face because of her efforts to avoid sun exposure. She had no history of recurrent infections.
On physical examination, the patient was generally healthy with normal intelligence and short stature. She weighed 26 kg and was approximately 122-cm tall. Telangiectatic erythema and slight scaling were noted on the face, which simulated lupus erythematosus (Figures 1A and 1B). She had additional abnormalities including alopecia areata (Figure 1C), eyebrow hair loss, flat nose, reticular pigmentation on the forehead and trunk, and finger swelling. The distal phalanges on all 10 fingers became short and sharpened and the fingernails became wider than they were long (Figure 1D). Laboratory investigations, including a complete blood cell count, liver and kidney function tests, stool examination, serum complement, and albumin and globulin levels, were within reference range.
After informed consent was obtained, a mutation analysis of the BLM gene was performed in the patient and her parents. We used a genomic DNA purification kit to extract genomic DNA from peripheral blood according to the manufacturer’s protocol. Genomic DNA was used to amplify the exons of the BLM gene with intron flanking sequences by polymerase chain reaction with the primer described elsewhere.6 After the amplification, the polymerase chain reaction products were purified and the BLM gene was sequenced. Sequence comparisons and analysis were performed using Phred/Phrap/Consed version 12.0.
The patient was found to carry changes in 2 heterozygous nucleotide sites, including c.2603C>T in exon 13 and c.3961G>A in exon 21 of the BLM gene. The patient’s father was found to carry c.2603C>T and her mother carried c.3961G>A (Figure 2).
Comment
Patients with Bloom syndrome have a characteristic clinical appearance that typically includes photosensitivity, telangiectatic facial erythema, and growth deficiency. Telangiectatic erythema of the face develops during infancy or early childhood as red macules or plaques and may simulate lupus erythematosus. The lesions are described as a butterfly rash affecting the bridge of the nose and cheeks but also may involve the margins of the eyelids, forehead, ears, and sometimes the dorsa of the hands and forearms. Moderate and proportionate growth deficiencies develop both in utero and postnatally. Patients with Bloom syndrome characteristically have narrow, slender, distinct facial features with micrognathism and a relatively prominent nose. They usually may have mild microcephaly, meaning the head is longer and narrower than normal.2,7-10
German and Takebe11 reported 14 Japanese patients with Bloom syndrome. The phenotype differs somewhat from most cases recognized elsewhere in that dolichocephaly was a less constant feature, the facial skin was less prominent, and life-threatening infections were less common. Our patient had typical telangiectatic facial erythema without microcephaly, dolichocephaly, or any infections. She also had some uncommon manifestations such as alopecia areata, eyebrow hair loss, flat nose, reticular pigmentation, and short sharpened distal phalanges with fingernails that were wider than they were long. Although she had no recurrent infections and laboratory tests were within reference range, the alopecia areata and eyebrow hair loss may be associated with an abnormal immune response. The reasons for the short sharpened distal phalanges and the fingernail findings are unclear. The presence of reticular pigmentation also is unclear but may be associated with photosensitivity. Since the BLM gene was discovered to be the disease-causing gene of Bloom syndrome in 1995,4,5 approximately 70 mutations were reported. The BLM gene encodes for the Bloom syndrome protein, a DNA helicase of the highly conserved RecQ subfamily of helicases, a group of nuclear proteins important in the maintenance of genomic stability.12
Mutation analysis of the BLM gene in our patient showed changes in 2 heterozygous nucleotide sites, including c.2603C>T in exon 13 and c.3961G>A in exon 21 of the BLM gene, which altered proline residue with leucine residue at 868 and valine residue with isoleucine residue at 1321, respectively. According to GenBank,13,14 c.2603C>T and c.3961G>A are single nucleotide polymorphisms of the BLM gene. The genotypic distribution of International HapMap Project15 showed that C=602/602 and T=0/602 on c.2603 in 301 unrelated Chinese patients and G=585/602 and A=17/602 on c.3961 in 301 unrelated Chinese patients. Because of the low prevalence of genotypes c.2603T and c.3961A in China, the relationship between clinical features and c.2603C>T and c.3961G>A of the BLM gene in our patient requires further study.
In conclusion, we report a patient with Bloom syndrome with uncommon clinical manifestations. Our findings indicate that c.2603C>T and c.3961G>A of the BLM gene may be the pathogenic nature for Bloom syndrome in China.
Acknowledgments
The authors would like to thank the patient and her family for their participation in the study. The authors also thank Li Qi, BA, Beijing, China, for his contribution to the review of the data in the literature.
- Bloom D. Congenital telangiectatic erythema resembling lupus erythematosus in dwarfs; probably a syndrome entity. AMA Am J Dis Child. 1954;88:754-758.
- German J. Bloom’s syndrome, I: genetical and clinical observations in the first twenty-seven patients. Am J Hum Genet. 1969;21:196-227.
- German J, Roe AM, Leppert MF, et al. Bloom syndrome: an analysis of consanguineous families assigns the locus mutated to chromosome band 15q26.1. Proc Natl Acad Sci U S A. 1994;91:6669-6673.
- Passarge E. A DNA helicase in full Bloom. Nat Genet. 1995;11:356-357.
- Ellis NA, Groden J, Ye TZ, et al. The Bloom’s syndrome gene product is homologous to RecQ helicases. Cell. 1995;83:655-666.
- German J, Sanz MM, Ciocci S, et al. Syndrome-causing mutations of the BLM gene in persons in the Bloom’s Syndrome Registry. Hum Mutat. 2007;28:743-753.
- Landau JW, Sasaki MS, Newcomer VD, et al. Bloom’s syndrome: the syndrome of telangiectatic erythema and growth retardation. Arch Dermatol. 1966;94:687-694.
- Gretzula JC, Hevia O, Weber PJ. Bloom’s syndrome. J Am Acad Dermatol. 1987;17:479-488.
- Passarge E. Bloom’s syndrome: the German experience. Ann Genet. 1991;34:179-197.
- German J. Bloom’s syndrome. Dermatol Clin. 1995;13:7-18.
- German J, Takebe H. Bloom’s syndrome, XIV: the disorder in Japan. Clin Genet. 1989;35:93-110.
- Bennett RJ, Keck JL. Structure and function of RecQ DNA helicases. Crit Rev Biochem Mol Biol. 2004;39:79-97.
- Reference SNP (refSNP) Cluster Report: rs2227935. National Center for Biotechnology Information website. http://www.ncbi.nlm.nih.gov/SNP/snp_ref.cgi?rs=2227935. Accessed February 3, 2016.
- Reference SNP (refSNP) Cluster Report: rs7167216. National Center for Biotechnology Information website. http://www.ncbi.nlm.nih.gov/SNP/snp_ref.cgi?rs=7167216. Accessed February 3, 2016.
- Homo sapiens:GRCh37.p13 (GCF_000001405.25)Chr 1 (NC_000001.10):1 - 249.3M. National Center for Biotechnology Information website. http://www.ncbi.nlm.nih.gov/variationtools/1000genomes/?=%EF%BC%86=. Accessed February 3, 2016.

When the Doctor Is Not a Doctor

It is now common for patients to arrive in a physician office and never see the physician. Instead, patients are seen by so-called physician extenders. As our population ages, the need for medical care continues to grow beyond the capacity of the 900,000 US physicians that provide required services, particularly in the first level (primary care). The response to the physician shortage has entailed a variety of strategies. There has been a major immigration of foreign physicians, particularly from India; US medical schools have been encouraged to increase enrollment; and new medical schools have been inaugurated. Physicians have been pushed to adopt electronic medical records to permit increased throughput of patients in office practices. These multiple approaches have had an effect, though sometimes the results are undesirable. For example, complicated computer programs often detract from the physician-patient relationship.
One of the early solutions offered to deal with the doctor shortage in primary care was the concept of physician extenders (PEs), also called mid-level practitioners, who are professionals trained to take on a number of the simpler tasks performed by physicians. There are 2 basic classes of PEs: nurse practitioners and physician assistants. Nurse practitioners are originally trained to perform nursing but then undertake a course of study including scientific courses and clinical exposure to various parts of medicine. Physician assistants receive similar training. The duration of training for PEs usually is 18 to 24 months, whereas physicians attend medical school for 4 years. Unlike physicians, mid-level practitioners do not enter physician postgraduate residency training programs, which last many years.
The original concept was that PEs would work side by side with physicians who would supervise the care provided by the PEs. This team concept was designed to free physicians from the more mundane aspects of medical care and allow them to focus on the more challenging diagnostic and therapeutic issues presented by individual patients. In an era in which the burden of documentation has become increasingly onerous, the assistance of paraprofessionals can spare physicians the entry of redundant details in electronic databases that do not contribute to patient welfare.
However, research suggests that the concept of mid-level providers undertaking first-level care side by side with physicians has diverged from the original goal. An article by Coldiron and Ratnarathorn (JAMA Dermatol. 2014;150:1153-1159) studied Medicare billing data. The authors discovered that a variety of activities, many with higher reimbursement than primary care, were billed directly by PEs without apparent physician involvement, including a large number of complex invasive procedures, more than half in dermatology. Their article focused on dermatologic procedures, such as the destruction of skin cancers and advanced surgical repairs, but they listed many other procedures that are typically in the domain of highly trained physicians, including radiologic interpretations such as mammography and joint injections such as spinal injections. The data they presented were substantiated by publications in the medical literature suggesting that mid-level providers at certain hospitals even perform heart catheterizations and gastrointestinal endoscopies.
There have been no apologies for the unsupervised conduct of physician activities by nonphysicians. On the contrary, many PEs claim to be as well trained and proficient as medical doctors. Coldiron and Ratnarathorn argued otherwise. They pointed out that physicians receive an average of 10,000 hours of training compared to 2000 hours for mid-level practitioners, and they raised concerns about misdiagnoses, complications, and unnecessary procedures performed by PEs without supervision. In an editorial, Jalian and Avram (JAMA Dermatol. 2014;150:1149-1151) pointed out that a disproportionate number of cases of lawsuits for laser-induced injuries are related to performance by nonphysicians.
The pressures to allow nonphysicians to practice medicine independently are increasing. There is a shortage of physicians, especially in states such as Massachusetts that have substantial governmental limitation of physician reimbursement. In Massachusetts, regulations encourage mid-level practitioners to practice without physician supervision and even call themselves “doctors.” Furthermore, hospitals have faced residency funding cuts by Medicare and have had regulatory limitation of work hours by medical doctors in residency training. As a result, many institutions have turned to PEs to perform procedures that are typically performed by medical doctors.
Perhaps the greatest pressure favoring use of nonphysicians is financial. Mid-level practitioners receive lower salaries, typically 45% less, than medical doctors. In an era in which lowering costs has supplanted the goal of offering the best medical care possible, the attraction of replacement of a physician by a professional with less training becomes irresistible. It also is of concern that many physicians ignore the requirement to supervise the work of mid-level practitioners to maximize profit. Physicians often hire a mid-level provider rather than finding another physician to partner in their practice. Patients referred to a dermatologist often are seen by a PE and never even see the physician.
The concept of PEs working in a team with physicians remains an excellent approach to remedying the shortage of medical doctors, but we need to return to the original plan. Physician extenders should perform primary care rather than complex and lucrative subspecialties. There must be adequate supervision and definitely participation by physicians in rendering care.
All of the authors in the articles cited argue for greater regulation of unsupervised PEs to prevent performance of procedures where they lack expertise. Although the regulatory approach is sensible, it is more important to ensure that patients choose who gives them their medical care. They should not be obligated to see mid-level practitioners if they want to see a medical doctor. Above all, patients must be informed of the qualifications of those who provide their medical care. They should not be blindsided when they arrive for an appointment with their physician and find themselves shunted to a PE. We must not allow financial considerations to override the integrity of the medical care process.
What do you think is the optimal and safest role for PEs in a dermatology practice?
We want to know your views! Tell us what you think.

Bringing a baby to the office
I’ve previously written about how my secretary took 8 weeks off for maternity leave. Well, she’s back now, and brought a new staff member with her.
I know several doctors who are horrified that I let her bring the baby to work every day. They tell me it’s unprofessional, a distraction, inconvenient, etc.
Me? I think it’s great.
I have no problem with her being here. If anything, she adds an upbeat vibe to the office. Seeing an adorable newborn up front cheers all comers. She’s quickly become the most popular person here. Nowadays, when I call someone back from the lobby, they jokingly protest and say, but “I’m looking at the baby!” At this point, we’ve even had people coming by just to see her, once word spread there was a baby at my office.
Is it unprofessional? Maybe by someone else’s standards, but not mine. At this stage of life, she’s certainly not in the way. She’s (generally) quiet, sweet, and smiley. Besides, having her here spares my secretary the expense of child care and makes her happy. If keeping your staff happy isn’t part of being professional, I don’t know what is.
Is she a distraction? Perhaps, but not in a bad way. Maybe I take a few seconds here and there to wave at her or help my secretary with something, but nothing that compromises patient care.

Is it inconvenient to have her here? Nope. We have an extra exam room, so it’s easy for my secretary to have a quiet, private place to feed and change her every few hours. If the phones go to voice mail for a few minutes, or I have to keep an ear out for the front door opening, I don’t mind.
She and I both have young families. When we were looking for a new office 3 years ago, one of our requirements was what we called “the sick kid room.” An extra space where, if a kid couldn’t go to school, we wouldn’t be stuck trying to figure out what to do. They’ve always been welcome here, and always will be.
Having kids on site isn’t perfect for every practice. Certainly, a pediatrics office (with a lot more sick kids going in and out) wouldn’t be ideal. But at my place the young lady has brightened things up for all and makes the day more fun.
Dr. Block has a solo neurology practice in Scottsdale, Ariz.
I’ve previously written about how my secretary took 8 weeks off for maternity leave. Well, she’s back now, and brought a new staff member with her.
I know several doctors who are horrified that I let her bring the baby to work every day. They tell me it’s unprofessional, a distraction, inconvenient, etc.
Me? I think it’s great.
I have no problem with her being here. If anything, she adds an upbeat vibe to the office. Seeing an adorable newborn up front cheers all comers. She’s quickly become the most popular person here. Nowadays, when I call someone back from the lobby, they jokingly protest and say, but “I’m looking at the baby!” At this point, we’ve even had people coming by just to see her, once word spread there was a baby at my office.
Is it unprofessional? Maybe by someone else’s standards, but not mine. At this stage of life, she’s certainly not in the way. She’s (generally) quiet, sweet, and smiley. Besides, having her here spares my secretary the expense of child care and makes her happy. If keeping your staff happy isn’t part of being professional, I don’t know what is.
Is she a distraction? Perhaps, but not in a bad way. Maybe I take a few seconds here and there to wave at her or help my secretary with something, but nothing that compromises patient care.
Is it inconvenient to have her here? Nope. We have an extra exam room, so it’s easy for my secretary to have a quiet, private place to feed and change her every few hours. If the phones go to voice mail for a few minutes, or I have to keep an ear out for the front door opening, I don’t mind.
She and I both have young families. When we were looking for a new office 3 years ago, one of our requirements was what we called “the sick kid room.” An extra space where, if a kid couldn’t go to school, we wouldn’t be stuck trying to figure out what to do. They’ve always been welcome here, and always will be.
Having kids on site isn’t perfect for every practice. Certainly, a pediatrics office (with a lot more sick kids going in and out) wouldn’t be ideal. But at my place the young lady has brightened things up for all and makes the day more fun.
Dr. Block has a solo neurology practice in Scottsdale, Ariz.

Defibrotide offers benefit for severe veno-occlusive disease and multiorgan failure
Defibrotide improved survival at 100 days after hematopoietic stem cell transplantation (HSCT) in patients with hepatic veno-occlusive disease, based on an open-label trial that compared trial participants with historical controls.
Of the 102 patients in the defibrotide group, 39 were alive 100 days after HSCT (38.2%), compared with 8 of 32 (25.0%) in the historical control group. The propensity-adjusted, between-group difference was 23.0% (95.1% confidence interval, 5.2%-40.8%; P = .0109). At 180 days post-HSCT, the difference in survival between the groups was not significant (Blood. 2016 Feb 3. doi: 10.1182/blood-2015-10-676924).

Defibrotide has Fast Track designation from the FDA and the new drug application is currently under Priority Review with a decision expected by March 31, 2016. A potentially fatal complication of HSCT, hepatic veno-occlusive disease is characterized by hepatomegaly, jaundice, rapid weight gain, fluid retention, and ascites. There are no approved therapies.
“In this context, defibrotide provides a promising treatment option for patients with a high unmet medical need,” wrote Dr. Paul G. Richardson of Dana-Farber Cancer Institute in Boston and his colleagues.
At day 100 post-HSCT, complete response was seen in 25.5% of the defibrotide group and in 12.5% of the historical control group. The propensity-adjusted, between-group difference was 19% (95.1% CI, 3.5-34.6%; P = .0160). The complete response was durable in 22 of the 26 patients. In the control group, complete response was limited in two patients, impossible to assess in one patient, and durable in one patient.
The multicenter, open-label, phase III trial prospectively enrolled 102 patients with hepatic veno-occlusive disease from 2006 to 2008. Defibrotide was administered intravenously at 25 mg/kg/day in 4 divided doses for a minimum of 21 days. Treatment continued beyond 21 days until resolution of veno-occlusive disease or until the patient was discharged from the hospital.
To identify the historical controls, 6,867 medical charts of HSCT patients hospitalized from 1995 to 2007 were reviewed, and 32 historical control patients were selected. Most (21 of 32) were diagnosed with during 2000-2006, and 11 were diagnosed before 2000. The historical controls were selected by an independent medical review committee, and met the same entry criteria as the defibrotide group.
Because recruiting for the defibrotide group and screening for historical controls occurred at the same institutions during similar time periods, patient management and supportive care were likely similar for the two groups. Propensity scores were included in the analysis to adjust for prognostic factors that were unbalanced between treatment and control groups, including ventilator and dialysis dependency at study entry, age greater or less than 16 years, prior HSCT (0 vs. 1), and allogeneic or autologous transplant.
Hypotension was the most common adverse event reported in the defibrotide and control groups (39% and 50%, respectively), followed by diarrhea (23.5% and 37.5%, respectively). The defibrotide and control groups had similar incidences of common hemorrhagic adverse events (64% and 75%, respectively). Fatal adverse events occurred in 64% of the defibrotide group and 69% of the control group, and fatal hemorrhagic events occurred in 14.7% of the defibrotide group and 6.3% of the control group.
Approved by the European Union, defibrotide is a single-stranded, deoxyribonucleic acid derivative that stabilizes damaged endothelial cells and prevents further endothelial cell damage.
Dr. Richardson reported consulting or advisory roles with Gentium/Jazz Pharmaceuticals, the maker of defibrotide.
Defibrotide improved survival at 100 days after hematopoietic stem cell transplantation (HSCT) in patients with hepatic veno-occlusive disease, based on an open-label trial that compared trial participants with historical controls.
Of the 102 patients in the defibrotide group, 39 were alive 100 days after HSCT (38.2%), compared with 8 of 32 (25.0%) in the historical control group. The propensity-adjusted, between-group difference was 23.0% (95.1% confidence interval, 5.2%-40.8%; P = .0109). At 180 days post-HSCT, the difference in survival between the groups was not significant (Blood. 2016 Feb 3. doi: 10.1182/blood-2015-10-676924).
Defibrotide has Fast Track designation from the FDA and the new drug application is currently under Priority Review with a decision expected by March 31, 2016. A potentially fatal complication of HSCT, hepatic veno-occlusive disease is characterized by hepatomegaly, jaundice, rapid weight gain, fluid retention, and ascites. There are no approved therapies.
“In this context, defibrotide provides a promising treatment option for patients with a high unmet medical need,” wrote Dr. Paul G. Richardson of Dana-Farber Cancer Institute in Boston and his colleagues.
At day 100 post-HSCT, complete response was seen in 25.5% of the defibrotide group and in 12.5% of the historical control group. The propensity-adjusted, between-group difference was 19% (95.1% CI, 3.5-34.6%; P = .0160). The complete response was durable in 22 of the 26 patients. In the control group, complete response was limited in two patients, impossible to assess in one patient, and durable in one patient.
The multicenter, open-label, phase III trial prospectively enrolled 102 patients with hepatic veno-occlusive disease from 2006 to 2008. Defibrotide was administered intravenously at 25 mg/kg/day in 4 divided doses for a minimum of 21 days. Treatment continued beyond 21 days until resolution of veno-occlusive disease or until the patient was discharged from the hospital.
To identify the historical controls, 6,867 medical charts of HSCT patients hospitalized from 1995 to 2007 were reviewed, and 32 historical control patients were selected. Most (21 of 32) were diagnosed with during 2000-2006, and 11 were diagnosed before 2000. The historical controls were selected by an independent medical review committee, and met the same entry criteria as the defibrotide group.
Because recruiting for the defibrotide group and screening for historical controls occurred at the same institutions during similar time periods, patient management and supportive care were likely similar for the two groups. Propensity scores were included in the analysis to adjust for prognostic factors that were unbalanced between treatment and control groups, including ventilator and dialysis dependency at study entry, age greater or less than 16 years, prior HSCT (0 vs. 1), and allogeneic or autologous transplant.
Hypotension was the most common adverse event reported in the defibrotide and control groups (39% and 50%, respectively), followed by diarrhea (23.5% and 37.5%, respectively). The defibrotide and control groups had similar incidences of common hemorrhagic adverse events (64% and 75%, respectively). Fatal adverse events occurred in 64% of the defibrotide group and 69% of the control group, and fatal hemorrhagic events occurred in 14.7% of the defibrotide group and 6.3% of the control group.
Approved by the European Union, defibrotide is a single-stranded, deoxyribonucleic acid derivative that stabilizes damaged endothelial cells and prevents further endothelial cell damage.
Dr. Richardson reported consulting or advisory roles with Gentium/Jazz Pharmaceuticals, the maker of defibrotide.
FROM THE JOURNAL OF CLINICAL ONCOLOGY
Key clinical point: Defibrotide improved survival at 100 days after hematopoietic stem cell transplantation (HSCT) in patients with hepatic veno-occlusive disease, based on an open-label trial that compared trial participants with historical controls.
Major finding: At day 100 post-HSCT, survival was 38.2% for the treatment group and 25.0% for historical controls; propensity-adjusted between-group difference, 23.0%; 95.1% CI, 5.2%-40.8%; P = .0109).
Data source: The multicenter phase III trial included 102 patients with hepatic veno-occlusive disease in the defibrotide group and 32 patients selected for the historical control group.
Disclosures: Dr. Richardson reported consulting or advisory roles with Gentium/Jazz Pharmaceuticals, the maker of defibrotide.

Compelling case for NOACs in VTE
SNOWMASS, COLO. – All four Food and Drug Administration–approved novel oral anticoagulants offer impressive safety advantages over the traditional strategy of low-molecular-weight heparin bridging to warfarin for treatment of acute venous thromboembolism, Dr. Patrick T. O’Gara observed at the Annual Cardiovascular Conference at Snowmass.
He highlighted a European analysis of six phase III clinical trials totaling more than 27,000 patients with venous thromboembolism (VTE) in which dabigatran (Pradaxa), rivaroxaban(Xarelto), apixaban (Eliquis), or edoxaban (Savaysa) was compared to the traditional strategy of unfractionated or low-molecular-weight heparin (LMWH) bridging to warfarin or another vitamin K antagonist. All four NOACs proved statistically noninferior to the traditional strategy in terms of efficacy as defined by prevention of recurrent VTE. Efficacy of NOACs and warfarin was similar regardless of body weight, chronic kidney disease, age, cancer, and pulmonary embolism versus deep venous thrombosis.

In terms of safety, it was no contest: The NOACs were collectively associated with a 39% lower risk of major bleeding, a 64% lower risk of fatal bleeding, and a 63% reduction in intracranial bleeding compared to LMWH/warfarin (Blood 2014 Sep 18;124[12]:1968-75).
“This is a big-ticket winner for the novel oral anticoagulants in the longer-term management of patients who have venous thromboembolic disease – not inferior to a strategy of low-molecular-weight heparin bridging to warfarin and much better with respect to serious consequences of a safety nature,” said Dr. O’Gara, professor of medicine at Harvard Medical School and director of clinical cardiology at Brigham and Women’s Hospital, Boston.
The pivotal trials for NOACs in VTE were generally structured statistically as noninferiority trials, with one exception: edoxaban has been shown to be superior to warfarin in a prespecified subgroup with submassive pulmonary embolism.
Further strengthening the case for routine use of NOACs in treating acute VTE is the emergence of fast-acting antidotes to the drugs in the event a patient develops a bleeding complication. Idarucizumab (Praxbind) received FDA approval last October as a reversal agent for dabigatran. Many experts think andexanet alpha will likely receive regulatory approval later this year as a universal antidote to all the factor Xa inhibitors, he noted.
It’s estimated that 70% of patients with pulmonary embolism can be classified as low risk and thus eligible for consideration for early hospital discharge and home treatment, provided their social situation is suitable. Pulmonary embolism patients are categorized as low risk if they are hemodynamically stable, don’t require supplemental oxygen, don’t show right ventricular dilatation on CT imaging in the emergency department, and lack serum biomarker evidence of right ventricular strain or injury.
In making decisions about outpatient therapy for VTE, a point worth considering is that two NOACs, rivaroxaban and apixaban, possess the practical advantage of being single-agent therapy. That is, they don’t require a heparin bridge prior to their introduction, as established in the EINSTEIN trial for rivaroxaban and in the AMPLIFY study for apixaban. However, a loading dose is necessary. Rivaroxaban is given at 15 mg b.i.d. for 3 weeks before dropping down to 20 mg once daily. Apixaban has a loading dose of 10 mg b.i.d. for the first 7 days followed by 5 mg b.i.d. thereafter.
“You’ll note that you give a higher loading dose for these particular agents for events that occur on the venous side of the circulation compared with the management of patients who have nonvalvular atrial fibrillation,” Dr. O’Gara said.
In contrast, both dabigatran and edoxaban require either unfractionated or LMWH as bridge before switching to oral therapy.
Dr. O’Gara reported having no financial conflicts of interest regarding his presentation.
SNOWMASS, COLO. – All four Food and Drug Administration–approved novel oral anticoagulants offer impressive safety advantages over the traditional strategy of low-molecular-weight heparin bridging to warfarin for treatment of acute venous thromboembolism, Dr. Patrick T. O’Gara observed at the Annual Cardiovascular Conference at Snowmass.
He highlighted a European analysis of six phase III clinical trials totaling more than 27,000 patients with venous thromboembolism (VTE) in which dabigatran (Pradaxa), rivaroxaban(Xarelto), apixaban (Eliquis), or edoxaban (Savaysa) was compared to the traditional strategy of unfractionated or low-molecular-weight heparin (LMWH) bridging to warfarin or another vitamin K antagonist. All four NOACs proved statistically noninferior to the traditional strategy in terms of efficacy as defined by prevention of recurrent VTE. Efficacy of NOACs and warfarin was similar regardless of body weight, chronic kidney disease, age, cancer, and pulmonary embolism versus deep venous thrombosis.
In terms of safety, it was no contest: The NOACs were collectively associated with a 39% lower risk of major bleeding, a 64% lower risk of fatal bleeding, and a 63% reduction in intracranial bleeding compared to LMWH/warfarin (Blood 2014 Sep 18;124[12]:1968-75).
“This is a big-ticket winner for the novel oral anticoagulants in the longer-term management of patients who have venous thromboembolic disease – not inferior to a strategy of low-molecular-weight heparin bridging to warfarin and much better with respect to serious consequences of a safety nature,” said Dr. O’Gara, professor of medicine at Harvard Medical School and director of clinical cardiology at Brigham and Women’s Hospital, Boston.
The pivotal trials for NOACs in VTE were generally structured statistically as noninferiority trials, with one exception: edoxaban has been shown to be superior to warfarin in a prespecified subgroup with submassive pulmonary embolism.
Further strengthening the case for routine use of NOACs in treating acute VTE is the emergence of fast-acting antidotes to the drugs in the event a patient develops a bleeding complication. Idarucizumab (Praxbind) received FDA approval last October as a reversal agent for dabigatran. Many experts think andexanet alpha will likely receive regulatory approval later this year as a universal antidote to all the factor Xa inhibitors, he noted.
It’s estimated that 70% of patients with pulmonary embolism can be classified as low risk and thus eligible for consideration for early hospital discharge and home treatment, provided their social situation is suitable. Pulmonary embolism patients are categorized as low risk if they are hemodynamically stable, don’t require supplemental oxygen, don’t show right ventricular dilatation on CT imaging in the emergency department, and lack serum biomarker evidence of right ventricular strain or injury.
In making decisions about outpatient therapy for VTE, a point worth considering is that two NOACs, rivaroxaban and apixaban, possess the practical advantage of being single-agent therapy. That is, they don’t require a heparin bridge prior to their introduction, as established in the EINSTEIN trial for rivaroxaban and in the AMPLIFY study for apixaban. However, a loading dose is necessary. Rivaroxaban is given at 15 mg b.i.d. for 3 weeks before dropping down to 20 mg once daily. Apixaban has a loading dose of 10 mg b.i.d. for the first 7 days followed by 5 mg b.i.d. thereafter.
“You’ll note that you give a higher loading dose for these particular agents for events that occur on the venous side of the circulation compared with the management of patients who have nonvalvular atrial fibrillation,” Dr. O’Gara said.
In contrast, both dabigatran and edoxaban require either unfractionated or LMWH as bridge before switching to oral therapy.
Dr. O’Gara reported having no financial conflicts of interest regarding his presentation.
EXPERT ANALYSIS FROM THE CARDIOVASCULAR CONFERENCE AT SNOWMASS

Danish study finds increased glioma risk in a rosacea population
An increased focus on neurologic symptoms in patients with rosacea may be warranted, according to Danish researchers, who found a significantly increased risk of glioma associated with rosacea, in a nationwide study of Danish citizens.
The observational study followed 5,484,910 Danish adults from January 1997 through December 2011; 68,372 were diagnosed with rosacea, and the remaining 5,416,538 were the reference group. The incidence rate of glioma per 10,000 person-years (adjusted for age, sex, and socioeconomic status) was 3.34 in the reference population, but was 4.99 among those with rosacea, reported Dr. Alexander Egeberg of the department of dermatoallergology, Herlev and Gentofte University Hospital, University of Copenhagen, Hellerup, and his coauthors (JAMA Dermatol. 2016 Jan 27. doi: 10.1001/jamadermatol.2015.5549).
The adjusted incidence rate ratio (IRR) of glioma in patients with rosacea was 1.36 (P less than .001). When the researchers limited the analysis to patients who had been diagnosed by a hospital dermatologist, the adjusted IRR was 1.82. The results remained significant after sensitivity analyses and after adjustment for potential confounders.

Among the patients with rosacea, men had an increased risk of glioma, compared with women (an incidence rate per 10,000 person-years of 6.45 vs. 4.30), although “gliomas and rosacea were generally more common among women,” the authors reported.
The association might be partially mediated by mechanisms dependent on matrix metalloproteinases (MMPs), the authors said, referring to studies indicating that MMPs, in particular MMP-9, “play a pivotal role in rosacea and regulation of the invasiveness of malignant glioma cells.” While speculative, “mechanisms dependent on MMPs may contribute to the link between rosacea and the risk for glioma,” the investigators added.
An increased focus on neurologic symptoms such as headaches, memory loss, visual symptoms, cognitive decline, and personality changes in patients with rosacea “and timely referral to relevant specialists may be warranted,” they concluded.
Limitations of the study included the observational design, which cannot establish causation, the authors noted. Dr. Egeberg reported being a former employee of Pfizer; one coauthor reported receiving consultancy and/or speaker honoraria from Galderma. The study was supported by an unrestricted grant from the LEO Foundation and the Lundbeck Foundation and an unrestricted research scholarship from the Novo Nordisk Foundation.
An increased focus on neurologic symptoms in patients with rosacea may be warranted, according to Danish researchers, who found a significantly increased risk of glioma associated with rosacea, in a nationwide study of Danish citizens.
The observational study followed 5,484,910 Danish adults from January 1997 through December 2011; 68,372 were diagnosed with rosacea, and the remaining 5,416,538 were the reference group. The incidence rate of glioma per 10,000 person-years (adjusted for age, sex, and socioeconomic status) was 3.34 in the reference population, but was 4.99 among those with rosacea, reported Dr. Alexander Egeberg of the department of dermatoallergology, Herlev and Gentofte University Hospital, University of Copenhagen, Hellerup, and his coauthors (JAMA Dermatol. 2016 Jan 27. doi: 10.1001/jamadermatol.2015.5549).
The adjusted incidence rate ratio (IRR) of glioma in patients with rosacea was 1.36 (P less than .001). When the researchers limited the analysis to patients who had been diagnosed by a hospital dermatologist, the adjusted IRR was 1.82. The results remained significant after sensitivity analyses and after adjustment for potential confounders.
Among the patients with rosacea, men had an increased risk of glioma, compared with women (an incidence rate per 10,000 person-years of 6.45 vs. 4.30), although “gliomas and rosacea were generally more common among women,” the authors reported.
The association might be partially mediated by mechanisms dependent on matrix metalloproteinases (MMPs), the authors said, referring to studies indicating that MMPs, in particular MMP-9, “play a pivotal role in rosacea and regulation of the invasiveness of malignant glioma cells.” While speculative, “mechanisms dependent on MMPs may contribute to the link between rosacea and the risk for glioma,” the investigators added.
An increased focus on neurologic symptoms such as headaches, memory loss, visual symptoms, cognitive decline, and personality changes in patients with rosacea “and timely referral to relevant specialists may be warranted,” they concluded.
Limitations of the study included the observational design, which cannot establish causation, the authors noted. Dr. Egeberg reported being a former employee of Pfizer; one coauthor reported receiving consultancy and/or speaker honoraria from Galderma. The study was supported by an unrestricted grant from the LEO Foundation and the Lundbeck Foundation and an unrestricted research scholarship from the Novo Nordisk Foundation.
FROM JAMA DERMATOLOGY
Key clinical point: Clinicians should be mindful of neurologic symptoms in patients with rosacea because of a significant association between glioma and rosacea.
Major finding: The incidence rate ratio of glioma per 10,000 person-years was 3.34 in the reference population and 4.99 in patients with rosacea.
Data source: A nationwide cohort study that followed 5,484 910 Danish adults from 1997 through 2011.
Disclosures: Dr. Egeberg reported being a former employee of Pfizer; one coauthor reported receiving consultancy and/or speaker honoraria from Galderma. The study was supported by an unrestricted grant from the LEO Foundation and the Lundbeck Foundation and an unrestricted research scholarship from the Novo Nordisk Foundation.

Guidelines in works to tackle ruptured AAA transfers
CHICAGO – Adoption of an organized, systematic approach to ruptured abdominal aortic aneurysm has been inconsistent.
In a recent survey of vascular physicians in the western United States, 60% who accept ruptured abdominal aortic aneurysm (rAAA) transfers do not have a formal protocol for treatment and 70% do not use a transfer protocol or clinical guidelines (J Vasc Surg. 2015 Aug;62:326-30).
Guidelines for the management and transfer of patients with rAAA have been developed in the United Kingdom, but no such guidelines currently exist in the United States.
To address this disparity, the Western Vascular Society used the survey results, existing European guidelines, and a literature review to develop a set of 15 best practice steps for rAAA transfer. The “guidelines” were endorsed by the society members in September 2015 and are to be published early in 2016, Dr. Matthew Mell of Stanford (Calif.) University Medical Center said at a symposium on vascular surgery sponsored by Northwestern University. The guidelines identify four key components to a successful transfer: an organized inter-facility system of care including rapid triage and transport, defined clinical criteria for transfer, standard resuscitation protocols for the transport, and appropriate resources at the receiving hospital.
During transport, aim for a systolic blood pressure of 70 mm Hg to 90 mm Hg, establish peripheral intravenous access, and avoid aggressive fluid resuscitation, the guidelines advise. Blood products may delay the transfer.
Receiving hospitals should provide a simple and reliable method of referral and have formal protocols in place for the treatment of transferred patients.
Centers that receive patients should have endovascular aortic repair capabilities for ruptured aneurysms, including the ability to perform EVAR under local anesthesia, as well as appropriate facilities and expertise, Dr. Mell said. This advice is based mainly on outcomes observed in the IMPROVE trial (Br J Surg. 2014;101;216-24).
Successful programs tend to repair more than 20-25 ruptures per year, have on-site EVAR inventory, and, for the most part, have vascular surgeons able to perform dual open and endovascular repair. Hospital resources in these successful programs have a single phone number for transfer requests, electronic image transfer, immediately available blood products, hospital policy to accept all requests regardless of bed capacity, a contingency plan to create bed capacity after repair, and real-time management between the transfer center, bed control, and clinicians.
“This is really important because a lot of tertiary centers struggle with bed capacity if bottlenecked and a significant number [about one-third] of transfer requests are declined because of lack of capacity or dedicated room,” Dr. Mell said.
In a more recent study, nearly 20% of 4,439 patients who presented with rAAA in New York, California, and Florida were transferred for definitive care. Transfer rates rose yearly during the study period from 14% in 2005 to 22% in 2010 (J Vasc Surg. 2014;60:553-7).
“Transfer is increasingly utilized as a means for definitive care,” Dr. Mell said.
However, one in six of those transferred died without receiving treatment.
In adjusted analyses, inter-facility transfer was associated with significantly lower mortality when only patients receiving treatment were analyzed (adjusted odds ratio, 0.81; P = .02), but was actually associated with higher mortality when patients who died without treatment were also included (aOR, 1.30; P = .01).
“Outcomes after transfer can be improved by better patient selection and more efficient systems of care,” Dr. Mell concluded. “Guidelines may help; it’s too soon to know, but successful transfer programs require forethought, resources, and alignment of all stakeholders.”
Dr. Mell reported having no conflicts of interest.
EXPERT ANALYSIS FROM THE NORTHWESTERN VASCULAR SYMPOSIUM

Resources limit availability of bone marrow transplants
Peripheral blood is a major stem cell source for hematopoietic stem cell transplantation in many parts of the world – even though bone marrow is preferred – likely due to costs, the need for patient hospitalization, and a lack of trained physicians and necessary equipment for performing bone marrow transplant, Dr. Ayami Yoshimi, and colleagues reported for the Worldwide Network of Blood and Marrow Transplantation.
Peripheral blood stem cells are readily available at transplant centers, as they are collected routinely for other indications, and they offer short-term cost savings due to rapid engraftment, the network reported in a research letter (JAMA. 2016;315[2]:198-200. doi:10.1001/jama.2015.13706).
In patients with nonmalignant disorders, use of peripheral blood stem cells in HSCT has a higher rate of graft-vs.-host disease and lower survival rates.
In the network’s retrospective survey, which they estimate covered 90% of transplants performed in 2009 and 2010, 114,217 HSCTs were reported by 1,482 transplant teams and 3,282 allogeneic HSCTs were performed for bone marrow failure. Use of peripheral blood stem cells in HSCT varied from 80% in countries with low and middle incomes to 50% in those with high-middle incomes to 36% in those with high incomes (P less than .001). For the 3,282 allogeneic HSCTs performed for bone marrow failure worldwide, stem cell sources included bone marrow (1,766, 54%), peripheral blood stem cells (1,336, 41%), and cord blood (180, 5%).
Use of unrelated donors was highest in Europe (515/1107; 47%); use of matched sibling donors was highest in the Eastern Mediterranean region and Africa (249/274; 91%).
Bone marrow was used most commonly in the Americas (631/843; 75%) and in Europe (632/1057; 60%), but not in the Eastern Mediterranean region and Africa (123/266; 46%) and in the Asia Pacific region (380/936; 41%; excluding Japan, 19%).
“National and international transplant organizations and authorities should foster regional accredited bone marrow harvest centers for patients with nonmalignant disorders and provide resources to establish such infrastructures. Unrelated donor registries should provide information on the necessity of bone marrow donation for patients with bone marrow failure,” wrote Dr. Yoshimi of the University of Freiburg, Germany, and colleagues.
Funding for the study was indirectly provided by the Worldwide Network of Blood and Marrow Transplantation. Dr. Yoshimi reported having no disclosures.
FROM JAMA
Key clinical point: In regions with limited resources, peripheral blood stem cells were used more frequently than bone marrow in hematopoietic stem cell transplantation for bone marrow failure.
Major finding: For the 3,282 allogeneic HSCTs performed for bone marrow failure worldwide, stem cell sources included bone marrow (1,766, 54%), peripheral blood stem cells (1,336, 41%), and cord blood (180, 5%).
Data source: Data on 3,282 allogeneic HSCTs for bone marrow failure performed in 2009 and 2010 were collected by retrospective surveys by the Worldwide Network for Blood and Marrow Transplantation, and by direct contact with transplant centers in countries without registries.
Disclosures: Funding was indirectly provided by the Worldwide Network of Blood and Marrow Transplantation. Dr. Yoshimi reported having no disclosures.
Stent-retriever Therapy Improves the Rate of Functional Independence for Acute Ischemic Patients
NEW YORK (Reuters Health) - Stent-retriever therapy for the treatment of acute ischemic stroke improves the rate of functional independence at 90 days, according to a systematic
review and meta-analysis.
Stent retrievers are deployed in an occluded vessel, temporarily expanded into the body of a thrombus, and then retracted along with the thrombus.
Dr. Mark J. Eisenberg, from Jewish General Hospital/McGill University, Montreal, Quebec, Canada, and colleagues compared stent retrievers with intravenous recombinant tissue plasminogen activator (rtPA) versus rtPA alone for the treatment of acute ischemic stroke in their systematic review and meta-analysis of five randomized controlled trials (RCTs) with a total of 1,287 patients.
In all five trials, patients randomized to stent-retriever therapy had significantly better functional independence (a modified Rankin Scale (mRS) score of 0-2) at 90 days than did patients randomized to rtPA alone.
Stent-retriever therapy also doubled the likelihood of a one-unit improvement in mRS score at 90 days, according to the January 25 JAMA Neurology online report.
In pooled analyses, there were no significant differences between treatment groups in all-cause mortality, intracranial hemorrhage, or parenchymal hematoma rates at 90 days.
The number needed to treat to achieve an mRS score of 0 to 2 at 90 days was six.
"Given the totality of the evidence regarding the benefits and risks of stent retrievers, our results suggest that the use of these devices in patients with acute ischemic stroke is warranted," the researchers conclude.
Dr. Raphael A. Carandang, from the University of Massachusetts Medical School, Worcester, who wrote an editorial related to this report, told Reuters Health by email, "The data from these five RCTs (as the meta-analysis confirms) provides level 1 class A evidence that in the properly selected patients, stent retriever treatment is superior to the current standard of care with intravenous rtPA and would endorse that it should be considered in all acute ischemic stroke patients that are eligible for it. As with any therapy, proper patient selection is needed, but I do think it changes the landscape of acute stroke treatment going forward. I think that systems of care should be organized in stroke centers around this new therapy."
"The current technology for acute stroke care has reached the point where effective interventional therapies are clearly and unequivocally beneficial in the properly selected patients, but the key takeaway is still that the patients need to be selected properly, and the biggest factor continues to be time to recanalization, which means that all practitioners and systems of care need to focus on getting patients to treatment sooner than ever before," Dr. Carandang concluded.
Dr. Woong Yoon, from Chonnam National University Hospital, Gwangju, Korea, recently found no improvement in outcomes with stent-retriever therapy for patients with acute anterior circulation stroke (http://bit.ly/1OT7M5I). He told Reuters Health by email, "Not all patients with acute ischemic stroke can benefit from this new treatment. Patients with acute stroke due to occlusions of intracranial large vessels such as internal carotid artery, middle cerebral artery, or basilar artery and who presented within six-eight hours of stroke onset can benefit from thrombectomy with stent retrievers."
"We should realize that we are facing the moment of change in the paradigm for acute stroke treatment," Dr. Yoon concluded."Further refinement in the patient selection for stent retrieverthrombectomy is needed in the near future."
Dr. Mayank Goyal, from the University of Calgary, Alberta, Canada, coauthored two of the studies included in the current review. He told Reuters Health by email," There are several additional data coming out on this issue in the near future, which will in fact be more powerful than what is mentioned in this study."
Dr. Goyal said, "However, the key issues going into the future are: how should those patients who were not included in the current trials be treated; how should we as a collective evaluate new devices/technologies; and how do societies/countries who cannot afford stent retrievers implement endovascular stroke treatment."
Dr. Eisenberg was unavailable for comment.
The authors reported no funding. Three coauthors reported disclosures.