User login
Sharing the lanes
A few weeks ago, Marilyn and I were left in charge of two of our grandchildren, 8 and 10 years old. The morning was overcast and drizzly, eliminating their first choice of going to the college athletic fields to practice their lacrosse skills. A game of Monopoly seemed like a good idea until it became obvious that someone was going to win and that another someone who doesn’t handle defeat very well was going to lose. So off we went to the bowling alley. As we pulled into the sparsely occupied parking lot, the ever-observant 8-year-old noted that almost all of the vehicles were vans.
As we checked in to rent our shoes, the explanation for the vans became clear. It turns out that on Thursday mornings, the bowling alley is the place to be if you are an adult with a mental disability in Brunswick, Maine.

Our grandchildren had a wonderful hour of bowling surrounded by the cacophony created by the several dozen adults with whom we were sharing the lanes. As my wife and I revisited our morning adventure that evening, we recalled how comfortable our grandchildren had been in the midst of a scenario that had the chaotic feel of a Hieronymus Bosch painting.
The explanation for their lack of discomfort lies in the fact that they have grown up in a time and in a town in which the individuals with chromosomal anomalies and birth injury are accepted and cared for in the community and not hidden away in an institution. Our grandchildren’s parents were born as this sea change was just beginning. In fact, when my son was born, I was moonlighting as the night emergency physician at an institution that housed a few hundred of these individuals, many of whom had disabilities similar to those of the folks with whom we had shared the bowling alley. It closed a few years later. And, by the time my son and his sisters entered middle school, they had become accustomed to having classmates with mental disabilities.
The next step in the evolution came when the children who had been “mainstreamed” grew too old for high school and began transitioning to the handful of small group homes that sprang up around the community. It was not always a smooth process and would not have happened without tireless pressure from their parents. Even today, funding and staffing problems continue. Despite initial concerns that some neighborhoods might resist the introduction of a group home, acceptance has not been a problem.
It has almost been a win-win situation. Our citizens with mental disabilities have a far richer life than they would have had in even the most progressive institution. And the rest of us have benefited by learning tolerance from having our challenged family members close by.
However, the transition from institutionalization to community-based support has not been without its downside, particularly for a small town like Brunswick, Maine. Federal and state mandates now place on the shoulders of the school a significant financial burden for the special services required by children with mental disabilities. Small communities with only a few students with disabilities can’t benefit from the economies of scale that allow larger school systems to staff their programs more efficiently and provide more specialized services. Smaller school districts can sometimes pool their resources. But if this solution necessitates transporting the students with mental disabilities out of their own school district to a central location, it runs the risk of robbing the other students, like my grandchildren, of an enriching experience that I wouldn’t want to see them lose.
Dr. Wilkoff practiced primary care pediatrics in Brunswick, Maine, for nearly 40 years. He has authored several books on behavioral pediatrics including “How to Say No to Your Toddler.”
A few weeks ago, Marilyn and I were left in charge of two of our grandchildren, 8 and 10 years old. The morning was overcast and drizzly, eliminating their first choice of going to the college athletic fields to practice their lacrosse skills. A game of Monopoly seemed like a good idea until it became obvious that someone was going to win and that another someone who doesn’t handle defeat very well was going to lose. So off we went to the bowling alley. As we pulled into the sparsely occupied parking lot, the ever-observant 8-year-old noted that almost all of the vehicles were vans.
As we checked in to rent our shoes, the explanation for the vans became clear. It turns out that on Thursday mornings, the bowling alley is the place to be if you are an adult with a mental disability in Brunswick, Maine.
Our grandchildren had a wonderful hour of bowling surrounded by the cacophony created by the several dozen adults with whom we were sharing the lanes. As my wife and I revisited our morning adventure that evening, we recalled how comfortable our grandchildren had been in the midst of a scenario that had the chaotic feel of a Hieronymus Bosch painting.
The explanation for their lack of discomfort lies in the fact that they have grown up in a time and in a town in which the individuals with chromosomal anomalies and birth injury are accepted and cared for in the community and not hidden away in an institution. Our grandchildren’s parents were born as this sea change was just beginning. In fact, when my son was born, I was moonlighting as the night emergency physician at an institution that housed a few hundred of these individuals, many of whom had disabilities similar to those of the folks with whom we had shared the bowling alley. It closed a few years later. And, by the time my son and his sisters entered middle school, they had become accustomed to having classmates with mental disabilities.
The next step in the evolution came when the children who had been “mainstreamed” grew too old for high school and began transitioning to the handful of small group homes that sprang up around the community. It was not always a smooth process and would not have happened without tireless pressure from their parents. Even today, funding and staffing problems continue. Despite initial concerns that some neighborhoods might resist the introduction of a group home, acceptance has not been a problem.
It has almost been a win-win situation. Our citizens with mental disabilities have a far richer life than they would have had in even the most progressive institution. And the rest of us have benefited by learning tolerance from having our challenged family members close by.
However, the transition from institutionalization to community-based support has not been without its downside, particularly for a small town like Brunswick, Maine. Federal and state mandates now place on the shoulders of the school a significant financial burden for the special services required by children with mental disabilities. Small communities with only a few students with disabilities can’t benefit from the economies of scale that allow larger school systems to staff their programs more efficiently and provide more specialized services. Smaller school districts can sometimes pool their resources. But if this solution necessitates transporting the students with mental disabilities out of their own school district to a central location, it runs the risk of robbing the other students, like my grandchildren, of an enriching experience that I wouldn’t want to see them lose.
Dr. Wilkoff practiced primary care pediatrics in Brunswick, Maine, for nearly 40 years. He has authored several books on behavioral pediatrics including “How to Say No to Your Toddler.”

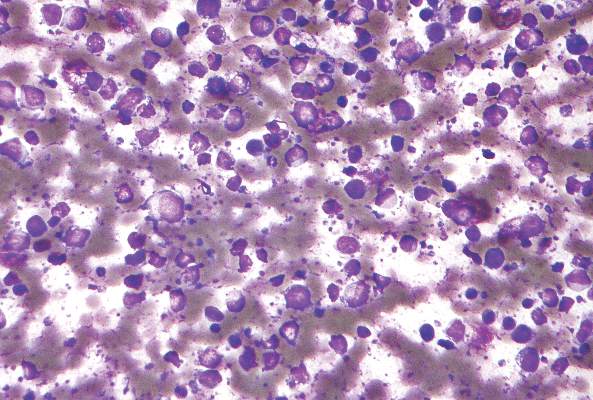
Dose-escalated blinatumomab plus dexamethasone induced responses in relapsed/refractory DLBCL
Blinatumomab, administered in a stepwise, dose-escalated regimen with prophylactic dexamethasone, induced responses in patients with relapsed/refractory diffuse large B-cell lymphoma (DLBCL), according to a report published in Blood.
The phase II study included 25 patients who were refractory to their last treatment, had relapsed after autologous hematopoietic stem cell transplant (HSCT), or had relapsed disease and were ineligible for autologous HSCT.
In a previous phase I study that did not use a dose-escalated regimen, neurological adverse events were dose limiting at a maximum tolerated blinatumomab dose of 60 mcg/d. The current study used a 14-day stepwise dose escalation and corticosteroid premedication to minimize adverse events: blinatumomab was given at 9 mcg/d in the first week, 28 mcg/d in the second week, and 112 mcg/d thereafter.
Patients had received a median of three prior therapies. In total, 17 of 25 patients ended in cycle 1 (induction) because of disease progression, adverse events, or physician decision; 7 ended in cycle 2 (consolidation), and 1 ended in retreatment.
Among the 21 evaluable patients who received at least 1 week of blinatumomab at the target dose of 112 mcg/day or who discontinued treatment earlier because of progressive disease, the overall response rate was 43% (9/21) and the complete response rate was 19% (4/21). “At least 1 week of treatment at the target dose of 112 mcg/d appears to be required for efficacy,” wrote Dr. Andreas Viardot of the department of internal medicine III, University Hospital Ulm (Germany) and colleagues (Blood. 2016;127(11):1410-16).
The most common adverse events of grade 3 or higher were thrombocytopenia (17%) and leukopenia (17%). Grade 3 neurologic events included encephalopathy (9%) and aphasia (9%); no grade 4 or 5 neurologic events were reported. Cytokine release syndrome or cytokine storm were not reported.
Blinatumomab (Blincyto) is a bispecific T-cell engager antibody approved for the treatment of Philadelphia chromosome-negative relapsed or refractory B-cell precursor acute lymphoblastic leukemia. Blinatumomab transiently links CD3-positive T cells to CD19-positive B cells, which activates T cells and leads to T cell–mediated lysis of tumor cells and concomitant T-cell proliferation.
The study was supported by Amgen, the maker of Blincyto. Dr. Viardot reported having financial ties with Amgen and several other drug companies.
FROM BLOOD
Key clinical point: Stepwise dose-escalated administration of blinatumomab plus dexamethasone may be effective in patients with relapsed/refractory diffuse large B-cell lymphoma (DLBCL).
Major finding: The overall response rate in 21 evaluable patients was 43% and the complete response rate was 19%.
Data sources: Phase II study of 25 patients who had received a median of three prior therapies.
Disclosures: The study was supported by Amgen, the maker of blinatumomab. Dr. Viardot reported having financial ties with Amgen and several other drug makers.

System reduces risk of transfusion-transmitted malaria
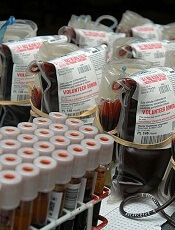
Photo by Daniel Gay
A pathogen-reduction system can safely minimize the risk of malaria transmitted via blood transfusion, according to a randomized trial.
The Mirasol pathogen-reduction technology system uses ultraviolet light energy and riboflavin to reduce the pathogen load and inactivate white blood cells in blood products.
In the current study, the system significantly reduced the transmission of malaria-causing Plasmodium parasites in patients receiving whole blood.
“This is the first study to look at the potential of pathogen-reduction technology in a real-world treatment setting and finds that, although the risk of malaria transmission is not completely eliminated, the risk is severely reduced,” said Jean-Pierre Allain, MD, of the University of Cambridge in the UK.
Dr Allain and his colleagues described this research in The Lancet. The work was funded by TerumoBCT Inc., the company developing the Mirasol system.
The trial included 223 adult patients from the Komfo Anokye Teaching Hospital in Kumasi, Ghana, who required a blood transfusion because of severe anemia or hemorrhage and were expected to remain in the hospital for at least 3 consecutive days after the initial transfusion.
The patients were randomized via computer to receive a transfusion with pathogen-reduced whole blood (treated) or whole blood that was prepared and transfused by standard local practice (untreated). Patients, healthcare providers, and data collectors were blinded to the treatment allocation.
The researchers analyzed blood samples for all of the recipients on the day of the transfusion and 1, 3, 7, and 28 days later. By studying the sequences of Plasmodium genes present in the blood, the team was able to tell whether the patients were likely to be carrying the donor parasite after the transfusion.
In all, 214 patients completed the protocol as planned—107 who received treated blood and 107 who received untreated blood.
A total of 65 patients were not previously carrying a Plasmodium parasite but received parasitemic blood. Twenty-eight of these patients received treated blood, and 37 received untreated blood.
The incidence of transfusion-transmitted malaria was significantly lower for the group that received the treated blood. Twenty-two percent of patients (8/37) who received untreated blood later tested positive for the malaria parasite, compared with 4% (1/28) of patients who received treated blood (P=0.039).
The researchers noted that coagulation parameters, platelet counts, and hemostatic status were similar whether patients received treated or untreated blood.
The Mirasol system did not appear to affect the coagulation properties of the blood, and patients who received the treated blood had slightly fewer allergic reactions than those who received the untreated blood (5% vs 8%).
The percentage of patients reporting at least 1 treatment-emergent adverse event (TEAE) was similar between the groups—43% in the treated-blood group and 39% in the untreated-blood group.
Likewise, there were no significant differences between the groups in the incidence of serious TEAEs (12% vs 8%), life-threatening TEAEs (3% for both), hospital admission (5% vs 4%), or death (7% vs 5%). The researchers noted that none of the deaths were related to transfusion or pathogen-reduction technology.
The team said additional studies of this technology are needed in larger populations—in particular, at-risk populations such as young children and pregnant mothers. ![]()
Improper Removal of Personal Protective Equipment Can Be Hazardous to Your Health
Clinical question: How frequent is contamination of skin and clothing during personal protective equipment (PPE) removal, and can it be prevented?

Background: PPE reduces transmission of pathogens to healthcare personnel and patients. However, improper removal can lead to contamination of the skin and clothing. Little information exists describing the frequency and sites of contamination after the removal of gloves or gowns.
Study design: Point prevalence study and quasi-experimental intervention.
Setting: Four northeast Ohio hospitals (university, community, county, and VA); intervention performed at VA hospital.
Synopsis: This study began with 435 glove and gown removal simulations performed at four northeast Ohio hospitals. Skin or clothing contamination occurred in 200 (46%) simulations, with similar frequencies across the four hospitals (42.5%–50.3%). Contamination occurred more frequently in the glove removal versus gown removal (52.9% versus 37.8%, P=0.002). Most common causes of contamination were gloves not covering the wrists, removing the gown over the head, donning gloves before the gown, and touching contaminated gloves.
The intervention, performed at the VA hospital, consisted of educational sessions, videos, demonstrations, and practice donning and doffing PPE, which resulted in reduced skin and clothing contamination (60% before versus 18.9% after, P<0.001) that was sustained at one and three months.
Given that the intervention was quasi-experimental and not randomized, it is difficult to attribute
causality to the intervention, and results must be interpreted with caution.
Bottom line: During the removal of gloves and gowns, skin and clothing contamination is frequent, and a simple educational intervention with visual feedback may reduce rates of contamination.
Citation: Tomas ME, Kundrapu S, Thota P, et al. Contamination of health care personnel during removal of personal protective equipment. JAMA Intern Med. 2015;175(12):1904-1910.
Clinical question: How frequent is contamination of skin and clothing during personal protective equipment (PPE) removal, and can it be prevented?
Background: PPE reduces transmission of pathogens to healthcare personnel and patients. However, improper removal can lead to contamination of the skin and clothing. Little information exists describing the frequency and sites of contamination after the removal of gloves or gowns.
Study design: Point prevalence study and quasi-experimental intervention.
Setting: Four northeast Ohio hospitals (university, community, county, and VA); intervention performed at VA hospital.
Synopsis: This study began with 435 glove and gown removal simulations performed at four northeast Ohio hospitals. Skin or clothing contamination occurred in 200 (46%) simulations, with similar frequencies across the four hospitals (42.5%–50.3%). Contamination occurred more frequently in the glove removal versus gown removal (52.9% versus 37.8%, P=0.002). Most common causes of contamination were gloves not covering the wrists, removing the gown over the head, donning gloves before the gown, and touching contaminated gloves.
The intervention, performed at the VA hospital, consisted of educational sessions, videos, demonstrations, and practice donning and doffing PPE, which resulted in reduced skin and clothing contamination (60% before versus 18.9% after, P<0.001) that was sustained at one and three months.
Given that the intervention was quasi-experimental and not randomized, it is difficult to attribute
causality to the intervention, and results must be interpreted with caution.
Bottom line: During the removal of gloves and gowns, skin and clothing contamination is frequent, and a simple educational intervention with visual feedback may reduce rates of contamination.
Citation: Tomas ME, Kundrapu S, Thota P, et al. Contamination of health care personnel during removal of personal protective equipment. JAMA Intern Med. 2015;175(12):1904-1910.

Procalcitonin Testing Can Lead to Cost Savings
Clinical question: Can procalcitonin testing be used to determine whether antibiotics should be started and stopped?
Background: Procalcitonin naturally occurs in the body but increases with bacterial infection, with normal levels
Study design: Systematic review.
Setting: ICUs and EDs in Europe, China, and Brazil.
Synopsis: A systematic review of eight RCTs in the ICU showed that, in adults, procalcitonin testing decreased antibiotic duration (weighted mean difference [WMD] -3.2 days; 95% CI, -5.44 to -0.95), decreased hospital length of stay (WMD -3.85 days; 95% CI, -6.78 to -0.92), and trended toward decreased ICU length of stay (WMD -2.03 days; 95% CI, -4.19 to 0.13).
Further review of eight different trials looking at procalcitonin testing in the ED showed that, in adults with suspected bacterial infection, procalcitonin testing reduced proportion of adults receiving antibiotics (relative risk 0.77; 95% CI, 0.68–0.87) and a trend toward reduction in hospital stays. No strong conclusions could be made about the effect on duration of antibiotic therapy. Procalcitonin testing was demonstrated to be cost-effective in the study population, saving £3,268 in adults with sepsis in the ICU.
Most studies were of unclear quality and unclear risk of bias secondary to insufficient reporting; therefore, results must be interpreted with caution.
Bottom line: Procalcitonin testing may be a cost-saving measure for adults with sepsis in the ICU and adults with possible bacterial infections in the ED.
Citation: Westwood M, Raemaekers B, Whiting P, et al. Procalcitonin testing to guide antibiotic therapy for the treatment of sepsis in intensive care settings and for suspected bacterial infection in emergency department settings: a systematic review and cost-effectiveness analysis. Health Technol Assess. 2015;19(96):1-236.
Short Take
Adjuvant Flu Vaccine Approved for Prevention of Seasonal Influenza
The FDA approved Fluad, an adjuvanted trivalent vaccine, for the prevention of seasonal influenza in patients >65 years of age based on studies showing comparable safety and immunogenicity to Agriflu, a FDA-approved unadjuvanted trivalent vaccine.
Citation: FDA approves first seasonal influenza vaccine containing an adjuvant [news release]. Washington, DC: FDA; November 24, 2015
Medicaid is Likely to Benefit Low-income Adults in the U.S. Under the Affordable Care Act
NEW YORK (Reuters Health) - Low-income adults in the U.S. likely benefited if their states expanded Medicaid in 2014 under the Affordable Care Act, suggests a new study.
Researchers found increased rates of insurance coverage, healthcare use, and chronic disease diagnoses among low-income adults in states that expanded access to the government-funded health insurance program.
"It looks like there is better medical care for these adults," said lead author Dr. Laura Wherry, of the David Geffen School of Medicine at the University of California, Los Angeles.
A key provision of the Affordable Care Act (ACA), sometimes referred to as Obamacare, was to force states to expand their Medicaid programs by 2014. But with a Supreme Court decision allowing states to opt out of the expansion, only 26 states actually expanded their Medicaid programs.
For the new study, the researchers analyzed 2010-2014 survey data collected from low-income U.S. adults ages 19 to 64.
In the pre-expansion era, from 2010-2013, about 33% had no insurance in states that ultimately expanded Medicaid, compared to about 42% in states that opted out of expansion, according to an article online April 18 in Annals of Internal Medicine.
In 2014, those rates fell to about 18% in states that expanded Medicaid andabout 34% in states that didn't.
Overall, the uninsured rate fell by about 7 percentage points more in states that expanded Medicaid than in those that didn't.
States with expanded Medicaid coverage also had a larger increase in the proportion of people who thought their insurance coverage improved over the previous year.
Additionally, there was evidence that people in states with expanded Medicaid programs were using their coverage, because they had larger increases in interactions with general physicians and overnight hospital stays.
There were also more diagnoses of diabetes and high cholesterol in states with expanded Medicaid programs.
Gaining insurance likely leads to more screening for these conditions, and more diagnoses may lead to early treatment and important downstream health effects, Dr. Jeffrey Kullgren wrote in an editorial.
The new study shows what's happening in states that expand Medicaid and "what is foregone by states that reject the ACA's opportunity to expand Medicaid," write Kullgren, of the University of Michigan Medical School and the Veterans Affairs Ann Arbor Health System.
While the new study did not show that people felt healthier in expanded-Medicaid states, Dr. Wherry said it may be too early to see changes in that measure.
"I think long-term follow up will be very important," she said. The results help confirm the value of the ACA for people who obtain this coverage, said Dr. John McDonough, who worked on the ACA but was not involved with the new study.
He said the new findings likely won't convince reluctant states to expand their Medicaid programs, however.
"It's not about evidence at this point," said Dr. McDonough, who is a professor at the Harvard T.H. Chan School of Public Health in Boston. "It's about a political fear over Obamacare that at this point is not influenceable by meaningful evidence."
The authors reported no funding or disclosures.
Creating a better mouse model

Researchers believe they may have discovered why medical interventions that succeed in mice don’t always translate to the clinic.
The team said the fact that lab mice are raised in pathogen-free environments may contribute to the differences in immune system development between lab mice and humans.
But co-housing lab mice with mice from pet stores can produce “dirty” mouse models that may better reflect the immune systems of adult humans.
David Masopust, PhD, of the University of Minnesota in Minneapolis, and his colleagues described these findings in a letter to Nature.
The researchers first explored immunological differences between lab mice and humans by analyzing cervical tissue specimens from adults of each species.
The team found that lab mice had fewer, less diverse, and less widely distributed memory T cells when compared with humans.
The immune systems of lab mice more closely resembled those of human infants, particularly with regard to the number and tissue distribution of memory T cells.
The researchers performed a similar analysis on tissues from lab mice and from mice found in barn or pet store environments.
The non-lab mice had immune systems more like those of adult humans, which suggests the variation in microbial environment—and not the species difference—could account for the immune system differences.
The researchers then set out to determine if the immune systems of lab mice with little exposure to environmental microbes could change when exposed to a different environment.
They co-housed lab mice with healthy mice raised in a pet store. After 8 weeks, analyses of the lab mice revealed patterns of T cells and other immune system components that more closely matched the pet store mice as well as adult humans.
The researchers said these findings suggest that “dirty” mice may model the human immune system more closely than typical lab mice and could be studied to learn more about the role of environment and genetics in the development of the human immune system. ![]()
Gene therapy can increase FVIII levels

Preliminary data from a phase 1/2 study suggest an investigational gene therapy can increase factor VIII (FVIII) levels in patients with severe hemophilia A.
The therapy, BMN 270, is a recombinant adeno-associated virus (AAV) vector coding for FVIII.
To date, 8 patients have received a single dose of BMN 270, and most have experienced an increase in FVIII levels and a decrease in the severity of their disease.
At last observation, patients receiving the highest dose of BMN 270 experienced increasing FVIII activity levels ranging between 4% and 60% (as a percentage calculated based on the numbers of International Units (IU) per milliliter of whole blood).
These results were recently announced by BioMarin Pharmaceutical Inc., the company developing BMN 270.
“If BMN 270 allows hemophilia A patients to maintain around 5% of normal levels of FVIII, it could have a real and meaningful clinical benefit by reducing the need for FVIII infusions and spontaneous bleeds,” said study investigator John Pasi, PhD, of Barts and the London School of Medicine and Dentistry in the UK.
“I am looking forward to further assessing the data over the 16 weeks and beyond in this ongoing study.”
This dose-escalation study was designed to evaluate the safety and efficacy of BMN 270 gene therapy in up to 12 patients with severe hemophilia A.
The primary endpoints are to assess the safety of a single intravenous administration of a recombinant AAV vector coding for FVIII and determine the change from baseline of FVIII expression level at 16 weeks after infusion.
Secondary endpoints include assessing the impact of BMN 270 on the frequency of FVIII replacement therapy, the number of bleeding episodes requiring treatment, and any potential immune responses. Researchers plan to monitor patients for safety and durability of effect for 5 years.
Results
A total of 8 patients with severe hemophilia A have received a single dose of BMN 270—one at 6 x 10¹² vg/kg, one at 2 x 10¹³ vg/kg, and six at 6 x 10¹³ vg/kg.
At 20 weeks after administration, the patient who received the lowest dose of BMN 270 had a FVIII activity level of less than 1% and still had severe hemophilia.
At 16 weeks, the patient who received the middle dose of BMN 270 had a FVIII activity level of 2% and moderate hemophilia.
One patient in the highest dose group also had moderate hemophilia and a FVIII activity level of 4% at 7 weeks.
Three patients in the high-dose group had mild hemophilia and FVIII activity levels of 8%, 10%, and 21% at 7, 5, and 6 weeks, respectively.
And 2 patients in the high-dose group had normal levels of FVIII activity—57% at 16 weeks and 60% at 8 weeks.
Liver function
The researchers have monitored liver function tests closely during the trial. The first 3 patients did not receive prophylactic corticosteroids, and 2 of these patients experienced elevated alanine aminotransferase (ALT) levels.
Patient 3, the first patient treated at the highest dose level, experienced a mild ALT elevation at week 4, which prompted administration of a course of corticosteroids. ALT levels in this patient continued to rise modestly during the corticosteroid therapy, which was completed at week 14.
Two weeks later, Patient 3 began a new corticosteroid regimen when ALT levels became minimally abnormal for the first time. The expression of FVIII continued to increase during this ALT elevation and is currently at 57%.
In addition, Patient 1, who was treated at the lowest dose of BMN 270, experienced a rise in ALT level to 128 IU/L at 28 weeks after dosing.
After the third patient, all patients were started on prophylactic corticosteroid therapy. To date, no additional patients have experienced abnormal ALT levels.
BioMarin said it plans to discuss these findings with UK regulatory authorities prior to dosing the remaining patients.
“We are encouraged by this early data on BMN 270 and the trend we are seeing in increasing FVIII levels over time,” said Hank Fuchs, MD, chief medical officer at BioMarin.
“BMN 270 could have the potential to reduce and possibly eliminate the need for infusions of FVIII.”
BMN 270 has received orphan drug designation from the European Commission and US Food and Drug Administration. Phase 3 design preparation and high-volume manufacturing plans are underway. ![]()
Chronic conditions decrease HRQOL in CCSs

Photo from Dana-Farber/
Boston Children’s Cancer
and Blood Disorders Center
Young adult survivors of childhood cancer tend to have inferior health-related quality of life (HRQOL) when compared to the general population, according to research published in the Journal of the National Cancer Institute.
Childhood cancer survivors (CCSs) ages 18 to 29 reported overall HRQOL similar to that of people from the general population who were in their 40s.
However, CCSs fared better if they did not have chronic health conditions.
“Our findings indicate survivors’ accelerated aging and also help us understand the health-related risks associated with having had cancer as a child,” said study author Lisa Diller, MD, of Dana-Farber/Boston Children’s Cancer and Blood Disorders Center and Harvard Medical School in Boston, Massachusetts.
“What’s encouraging is that the lower quality of life scores are associated with chronic disease after treatment, not with a history of pediatric cancer itself. If we can prevent treatment-related conditions by changes in the therapy we use for the cancer, then childhood cancer will become an acute, rather than a chronic, illness.”
Dr Diller and her colleagues used information from the Childhood Cancer Survivor Study to compare CCSs (n=7105) and their siblings (n=372) and information from the Medical Expenditures Panel Survey to make comparisons to the general population (n=12,803).
The researchers estimated health utility, a summary measure of quality of life, in these subjects using the Short Form-6D (SF-6D). A score of “1” indicated perfect health, and a score of “0” indicated death.
Results showed that CCSs had significantly lower SF-6D scores than the general population. The mean scores were 0.77 and 0.81, respectively (P<0.001).
But there were no clinically meaningful differences between the CCSs’ siblings and the general population. Their mean SF-6D scores were 0.80 and 0.81, respectively.
Young adult CCSs ages 18 to 29 had a mean score of 0.78, which was roughly equivalent to that reported for 40-to-49-year-old adults in the general population.
However, the presence or absence of chronic health conditions played a role in HRQOL. CCSs who reported no chronic conditions had SF-6D scores similar to the general population, with a mean score of 0.81.
But CCSs with chronic conditions had scores that matched the scores of chronically ill members of the general population. CCSs with 2 chronic conditions had a mean score of 0.77. Those with 3 or more disabling, severe, or life-threatening conditions had a mean score of 0.70.
“By enabling comparisons to the general population, our findings provide context to better understand how the cancer experience may influence the long-term well-being of survivors,” said study author Jennifer Yeh, PhD, of the Harvard T.H. Chan School of Public Health in Boston.
“This is another way to understand the health challenges survivors face and where to focus efforts to improve the long-term health and quality of life of survivors.” ![]()
Pathogen-reduced blood may cut transfusion-transmitted malaria
A method for reducing pathogens present in whole blood used for transfusions may reduce the incidence of malaria transmission, and also provide clinical support for patients with severe anemia or hemorrhage, according to the results of a prospective study published April 22 in the Lancet.
“This study is the first to show pathogen reduction treatment of whole blood for transfusion resulted in reduced transmission of a blood-borne infectious parasite in a region hyperendemic for malaria,” wrote Dr. Jean-Pierre Allain of the department of hematology at the University of Cambridge (England) and his coauthors.
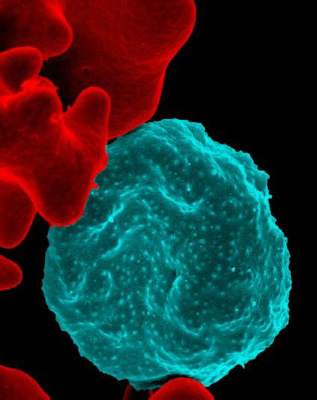
The investigators examined the safety and efficacy of the Mirasol pathogen reduction technology system in the African Investigation of the Mirasol System (AIMS) trial. Between March 12, 2014, and November 7, 2014, 227 adults from Ghana with blood group O+ were admitted to the Komfo Anokye Teaching Hospital in Kumasi, and enrolled in this prospective, randomized, parallel-group, double-blind, controlled study of transfusion-transmission of malaria. The patients underwent up to two whole blood transfusions with either pathogen-reduced whole blood (treated), or whole blood prepared and transfused by standard local practice (untreated), within 3 days following randomization. (Lancet. 2016 Apr 23;387:1753-61).
Of the patients completing the study protocol and included in the subsequent primary endpoint analysis, 65 nonparasitemic patients were exposed to parasitemic whole blood (28 treated and 37 untreated) and compared with 99 nonparasitemic control patients who received nonparasitemic whole blood (55 treated and 44 untreated), reported Dr. Allain.
The investigators found that the incidence of transfusion-transmitted malaria was significantly lower for the nonparasitemic patients receiving parasitemic whole blood, than for the nonparasitemic control patients who received nonparasitemic whole blood. Of the 65 patients transfused with parasitemic whole blood, 1 of the 28 treated patients (4%) and 8 of the 37 untreated patients (22%) were found to have contracted transfusion-transmitted malaria. Additionally, the safety profiles of the patients receiving treated or untreated whole blood did not differ and no transfusion-related fatalities occurred.
In developing countries, blood supplies are often contaminated by infectious agents, and blood banking systems cannot afford the newest nucleic acid detection technologies for blood-borne pathogens, the investigators wrote. They suggested that technologies designed to reduce pathogens present in whole blood may be of clinical benefit to both individual patients and health care systems. The use of such methods could result not only in better patient outcomes, but also in greater stability in blood supplies, as well as an associated decrease in treatment costs attributable to reductions in preventable infections.
Funding for this project was provided by Terumo BCT, which produces the Mirasol system. All but one of the coauthors disclosed financial ties to the funding source.
The results from the study by Dr. Allain and his associates should prompt efforts to introduce pathogen-reducing technologies for whole blood, red blood cells, or both.
Hope for this anticipated progress in pathogen reduction technology should be growing based on the two pathogen reduction technology systems in development, one of which was used in the study by Dr. Allain and his colleagues (Mirasol; Terumo BCT, Lakewood, Colo.). This method uses riboflavin (vitamin B2) and ultraviolet light to inactivate pathogens in whole blood. The other method (Intercept; Cerus, Concord, Calif.) uses a chemical compound, S-303, and glutathione in the red blood cell product.
The risk that blood recipients in Africa must accept, especially children, would be considered an intolerable risk in developed countries, and pathogen reduction technology that preserves the clinical benefits of transfusion could revolutionize transfusion safety where it is most needed.
Dr. Sheila O’Brien is director of National Epidemiology and Surveillance at Canadian Blood Services and adjunct faculty at the University of Ottawa. She reported having no conflicts of interest. These remarks are adapted from her editorial accompanying the article (Lancet. 2016 Apr 23;387:1701-3).
A method for reducing pathogens present in whole blood used for transfusions may reduce the incidence of malaria transmission, and also provide clinical support for patients with severe anemia or hemorrhage, according to the results of a prospective study published April 22 in the Lancet.
“This study is the first to show pathogen reduction treatment of whole blood for transfusion resulted in reduced transmission of a blood-borne infectious parasite in a region hyperendemic for malaria,” wrote Dr. Jean-Pierre Allain of the department of hematology at the University of Cambridge (England) and his coauthors.
The investigators examined the safety and efficacy of the Mirasol pathogen reduction technology system in the African Investigation of the Mirasol System (AIMS) trial. Between March 12, 2014, and November 7, 2014, 227 adults from Ghana with blood group O+ were admitted to the Komfo Anokye Teaching Hospital in Kumasi, and enrolled in this prospective, randomized, parallel-group, double-blind, controlled study of transfusion-transmission of malaria. The patients underwent up to two whole blood transfusions with either pathogen-reduced whole blood (treated), or whole blood prepared and transfused by standard local practice (untreated), within 3 days following randomization. (Lancet. 2016 Apr 23;387:1753-61).
Of the patients completing the study protocol and included in the subsequent primary endpoint analysis, 65 nonparasitemic patients were exposed to parasitemic whole blood (28 treated and 37 untreated) and compared with 99 nonparasitemic control patients who received nonparasitemic whole blood (55 treated and 44 untreated), reported Dr. Allain.
The investigators found that the incidence of transfusion-transmitted malaria was significantly lower for the nonparasitemic patients receiving parasitemic whole blood, than for the nonparasitemic control patients who received nonparasitemic whole blood. Of the 65 patients transfused with parasitemic whole blood, 1 of the 28 treated patients (4%) and 8 of the 37 untreated patients (22%) were found to have contracted transfusion-transmitted malaria. Additionally, the safety profiles of the patients receiving treated or untreated whole blood did not differ and no transfusion-related fatalities occurred.
In developing countries, blood supplies are often contaminated by infectious agents, and blood banking systems cannot afford the newest nucleic acid detection technologies for blood-borne pathogens, the investigators wrote. They suggested that technologies designed to reduce pathogens present in whole blood may be of clinical benefit to both individual patients and health care systems. The use of such methods could result not only in better patient outcomes, but also in greater stability in blood supplies, as well as an associated decrease in treatment costs attributable to reductions in preventable infections.
Funding for this project was provided by Terumo BCT, which produces the Mirasol system. All but one of the coauthors disclosed financial ties to the funding source.
FROM THE LANCET
Key clinical point: The incidence of transfusion-transmitted malaria can be reduced by treating whole blood with a pathogen reduction system.
Major finding: Patients receiving pathogen-reduced whole blood had a lower incidence of transfusion-transmitted malaria (4%) than those who received standard treatment (22%).
Data source: Patients with anemia from a single center in Ghana being supported with whole blood transfusion.
Disclosures: Funding for this project was provided by Terumo BCT, which produces the Mirasol system. All but one of the coauthors disclosed ties to the funding source.
