User login
Overtreatment of Nonpurulent Cellulitis
The Things We Do for No Reason (TWDFNR) series reviews practices which have become common parts of hospital care but which may provide little value to our patients. Practices reviewed in the TWDFNR series do not represent black and white conclusions or clinical practice standards, but are meant as a starting place for research and active discussions among hospitalists and patients. We invite you to be part of that discussion. https://www.choosingwisely.org/
A 65‐year‐old immunocompetent man with a history of obesity, diabetes, and chronic lower extremity edema presents to the emergency room with a 1‐day history of right lower extremity pain and increased swelling. He reports no antecedent trauma and states he just noticed the symptoms that morning. On examination, he appears generally well. His temperature is 100F, pulse 92 beats per minute, blood pressure 120/60 mm Hg, and respiratory rate 16 breaths per minute. The rest of the exam is notable for right lower extremity erythema and swelling extending from his right shin to his right medial thigh without associated fluctuance or drainage. Labs reveal a mildly elevated white blood cell count of 13,000/L and normal serum creatinine. Are broad‐spectrum antibiotics like vancomycin and piperacillin/tazobactam the preferred regimen?
BACKGROUND
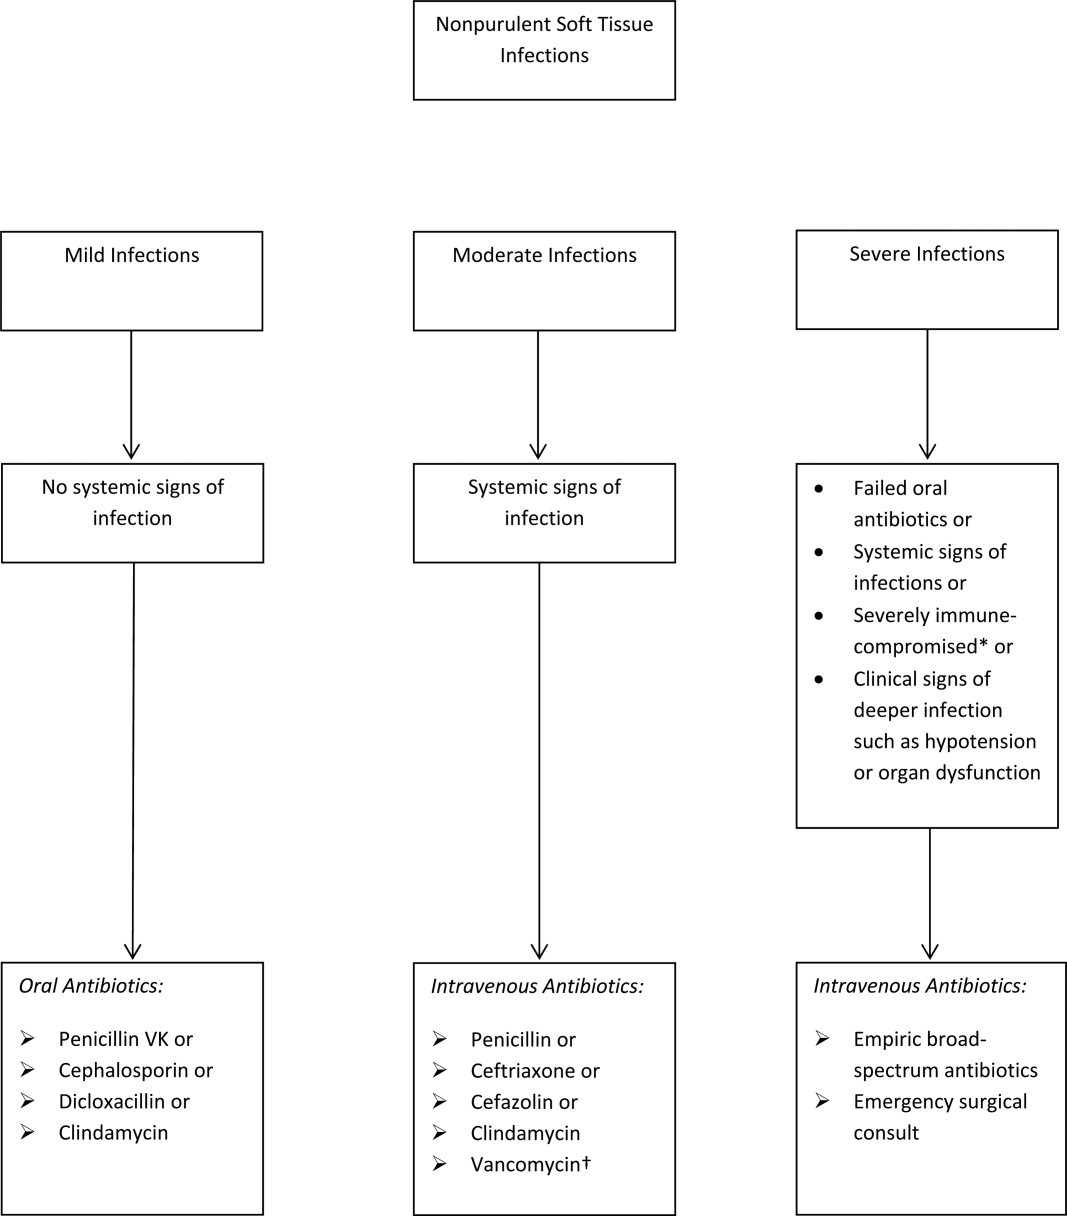
The term skin and soft tissue infection (SSTI) includes a heterogeneous group of infections including cellulitis, cutaneous abscess, diabetic foot infections, surgical site infections, and necrotizing soft tissue infections. As a group, SSTIs are the second most common type of infection in hospitalized adults in the United States behind pneumonia and result in more than 600,000 admissions per year.[1] The current guideline on SSTIs by the Infectious Disease Society of America (IDSA) makes the distinction between purulent and nonpurulent soft tissue infections based on the presence or absence of purulent drainage or abscess and between mild, moderate, and severe infections based on the presence and severity of systemic signs of infection.[2] Figure 1 provides an overview of the IDSA recommendations.
THE PROBLEM: OVERUSE OF BROAD‐SPECTRUM ANTIBIOTICS
Studies over the past decade have shown that the majority of patients hospitalized with SSTI receive broad‐spectrum antibiotics, usually with combinations of antibiotics active against gram‐positive (including methicillin‐resistant Staphylococcus aureus [MRSA]), gram‐negative (often including Pseudomonas aeruginosa), and anaerobic organisms. Broad‐spectrum treatment occurs despite guidelines from the IDSA, which state that the most common pathogens for nonpurulent cellulitis are ‐hemolytic streptococci, which remain susceptible to penicillin.[2, 3] One multicenter study of hospitalized adults with nonpurulent cellulitis, for example, reported that 85% of patients received therapy effective against MRSA (primarily vancomycin), 61% received broad gram‐negative coverage (primarily ‐lactam with ‐lactamase inhibitor), and 74% received anaerobic coverage.[4] Another multicenter study reported that the most common antibiotics given for cellulitis (excluding cases associated with cutaneous abscess) were vancomycin (60%), ‐lactam/‐lactamase combinations (32%), and clindamycin (19%). Only 13% of patients with cellulitis were treated with cefazolin, and only 1.1% of patients were treated with nafcillin or oxacillin.[5] According to the Centers for Disease Control and Prevention, unnecessary antibiotic use is associated with increased cost, development of antibiotic resistance, and increased rates of Clostridium difficile.[6]
The current use of broad‐spectrum antibiotics for nonpurulent cellulitis is likely due to several factors, including the emergence of community‐associated (CA)‐MRSA, confusion due to the heterogeneity of SSTI, and the limited data regarding the microbiology of nonpurulent cellulitis. The resulting uncertainty about cellulitis has been termed an existential crisis for the treating physician and is likely the single biggest factor behind the out‐of‐control prescribing.[7]
The Emergence of CA‐MRSA
Over the past decade, numerous studies have reported the increasing frequency of CA‐MRSA soft tissue infections, predominantly with the pulsed‐field gel electrophoresis type USA‐300. Originally, MRSA infections were limited to nosocomial infections. Subsequent multicenter studies from the United States have shown that CA‐MRSA is the most frequent pathogen isolated from purulent soft tissue infections presenting to emergency rooms[8] and the most frequent pathogen isolated from SSTI specimens in labs.[9] Many authors have therefore concluded that empiric antibiotics for SSTI should include coverage for MRSA.[8, 9]
Heterogeneity of SSTI
As already discussed, the term SSTI is an umbrella term that encompasses several types of clinically distinct infections. The only commonality between the SSTI is that that they all involve the skin and soft tissues in some way. Diabetic foot infections, cutaneous abscesses, surgical site infections, and nonpurulent cellulitis have different hosts, pathophysiology, clinical presentations, and microbiology. At one end of the spectrum is the cutaneous abscess, which is readily culturable through incision and drainage. At the other end of the spectrum is cellulitis, which is typically nonculturable. Unfortunately, studies of SSTI tend to lump all of these entities together when reporting microbiology. The landmark study by Moran et al., for example, described the microbiology of purulent soft tissue infections presenting to a network of emergency rooms across the county. Although all patients had by definition purulent infections, and 81% were abscesses, the authors made broad conclusions about skin and soft tissue infections in general and recommended antimicrobials effective against MRSA for empiric coverage for SSTIs.[8]
Uncertainty About the Microbiology of Nonpurulent Cellulitis
What then is the microbiology of nonpurulent cellulitis? As stated in the 2005 and 2014 IDSA guidelines, traditional teaching remains that nonpurulent cellulitis is primarily due to ‐hemolytic streptococci.[2, 3] Studies using needle aspiration have yielded conflicting results, although a systematic review of these studies concluded that S aureus was the most common pathogen.[10] On the other hand, a systematic review of positive blood cultures of patients identified as having cellulitis found that 61% were due to ‐hemolytic streptococci, and only 15% were due to S aureus.[11] Both reviews, however, comment on the limited quality of the included studies. Ultimately, because nonpurulent soft tissue infections are basically nonculturable, their true microbiologic etiology remains uncertain. Given this uncertainty, as well as the impressive evidence for CA‐MRSA causing cutaneous abscesses, along with the confusion about types of SSTI, it is not surprising that front‐line clinicians have resorted to prescribing broad‐spectrum antibiotics.
THE SOLUTION: NARROW‐SPECTRUM ANTIBIOTICS FOR MOST
Although studies of the microbiology of cellulitis remain inconclusive, several recent clinical trials have indicated that treatment with antimicrobials limited to ‐hemolytic streptococci and methicillin‐susceptible S aureus (MSSA) are as effective as antimicrobials against MRSA. A prospective study from 2010 of consecutive hospitalized adults with nonpurulent cellulitis found that 73% had serologic evidence for streptococcal infection, and overall 95.8% responded to cefazolin monotherapy.[12] More recently, a study of emergency room patients with nonpurulent cellulitis randomized patients to cephalexin alone or cephalexin plus trimethoprim‐sulfamethoxazole. These authors found no difference in response rates and concluded that the addition of anti‐MRSA therapy (trimethoprim‐sulfamethoxazole, in this study) for uncomplicated cellulitis was unnecessary.[13] This later study is the only randomized controlled study to assess the need for MRSA coverage for cellulitis, and the answer for outpatients, at least, is that MRSA coverage is unnecessary. Both of these studies are cited by the IDSA guideline from 2014, which recommends antibiotics for mild‐moderate cellulitis to be limited to antimicrobials effective against ‐hemolytic streptococci and MSSA. The guideline specifically does not recommend routinely treating for MRSA, gram‐negative, or anaerobic organisms citing lack of benefit as well as risks of antibiotic resistance and C difficile infection. A recent study from the University of Utah reported the development of a cellulitis order set, which included a pathway for nonpurulent cellulitis based on the use of cefazolin. These authors reported that the use of the pathway was associated with a 59% decrease in the use of broad‐spectrum antibiotics, a 23% decrease in pharmacy costs, a 13% decrease in total facility cost, with no change in hospital length of stay or readmission rate.[14] One important caveat to the use of clinical pathways is that they are often underused. In the study from the University of Utah, for example, only 55% of eligible patients had the clinical pathway ordered.
WHEN BROAD‐SPECTRUM ANTIBIOTICS ARE RECOMMENDED
The IDSA does recommend empiric broad‐spectrum antibiotics with combination gram‐positive and gram‐negative coverage in several situations, including severe infections in which necrotizing soft tissue infection is suspected, animal bites, immersion injuries, as well as for severely immunocompromised patients or those who have failed limited spectrum antibiotics. Additionally, the IDSA recommends antimicrobials effective against MRSA for purulent infections with systemic signs of inflammation as well as severe nonpurulent infections or those associated with penetrating trauma, injection drug use, and nasal colonization with MRSA (Figure 1).
RECOMMENDATIONS
Our patient has no associated purulence and no abscess and therefore has nonpurulent cellulitis. Based on his mild tachycardia and leukocytosis but intact immune system and lack of suspicion for necrotizing soft tissue infection, he would be classified as moderate‐severity cellulitis by the IDSA. In patients hospitalized with nonpurulent cellulitis who are not severely immunocompromised or severely ill and for whom necrotizing soft tissue infection is not suspected:
- Antibiotics should be directed at ‐hemolytic streptococci and MSSA, with 1 of the suggested antibiotics by the IDSA including penicillin, ceftriaxone, cefazolin, or clindamycin.
- Antibiotics effective against MRSA should be limited to situations described by the IDSA.
- If the cellulitis has not improved within 48 hours, then consider broader‐spectrum antibiotics.
- Hospitals should strongly consider implementation of a cellulitis pathway based on the IDSA recommendations to improve antibiotic stewardship as well as costs.
Disclosure
Nothing to report.
Do you think this is a low‐value practice? Is this truly a Thing We Do for No Reason? Share what you do in your practice and join in the conversation online by retweeting it on Twitter (#TWDFNR) and liking it on Facebook. We invite you to propose ideas for other Things We Do for No Reason topics by emailing [email protected].
- , , . Most frequent conditions in U.S. hospitals, 2011. HCUP statistical brief #162. Healthcare Cost and Utilization Project statistical briefs. Rockville, MD: Agency for Health Care Policy and Research; 2013.
- , , , et al. Practice guidelines for the diagnosis and management of skin and soft tissue infections: 2014 update by the Infectious Diseases Society of America. Clin Infect Dis. 2014;59(2):e10–e52.
- , , , et al. Practice guidelines for the diagnosis and management of skin and soft‐tissue infections. Clin Infect Dis. 2005;41(10):1373–1406.
- , , , , , . Skin and soft‐tissue infections requiring hospitalization at an academic medical center: opportunities for antimicrobial stewardship. Clin Infect Dis. 2010;51(8):895–903.
- , , , , , . A prospective, multicenter, observational study of complicated skin and soft tissue infections in hospitalized patients: clinical characteristics, medical treatment, and outcomes. BMC Infect Dis. 2012;12:227.
- Centers for Disease Control and Prevention. Overview and evidence to support stewardship. Available at: http://www.cdc.gov/getsmart/healthcare/evidence.html. Accessed March 2, 2016.
- . Cellulitis, by any other name. Clin Infect Dis. 2013;56(12):1763–1764.
- , , , et al. Methicillin‐resistant S. aureus infections among patients in the emergency department. N Engl J Med. 2006;355(7):666–674.
- , , , , , . Emergence of community‐acquired methicillin‐resistant Staphylococcus aureus USA 300 clone as the predominant cause of skin and soft‐tissue infections. Ann Intern Med. 2006;144(5):309–317.
- , . Staphylococcus aureus is the most common identified cause of cellulitis: a systematic review. Epidemiol Infect. 2010;138(3):313–317.
- , . A systematic review of bacteremias in cellulitis and erysipelas. J Infect. 2012;64(2):148–155.
- , , , . The role of beta‐hemolytic streptococci in causing diffuse, nonculturable cellulitis: a prospective investigation. Medicine (Baltimore). 2010;89(4):217–226.
- , , , et al. Clinical trial: comparative effectiveness of cephalexin plus trimethoprim‐sulfamethoxazole versus cephalexin alone for treatment of uncomplicated cellulitis: a randomized controlled trial. Clin Infect Dis. 2013;56(12):1754–1762.
- , , , , . Evidence‐based care pathway for cellulitis improves process, clinical, and cost outcomes. J Hosp Med. 2015;10:780–786.
The Things We Do for No Reason (TWDFNR) series reviews practices which have become common parts of hospital care but which may provide little value to our patients. Practices reviewed in the TWDFNR series do not represent black and white conclusions or clinical practice standards, but are meant as a starting place for research and active discussions among hospitalists and patients. We invite you to be part of that discussion. https://www.choosingwisely.org/
A 65‐year‐old immunocompetent man with a history of obesity, diabetes, and chronic lower extremity edema presents to the emergency room with a 1‐day history of right lower extremity pain and increased swelling. He reports no antecedent trauma and states he just noticed the symptoms that morning. On examination, he appears generally well. His temperature is 100F, pulse 92 beats per minute, blood pressure 120/60 mm Hg, and respiratory rate 16 breaths per minute. The rest of the exam is notable for right lower extremity erythema and swelling extending from his right shin to his right medial thigh without associated fluctuance or drainage. Labs reveal a mildly elevated white blood cell count of 13,000/L and normal serum creatinine. Are broad‐spectrum antibiotics like vancomycin and piperacillin/tazobactam the preferred regimen?
BACKGROUND
The term skin and soft tissue infection (SSTI) includes a heterogeneous group of infections including cellulitis, cutaneous abscess, diabetic foot infections, surgical site infections, and necrotizing soft tissue infections. As a group, SSTIs are the second most common type of infection in hospitalized adults in the United States behind pneumonia and result in more than 600,000 admissions per year.[1] The current guideline on SSTIs by the Infectious Disease Society of America (IDSA) makes the distinction between purulent and nonpurulent soft tissue infections based on the presence or absence of purulent drainage or abscess and between mild, moderate, and severe infections based on the presence and severity of systemic signs of infection.[2] Figure 1 provides an overview of the IDSA recommendations.
THE PROBLEM: OVERUSE OF BROAD‐SPECTRUM ANTIBIOTICS
Studies over the past decade have shown that the majority of patients hospitalized with SSTI receive broad‐spectrum antibiotics, usually with combinations of antibiotics active against gram‐positive (including methicillin‐resistant Staphylococcus aureus [MRSA]), gram‐negative (often including Pseudomonas aeruginosa), and anaerobic organisms. Broad‐spectrum treatment occurs despite guidelines from the IDSA, which state that the most common pathogens for nonpurulent cellulitis are ‐hemolytic streptococci, which remain susceptible to penicillin.[2, 3] One multicenter study of hospitalized adults with nonpurulent cellulitis, for example, reported that 85% of patients received therapy effective against MRSA (primarily vancomycin), 61% received broad gram‐negative coverage (primarily ‐lactam with ‐lactamase inhibitor), and 74% received anaerobic coverage.[4] Another multicenter study reported that the most common antibiotics given for cellulitis (excluding cases associated with cutaneous abscess) were vancomycin (60%), ‐lactam/‐lactamase combinations (32%), and clindamycin (19%). Only 13% of patients with cellulitis were treated with cefazolin, and only 1.1% of patients were treated with nafcillin or oxacillin.[5] According to the Centers for Disease Control and Prevention, unnecessary antibiotic use is associated with increased cost, development of antibiotic resistance, and increased rates of Clostridium difficile.[6]
The current use of broad‐spectrum antibiotics for nonpurulent cellulitis is likely due to several factors, including the emergence of community‐associated (CA)‐MRSA, confusion due to the heterogeneity of SSTI, and the limited data regarding the microbiology of nonpurulent cellulitis. The resulting uncertainty about cellulitis has been termed an existential crisis for the treating physician and is likely the single biggest factor behind the out‐of‐control prescribing.[7]
The Emergence of CA‐MRSA
Over the past decade, numerous studies have reported the increasing frequency of CA‐MRSA soft tissue infections, predominantly with the pulsed‐field gel electrophoresis type USA‐300. Originally, MRSA infections were limited to nosocomial infections. Subsequent multicenter studies from the United States have shown that CA‐MRSA is the most frequent pathogen isolated from purulent soft tissue infections presenting to emergency rooms[8] and the most frequent pathogen isolated from SSTI specimens in labs.[9] Many authors have therefore concluded that empiric antibiotics for SSTI should include coverage for MRSA.[8, 9]
Heterogeneity of SSTI
As already discussed, the term SSTI is an umbrella term that encompasses several types of clinically distinct infections. The only commonality between the SSTI is that that they all involve the skin and soft tissues in some way. Diabetic foot infections, cutaneous abscesses, surgical site infections, and nonpurulent cellulitis have different hosts, pathophysiology, clinical presentations, and microbiology. At one end of the spectrum is the cutaneous abscess, which is readily culturable through incision and drainage. At the other end of the spectrum is cellulitis, which is typically nonculturable. Unfortunately, studies of SSTI tend to lump all of these entities together when reporting microbiology. The landmark study by Moran et al., for example, described the microbiology of purulent soft tissue infections presenting to a network of emergency rooms across the county. Although all patients had by definition purulent infections, and 81% were abscesses, the authors made broad conclusions about skin and soft tissue infections in general and recommended antimicrobials effective against MRSA for empiric coverage for SSTIs.[8]
Uncertainty About the Microbiology of Nonpurulent Cellulitis
What then is the microbiology of nonpurulent cellulitis? As stated in the 2005 and 2014 IDSA guidelines, traditional teaching remains that nonpurulent cellulitis is primarily due to ‐hemolytic streptococci.[2, 3] Studies using needle aspiration have yielded conflicting results, although a systematic review of these studies concluded that S aureus was the most common pathogen.[10] On the other hand, a systematic review of positive blood cultures of patients identified as having cellulitis found that 61% were due to ‐hemolytic streptococci, and only 15% were due to S aureus.[11] Both reviews, however, comment on the limited quality of the included studies. Ultimately, because nonpurulent soft tissue infections are basically nonculturable, their true microbiologic etiology remains uncertain. Given this uncertainty, as well as the impressive evidence for CA‐MRSA causing cutaneous abscesses, along with the confusion about types of SSTI, it is not surprising that front‐line clinicians have resorted to prescribing broad‐spectrum antibiotics.
THE SOLUTION: NARROW‐SPECTRUM ANTIBIOTICS FOR MOST
Although studies of the microbiology of cellulitis remain inconclusive, several recent clinical trials have indicated that treatment with antimicrobials limited to ‐hemolytic streptococci and methicillin‐susceptible S aureus (MSSA) are as effective as antimicrobials against MRSA. A prospective study from 2010 of consecutive hospitalized adults with nonpurulent cellulitis found that 73% had serologic evidence for streptococcal infection, and overall 95.8% responded to cefazolin monotherapy.[12] More recently, a study of emergency room patients with nonpurulent cellulitis randomized patients to cephalexin alone or cephalexin plus trimethoprim‐sulfamethoxazole. These authors found no difference in response rates and concluded that the addition of anti‐MRSA therapy (trimethoprim‐sulfamethoxazole, in this study) for uncomplicated cellulitis was unnecessary.[13] This later study is the only randomized controlled study to assess the need for MRSA coverage for cellulitis, and the answer for outpatients, at least, is that MRSA coverage is unnecessary. Both of these studies are cited by the IDSA guideline from 2014, which recommends antibiotics for mild‐moderate cellulitis to be limited to antimicrobials effective against ‐hemolytic streptococci and MSSA. The guideline specifically does not recommend routinely treating for MRSA, gram‐negative, or anaerobic organisms citing lack of benefit as well as risks of antibiotic resistance and C difficile infection. A recent study from the University of Utah reported the development of a cellulitis order set, which included a pathway for nonpurulent cellulitis based on the use of cefazolin. These authors reported that the use of the pathway was associated with a 59% decrease in the use of broad‐spectrum antibiotics, a 23% decrease in pharmacy costs, a 13% decrease in total facility cost, with no change in hospital length of stay or readmission rate.[14] One important caveat to the use of clinical pathways is that they are often underused. In the study from the University of Utah, for example, only 55% of eligible patients had the clinical pathway ordered.
WHEN BROAD‐SPECTRUM ANTIBIOTICS ARE RECOMMENDED
The IDSA does recommend empiric broad‐spectrum antibiotics with combination gram‐positive and gram‐negative coverage in several situations, including severe infections in which necrotizing soft tissue infection is suspected, animal bites, immersion injuries, as well as for severely immunocompromised patients or those who have failed limited spectrum antibiotics. Additionally, the IDSA recommends antimicrobials effective against MRSA for purulent infections with systemic signs of inflammation as well as severe nonpurulent infections or those associated with penetrating trauma, injection drug use, and nasal colonization with MRSA (Figure 1).
RECOMMENDATIONS
Our patient has no associated purulence and no abscess and therefore has nonpurulent cellulitis. Based on his mild tachycardia and leukocytosis but intact immune system and lack of suspicion for necrotizing soft tissue infection, he would be classified as moderate‐severity cellulitis by the IDSA. In patients hospitalized with nonpurulent cellulitis who are not severely immunocompromised or severely ill and for whom necrotizing soft tissue infection is not suspected:
- Antibiotics should be directed at ‐hemolytic streptococci and MSSA, with 1 of the suggested antibiotics by the IDSA including penicillin, ceftriaxone, cefazolin, or clindamycin.
- Antibiotics effective against MRSA should be limited to situations described by the IDSA.
- If the cellulitis has not improved within 48 hours, then consider broader‐spectrum antibiotics.
- Hospitals should strongly consider implementation of a cellulitis pathway based on the IDSA recommendations to improve antibiotic stewardship as well as costs.
Disclosure
Nothing to report.
Do you think this is a low‐value practice? Is this truly a Thing We Do for No Reason? Share what you do in your practice and join in the conversation online by retweeting it on Twitter (#TWDFNR) and liking it on Facebook. We invite you to propose ideas for other Things We Do for No Reason topics by emailing [email protected].
- , , . Most frequent conditions in U.S. hospitals, 2011. HCUP statistical brief #162. Healthcare Cost and Utilization Project statistical briefs. Rockville, MD: Agency for Health Care Policy and Research; 2013.
- , , , et al. Practice guidelines for the diagnosis and management of skin and soft tissue infections: 2014 update by the Infectious Diseases Society of America. Clin Infect Dis. 2014;59(2):e10–e52.
- , , , et al. Practice guidelines for the diagnosis and management of skin and soft‐tissue infections. Clin Infect Dis. 2005;41(10):1373–1406.
- , , , , , . Skin and soft‐tissue infections requiring hospitalization at an academic medical center: opportunities for antimicrobial stewardship. Clin Infect Dis. 2010;51(8):895–903.
- , , , , , . A prospective, multicenter, observational study of complicated skin and soft tissue infections in hospitalized patients: clinical characteristics, medical treatment, and outcomes. BMC Infect Dis. 2012;12:227.
- Centers for Disease Control and Prevention. Overview and evidence to support stewardship. Available at: http://www.cdc.gov/getsmart/healthcare/evidence.html. Accessed March 2, 2016.
- . Cellulitis, by any other name. Clin Infect Dis. 2013;56(12):1763–1764.
- , , , et al. Methicillin‐resistant S. aureus infections among patients in the emergency department. N Engl J Med. 2006;355(7):666–674.
- , , , , , . Emergence of community‐acquired methicillin‐resistant Staphylococcus aureus USA 300 clone as the predominant cause of skin and soft‐tissue infections. Ann Intern Med. 2006;144(5):309–317.
- , . Staphylococcus aureus is the most common identified cause of cellulitis: a systematic review. Epidemiol Infect. 2010;138(3):313–317.
- , . A systematic review of bacteremias in cellulitis and erysipelas. J Infect. 2012;64(2):148–155.
- , , , . The role of beta‐hemolytic streptococci in causing diffuse, nonculturable cellulitis: a prospective investigation. Medicine (Baltimore). 2010;89(4):217–226.
- , , , et al. Clinical trial: comparative effectiveness of cephalexin plus trimethoprim‐sulfamethoxazole versus cephalexin alone for treatment of uncomplicated cellulitis: a randomized controlled trial. Clin Infect Dis. 2013;56(12):1754–1762.
- , , , , . Evidence‐based care pathway for cellulitis improves process, clinical, and cost outcomes. J Hosp Med. 2015;10:780–786.
© 2016 Society of Hospital Medicine

Regular Moderate Exercise Throughout Pregnancy Not Associated with Increased Risk of Preterm Delivery
Study Overview
Objective. To evaluate if exercise during pregnancy has an effect on the risk of preterm birth.
Design. Systematic review and meta-analysis of randomized controlled trials.
Study selection. The authors followed the protocol for conducting meta-analyses recommended by the Cochrane Collaboration. MEDLINE, EMBASE, Web of Science, Scopus, ClinicalTrials.gov, OVID, and the Cochrane Library were searched from the inception of each database to April 2016. Selection criteria included randomized clinical trials that examined the effect of aerobic exercise on preterm birth. Keywords included exercise or physical activity and pregnancy and preterm birth or preterm delivery. Studies were included only if women were randomized to an aerobic exercise program prior to 23 weeks, participants had uncomplicated singleton pregnancies and no contraindication to exercise, and preterm birth was an outcome.
Nine studies met the inclusion criteria and were included in the meta-analysis. The quality of included studies was good overall, with most studies having low risk of selection or attrition bias and low or unclear risk of reporting bias. Most of the studies did not include blinding of participants and research personnel or of the outcome assessment. Sample sizes ranged from 14 to 697, with 2 studies with < 100 participants, 3 with 100 to 200 participants, and 3 with 290 to 687 participants. All of the women randomized to the experimental group began an exercise program by 22 weeks’ gestation. The types of physical activity used in the experimental group included strength and flexibility training, cycling, stretching, resistance, dance, joint mobilization, walking, and toning. Participants engaged in the activity for 35 to 90 minutes (mean, 57 minutes) 3 times a week in 8 studies and 4 times a week in 1 study. The intensity of the aerobic activities ranged from less than 60% to less than 80% of age-predicted maximum heart rate. Participants in 3 control groups were explicitly told not to engage in exercise while those in the others were neither encouraged or discouraged from doing so.
Main outcome measure. Incidence of preterm birth (birth prior to 37 weeks’ gestation).
Main results. A total of 2059 women were included in the meta-analysis, with 1022 in the exercise group and 1037 in the control group. The incidence of preterm birth was similar in the experimental and the control groups (4.5% vs 4.4% respectively, 95% confidence interval [CI], –0.07 to 0.17). The mean gestational age at delivery was also similar, with a mean difference of 0.05 (95% CI, –0.07 to 0.17). Women in the exercise group had a decreased risk of cesarean delivery (0.82%), with 17.9% having a cesarean delivery compared to 22% in the control group ( 95% CI, 0.69 to 0.97).
Conclusion. Exercise during pregnancy in women with singleton, uncomplicated pregnancy is not associated with increased risk of preterm delivery. Additionally, it is associated with a decreased risk of cesarean delivery.
Commentary
Preterm birth accounts for most perinatal deaths in the United States and places surviving infants at risk for serious short- and long-term health problems [1]. Though the rate of preterm births in the United States has been slowly declining in recent years, at 9.57% it continues to be one of the highest among high-income countries [2]. Determining factors that contribute to incidence of preterm birth is critical to reducing this unacceptably high rate. According to the authors of this meta-analysis, the role of exercise related to preterm birth remains controversial due to past beliefs that the increased release of catecholamines during exercise would stimulate myometrial activity and ongoing concerns about possible adverse effects. The health benefits of regular exercise are well-known, including in pregnancy where it has been shown to lower the risk of gestational diabetes and preeclampsia.
Researchers have investigated exercise during pregnancy in earlier reviews; however, this appears to be the first with both preterm birth as the primary outcome and an adequate number of clinical trials in the sample. Prior reviews that examined the effects of exercise on preterm birth, either specifically or as one of a number of pregnancy outcomes, included only 3 to 5 studies pertaining to preterm birth [3–5].
The strengths of this review were the low statistical heterogeneity and high quality of the included studies, lack of publication bias, and the large sample of 2059 participants. As noted by the authors, however, lack of stratification by body mass (underweight, overweight, obese), differences in the types and intensity of exercise among interventions, as well as possible differences in adherence may have affected outcomes. In addition, in 6 studies women in the control group were not specifically instructed to refrain from exercise and there is no information about their exercise habits. The risk of contamination bias exists because some of these women may have engaged in a regular program of exercise. However, considering that levels of regular exercise in pregnant women are low, it is unlikely that this would occur at a rate that would have a significant effect on the outcomes [6].
Applications for Clinical Practice
The results of this meta-analysis provide strong support for the American College of Obstetrics and Gynecology recommendation that women with uncomplicated pregnancies be encouraged to engage in moderate-intensity exercise 20 to 30 minutes per day during pregnancy [7]. Clinicians should advise all women with uncomplicated singleton pregnancies and no medical contraindications to engage in regular aerobic and strength-conditioning exercise throughout their pregnancy.
—Karen Roush, PhD, RN
1. March of Dimes. 2015 Premature birth report cards. Accessed at www.marchofdimes.org/mission/prematurity-reportcard.aspx.
2. CDC. FastStats: Birthweight and gestation. Accessed at www.cdc.gov/nchs/fastats/birthweight.htm.
3. Kramer MS, McDonald SW. Aerobic exercise for women during pregnancy. Cochrane Database Syst Rev 2006;(3):CD000180.
4. Muktabhant B, Lawrie TA, Lumbiganon P, Laopaiboon M. Diet or exercise, or both, for preventing excessive weight gain in pregnancy. Cochrane Database Syst Rev 2015;(6):CD007145.
5. Thangaratinam S, Rogozinska E, Jolly K, et al. Effects of interventions in pregnancy on maternal weight and obstetric outcomes: Meta-analysis of randomized evidence. BMJ 2012 May 16;344:e2088.
6. Nascimento SL, Surita FG, Cecatti JG. Physical exercise during pregnancy: a systematic review. Curr Opin Obstet Gynecol 2012 Dec;24:387–94.
7. ACOG Committee Opinion No. 650: Physical activity and exercise during pregnancy and the postpartum period. Obstet Gynecol 2015;126:e135–42.
Study Overview
Objective. To evaluate if exercise during pregnancy has an effect on the risk of preterm birth.
Design. Systematic review and meta-analysis of randomized controlled trials.
Study selection. The authors followed the protocol for conducting meta-analyses recommended by the Cochrane Collaboration. MEDLINE, EMBASE, Web of Science, Scopus, ClinicalTrials.gov, OVID, and the Cochrane Library were searched from the inception of each database to April 2016. Selection criteria included randomized clinical trials that examined the effect of aerobic exercise on preterm birth. Keywords included exercise or physical activity and pregnancy and preterm birth or preterm delivery. Studies were included only if women were randomized to an aerobic exercise program prior to 23 weeks, participants had uncomplicated singleton pregnancies and no contraindication to exercise, and preterm birth was an outcome.
Nine studies met the inclusion criteria and were included in the meta-analysis. The quality of included studies was good overall, with most studies having low risk of selection or attrition bias and low or unclear risk of reporting bias. Most of the studies did not include blinding of participants and research personnel or of the outcome assessment. Sample sizes ranged from 14 to 697, with 2 studies with < 100 participants, 3 with 100 to 200 participants, and 3 with 290 to 687 participants. All of the women randomized to the experimental group began an exercise program by 22 weeks’ gestation. The types of physical activity used in the experimental group included strength and flexibility training, cycling, stretching, resistance, dance, joint mobilization, walking, and toning. Participants engaged in the activity for 35 to 90 minutes (mean, 57 minutes) 3 times a week in 8 studies and 4 times a week in 1 study. The intensity of the aerobic activities ranged from less than 60% to less than 80% of age-predicted maximum heart rate. Participants in 3 control groups were explicitly told not to engage in exercise while those in the others were neither encouraged or discouraged from doing so.
Main outcome measure. Incidence of preterm birth (birth prior to 37 weeks’ gestation).
Main results. A total of 2059 women were included in the meta-analysis, with 1022 in the exercise group and 1037 in the control group. The incidence of preterm birth was similar in the experimental and the control groups (4.5% vs 4.4% respectively, 95% confidence interval [CI], –0.07 to 0.17). The mean gestational age at delivery was also similar, with a mean difference of 0.05 (95% CI, –0.07 to 0.17). Women in the exercise group had a decreased risk of cesarean delivery (0.82%), with 17.9% having a cesarean delivery compared to 22% in the control group ( 95% CI, 0.69 to 0.97).
Conclusion. Exercise during pregnancy in women with singleton, uncomplicated pregnancy is not associated with increased risk of preterm delivery. Additionally, it is associated with a decreased risk of cesarean delivery.
Commentary
Preterm birth accounts for most perinatal deaths in the United States and places surviving infants at risk for serious short- and long-term health problems [1]. Though the rate of preterm births in the United States has been slowly declining in recent years, at 9.57% it continues to be one of the highest among high-income countries [2]. Determining factors that contribute to incidence of preterm birth is critical to reducing this unacceptably high rate. According to the authors of this meta-analysis, the role of exercise related to preterm birth remains controversial due to past beliefs that the increased release of catecholamines during exercise would stimulate myometrial activity and ongoing concerns about possible adverse effects. The health benefits of regular exercise are well-known, including in pregnancy where it has been shown to lower the risk of gestational diabetes and preeclampsia.
Researchers have investigated exercise during pregnancy in earlier reviews; however, this appears to be the first with both preterm birth as the primary outcome and an adequate number of clinical trials in the sample. Prior reviews that examined the effects of exercise on preterm birth, either specifically or as one of a number of pregnancy outcomes, included only 3 to 5 studies pertaining to preterm birth [3–5].
The strengths of this review were the low statistical heterogeneity and high quality of the included studies, lack of publication bias, and the large sample of 2059 participants. As noted by the authors, however, lack of stratification by body mass (underweight, overweight, obese), differences in the types and intensity of exercise among interventions, as well as possible differences in adherence may have affected outcomes. In addition, in 6 studies women in the control group were not specifically instructed to refrain from exercise and there is no information about their exercise habits. The risk of contamination bias exists because some of these women may have engaged in a regular program of exercise. However, considering that levels of regular exercise in pregnant women are low, it is unlikely that this would occur at a rate that would have a significant effect on the outcomes [6].
Applications for Clinical Practice
The results of this meta-analysis provide strong support for the American College of Obstetrics and Gynecology recommendation that women with uncomplicated pregnancies be encouraged to engage in moderate-intensity exercise 20 to 30 minutes per day during pregnancy [7]. Clinicians should advise all women with uncomplicated singleton pregnancies and no medical contraindications to engage in regular aerobic and strength-conditioning exercise throughout their pregnancy.
—Karen Roush, PhD, RN
1. March of Dimes. 2015 Premature birth report cards. Accessed at www.marchofdimes.org/mission/prematurity-reportcard.aspx.
2. CDC. FastStats: Birthweight and gestation. Accessed at www.cdc.gov/nchs/fastats/birthweight.htm.
3. Kramer MS, McDonald SW. Aerobic exercise for women during pregnancy. Cochrane Database Syst Rev 2006;(3):CD000180.
4. Muktabhant B, Lawrie TA, Lumbiganon P, Laopaiboon M. Diet or exercise, or both, for preventing excessive weight gain in pregnancy. Cochrane Database Syst Rev 2015;(6):CD007145.
5. Thangaratinam S, Rogozinska E, Jolly K, et al. Effects of interventions in pregnancy on maternal weight and obstetric outcomes: Meta-analysis of randomized evidence. BMJ 2012 May 16;344:e2088.
6. Nascimento SL, Surita FG, Cecatti JG. Physical exercise during pregnancy: a systematic review. Curr Opin Obstet Gynecol 2012 Dec;24:387–94.
7. ACOG Committee Opinion No. 650: Physical activity and exercise during pregnancy and the postpartum period. Obstet Gynecol 2015;126:e135–42.
Can Patient Navigators Increase Cancer Screening Rates in Primary Care Practice?
Study Overview
Objective. To evaluate patient navigation (PN) for breast, cervical, and colorectal cancer (CRC) screening using a population-based information technology (IT) system within a primary care network.
Design. Randomized clinical trial.
Setting and participants. Patients were from 18 primary care practices in the Massachusetts General Primary Care Practice-Based Research Network, which included 4 community health centers. The study used a population health IT application (TopCare [SRG Technology]) to identify patients overdue for breast, cervical and/or CRC screening. Women were deemed eligible and overdue for breast cancer [1] and cervical cancer [2] screening based on United States Preventive Services Task Force (USPSTF) recommendation statements. Patients aged 50 to 75 years without prior total colectomy were considered eligible for CRC screening and overdue if they did not have a colonoscopy in the past 10 years or sigmoidoscopy/barium enema/colonography in the past 5 years.
The study identified patients at high risk for non-adherence via a point system based on history of non-adherence to cancer screening tests, missed appointments, and primary language spoken (non-English speaking). A total of 1956 patients were identified, and after excluding those who were participating in an existing PN program, left the primary care network, died, or were lost to follow-up, the final study population consisted of 1612 patients overdue for at least 1 screening at the start of the study period.
Intervention: The intervention was a PN program comprising 4 part-time patient navigators with at least 2 years’ experience with cancer navigation and who worked 50% of their time in other PN programs. The navigators tracked intervention patients using the IT system, contacted them in their own language, and used extensive outreach efforts to assist them in completing their cancer screening. Most contact with patients took place via phone calls.
Main outcome measures. The primary outcome was the mean cancer screening test completion rate over the follow-up period for each eligible patient, with all eligible cancers combined in intention-to-treat analyses. Secondary outcomes included assessing the proportion of patients completing any and each cancer screening during follow-up among those who were eligible and overdue for at least 1 cancer screening at baseline in intention-to-treat analyses. Additionally, as-treated analyses were conducted, in which patients who left the network or died during follow-up were removed from the intervention and control groups and patients who could not be reached were removed from the intervention group.
Results. A total of 792 patients were randomized to theintervention group (PN) and 820 patients were randomized to usual care. The mean age in the intervention and control groups was 56.9 and 57.1 years, respectively. The intervention and control groups were well-matched in terms of sex, primary language, insurance, proportion of patients connected to a specific physician or seen in a community health center, number of clinic visits over the past 3 years, and risk for nonadherence. Among patients eligible and overdue for cancer screening, mean cancer screening completion rates were higher in the intervention group compared with the control group for all cancers combined (10.2% vs 6.8%; 95% CI [for the difference] 1.5% to 5.2%; P < 0.001) and for breast (14.7% vs 11.0%; 95% CI 0.2% to 7.3%; P = 0.04), cervical (11.1% vs 5.7%; 95% CI 0.8% to 5.2%; P = 0.002), and colon (7.6% vs 4.6%;95% CI 0.8% to 5.2%; P = 0.01) cancer. The secondary outcome, the proportion of overdue patients who completed any cancer screening during follow-up, was higher in the intervention group (25.5% vs 17.0%; 95% CI 4.7% to 12.7%; P < 0.001). More patients in the intervention group completed screening for breast (23.4% vs 16.6%; 95% CI 1.8% to 12.0%; P = 0.009), cervical (14.4% vs 8.6%; 95% CI 1.6% to 10.5%; P = 0.007), and colorectal (13.7% vs 7.0%; 95% CI 3.2% to 10.4%; P < 0.001) cancer. The effect size increased in the as-treated analyses.
Conclusion. PN, using a health IT application, improved cancer screening completion rates among patients at high risk for nonadherence over an 8-month period in an academic primary care network.
Commentary
The potential of PN to help individuals traverse the complexity of the current health care system continues to attract great interest as value-based care becomes a reality for physicians and health systems. Several studies have demonstrated PN to be an effective modality to improve adherence to recommended screenings [3–5]; however, issues surrounding cost, patient perception, and the “outsourcing” of care from the primary care physician to navigators require attention. At this time, the most robust aggregation of data demonstrating benefit outweighing harm for cancer screening is published by the USPSTF [6]. Breast cancer [7], cervical cancer [8], and CRC [9] have the greatest weight of evidence to support screening.
The study was conducted at a single academic medical center with established IT infrastructure and an established PN program, which limits application of the results to large networked organizations and/or private practice settings. One important limitation in the CRC screening component was the lack of alternatives to colonoscopy. Studies have demonstrated greater adherence to CRC screening with methods other than colonoscopy [10], especially among racial/ethnic minorities. Although the authors estimate the intervention cost approximately $100,000, the study does not include the cost of the population health IT solution. The costs associated with both the IT solution in addition to PN may ultimately outweigh the benefits. The short time frame of the study may also limit effect size and add to long-term cost considerations. Lastly, a high percentage of patients randomized to the intervention group were unable to be contacted, declined PN services, had competing comorbidities, or were screened elsewhere. On the other hand, the study has several strengths. Statistically, the study utilized intention-to-treat analyses, where estimate of treatment effect is generally conservative. As compared to the current literature, the authors evaluate 3 different types of cancer—a pragmatic approach from a clinician’s perspective. Additionally, the authors focused efforts on individuals at high risk for nonadherence, a strategy also practicable by clinicians. Another realistic element of the study is that patient navigators had other responsibilities, which implies applicability to resource-limited settings.
Applications for Clinical Practice
PN has been shown to be an effective means of improving population-based health outcomes, and this study demonstrates it improves cancer screening rates, assuming the appropriate IT infrastructure is in place. The costs and benefits of PN should be assessed when considering use of PN in nonadherent populations, and PN interventions should be tailored to available resources and the unique practice environment.
—Ajay Dharod, MD
1. Calonge N, Petitti DB, DeWitt TG, et al. Screening for breast cancer: US Preventive Services Task Force recommendation statement. Ann Intern Med 2009;151:716–26.
2. Moyer VA; US Preventive Services Task Force. Screening for cervical cancer: US Preventive Services Task Force recommendation statement. Ann Intern Med 2012;156:880–91.
3. Phillips CE, Rothstein JD, Beaver K, et al. Patient navigation to increase mammography screening among inner city women. J Gen Intern Med 2011;26:123–9.
4. Jandorf L, Braschi C, Ernstoff E, et al. Culturally targeted patient navigation for increasing African Americans’ adherence to screening colonoscopy: a randomized clinical trial. Cancer Epidemiol Biomarkers Prev 2013;22:1577–87.
5. Braschi CD, Sly JR, Singh S, et al. Increasing colonoscopy screening for Latino Americans through a patient navigation model: a randomized clinical trial. J Immigr Minor Health 2014;16:934–40.
6. US Preventive Services Task Force. Published recommendations. 2016. Accessed 12 July 2016 at www.uspreventiveservicestaskforce.org/BrowseRec/Index/browse-recommendations.
7. US Preventive Services Task Force. Final recommendation statement: Breast cancer: Screening. 2016. Accessed 12 July 2016 at www.uspreventiveservicestaskforce.org/Page/Document/RecommendationStatementFinal/breast-cancer-screening1.
8. US Preventive Services Task Force. Final Recommendation Statement: Cervical cancer: Screening. 2016. Accessed 12 July 2016 at www.uspreventiveservicestaskforce.org/Page/Document/RecommendationStatementFinal/cervical-cancer-screening.
9. US Preventive Services Task Force. Final Recommendation Statement: Colorectal cancer: Screening. 2016. Accessed 12 July 2016 at www.uspreventiveservicestaskforce.org/Page/Document/RecommendationStatementFinal/colorectal-cancer-screening2.
10. Inadomi JM, Vijan S, Janz NK, et al. Adherence to colorectal cancer screening: a randomized clinical trial of competing strategies. Arch Intern Med 2012;172:575–82.
Study Overview
Objective. To evaluate patient navigation (PN) for breast, cervical, and colorectal cancer (CRC) screening using a population-based information technology (IT) system within a primary care network.
Design. Randomized clinical trial.
Setting and participants. Patients were from 18 primary care practices in the Massachusetts General Primary Care Practice-Based Research Network, which included 4 community health centers. The study used a population health IT application (TopCare [SRG Technology]) to identify patients overdue for breast, cervical and/or CRC screening. Women were deemed eligible and overdue for breast cancer [1] and cervical cancer [2] screening based on United States Preventive Services Task Force (USPSTF) recommendation statements. Patients aged 50 to 75 years without prior total colectomy were considered eligible for CRC screening and overdue if they did not have a colonoscopy in the past 10 years or sigmoidoscopy/barium enema/colonography in the past 5 years.
The study identified patients at high risk for non-adherence via a point system based on history of non-adherence to cancer screening tests, missed appointments, and primary language spoken (non-English speaking). A total of 1956 patients were identified, and after excluding those who were participating in an existing PN program, left the primary care network, died, or were lost to follow-up, the final study population consisted of 1612 patients overdue for at least 1 screening at the start of the study period.
Intervention: The intervention was a PN program comprising 4 part-time patient navigators with at least 2 years’ experience with cancer navigation and who worked 50% of their time in other PN programs. The navigators tracked intervention patients using the IT system, contacted them in their own language, and used extensive outreach efforts to assist them in completing their cancer screening. Most contact with patients took place via phone calls.
Main outcome measures. The primary outcome was the mean cancer screening test completion rate over the follow-up period for each eligible patient, with all eligible cancers combined in intention-to-treat analyses. Secondary outcomes included assessing the proportion of patients completing any and each cancer screening during follow-up among those who were eligible and overdue for at least 1 cancer screening at baseline in intention-to-treat analyses. Additionally, as-treated analyses were conducted, in which patients who left the network or died during follow-up were removed from the intervention and control groups and patients who could not be reached were removed from the intervention group.
Results. A total of 792 patients were randomized to theintervention group (PN) and 820 patients were randomized to usual care. The mean age in the intervention and control groups was 56.9 and 57.1 years, respectively. The intervention and control groups were well-matched in terms of sex, primary language, insurance, proportion of patients connected to a specific physician or seen in a community health center, number of clinic visits over the past 3 years, and risk for nonadherence. Among patients eligible and overdue for cancer screening, mean cancer screening completion rates were higher in the intervention group compared with the control group for all cancers combined (10.2% vs 6.8%; 95% CI [for the difference] 1.5% to 5.2%; P < 0.001) and for breast (14.7% vs 11.0%; 95% CI 0.2% to 7.3%; P = 0.04), cervical (11.1% vs 5.7%; 95% CI 0.8% to 5.2%; P = 0.002), and colon (7.6% vs 4.6%;95% CI 0.8% to 5.2%; P = 0.01) cancer. The secondary outcome, the proportion of overdue patients who completed any cancer screening during follow-up, was higher in the intervention group (25.5% vs 17.0%; 95% CI 4.7% to 12.7%; P < 0.001). More patients in the intervention group completed screening for breast (23.4% vs 16.6%; 95% CI 1.8% to 12.0%; P = 0.009), cervical (14.4% vs 8.6%; 95% CI 1.6% to 10.5%; P = 0.007), and colorectal (13.7% vs 7.0%; 95% CI 3.2% to 10.4%; P < 0.001) cancer. The effect size increased in the as-treated analyses.
Conclusion. PN, using a health IT application, improved cancer screening completion rates among patients at high risk for nonadherence over an 8-month period in an academic primary care network.
Commentary
The potential of PN to help individuals traverse the complexity of the current health care system continues to attract great interest as value-based care becomes a reality for physicians and health systems. Several studies have demonstrated PN to be an effective modality to improve adherence to recommended screenings [3–5]; however, issues surrounding cost, patient perception, and the “outsourcing” of care from the primary care physician to navigators require attention. At this time, the most robust aggregation of data demonstrating benefit outweighing harm for cancer screening is published by the USPSTF [6]. Breast cancer [7], cervical cancer [8], and CRC [9] have the greatest weight of evidence to support screening.
The study was conducted at a single academic medical center with established IT infrastructure and an established PN program, which limits application of the results to large networked organizations and/or private practice settings. One important limitation in the CRC screening component was the lack of alternatives to colonoscopy. Studies have demonstrated greater adherence to CRC screening with methods other than colonoscopy [10], especially among racial/ethnic minorities. Although the authors estimate the intervention cost approximately $100,000, the study does not include the cost of the population health IT solution. The costs associated with both the IT solution in addition to PN may ultimately outweigh the benefits. The short time frame of the study may also limit effect size and add to long-term cost considerations. Lastly, a high percentage of patients randomized to the intervention group were unable to be contacted, declined PN services, had competing comorbidities, or were screened elsewhere. On the other hand, the study has several strengths. Statistically, the study utilized intention-to-treat analyses, where estimate of treatment effect is generally conservative. As compared to the current literature, the authors evaluate 3 different types of cancer—a pragmatic approach from a clinician’s perspective. Additionally, the authors focused efforts on individuals at high risk for nonadherence, a strategy also practicable by clinicians. Another realistic element of the study is that patient navigators had other responsibilities, which implies applicability to resource-limited settings.
Applications for Clinical Practice
PN has been shown to be an effective means of improving population-based health outcomes, and this study demonstrates it improves cancer screening rates, assuming the appropriate IT infrastructure is in place. The costs and benefits of PN should be assessed when considering use of PN in nonadherent populations, and PN interventions should be tailored to available resources and the unique practice environment.
—Ajay Dharod, MD
1. Calonge N, Petitti DB, DeWitt TG, et al. Screening for breast cancer: US Preventive Services Task Force recommendation statement. Ann Intern Med 2009;151:716–26.
2. Moyer VA; US Preventive Services Task Force. Screening for cervical cancer: US Preventive Services Task Force recommendation statement. Ann Intern Med 2012;156:880–91.
3. Phillips CE, Rothstein JD, Beaver K, et al. Patient navigation to increase mammography screening among inner city women. J Gen Intern Med 2011;26:123–9.
4. Jandorf L, Braschi C, Ernstoff E, et al. Culturally targeted patient navigation for increasing African Americans’ adherence to screening colonoscopy: a randomized clinical trial. Cancer Epidemiol Biomarkers Prev 2013;22:1577–87.
5. Braschi CD, Sly JR, Singh S, et al. Increasing colonoscopy screening for Latino Americans through a patient navigation model: a randomized clinical trial. J Immigr Minor Health 2014;16:934–40.
6. US Preventive Services Task Force. Published recommendations. 2016. Accessed 12 July 2016 at www.uspreventiveservicestaskforce.org/BrowseRec/Index/browse-recommendations.
7. US Preventive Services Task Force. Final recommendation statement: Breast cancer: Screening. 2016. Accessed 12 July 2016 at www.uspreventiveservicestaskforce.org/Page/Document/RecommendationStatementFinal/breast-cancer-screening1.
8. US Preventive Services Task Force. Final Recommendation Statement: Cervical cancer: Screening. 2016. Accessed 12 July 2016 at www.uspreventiveservicestaskforce.org/Page/Document/RecommendationStatementFinal/cervical-cancer-screening.
9. US Preventive Services Task Force. Final Recommendation Statement: Colorectal cancer: Screening. 2016. Accessed 12 July 2016 at www.uspreventiveservicestaskforce.org/Page/Document/RecommendationStatementFinal/colorectal-cancer-screening2.
10. Inadomi JM, Vijan S, Janz NK, et al. Adherence to colorectal cancer screening: a randomized clinical trial of competing strategies. Arch Intern Med 2012;172:575–82.
Follow-up of Abnormal Metanephrine and Catecholamine Testing: Chasing Missed Neuroendocrine Tumors
From the Department of Medicine, Tufts Medical Center, Boston, MA.
Abstract
- Objective: To measure the frequency of missed pheochromocytoma test results and identify factors related to the risk of failed follow-up.
- Methods: We performed a retrospective review of the medical record to identify patients with abnormal urine or serum metanephrine or catecholamine test results over a 3-year period. We then searched the electronic medical record for documentation that the responsible physician was aware of the test results. We surveyed the physicians in cases where there were abnormal results and no documented follow-up to assess their awareness of the results and any follow-up actions they may have taken.
- Results: During the 3-year look-back period, 451 send-out tests for 332 patients were ordered for serum metanephrines, serum catecholamines, or urine catecholamines and/or metanephrines. Fifty-five tests affecting 46 patients returned with either moderately (n = 41) or critically elevated values (n = 5). Fifteen of these patients were inpatients when the tests were ordered, and 31 were outpatients. In 15 of 46 abnormal cases, there was no documentation in the electronic medical record that the responsible physician was aware of the result. Of the 15 cases without documentation, 6 of the responsible physicians in such cases were aware of the results.
- Conclusion: One-third of patients with abnormal lab testing for pheochromocytoma did not have clearly documented follow-up in the electronic medical record, and the majority of physicians in such cases were not aware of the results. Changes to the processes at health care institutions and reference laboratories are needed to improve follow-up of send-out lab results.
Delayed or missed follow-up of laboratory tests is a major source of medical harm [1–5]. Testing performed in both the inpatient and outpatient settings is susceptible to lost follow-up, in part because medical testing is a complex process that is vulnerable to multiple process-of-care failures [1,5–7]. In previous studies, the rate of missed follow-up of abnormal medical test results has ranged from 1% to 75% [6]. Laboratory test follow-up is a particularly challenging problem as patients transition between care settings [8,9]. In a study of 86 patients at one academic medical center, Moore and colleagues found that over a 1-year period, 41% of patients who had laboratory tests pending at the time of discharge had no documented follow-up for at least one of those tests [9]. More recently, Roy and colleagues reported that nearly half of 2644 patients discharged from general medicine hospitalist services at 2 academic tertiary care centers had pending laboratory or radiographic results. Nine percent of the pending results were potentially actionable, and a follow-up survey from the study revealed that 61% of physicians were unaware of pending results [10]. Similar findings have been reported in ambulatory care [5,8,11].
Among the universe of laboratory tests, tests performed at reference laboratories outside of the hospital or clinic where care is rendered (ie, “send-out” tests) are particularly susceptible to lost follow-up [12,13]. Because many of these tests are expensive and infrequently ordered, it is most feasible and economical for hospitals and clinics to transport these samples to regional or national laboratories for specialized testing [14,15]. Examples include the serotonin release assay, certain rheumatologic studies, cancer genetics, and advanced endocrine testing. Send-out testing poses several potential risks including accidental ordering of the wrong test, processing or transportation delays, failure of the outside laboratory to receive the specimen, failures of results reporting by the reference laboratory, incorrect result entry into the electronic medical record upon receipt, failure of the clinician to receive or note the result, or failure of clinician to interpret or act on the result [12,13,15]. Although previous studies have identified risk factors associated with missed abnormal test results [1], none to our knowledge have assessed the particular risks associated with samples processed at reference laboratories.
A critical event at our hospital involved a young woman who presented with respiratory failure attributed to a community-acquired pneumonia and systolic congestive heart failure that was thought to be related to her acute illness. Serum and urine metanephrines were ordered in the intensive care unit given the possibility that heart failure in a young patient could be attributed to an occult neuroendocrine tumor. The patient improved clinically and was discharged. Because the discharging service was unaware that the metanephrine tests had been ordered and were being processed at a national reference laboratory, they did not follow up on the test result or include it as pending in the discharge summary. Fortunately, the patient’s primary care physician discovered that the metanephrine levels were elevated and referred the patient for endocrine evaluation and definitive treatment.
Given the risk represented by pending send-out tests raised by this episode, we performed a retrospective study to identify other cases of missed abnormal send-out tests for metanephrines and catecholamines for in- and outpatients over the previous 3 years. We also sought to identify factors that increased the risk of failed follow-up.
Methods
Subjects and Setting
We studied adult in- and outpatients who received care at a 415-bed Boston-based academic medical center.
Project Design and Data Collection
We performed a retrospective record review of a cohort of patients with abnormal send-out laboratory tests for metanephrines and catecholamines. We collected laboratory reports of all results of urine and serum metanephrine and catecholamine tests performed from 1 January 2012 through 31 December 2014. All tests were performed at and reported by Quest Diagnostics in Chantilly, Virginia. The relevant tests were identified using a query of the online Quest Diagnostics system to extract all laboratory results for serum metanephrines, serum catecholamines, urine metanephrines, and urine catecholamines that resulted during this period. Reports were PDF files that were printed and reviewed manually. (Of note, providers typically view lab results directly in the electronic medical record. Reports were extracted from the Quest Diagnostics system for study purposes only.)
We used the reference ranges supplied by the laboratory to sort results into: normal levels, moderately elevated levels (1 to 4 times the upper limit of normal), and critically elevated levels (greater than 4 times the upper limit of normal). A physician (RZ) then reviewed the electronic medical record of each patient with moderately or critically elevated results for evidence that the responsible physician was aware of the results and had documented a follow-up plan. Documentation of physician awareness and follow-up was ascertained by notation and interpretation of the test result in either a discharge summary from the index admission or in an outpatient clinic note. The responsible physician was defined as the ordering physician for tests ordered in ambulatory care and the attending physician at time of discharge for inpatients. In cases where no documentation was identified in the medical record, the responsible physicians received an email questionnaire that asked (1) if they were aware of the abnormal result, (2) if aware of the result, did they notify the primary care physician or referring physician, and (3) if they were aware of any further follow-up or intervention.
Analysis
We stratified the cases into those with normal and abnormal labs values, and then further by those that did and did not have documentation of results and follow-up in the medical record. We then further stratified cases into those in which the responsible physician was aware and those in which they were unaware. If unaware, the patient was contacted directly by the risk management department, primarily for patient safety purposes. If we were unable to contact the patient, the patient’s listed primary care physician was contacted directly. We then performed qualitative analysis of the cases with abnormal results and no documented follow-up, with the goal of identifying common themes.
Results
During the 3-year look-back period, 451 send-out tests for 332 patients were ordered for serum metanephrines, serum catecholamines, urine catecholamines, or metanephrines. Fifty-five tests affecting 46 patients returned with either moderately or critically elevated values, while 396 results affecting 286 patients returned within the reference range. Five patients had critically elevated values and 41 patients had moderately elevated values. Fifteen were inpatients when the tests were ordered and 31 were outpatients.
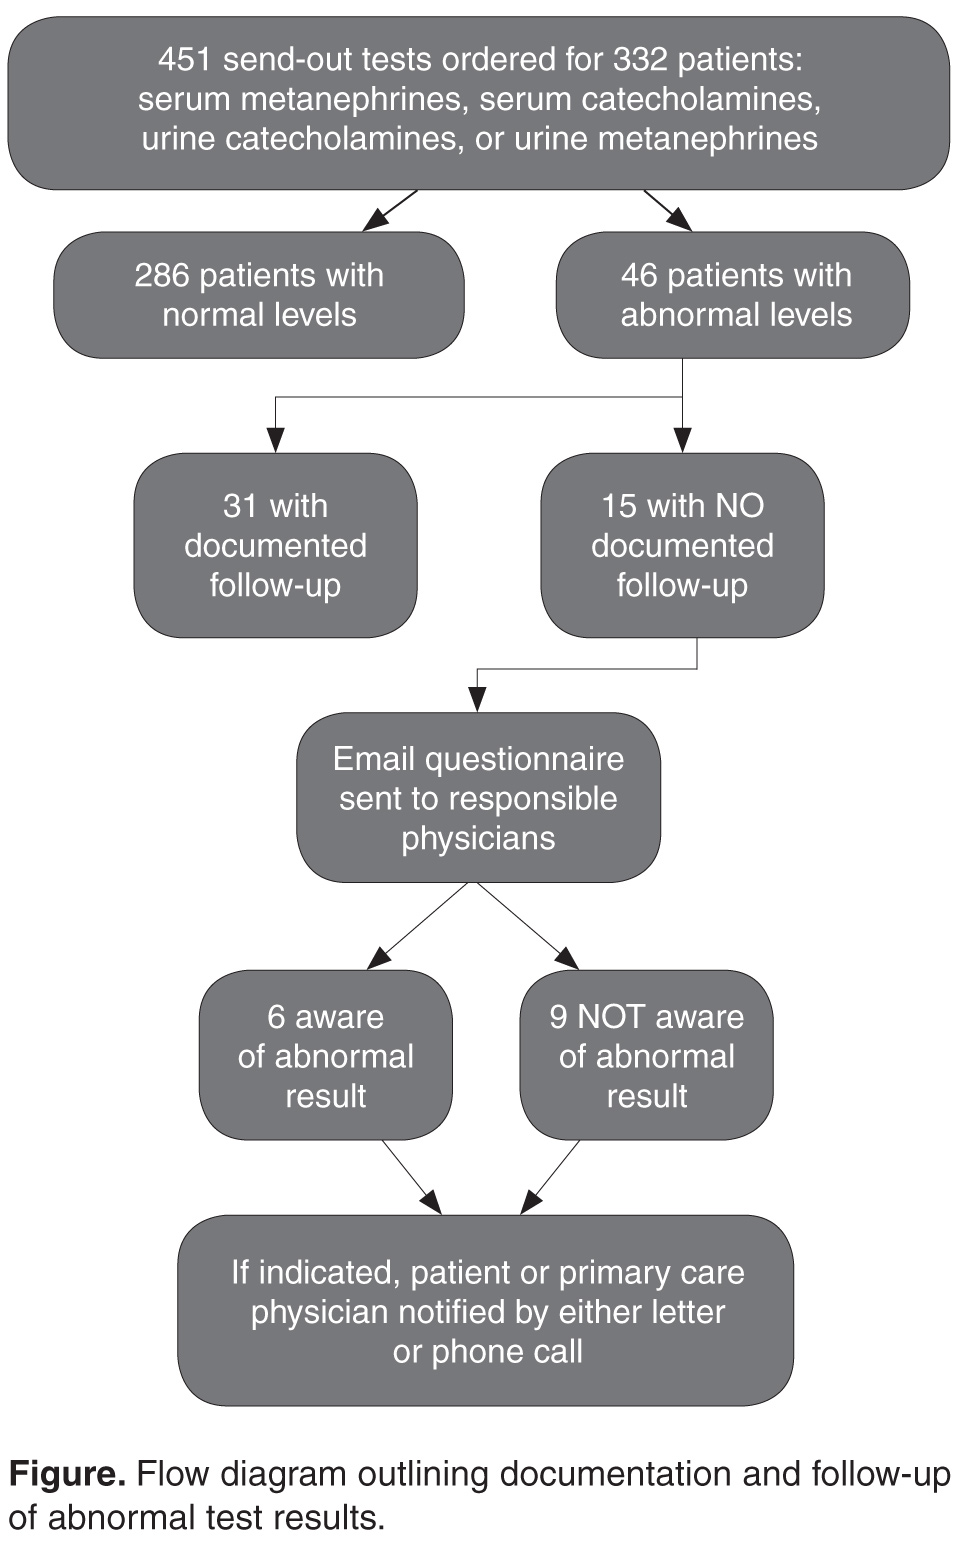
In the survey of the responsible physicians in the 15 cases with no follow-up, all 15 physicians responded. Six were aware of the abnormal result and 9 were not (Figure). Five of the 6 cases in which the physician was aware were outpatients. Eight of the 9 cases in which the physician was not aware were inpatients. In 4 of 15 abnormal cases with no follow-up, the patient was seen at a follow-up appointment but the lab results were not addressed. In 3 of 15 abnormal cases with no follow-up, the patient did not return for a planned follow-up appointment. In 3 of 15 abnormal cases with no follow-up, the physician was aware and addressed the results, but did not document that the results were addressed (all 3 were outpatient cases). In 3 of 15 abnormal cases with no follow-up, lab results for inpatients were pending at time of discharge and there was no documentation of pending results in the designated space for this in the discharge summary. In 2 of 15 abnormal cases with no follow-up, the patient was followed by a primary care physician outside of our institution. In 7 cases, the patient had multiple subspecialists involved in their care. All undocumented abnormal levels were addressed by our institution, either by contacting the patient or primary care physician, or by determining that the abnormality was not clinically relevant.
Discussion
We identified cases in which patients had abnormal results on tests used to diagnose neuroendocrine tumors such as pheochromocytoma over a 3-year period and sought evidence that a responsible clinician had followed up on the abnormal results. In one-third of abnormal test results, we found no documentation in the medical record that the responsible clinician was aware of the result or had communicated it to another clinician or the patient. This occurred most often in cases in which metanephrine and/or catecholamine levels were pending at the time of hospital discharge, and when a patient who was discharged from the hospital or seen in clinic did not return for a scheduled follow-up appointment. When we followed up with the responsible physician, only 6 in 15 were aware of the abnormal results and had either concluded that they were not clinically significant or had addressed the issue without completing documentation.
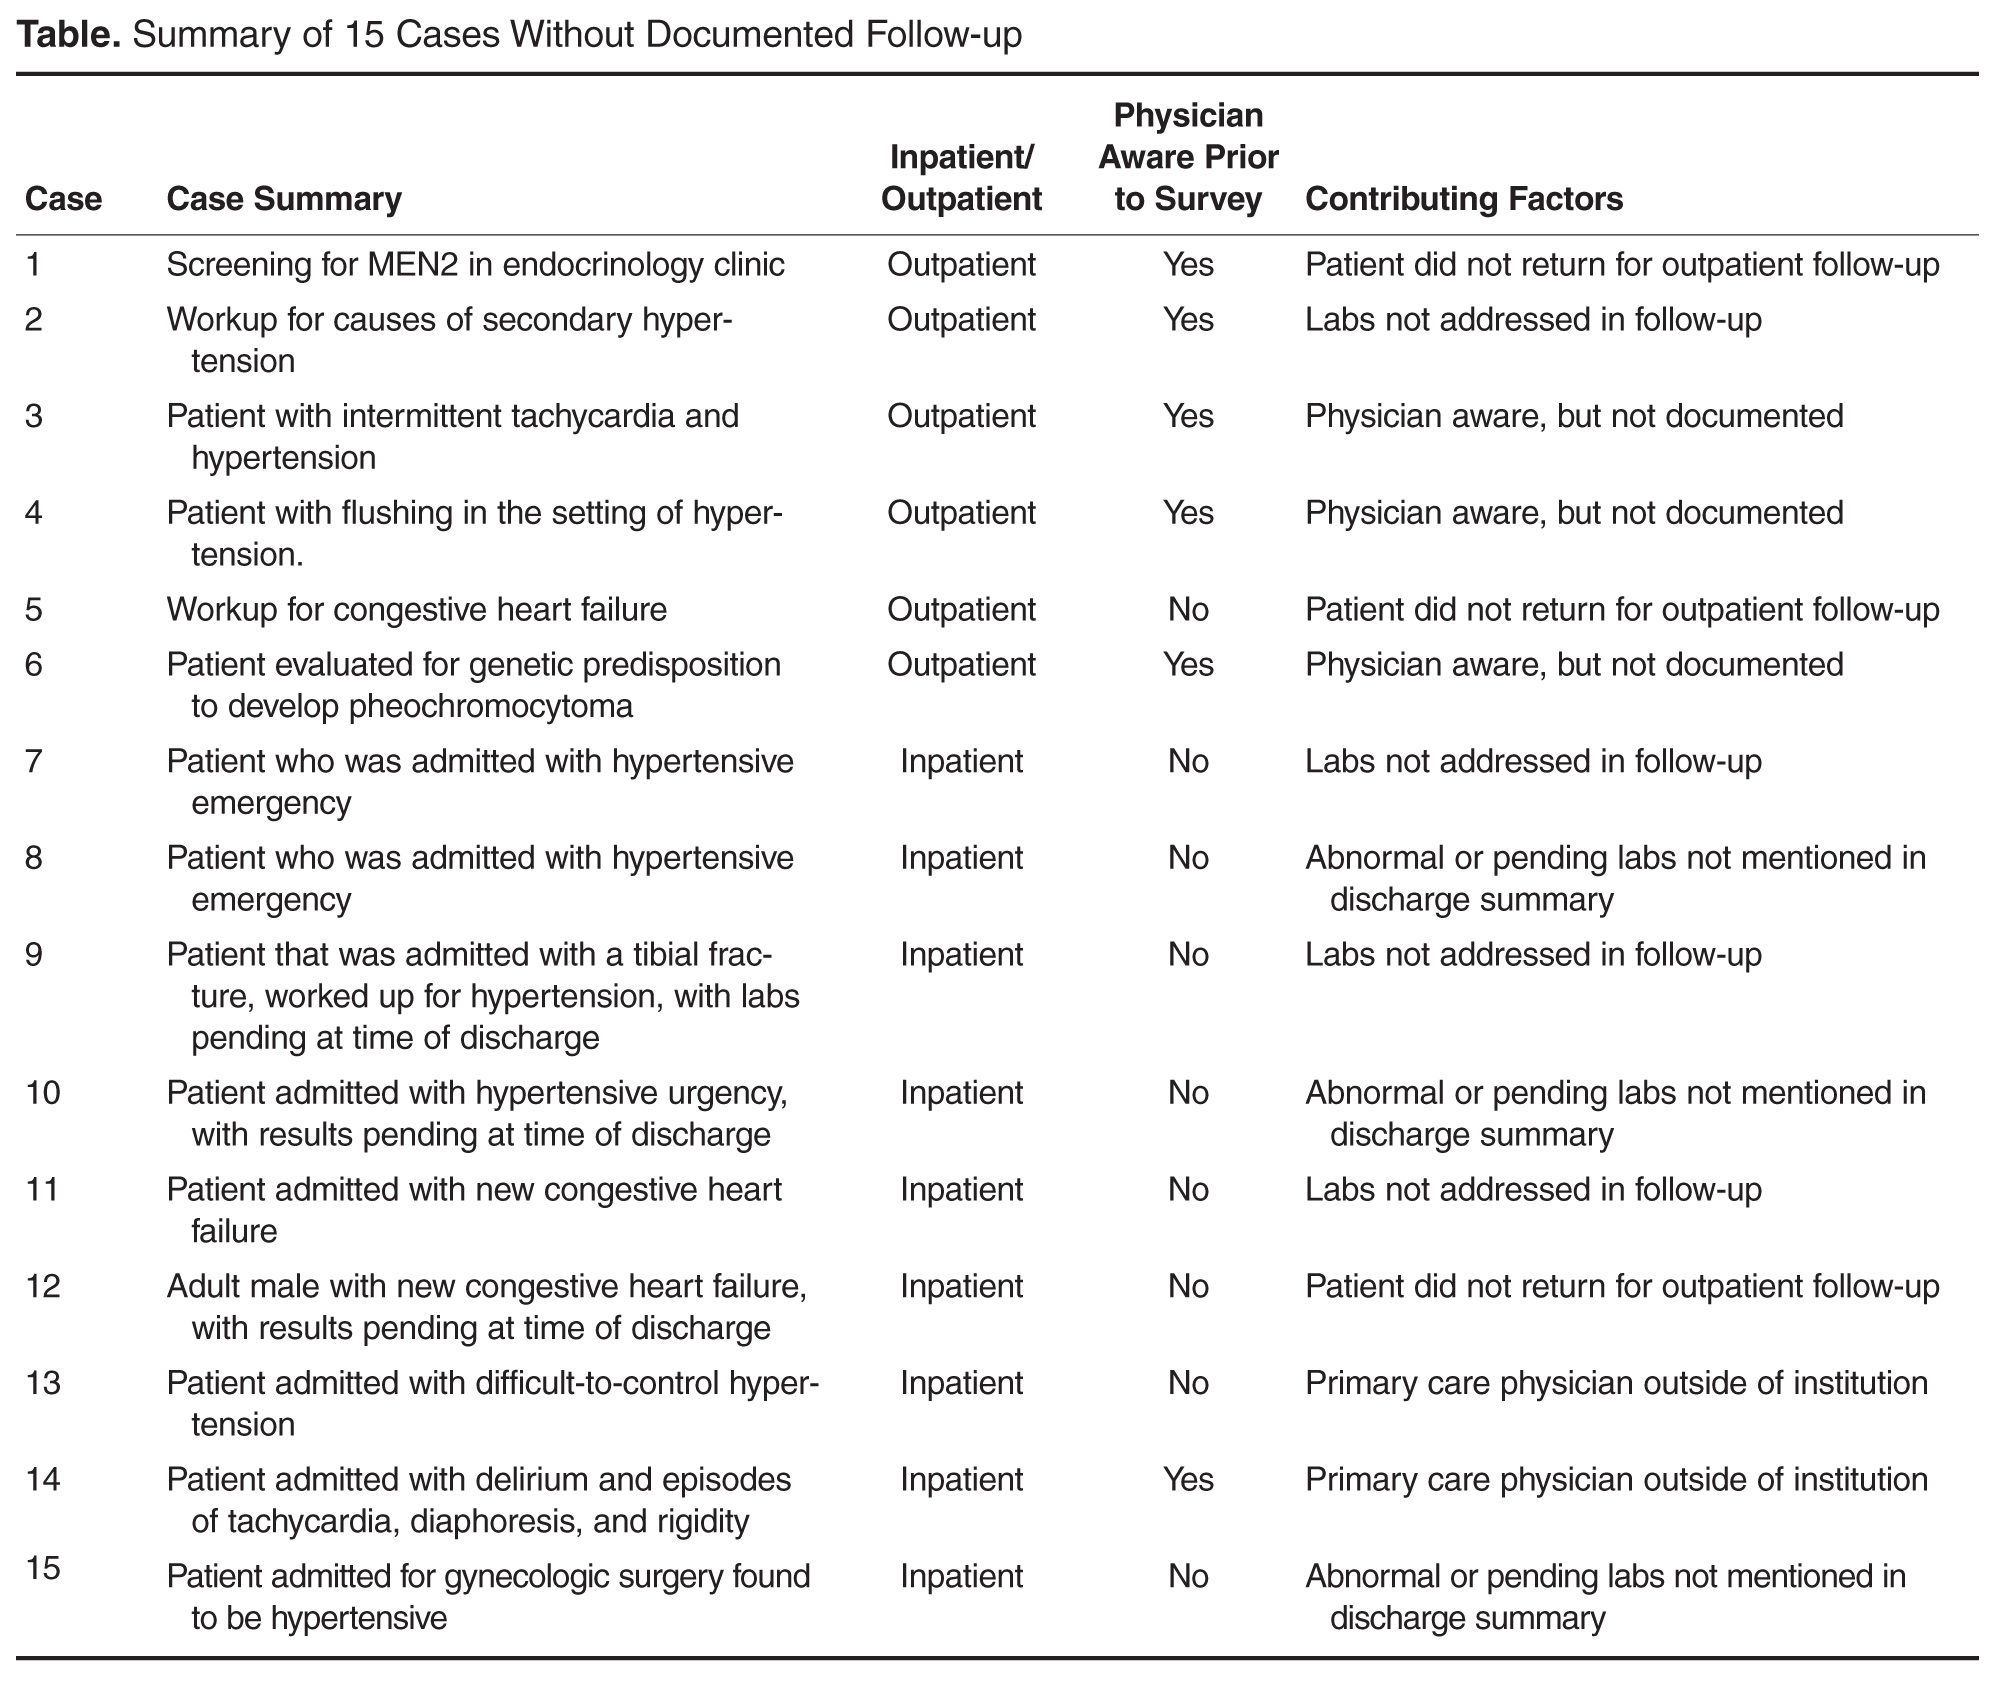
Previous research has identified vulnerabilities in the follow-up of send-out test results that exceed the challenges with tests performed in-house. These include that send-out tests inherently have more steps and require more manual processes [8], and that these tests are more prone to delay, misinterpretation, and poor documentation. Reference laboratories usually provide non-structured reporting of results, often in the form of paper or PDF files. This can make it difficult for receiving hospitals or clinics to incorporate information into the electronic medical record or to build clinical reminders or alerts for ordering clinicians. Additionally, these data elements are often cryptic in that they provide reference values without necessarily setting parameters for abnormalities. This is a case in point with metanephrine and catecholamine testing, as the results are often variable and poorly reproducible and difficult for clinicians to interpret. There are different cutoffs for moderately elevated and critically elevated values, and how to proceed with patients with moderately elevated values is not clear and may require the expertise of subspecialists. Our study confirmed several issues surrounding vulnerabilities of send-out lab testing.
As a single-institution project with a small cohort of subjects, the generalizability of this project may be limited. However, some process-of-care vulnerabilities noted here are similar to those reported in previous research studies [8]. In addition, hospitals and clinics send specimens to a limited number of regional and national reference laboratories. The challenges that our clinicians encountered in managing these results are likely to be challenges in many other organizations. Also, while our study was limited to tests done to evaluate for pheochromocytoma, our findings are likely applicable to other reference laboratory tests.
Send-out labs continue to represent a major source of lost follow-up and potential patient harm. Creating systems with effective and timely alerts for providers will be useful in preventing missed follow-up. Our study found a lack of clear guidelines designating responsibility for pending lab results, which has been found across institutions in previous studies [8]. Since we conducted this project, our institution has reminded clinicians that discharging attendings are responsible for pending lab results at time of discharge and has developed an automated electronic method for delivering these results. Similar policy interventions at other institutions have shown promise [16]. We hope this will minimize the number of lab results, including those of send-out labs, which are not acted upon in a timely manner. However, other issues, including data interface with the electronic medical record and patients with abnormal results being lost to follow-up, remain barriers for our institution to address.
There are several immediate steps that could be taken by health care organizations and reference labs to reduce patient harm as a result of send-out labs that are not followed up. First, health care organizations can develop better integration between electronic records and lab processing for send-out labs, as well as more electronic alerts. This may help to notify ordering physicians after patients have been discharged and the case may not be front of mind. Reference labs should create robust electronic systems to transmit results as electronic data elements so that health care organizations can easily incorporate results into their electronic medical records, and develop notification systems that flag out-of-bound values. Secure online lab results for send-outs may shorten the delay in reporting. Additionally, creating clear policies establishing the responsible provider is crucial, as has been found by previous research by Singh and others [11,15].
In conclusion, send-out labs are vulnerable to lost follow-up. It is crucial for clinicians to be aware of all send-out lab results and to document their interpretation of abnormal results. Developing policies and systems to facilitate timely follow-up will help to reduce potential patient harm related to send-out labs.
Corresponding author: Richard Zamore, MD, MPH, Tufts Medical Center, 800 Washington St., Boston, MA 02111, [email protected].
Financial disclosures: None.
1. Callen J, Georgiou A, Li J, Westbrook JI, et al. The safety implications of missed test results for hospitalised patients: a systematic review. BMJ Qual Saf 2011;20:194–9.
2. Wahls TL, Cram PM. The frequency of missed test results and associated treatment delays in a highly computerized health system. BMC Fam Pract 2007;8:32.
3. Bates DW, Leape LL. Doing better with critical test results. Jt Comm J Qual Patient Saf 2005;31:66–7.
4. Schiff GD, Kim S, Krosnjar N, et al. Missed hypothyroidism diagnosis uncovered by linking laboratory and pharmacy data. Arch Intern Med 2005;165:574.
5. Singh H, Thomas EJ, Sittig DF, et al. Notification of abnormal lab test results in an electronic medical record: do any safety concerns remain? Am J Med 2010;123:238–44.
6. Hickner J, Graham DG, Elder NC, et al. Testing process errors and their harms and consequences reported from family medicine practices: a study of the American Academy of Family Physicians National Research Network. Qual Saf Health Care 2008;17:194–200.
7. Casalino LP, Dunham D, Chin MH, et al. Frequency of failure to inform patients of clinically significant outpatient test results. Arch Intern Med 2009;169:1123–9.
8. Callen JL, Westbrook JI, Georgiou A, et al. Failure to follow-up test results for ambulatory patients: a systematic review. J Gen Intern Med 2012;27:1334–48.
9. Moore C, Wisnivesky J, Williams S, et al. Medical errors related to discontinuity of care from an inpatient to an outpatient setting. J Gen Intern Med 2003;18:646–51.
10. Roy CL, Poon EG, Karson AS, et al. Patient safety concerns arising from test results that return after hospital discharge. Ann Intern Med 2005;143:121–8.
11. Singh H, Wilson L, Reis B, et al. Ten strategies to improve management of abnormal test result alerts in the electronic health record. J Patient Saf 2010;6:121–3.
12. Dickerson JA, Cole B, Astion ML. Ten ways to improve the quality of send-out testing. Clin Lab News 2012;38:12–3.
13. Cole B, Dickerson JA, Graber ML, et al. A prospective tool for risk assessment of sendout testing. Clin Chim Acta 2014;434:1–5.
14. MacMillan D, Lewandrowski E, Lewandrowski K. An analysis of reference laboratory (send out) testing: an 8-year experience in a large academic medical center. Clin Leadersh Manag Rev 2004;18:216–9.
15. Krasowski MD, Chudzik D, Dolezal A, et al. Promoting improved utilization of laboratory testing through changes in an electronic medical record: experience at an academic medical center. BMC Med Inform Decis Mak 2015;15:11.
16. Singh H, Arora HS, Vij MS, et al. Communication outcomes of critical imaging results in a computerized notification system. J Am Med Inform Assoc 2007;14:459–66.
From the Department of Medicine, Tufts Medical Center, Boston, MA.
Abstract
- Objective: To measure the frequency of missed pheochromocytoma test results and identify factors related to the risk of failed follow-up.
- Methods: We performed a retrospective review of the medical record to identify patients with abnormal urine or serum metanephrine or catecholamine test results over a 3-year period. We then searched the electronic medical record for documentation that the responsible physician was aware of the test results. We surveyed the physicians in cases where there were abnormal results and no documented follow-up to assess their awareness of the results and any follow-up actions they may have taken.
- Results: During the 3-year look-back period, 451 send-out tests for 332 patients were ordered for serum metanephrines, serum catecholamines, or urine catecholamines and/or metanephrines. Fifty-five tests affecting 46 patients returned with either moderately (n = 41) or critically elevated values (n = 5). Fifteen of these patients were inpatients when the tests were ordered, and 31 were outpatients. In 15 of 46 abnormal cases, there was no documentation in the electronic medical record that the responsible physician was aware of the result. Of the 15 cases without documentation, 6 of the responsible physicians in such cases were aware of the results.
- Conclusion: One-third of patients with abnormal lab testing for pheochromocytoma did not have clearly documented follow-up in the electronic medical record, and the majority of physicians in such cases were not aware of the results. Changes to the processes at health care institutions and reference laboratories are needed to improve follow-up of send-out lab results.
Delayed or missed follow-up of laboratory tests is a major source of medical harm [1–5]. Testing performed in both the inpatient and outpatient settings is susceptible to lost follow-up, in part because medical testing is a complex process that is vulnerable to multiple process-of-care failures [1,5–7]. In previous studies, the rate of missed follow-up of abnormal medical test results has ranged from 1% to 75% [6]. Laboratory test follow-up is a particularly challenging problem as patients transition between care settings [8,9]. In a study of 86 patients at one academic medical center, Moore and colleagues found that over a 1-year period, 41% of patients who had laboratory tests pending at the time of discharge had no documented follow-up for at least one of those tests [9]. More recently, Roy and colleagues reported that nearly half of 2644 patients discharged from general medicine hospitalist services at 2 academic tertiary care centers had pending laboratory or radiographic results. Nine percent of the pending results were potentially actionable, and a follow-up survey from the study revealed that 61% of physicians were unaware of pending results [10]. Similar findings have been reported in ambulatory care [5,8,11].
Among the universe of laboratory tests, tests performed at reference laboratories outside of the hospital or clinic where care is rendered (ie, “send-out” tests) are particularly susceptible to lost follow-up [12,13]. Because many of these tests are expensive and infrequently ordered, it is most feasible and economical for hospitals and clinics to transport these samples to regional or national laboratories for specialized testing [14,15]. Examples include the serotonin release assay, certain rheumatologic studies, cancer genetics, and advanced endocrine testing. Send-out testing poses several potential risks including accidental ordering of the wrong test, processing or transportation delays, failure of the outside laboratory to receive the specimen, failures of results reporting by the reference laboratory, incorrect result entry into the electronic medical record upon receipt, failure of the clinician to receive or note the result, or failure of clinician to interpret or act on the result [12,13,15]. Although previous studies have identified risk factors associated with missed abnormal test results [1], none to our knowledge have assessed the particular risks associated with samples processed at reference laboratories.
A critical event at our hospital involved a young woman who presented with respiratory failure attributed to a community-acquired pneumonia and systolic congestive heart failure that was thought to be related to her acute illness. Serum and urine metanephrines were ordered in the intensive care unit given the possibility that heart failure in a young patient could be attributed to an occult neuroendocrine tumor. The patient improved clinically and was discharged. Because the discharging service was unaware that the metanephrine tests had been ordered and were being processed at a national reference laboratory, they did not follow up on the test result or include it as pending in the discharge summary. Fortunately, the patient’s primary care physician discovered that the metanephrine levels were elevated and referred the patient for endocrine evaluation and definitive treatment.
Given the risk represented by pending send-out tests raised by this episode, we performed a retrospective study to identify other cases of missed abnormal send-out tests for metanephrines and catecholamines for in- and outpatients over the previous 3 years. We also sought to identify factors that increased the risk of failed follow-up.
Methods
Subjects and Setting
We studied adult in- and outpatients who received care at a 415-bed Boston-based academic medical center.
Project Design and Data Collection
We performed a retrospective record review of a cohort of patients with abnormal send-out laboratory tests for metanephrines and catecholamines. We collected laboratory reports of all results of urine and serum metanephrine and catecholamine tests performed from 1 January 2012 through 31 December 2014. All tests were performed at and reported by Quest Diagnostics in Chantilly, Virginia. The relevant tests were identified using a query of the online Quest Diagnostics system to extract all laboratory results for serum metanephrines, serum catecholamines, urine metanephrines, and urine catecholamines that resulted during this period. Reports were PDF files that were printed and reviewed manually. (Of note, providers typically view lab results directly in the electronic medical record. Reports were extracted from the Quest Diagnostics system for study purposes only.)
We used the reference ranges supplied by the laboratory to sort results into: normal levels, moderately elevated levels (1 to 4 times the upper limit of normal), and critically elevated levels (greater than 4 times the upper limit of normal). A physician (RZ) then reviewed the electronic medical record of each patient with moderately or critically elevated results for evidence that the responsible physician was aware of the results and had documented a follow-up plan. Documentation of physician awareness and follow-up was ascertained by notation and interpretation of the test result in either a discharge summary from the index admission or in an outpatient clinic note. The responsible physician was defined as the ordering physician for tests ordered in ambulatory care and the attending physician at time of discharge for inpatients. In cases where no documentation was identified in the medical record, the responsible physicians received an email questionnaire that asked (1) if they were aware of the abnormal result, (2) if aware of the result, did they notify the primary care physician or referring physician, and (3) if they were aware of any further follow-up or intervention.
Analysis
We stratified the cases into those with normal and abnormal labs values, and then further by those that did and did not have documentation of results and follow-up in the medical record. We then further stratified cases into those in which the responsible physician was aware and those in which they were unaware. If unaware, the patient was contacted directly by the risk management department, primarily for patient safety purposes. If we were unable to contact the patient, the patient’s listed primary care physician was contacted directly. We then performed qualitative analysis of the cases with abnormal results and no documented follow-up, with the goal of identifying common themes.
Results
During the 3-year look-back period, 451 send-out tests for 332 patients were ordered for serum metanephrines, serum catecholamines, urine catecholamines, or metanephrines. Fifty-five tests affecting 46 patients returned with either moderately or critically elevated values, while 396 results affecting 286 patients returned within the reference range. Five patients had critically elevated values and 41 patients had moderately elevated values. Fifteen were inpatients when the tests were ordered and 31 were outpatients.
In the survey of the responsible physicians in the 15 cases with no follow-up, all 15 physicians responded. Six were aware of the abnormal result and 9 were not (Figure). Five of the 6 cases in which the physician was aware were outpatients. Eight of the 9 cases in which the physician was not aware were inpatients. In 4 of 15 abnormal cases with no follow-up, the patient was seen at a follow-up appointment but the lab results were not addressed. In 3 of 15 abnormal cases with no follow-up, the patient did not return for a planned follow-up appointment. In 3 of 15 abnormal cases with no follow-up, the physician was aware and addressed the results, but did not document that the results were addressed (all 3 were outpatient cases). In 3 of 15 abnormal cases with no follow-up, lab results for inpatients were pending at time of discharge and there was no documentation of pending results in the designated space for this in the discharge summary. In 2 of 15 abnormal cases with no follow-up, the patient was followed by a primary care physician outside of our institution. In 7 cases, the patient had multiple subspecialists involved in their care. All undocumented abnormal levels were addressed by our institution, either by contacting the patient or primary care physician, or by determining that the abnormality was not clinically relevant.
Discussion
We identified cases in which patients had abnormal results on tests used to diagnose neuroendocrine tumors such as pheochromocytoma over a 3-year period and sought evidence that a responsible clinician had followed up on the abnormal results. In one-third of abnormal test results, we found no documentation in the medical record that the responsible clinician was aware of the result or had communicated it to another clinician or the patient. This occurred most often in cases in which metanephrine and/or catecholamine levels were pending at the time of hospital discharge, and when a patient who was discharged from the hospital or seen in clinic did not return for a scheduled follow-up appointment. When we followed up with the responsible physician, only 6 in 15 were aware of the abnormal results and had either concluded that they were not clinically significant or had addressed the issue without completing documentation.
Previous research has identified vulnerabilities in the follow-up of send-out test results that exceed the challenges with tests performed in-house. These include that send-out tests inherently have more steps and require more manual processes [8], and that these tests are more prone to delay, misinterpretation, and poor documentation. Reference laboratories usually provide non-structured reporting of results, often in the form of paper or PDF files. This can make it difficult for receiving hospitals or clinics to incorporate information into the electronic medical record or to build clinical reminders or alerts for ordering clinicians. Additionally, these data elements are often cryptic in that they provide reference values without necessarily setting parameters for abnormalities. This is a case in point with metanephrine and catecholamine testing, as the results are often variable and poorly reproducible and difficult for clinicians to interpret. There are different cutoffs for moderately elevated and critically elevated values, and how to proceed with patients with moderately elevated values is not clear and may require the expertise of subspecialists. Our study confirmed several issues surrounding vulnerabilities of send-out lab testing.
As a single-institution project with a small cohort of subjects, the generalizability of this project may be limited. However, some process-of-care vulnerabilities noted here are similar to those reported in previous research studies [8]. In addition, hospitals and clinics send specimens to a limited number of regional and national reference laboratories. The challenges that our clinicians encountered in managing these results are likely to be challenges in many other organizations. Also, while our study was limited to tests done to evaluate for pheochromocytoma, our findings are likely applicable to other reference laboratory tests.
Send-out labs continue to represent a major source of lost follow-up and potential patient harm. Creating systems with effective and timely alerts for providers will be useful in preventing missed follow-up. Our study found a lack of clear guidelines designating responsibility for pending lab results, which has been found across institutions in previous studies [8]. Since we conducted this project, our institution has reminded clinicians that discharging attendings are responsible for pending lab results at time of discharge and has developed an automated electronic method for delivering these results. Similar policy interventions at other institutions have shown promise [16]. We hope this will minimize the number of lab results, including those of send-out labs, which are not acted upon in a timely manner. However, other issues, including data interface with the electronic medical record and patients with abnormal results being lost to follow-up, remain barriers for our institution to address.
There are several immediate steps that could be taken by health care organizations and reference labs to reduce patient harm as a result of send-out labs that are not followed up. First, health care organizations can develop better integration between electronic records and lab processing for send-out labs, as well as more electronic alerts. This may help to notify ordering physicians after patients have been discharged and the case may not be front of mind. Reference labs should create robust electronic systems to transmit results as electronic data elements so that health care organizations can easily incorporate results into their electronic medical records, and develop notification systems that flag out-of-bound values. Secure online lab results for send-outs may shorten the delay in reporting. Additionally, creating clear policies establishing the responsible provider is crucial, as has been found by previous research by Singh and others [11,15].
In conclusion, send-out labs are vulnerable to lost follow-up. It is crucial for clinicians to be aware of all send-out lab results and to document their interpretation of abnormal results. Developing policies and systems to facilitate timely follow-up will help to reduce potential patient harm related to send-out labs.
Corresponding author: Richard Zamore, MD, MPH, Tufts Medical Center, 800 Washington St., Boston, MA 02111, [email protected].
Financial disclosures: None.
1. Callen J, Georgiou A, Li J, Westbrook JI, et al. The safety implications of missed test results for hospitalised patients: a systematic review. BMJ Qual Saf 2011;20:194–9.
2. Wahls TL, Cram PM. The frequency of missed test results and associated treatment delays in a highly computerized health system. BMC Fam Pract 2007;8:32.
3. Bates DW, Leape LL. Doing better with critical test results. Jt Comm J Qual Patient Saf 2005;31:66–7.
4. Schiff GD, Kim S, Krosnjar N, et al. Missed hypothyroidism diagnosis uncovered by linking laboratory and pharmacy data. Arch Intern Med 2005;165:574.
5. Singh H, Thomas EJ, Sittig DF, et al. Notification of abnormal lab test results in an electronic medical record: do any safety concerns remain? Am J Med 2010;123:238–44.
6. Hickner J, Graham DG, Elder NC, et al. Testing process errors and their harms and consequences reported from family medicine practices: a study of the American Academy of Family Physicians National Research Network. Qual Saf Health Care 2008;17:194–200.
7. Casalino LP, Dunham D, Chin MH, et al. Frequency of failure to inform patients of clinically significant outpatient test results. Arch Intern Med 2009;169:1123–9.
8. Callen JL, Westbrook JI, Georgiou A, et al. Failure to follow-up test results for ambulatory patients: a systematic review. J Gen Intern Med 2012;27:1334–48.
9. Moore C, Wisnivesky J, Williams S, et al. Medical errors related to discontinuity of care from an inpatient to an outpatient setting. J Gen Intern Med 2003;18:646–51.
10. Roy CL, Poon EG, Karson AS, et al. Patient safety concerns arising from test results that return after hospital discharge. Ann Intern Med 2005;143:121–8.
11. Singh H, Wilson L, Reis B, et al. Ten strategies to improve management of abnormal test result alerts in the electronic health record. J Patient Saf 2010;6:121–3.
12. Dickerson JA, Cole B, Astion ML. Ten ways to improve the quality of send-out testing. Clin Lab News 2012;38:12–3.
13. Cole B, Dickerson JA, Graber ML, et al. A prospective tool for risk assessment of sendout testing. Clin Chim Acta 2014;434:1–5.
14. MacMillan D, Lewandrowski E, Lewandrowski K. An analysis of reference laboratory (send out) testing: an 8-year experience in a large academic medical center. Clin Leadersh Manag Rev 2004;18:216–9.
15. Krasowski MD, Chudzik D, Dolezal A, et al. Promoting improved utilization of laboratory testing through changes in an electronic medical record: experience at an academic medical center. BMC Med Inform Decis Mak 2015;15:11.
16. Singh H, Arora HS, Vij MS, et al. Communication outcomes of critical imaging results in a computerized notification system. J Am Med Inform Assoc 2007;14:459–66.
Interhospital patient transfers must be standardized
Imagine the following scenario: a hospitalist on the previous shift accepted a patient from another hospital and received a verbal sign-out at the time of acceptance. Now, 14 hours later, a bed at your hospital is finally available. You were advised that the patient was hemodynamically stable, but that was 8 hours ago. The patient arrives in respiratory distress with a blood pressure of 75/40, and phenylephrine running through a 20g IV in the forearm.
A 400-page printout of the patient’s electronic chart arrives – but no discharge summary is found. You are now responsible for stabilizing the patient and getting to the bottom of why your patient decompensated.

The above vignette is the “worst-case” scenario, yet it highlights how treacherous interhospital transfer can be. A recent study, published in the Journal of Hospital Medicine (doi: 10.1002/jhm.2515), found increased in-hospital mortality (adjusted odds ratio 1.36 [1.29-1.43]) for medical interhospital transfer patients as compared with those admitted from the ED. When care is transferred between hospitals, additional hurdles such as lack of face-to-face sign-out, delays in transport and bed availability, and lack of electronic medical record (EMR) interoperability all contribute to miscommunication and may lead to errors in diagnosis and delay of definitive care.
Diametrically opposed to our many victories in providing technologically advanced medical care, our inability to coordinate even the most basic care across hospitals is an unfortunate reality of our fragmented health care system, and must be promptly addressed.
There currently exists no widely accepted standard of care for communication between hospitals regarding transferred patients. Commonalities include a mandatory three-way recorded physician verbal handoff and a transmission of an insurance face sheet. However, real-time concurrent EMR connectivity and clinical status updates as frequently as every 2 hours in critically ill patients are uncommon, as our own study found (doi: 10.1002/jhm.2577).

The lack of a standard of care for interhospital handoffs is, in part, why every transfer is potentially problematic. Many tertiary referral centers receive patients from more than 100 different hospitals and networks, amplifying the need for universal expectations. With differences in expectations among sending and receiving hospitals, there is ample room for variable outcomes, ranging from smooth transfers to the worst-case scenario described above. Enhanced shared decision making between providers at both hospitals, facilitated via communication tools and transfer centers, could lead to more fluid care of the transferred patient.
In order to establish standardized interhospital handoffs, a multicenter study is needed to examine outcomes of various transfer practices. A standard of communication and transfer handoff practices, based on those that lead to better outcomes, could potentially be established. Until this is studied, it is imperative that hospital systems and the government work to adopt broader EMR interoperability and radiology networks; comprehensive health information exchanges can minimize redundancy and provide real-time clinical data to make transfers safer.
Ideally, interhospital transfer should provide no more risk to a patient than a routine shift change of care providers.
Dr. Dana Herrigel is associate program director, internal medicine residency at Robert Wood Johnson Medical School, New Brunswick, N.J. Dr. Madeline Carroll is PGY-3 internal medicine at Robert Wood Johnson Medical School.
Imagine the following scenario: a hospitalist on the previous shift accepted a patient from another hospital and received a verbal sign-out at the time of acceptance. Now, 14 hours later, a bed at your hospital is finally available. You were advised that the patient was hemodynamically stable, but that was 8 hours ago. The patient arrives in respiratory distress with a blood pressure of 75/40, and phenylephrine running through a 20g IV in the forearm.
A 400-page printout of the patient’s electronic chart arrives – but no discharge summary is found. You are now responsible for stabilizing the patient and getting to the bottom of why your patient decompensated.
The above vignette is the “worst-case” scenario, yet it highlights how treacherous interhospital transfer can be. A recent study, published in the Journal of Hospital Medicine (doi: 10.1002/jhm.2515), found increased in-hospital mortality (adjusted odds ratio 1.36 [1.29-1.43]) for medical interhospital transfer patients as compared with those admitted from the ED. When care is transferred between hospitals, additional hurdles such as lack of face-to-face sign-out, delays in transport and bed availability, and lack of electronic medical record (EMR) interoperability all contribute to miscommunication and may lead to errors in diagnosis and delay of definitive care.
Diametrically opposed to our many victories in providing technologically advanced medical care, our inability to coordinate even the most basic care across hospitals is an unfortunate reality of our fragmented health care system, and must be promptly addressed.
There currently exists no widely accepted standard of care for communication between hospitals regarding transferred patients. Commonalities include a mandatory three-way recorded physician verbal handoff and a transmission of an insurance face sheet. However, real-time concurrent EMR connectivity and clinical status updates as frequently as every 2 hours in critically ill patients are uncommon, as our own study found (doi: 10.1002/jhm.2577).
The lack of a standard of care for interhospital handoffs is, in part, why every transfer is potentially problematic. Many tertiary referral centers receive patients from more than 100 different hospitals and networks, amplifying the need for universal expectations. With differences in expectations among sending and receiving hospitals, there is ample room for variable outcomes, ranging from smooth transfers to the worst-case scenario described above. Enhanced shared decision making between providers at both hospitals, facilitated via communication tools and transfer centers, could lead to more fluid care of the transferred patient.
In order to establish standardized interhospital handoffs, a multicenter study is needed to examine outcomes of various transfer practices. A standard of communication and transfer handoff practices, based on those that lead to better outcomes, could potentially be established. Until this is studied, it is imperative that hospital systems and the government work to adopt broader EMR interoperability and radiology networks; comprehensive health information exchanges can minimize redundancy and provide real-time clinical data to make transfers safer.
Ideally, interhospital transfer should provide no more risk to a patient than a routine shift change of care providers.
Dr. Dana Herrigel is associate program director, internal medicine residency at Robert Wood Johnson Medical School, New Brunswick, N.J. Dr. Madeline Carroll is PGY-3 internal medicine at Robert Wood Johnson Medical School.

Evidence-Based Deprescribing: Reversing the Tide of Potentially Inappropriate Polypharmacy
From the Department of Internal Medicine and Clinical Epidemiology, Princess Alexandra Hospital, Ipswich Road, Woolloongabba, Queensland, Australia (Dr. Scott), School of Medicine, The University of Queensland, Herston Road, Brisbane, Australia (Dr. Scott), Centre of Research Excellence in Quality & Safety in Integrated Primary-Secondary Care, The University of Queensland, Herston Road, Brisbane, Australia (Ms. Anderson), and Charming Institute, Camp Hill, Brisbane, Queensland, Australia (Dr. Freeman).
Abstract
- Objective: To review the adverse drug events (ADEs) risk of polypharmacy; the process of deprescribing and evidence of efficacy in reducing inappropriate polypharmacy; the enablers and barriers to deprescribing; and patient and system of care level strategies that can be employed to enhance deprescribing.
- Methods: Literature review.
- Results: Inappropriate polypharmacy, especially in older people, imposes a significant burden of ADEs, ill health, disability, hospitalization and even death. The single most important predictor of inappropriate prescribing and risk of ADEs in older patients is the number of prescribed medicines. Deprescribing is the process of systematically reviewing, identifying, and discontinuing potentially inappropriate medicines (PIMs), aimed at minimizing polypharmacy and improving patient outcomes. Evidence of efficacy for deprescribing is emerging from randomized trials and observational studies, and deprescribing protocols have been developed and validated for clinical use. Barriers and enablers to deprescribing by individual prescribers center on 4 themes: (1) raising awareness of the prevalence and characteristics of PIMs; (2) overcoming clinical inertia whereby discontinuing medicines is seen as being a low value proposition compared to maintaining the status quo; (3) increasing skills and competence (self-efficacy) in deprescribing; and (4) countering external and logistical factors that impede the process.
- Conclusion: In optimizing the scale and effects of deprescribing in clinical practice, strategies that promote depresribing will need to be applied at both the level of individual patient–prescriber encounters and systems of care.
In developed countries in the modern era, about 30% of patients aged 65 years or older are prescribed 5 or more medicines [1]. Over the past decade, the prevalence of polypharmacy (use of > 5 prescription drugs) in the adult population of the United States has doubled from 8.2% in 1999–2000 to 15% in 2011–2012 [2]. While many patients may benefit from such polypharmacy [3] (defined here as 5 or more regularly prescribed medicines), it comes with increased risk of adverse drug events (ADEs) in older people [4] due to physiological changes of aging that alter pharmacokinetic and pharmacodynamic responses to medicines [5]. Approximately 1 in 5 medicines commonly used in older people may be inappropriate [6], rising to a third among those living in residential aged care facilities [7]. Among nursing home residents with advanced dementia, more than half receive at least 1 medicine with questionable benefit [8]. Approximately 50% of hospitalized nursing home or ambulatory care patients receive 1 or more unnecessary medicines [9]. Observational studies have documented ADEs in at least 15% of older patients, contributing to ill health [10], disability [11], hospitalization [12] and readmissions [13], increased length of stay, and, in some cases, death [14]. This high level of iatrogenic harm from potentially inappropriate medicines (PIMs) mandates a response from clinicians responsible for managing medicines.
In this narrative review, we aim to detail the ADE risk of polypharmacy, the process of deprescribing and evidence of its efficacy in reducing potentially inappropriate polypharmacy, the enablers and barriers to deprescribing, and patient and system of care level strategies that can be employed in enhancing deprescribing.
Polypharmacy As a Risk Factor for Medicine-Related Harm
The number of medicines a patient is taking is the single most important predictor of medicine-related harm [15]. One report estimated the risk of ADEs as a contributory cause of patients presenting acutely to hospital emergency departments to be 13% for 2 drugs, 38% for 4 drugs, and 82% for 7 drugs or more [16]. The more medicines an individual takes, the greater their risk of experiencing an adverse drug reaction, a drug-drug interaction, a drug-disease interaction, cascade prescribing (where more medicines are added to counteract side effects of existing medicines), nonadherence, and drug errors (wrong drug, wrong dose, missed doses, erroneous dosing frequency) [17–20]. Once the number of regular medicines rises above 5 (commonly regarded as the threshold for defining polypharmacy), observational data suggest that additional medicines independently increase the risk of frailty, falling, and hospital admission [21].
The benefits of many medicines in frail older people remain unquantified. As many as 50% of clinical trials have a specific upper age limit and approximately 80% of clinical trials exclude people with comorbidities [22,23]. Single-disease treatment guidelines based on such trials are often extrapolated to older people with multimorbidity despite an absence of evidence for benefit [24] and with little consideration of the potential burdens and harms of polypharmacy resulting from treating multiple diseases in the one patient [25]. By contrast, the risks from many medicines in older people are well known. Older people are at high risk of ADEs and toxicity due to reduced renal and liver function and age-related changes in physiological reserve, body composition, and cellular metabolism [26]. While the adverse effects of polypharmacy or of comorbidities targeted for treatment are difficult to separate, the burden of medicine-induced decline in function and quality of life is becoming better defined and appreciated [27].
Defining Evidence-Based Deprescribing
While many definitions have been proposed [28], we define evidence-based deprescribing as follows: the active process of systematically reviewing medicines being used by individual patients and, using best available evidence, identifying and discontinuing those associated with unfavorable risk–benefit trade-offs within the context of illness severity, advanced age, multi-morbidity, physical and emotional capacity, life expectancy, care goals, and personal preferences [29]. An enlarging body of research has demonstrated the feasibility, safety and patient benefit of deprescribing, as discussed further below. It employs evidence-based frameworks that assist the prescriber [30] and are patient-centered [31].
Importantly, deprescribing should be seen as part of the good prescribing continuum, which spans medicine initiation, titrating, changing, or adding medicines, and switching or ceasing medicines. Deprescribing is not about denying effective treatment to eligible patients. It is a positive, patient-centered intervention, with inherent uncertainties, and requires shared decision-making, informed patient consent and close monitoring of effects [32]. Deprescribing involves diagnosing a problem (use of a PIM), making a therapeutic decision (withdrawing it with close follow-up) and altering the natural history of the problem (reducing incidence of medicine-related adverse events).
Our definition of evidence-based deprescribing is a form of direct deprescribing applied at the level of the individual patient-prescriber/pharmacist encounter. Direct deprescribing uses explicit, systematic processes (such as using an algorithm or structured deprescribing framework or guide) applied by individual prescribers (or pharmacists) to the medicine regimens of individual patients (ie, at the patient level), and which targets either specific classes of medicines or all medicines that are potentially inappropriate. This is in contrast to indirect deprescribing, which uses more generic, programmatic strategies aimed at prescribers as a whole (ie, at the population or system level) and which seek to improve quality use of medicines in general, including both underuse and overuse of medicines. Indirect deprescribing entails a broader aim of medicines optimization in which deprescribing is a possible outcome but not necessarily the sole focus. Such strategies include pharmacist or physician medicine reviews, education programs for clinicians and/or patients, academic detailing, audit and feedback, geriatric assessment, multidisciplinary teams, prescribing restrictions, and government policies, all of which aim to reduce the overall burden of PIMs among broad groups of patients. While intuitively the 2 approaches in combination should exert synergistic effects superior to those of either by itself, this has not been studied.
Evidence For Deprescribing
Indirect Deprescribing
Overall, the research into indirect interventions has been highly heterogenous in terms of interventions and measures of medicine use. Research has often been of low to moderate quality, focused more on changes to prescribing patterns and less on clinical outcomes, been of short duration, and produced mixed results [33]. In a 2013 systematic review of 36 studies involving different interventions involving frail older patients in various settings, 22 of 26 quantitative studies reported statistically significant reductions in the proportions of medicines deemed unnecessary (defined using various criteria), ranging from 3 to 20 percentage points [34]. A more recent review of 20 trials of pharmacist-led reviews in both inpatient and outpatient settings reported a small reduction in the mean number of prescribed medicines (–0.48, 95% confidence interval [CI] –0.89 to –0.07) but no effects on mortality or readmissions, although unplanned hospitalizations were reduced in patients with heart failure [35]. A 2012 review of 10 controlled and 20 randomized studies revealed statistically significant reductions in the number of medicines in most of the controlled studies, although mixed results in the randomized studies [36]. Another 2012 review of 10 studies of different designs concluded that interventions were beneficial in reducing potentially inappropriate prescribing and medicine-related problems [37]. A 2013 review of 15 studies of academic detailing of family physicians showed a modest decline in the number of medications of certain classes such as benzodiazepines and nonsteroidal anti-inflammatory drugs [38]. Another 2013 review restricted to 8 randomized trials of various interventions involving nursing home patients suggested medicine-related problems were more frequently identified and resolved, together with improvement in medicine appropriateness [39]. In 2 randomized trials conducted in aged care facilities and centered on educational interventions, one aimed at prescribers [40] and the other at nursing staff [41],the number of potentially harmful medicines and days in hospital was significantly reduced [40,41], combined with slower declines in health-related quality of life [40]. In a randomized trial, patient education provided through community pharmacists led to a 77% reduction in benzodiazepine use among chronic users at 6 months with no withdrawal seizures or other ill effects [42].
Direct Deprescribing Targeting Specific Classes of Medicines
The evidence base for direct patient-level deprescribing is more rigorous as it pertains to specific classes of medicines. A 2008 systematic review of 31 trials (15 randomized, 16 observational) that withdrew a single class of medicine in older people demonstrated that, with appropriate patient selection and education coupled with careful withdrawal and close monitoring, antihypertensive agents, psychotropic medicines, and benzodiazepines could be discontinued without harm in 20% to 100% of patients, although psychotropics showed a high post-trial rate of recommencement [43]. Another review of 9 randomized trials demonstrated the safety of withdrawing antipsychotic agents that had been used continuously for behavioural and psychological symptoms in more than 80% of subjects with dementia [44]. In an observational study, cessation of inappropriate antihypertensives was associated with fewer cardiovascular events and deaths over a 5-year follow-up period [45]. A recent randomized trial of statin withdrawal in patients with advanced illness and of whom half had a prognosis of less than 12 months demonstrated improved quality of life and no increased risk of cardiovascular events over the following 60 days [46].
Direct Deprescribing Targeting All Medicines
The evidence base for direct patient-level deprescribing that assesses all medicines, not just specific medicine classes, features several high-quality observational studies and controlled trials, and subgroup findings from a recent comprehensive systematic review. In this review of 132 studies, which included 56 randomized controlled trials [47], mortality was shown in randomized trials to be decreased by 38% as a result of direct (ie, patient-level) deprescribing interventions. However, this effect was not seen in studies of indirect deprescribing comprising mainly generic educational interventions. While space prevents a detailed analysis of all relevant trials, some of the more commonly cited sentinel studies are mentioned here.
In a controlled trial involving 190 patients in aged care facilities, a structured approach to deprescribing (Good Palliative–Geriatric Practice algorithm) resulted in 63% of patients having, on average, 2.8 medicines per patient discontinued, and was associated with a halving in both annual mortality and referrals to acute care hospitals [48]. In another prospective uncontrolled study, the same approach applied to a cohort of 70 community-dwelling older patients resulted in an average of 4.4 medicines prescribed to 64 patients being recommended for discontinuation, of which 81% were successfully discontinued, with 88% of patients reporting global improvements in health [49]. In a prospective cohort study of 50 older hospitalized patients receiving a median of 10 regular medicines on admission, a formal deprescribing process led to the cessation of just over 1 in 3 medicines by discharge, representing 4 fewer medicines per patient [50]. During a median follow-up period of just over 2.5 months for 39 patients, less than 5% of ceased medicines were recommenced in 3 patients for relapsing symptoms, with no deaths or acute presentations to hospital attributable to cessation of medicines. A multidisciplinary hospital clinic for older patients over a 3-month period achieved cessation of 22% of medicines in 17 patients without ill effect [51].
Two randomized studies used the Screening Tool of Older People’s Prescriptions (STOPP) to reduce the use of PIMs in older hospital inpatients [52,53]. One reported significantly reduced PIMs use in the intervention group at discharge and 6 months post-discharge, no change in the rate of hospital readmission, and non-significant reductions in falls, all cause-mortality, and primary care visits during the 6-month follow-up period [52]. The second study reported reduced PIMs use in the intervention group of frail older patients on discharge, although the proportion of people prescribed at least 1 PIM was not altered [53].
Recently, a randomized trial of a deprescribing intervention applied to aged care residents resulted in successful discontinuation of 207 (59%) of 348 medicines targeted for deprescribing, and a mean reduction of 2 medicines per patient at 12 months compared to none in controls, with no differences in mortality or hospital admissions [54]. The evidence for direct deprescribing is limited by relatively few high-quality randomized trials, small patient samples, short duration of follow-up, selection of specific subsets of patients, and the absence of comprehensive re-prescribing data and clinical outcomes.
Methods Used for Direct Deprescribing
At the level of individual patient care, various instruments have been developed to assist the deprescribing process. Screening tools or criteria such as the Beers criteria and STOPP tool help identify medicines more likely than not to be inappropriate for a given set of circumstances and are widely used by research pharmacists. Deprescribing guidelines directed at particular medications (or drug classes) [55], or specific patient populations [56], can identify clinical scenarios where a particular drug is likely to be inappropriate, and how to safely wean or discontinue it.
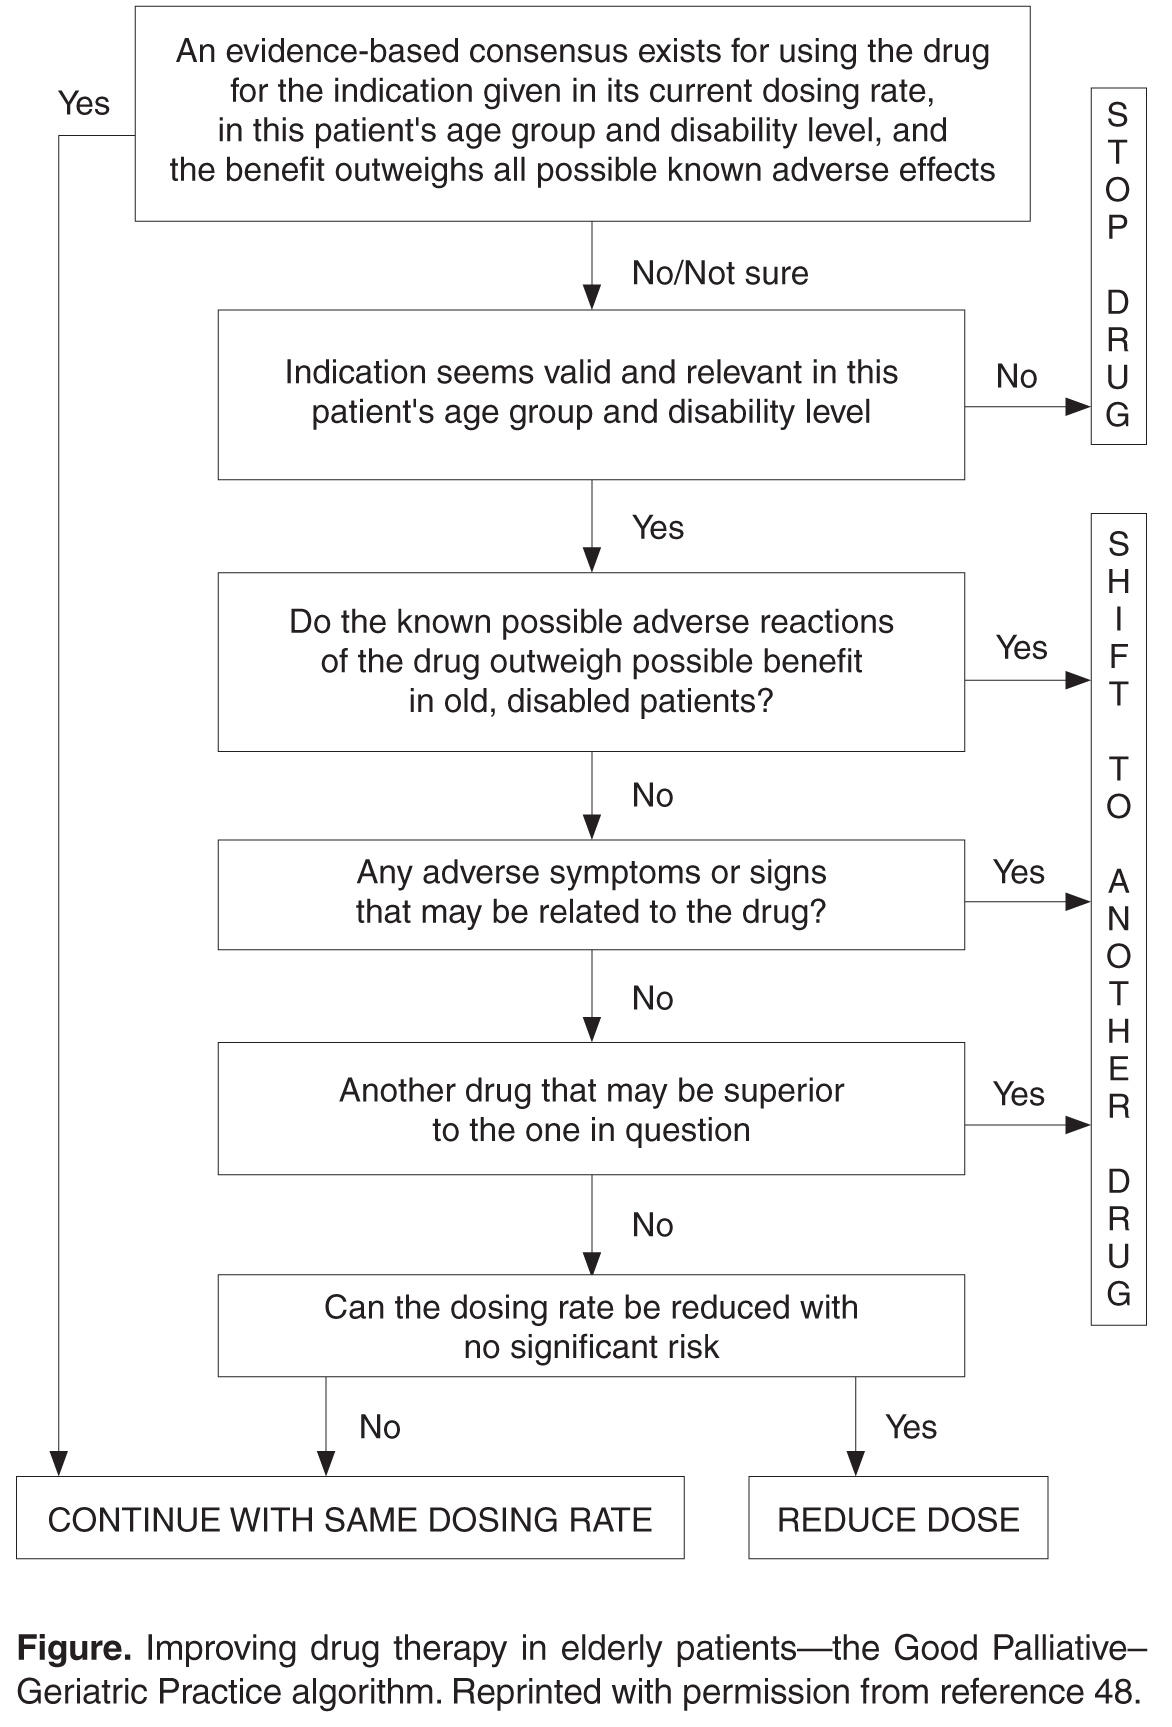
In applying a more nuanced, patient-centered approach to deprescribing, structured guides comprising algorithms, flowcharts, or tables describe sequential steps in deciding which medications used by an individual patient should be targeted for discontinuation after due attention to all relevant factors. Such guides prompt a more systematic appraisal of all medications being used. In a recent review of 7 structured guides that had undergone some form of efficacy testing [59], the strongest evidence of efficacy and clinician acceptability was seen for the Good Palliative–Geriatric Practice algorithm [48] (Figure) and the CEASE protocol [29,30,50,60] (Table). Both have been subject to a process of development and refinement over months to years involving multiple clinician prescribers and pharmacists. 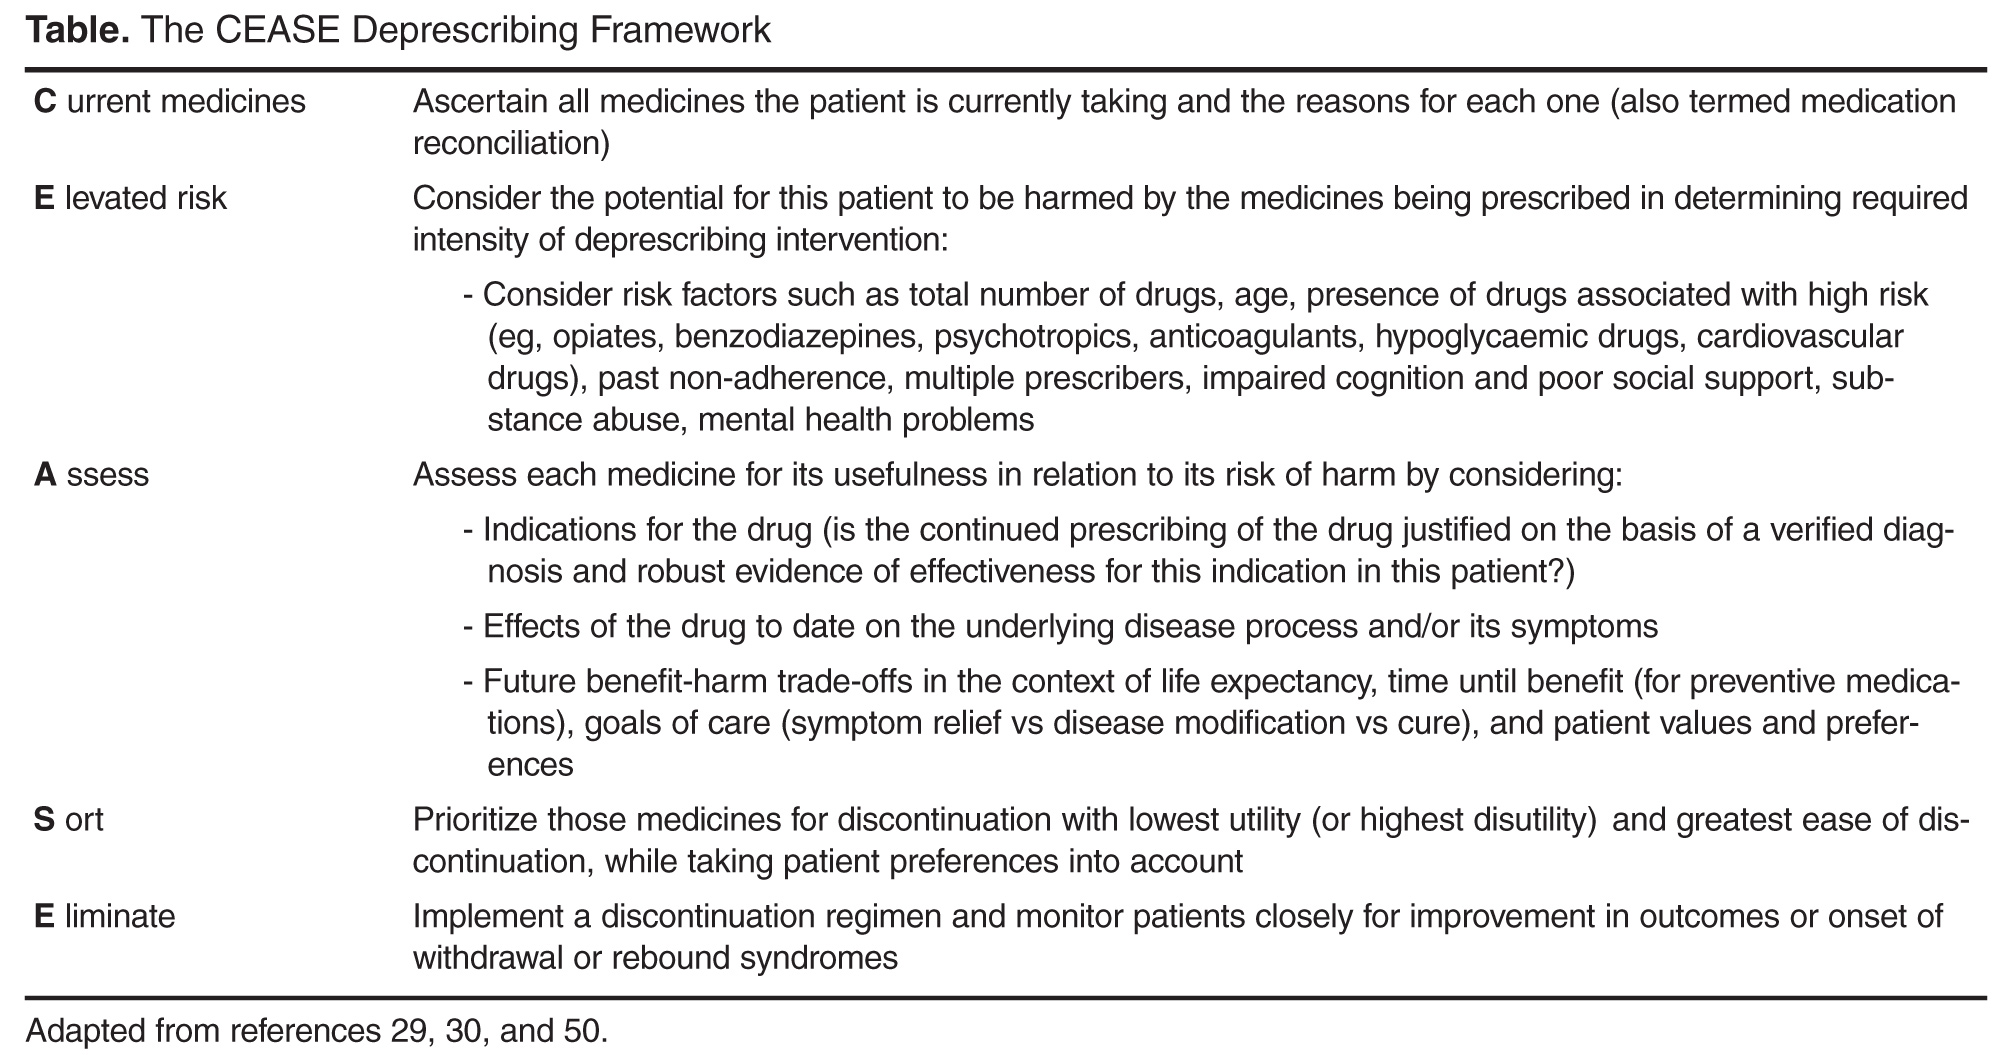
Clinical Circumstances Conducive to Deprescribing
Deprescribing should be especially considered in any older patient presenting with a new symptom or clinical syndrome suggestive of adverse medicine effects. The advent of advanced or end-stage disease, terminal illness, dementia, extreme frailty, or full dependence on others for all cares marks a stage of a person’s life when limited life expectancy and changed goals of care call for a re-appraisal of the benefits of current medicines. Lack of response in controlling symptoms despite optimal adherence and dosing or conversely the absence of symptoms for long periods of time should challenge the need for ongoing regular use of medicines. Similarly, the lack of verification, or indeed repudiation, of past diagnostic labels which gave rise to indications for medicines in the first place should prompt consideration of discontinuation. Patients receiving single medicines or combinations of medicines, both of which are high risk, should attract attention [63], as should use of preventive medicines for scenarios associated with no increased disease risk despite medicine cessation (eg, ceasing alendronate after 5 years of treatment results in no increase in osteoporotic fracture risk over the ensuing 5 years [64]; ceasing statins for primary prevention after a prolonged period results in no increase in cardiovascular events 8 years after discontinuation [65]). Evidence that has emerged that strongly contradicts previously held beliefs as to the indications for certain medicines (eg, aspirin as primary prevention of cardiovascular disease) should lead to a higher frequency of their discontinuation. Finally, medicines which impose demands on patients which they deem intolerable in terms of dietary and lifestyle restrictions, adverse side effects, medicine monitoring (such as warfarin), financial cost, or any other reason likely to result in nonadherence, should be considered candidates for deprescribing [25].
Barriers to Deprescribing
The most effective strategy to reducing potentially inappropriate polypharmacy is for doctors to prescribe and patients to consume fewer medicines. Unfortunately, both doctors and patients often lack confidence about when and how to cease medicines [66–69]. In a recent systematic review comprised mostly of studies involving general practitioners in primary care [66], 4 themes emerged. First, prescribers may be unaware of their own instances of inappropriate prescribing in older people until this is pointed out to them. Poor insight may be attributable in part to insufficient education in geriatric pharmacology. Second, clinical inertia manifesting as failure to act despite an awareness of PIMs may arise from deprescribing being viewed as a risky affair [70], with doctors fearful of provoking withdrawal syndromes or disease complications, and damaging their reputation and relationships with patients or colleagues in the process. Continuing inappropriate medicines is reinforced by prescriber beliefs that to do so is a safer or kinder course of action for the patient. Third, self-perceptions of being ill-equipped, in terms of the necessary knowledge and skills, to deprescribe appropriately (lack of self-efficacy) may be a barrier, even if one accepts the need for deprescribing. Information deficits around benefit-harm trade-offs of particular drugs and alternative treatments (both drug and non-drug), especially for older, frail, multi-morbid patients, contribute to the problem. Confidence to deprescribe is further undermined by the lack of clear documentation regarding reasons drugs were originally prescribed by other doctors, outcomes of past trials of discontinuation, and current patient care goals. Fourth, several external or logistical constraints may hamper deprescribing efforts such as perceived patient unwillingness to deprescribe certain medicines, lack of prescriber time, poor remuneration, and community and professional attitudes toward more rather than less use of medicines.
Deprescribing in hospital settings led by specialists appears to be no better than in general practice, although it has been less well studied. While an episode of acute inpatient care may afford an opportunity to review and reduce medicine lists, studies suggest the opposite occurs. In a New Zealand audit of 424 patients of mean age 80 years admitted acutely to a medical unit, chronically administered medications increased during hospital stay from a mean of 6.6 to 7.7 [71]. Similarly, in an Australian study investigating medication changes for 1220 patients of mean age 81 years admitted to general medical units of 11 acute care hospitals, the mean number of regularly administered medications rose from 7.1 on admission to 7.6 at discharge [72]. It is likely the same drivers behind failure to deprescribe in primary care also operate in secondary and tertiary care settings. Part of the problem is under-recognition of medicine-related geriatric syndromes on the part of hospital physicians and pharmacists [73].
Patients in both the community and residential aged care facilities frequently express a desire to have their medicines reduced in number, especially if advised by their treating clinician [74,75]. Having said this, many remain wary of discontinuing specific medicines [67], sharing the same fears of evoking withdrawal syndromes or disease relapse as do prescribers, and recounting the strong advice of past specialists to never withhold any medicines without first seeking their advice.
A challenge for all involved in deprescribing is gaining agreement on what are the most important factors that determine when, how, and in whom deprescribing should be conducted. Recent qualitative studies suggest that doctors, pharmacists, nursing staff, and patients and their families, while in broad agreement that deprescribing is worthwhile, often differ in their perspectives on what takes priority in selecting medicines for deprescribing in individual patients, and how it should be done and by whom [76,77].
Strategies That May Facilitate Deprescribing
While deprescribing presents some challenges, there are several strategies that can facilitate it at both the level of individual clinical encounters and at the level of whole populations and systems of care.
Individual Clinical Encounters
Within individual clinician–patient encounters, patients should be empowered to ask their doctors and pharmacists the following questions:
- What are my treatment options (including non-medicine options) for my condition?
- What are the possible benefits and harms of each medicine?
- What might be reasonable grounds for stopping a medicine?
In turn, doctors and pharmacists should ask in a nonjudgmental fashion, at every encounter, whether patients are experiencing any side effects, administration and monitoring problems, or other barriers to adherence associated with any of their medicines.
The issue of deprescribing should be framed as an attempt to alleviate symptoms (of drug toxicity), improve quality of life (from drug-induced disability), and lessen the risk of morbid events (especially ADEs) in the future. Compelling evidence that identifies circumstances in which medicines can be safely withdrawn while reducing the risk of ADEs needs to be emphasized. Specialists must play a sentinel leadership role in advising and authorizing other health professionals to deprescribe in situations where benefits of medications they have prescribed are no longer outweighed by the harms [60,78].
In language they can understand, patients should be informed of the benefit–harm trade-offs specific to them of continuing or discontinuing a particular medicine, as far as these can be specified. Patients often overestimate the benefits and underestimate the harms of treatments [79]. Providing such personalised information can substantially alter perceptions of risk and change attitudes towards discontinuation [80]. Eliciting patients’ beliefs about the necessity for each individual medicine and spending time, using an empathic manner, to dispel or qualify those at odds with evidence and clinical judgement renders deprescribing more acceptable to patients.
In estimating treatment benefit–harm trade-offs in individual patients, disease risk prediction tools (http://www.medal.org/), evidence tables [81,82], and decision aids are increasingly available. Prognostication tools (http://eprognosis.ucsf.edu) combined with trial-based time-to-event data can be used to determine if medicine-specific time until benefit exceeds remaining life span.
Deprescribing is best performed by reducing medicines one at a time over several encounters with the same overseeing generalist clinician with whom patients have established a trusting and collaborative relationship. This provides repeated opportunities to discuss and assuage any fears of discontinuing a medicine, and to adjust the deprescribing plan according to changes in clinical circumstances and revised treatment goals. Practice-based pharmacists can review patients’ medicine lists and apply screening criteria to identify medicines more likely to be unnecessary or harmful, which then helps initiate and guide deprescribing. Integrating a structured deprescribing protocol—and reminders to use it—into electronic health records, and providing decision support and data collection for future reference, reduce the cognitive burden on prescribers [83]. Practical guidance in how to safely wean and cease particular classes of medicines in older people can be accessed from various sources [84,85]. Seeking input from clinical pharmacologists, pharmacists, nurses, and other salient care providers on a case-by-case basis in the form of interactive case conferences provides support, seeks consensus, and shares the risk and responsibility for deprescribing recommendations [86].
System of Care
The success of deprescribing efforts in realizing better population health will be compromised unless all key stakeholders involved in quality use of medicines commit to operationalizing deprescribing strategies at the system of care level. Position statements on deprescribing in multi-morbid populations should be formulated and promulgated by all professional societies of prescribers (primary care, specialists, pharmacists, dentists, nurse practitioners). Professional development programs as well as undergraduate, graduate, and postgraduate courses in medicine, pharmacy, and nursing should include training in deprescribing as a core curricular element.
Researchers seeking funding and/or ethics approval for research projects involving medicines should be required to collect, analyze, and report data on the frequency of, and reasons for, withdrawal of drugs in trial subjects. This helps build the evidence base of medicine-related harm. In turn, government funders of research should require more researchers to design and conduct clinical trials that recruit multi-morbid patients, including specific subgroups (eg, patients with dementia), and aim to define medicine benefits and harms using patient risk stratification methods. Pharmaceutical companies should sponsor research on how to deprescribe their medicines within trials that also aim to assess efficacy and safety. Medicine regulatory authorities such as the Food and Drug Administration should mandate that this information be supplied at the time the company submits their application to have the medicine approved and listed for public subsidy. Trialists should adopt the word “deprescribing” in abstract titles for research on prescriber-initiated medicine discontinuation so that relevant articles can be more accurately indexed in, and retrieved from, bibliographic databases using recently formulated medical subject headings in Medline (“depresciptions”).
Editors of medical journals should promote a deprescribing agenda as a quality and safety issue for patient care, with the “Less is More” series in JAMA Internal Medicine and “Too much medicine” series in BMJ being good examples. Clinical guideline developers should formulate treatment recommendations specific to the needs of multi-morbid patients which acknowledge the limited evidence base for many medicines in such populations. These should take account of commonly encountered clinical scenarios where disease-specific medicines may engender greater risk of harm, and provide cautionary notes regarding initiation and discontinuation of medicines associated with high-risk.
Pharmacists need to instruct patients in how to identify medicine-induced harm and side effects, and how to collaborate with their prescribing clinicians in safely discontinuing high-risk medicines. Ideally, patients being admitted to residential aged care facilities should have their medicine lists reviewed by a pharmacist in flagging medicines eligible for deprescribing. Organizations and services responsible for providing quality use of medicines information (medicines handbooks, prescribing guidelines, drug safety bulletins) should describe when and how deprescribing should be performed in regards to specific medicines. This information should be cross-referenced to clinical guidelines and position statements dealing with the same medicine. Vendors of medicine prescribing software should be encouraged to incorporate flags and alerts which prompt prescribers to consider medicine cessation in high-risk patients.
Government and statutory bodies with responsibility for health care (health departments, quality and safety commissions, practice accreditation services, health care standard–setting bodies) should fund more research to develop and evaluate medicine safety standards aimed at reducing inappropriate use of medicines. Accreditation procedures for hospitals and primary care organizations should mandate the adoption of professional development and quality measurement systems that support and monitor patients receiving multiple medicines. Organizations responsible for conducting pharmacovigilance studies should issue medicine-specific deprescribing alerts whenever their data suggest higher than expected incidence of medicine-related adverse events in older populations receiving such medicines.
Conclusion
Inappropriate medicine use and polypharmacy is a growing issue among older and multi-morbid patients. The cumulative evidence of the safety and benefits of deprescribing argues for its adoption on the part of all prescribers, as well as its support by pharmacists and others responsible for optimizing use of medicines. Widespread implementation within routine care of an evidence-based approach to deprescribing in all patients receiving polypharmacy has its challenges, but also considerable potential to relieve unnecessary suffering and disability. More high quality research is needed in defining the circumstances under which deprescribing confers maximal benefit in terms of improved clinical outcomes.
Corresponding author: Ian A. Scott, Dept. of Internal Medicine and Clinical Epidemiology, Princess Alexandra Hospital, Brisbane, Australia 4102, [email protected].
Financial disclosures: None.
1. Qato DM, Alexander GC, Conti RM, et . Use of prescription and over-the-counter medications and dietary supplements among older adults in the United States. JAMA 2008;300:2867–78.
2. Kantor ED, Rehm CD, Haas JS, et al. Trends in prescription drug use among adults in the United States from 1999-2012. JAMA 2015;314:1818–31.
3. Wise J. Polypharmacy: a necessary evil. BMJ 2013;347: f7033.
4. Gnjidic D, Hilmer SN, Blyth FM, et al. Polypharmacy cutoff and outcomes: five or more medicines were used to identify community-dwelling older men at risk of different adverse outcomes. J Clin Epidemiol 2012;65:989–95.
5. Atkin PA, Veitch PC, Veitch EM, Ogle SJ. The epidemiology of serious adverse drug reactions among the elderly. Medicines Aging 1999;14:141–52.
6. Roughead EE, Anderson B, Gilbert AL. Potentially inappropriate prescribing among Australian veterans and war widows/widowers. Intern Med J 2007;37:402–5.
7. Stafford AC, Alswayan MS, Tenni PC. Inappropriate prescribing in older residents of Australian care homes. Clin Pharmacol Therapeut 2011;36:33–44.
8. Tjia J, Briesacher BA, Peterson D, et al. Use of medications of questionable benefit in advanced dementia. JAMA Intern Med 2014;174:1763–71.
9. Tjia J, Velten SJ, Parsons C, et al. Studies to reduce unnecessary medication use in frail older adults: A systematic review. Drugs Aging 2013;30:285–307.
10. Anathhanam AS, Powis RA, Cracknell AL, Robson J. Impact of prescribed medicines on patient safety in older people. Ther Adv Drug Saf 2012;3:165–74.
11. Opondo D, Eslami S, Visscher S, et al. Inappropriateness of medication prescriptions to elderly patients in the primary care setting: a systematic review. PLoS One 2012;7(8):e43617.
12. Kalisch LM, Caughey GE, Barratt JD, et al. Prevalence of preventable medication-related hospitalizations in Australia: an opportunity to reduce harm. Int J Qual Health Care 2012;24:239–49.
13. Bero LA, Lipton HL, Bird JA. Characterisation of geriatric drug-related hospital readmissions. Med Care 1991;29:989–1003.
14. Jyrkkä J, Enlund H, Korhonen MJ, et al. Polypharmacy status as an indicator of mortality in an elderly population. Drugs Aging 2009;26:1039–48.
15. Steinman MA, Miao Y, Boscardin WJ, et al. Prescribing quality in older veterans: a multifocal approach. J Gen Intern Med 2014;29:1379–86.
16. Goldberg R, Mabee J, Chan L, Wong S. Drug-drug and drug-disease interactions in the ED: analysis of a high-risk population. Am J Emerg Med 1996;14:447–50.
17. Elliott RA, Booth JC. Problems with medicine use in older Australians: a review of recent literature. J Pharm Pract Res 2014;44:258–71.
18. Barat I, Andreasen F, Damsgaard EM. Drug therapy in the elderly: what doctors believe and patients actually do. Br J Clin Pharmacol 2001;51:615–22.
19. Chapman RH, Benner JS, Petrilla AA, et al. Predictors of adherence with antihypertensive and lipid-lowering therapy. Arch Intern Med 2005;165:1147–52.
20. Gnjidic D, Hilmer SN. Emergency hospitalizations for adverse drug events. N Engl J Med 2012;366:859.
21. Gnjidic D, Hilmer SN, Blyth FM, Naganathan V, Waite L, et al. Polypharmacy cutoff and outcomes: five or more medicines were used to identify community-dwelling older men at risk of different adverse outcomes. J Clin Epidemiol 2012;65:989–95.
22. Cherubini A, Oristrell J, Pla X, et al. The persistent exclusion of older patients from ongoing clinical trials regarding heart failure. Arch Intern Med 2011;171:550–6.
23. Bugeja G, Kumar A, Banerjee AK. Exclusion of elderly people from clinical research: a descriptive study of published reports. BMJ 1997;315:1059.
24. Mangin D, Heath I, Jamoulle M. Beyond diagnosis: rising to the multimorbidity challenge. BMJ 2012;344:e3526.
25. Boyd CM, Darer J, Boult C, et al. Clinical practice guidelines and quality of care for older patients with multiple comorbid diseases: implications for pay for performance. JAMA 2005;294:716–24.
26. McLean AJ, Le Couteur DG. Aging biology and geriatric clinical pharmacology. Pharmacol Rev 2004;56:163–84.
27. Hilmer SN, Mager DE, Simonsick EM, et al. Drug Burden Index score and functional decline in older people. Am J Med 2009;122:1142–9.
28. Reeve E, Gnjidic D, Long J, Hilmer S. A systematic review of the emerging definition of ‘deprescribing’ with network analysis: implications for future research and clinical practice. Br J Clin Pharmacol 2015;80:1254–68.
29. Scott IA, Hilmer SN, Reeve E, et al. Reducing inappropriate polypharmacy – the process of deprescribing. JAMA Intern Med 2015;175:827–34.
30. Scott IA, Gray LA, Martin JH, et al. Deciding when to stop: towards evidence-based deprescribing of drugs in older populations. Evidence-based Med 2013;18:121–4.
31. Reeve E, Shakib S, Hendrix I, et al. Review of deprescribing processes and development of an evidence-based, patient-centred deprescribing process. Br J Clin Pharmacol 2014;78:738–47.
32. Alldred D. Deprescribing: a brave new word? Int J Pharm Pract. 2014;22:2–3.
33. Kaur S, Mitchell G, Vitetta L, Roberts MS. Interventions that can reduce inappropriate prescribing in the elderly: a systematic review. Drugs Aging 2009;26:1013–28.
34. Tjia J, Velten SJ, Parsons C, et al. Studies to reduce unnecessary medication use in frail older adults: A systematic review. Drugs Aging 2013;30:285–307.
35. Thomas R, Huntley AL, Mann M, et al. Pharmacist-led interventions to reduce unplanned admissions for older people: a systematic review and meta-analysis of randomised controlled trials. Age Ageing 2014;43:174–87.
36. Gnjidic D, Le Couteur DG, Kouladjian L, Hilmer SN. Deprescribing trials: Methods to reduce polypharmacy and the impact on prescribing and clinical outcomes. Clin Geriatr Med 2012;28:237–53.
37. Patterson SM, Hughes C, Kerse N, et al. Interventions to improve use of polypharmacy for older people. Cochrane Database Syst Rev 2012;5:CD008165.
38. Chhina HK, Bhole VM, Goldsmith C, et al. Effectiveness of academic detailing to optimize medication prescribing behaviour of family physicians. J Pharm Pharm Sci 2013;16:511–29.
39. Alldred DP, Raynor DK, Hughes C, et al. Interventions to optimise prescribing for older people in care homes. Cochrane Database Syst Rev 2013;CD009095.
40. García-Gollarte F, Baleriola-Júlvez J, Ferrero-López I, et al. An educational intervention on drug use in nursing homes improves health outcomes and resource utilization and reduces inappropriate drug prescription. J Am Dir Assoc 2014;15:885–91.
41. Pitkälä KH, Juola A-L, Kautiainen H, Soini H, et al. Education to reduce potentially harmful medication use among residents of assisted living facilities: A randomized controlled trial. J Am Dir Assoc 2014;15:892–8.
42. Tannenbaum C, Martin P, Tamblyn R, et al. Reduction of inappropriate benzodiazepine prescriptions among older adults through direct patient education. The EMPOWER cluster randomized trial. JAMA Intern Med 2014;174:890–8.
43. Iyer S, Naganathan V, McLachlan AJ, Le Couteur DG. Medication withdrawal trials in people aged 65 years and older: a systematic review. Drugs Aging 2008;25:1021–31.
44. Declercq T, Petrovic M, Azermai M, et al. Withdrawal versus continuation of chronic antipsychotic medicines for behavioural and psychological symptoms in older people with dementia. Cochrane Database Syst Rev 2013;3:CD007726.
45. Ekbom T, Lindholm LH, Odén A, et al. A 5-year prospective, observational study of the withdrawal of antihypertensive treatment in elderly people. J Intern Med 1994;235:581–588.
46. Kutner JS, Blatchford PJ, Taylor DH Jr, et al. Safety and benefit of discontinuing statin therapy in the setting of advanced, life-limiting illness: a randomized clinical trial. JAMA Intern Med 2015;175:691–700.
47. Page AT, Clifford RM, Potter K, Schwartz D, Etherton-Beer CD. The feasibility and effect of deprescribing in older adults on mortality and health: a systematic review and meta-analysis. Br J Clin Pharmacol 2016 Apr 14. [Epub ahead of print]
48. Garfinkel D, Zur-Gil S, Ben-Israel J. The war against polypharmacy: a new cost-effective geriatric-palliative approach for improving drug therapy in disabled elderly people. Isr Med Assoc J 2007;9:430–4.
49. Garfinkel D, Mangin D. Feasibility study of a systematic approach for discontinuation of multiple medicines in older adults: addressing polypharmacy. Arch Intern Med 2010;170:1648–54.
50. McKean M, Pillans P, Scott IA. A medication review and deprescribing method for hospitalised older patients receiving multiple medications. Intern Med J 2016;46:35–42.
51. Mudge A, Radnedge K, Kasper K, et al. Effects of a pilot multidisciplinary clinic for frequent attending elderly patients on deprescribing. Aust Health Rev 2015; Jul 6. [Epub ahead of print]
52. Gallagher PF, O’Connor MN, O’Mahony D. Prevention of potentially inappropriate prescribing for elderly Patients: A randomized controlled trial using STOPP/START criteria. Clin Pharmacol Therap 2011;89:845–54.
53. Dalleur O, Boland B, Losseau C, et al. Reduction of potentially inappropriate medications using the STOPP criteria in frail older inpatients: a randomised controlled study. Drugs Aging 2014;31:291–8.
54. Potter K, Flicker L, Page A, Etherton-Beer C. Deprescribing in frail older people: A randomised controlled trial. PLoS One 2016;11(3):e0149984.
55. Conklin J, Farrell B, Ward N, et al. Developmental evaluation as a strategy to enhance the uptake and use of deprescribing guidelines: protocol for a multiple case study. Implement Sci 2015;10:91–101.
56. Lindsay J, Dooley M, Martin J, et al. The development and evaluation of an oncological palliative care deprescribing guideline: the ‘OncPal deprescribing guideline’ Support Care Cancer 2015;23:71–8.
57. Miller GC, Valenti L, Britt H, Bayram C. Drugs causing adverse events in patients aged 45 or older: a randomised survey of Australian general practice patients. BMJ Open 2013;3:e003701.
58. Budnitz DS, Lovegrove MC, Shebab N, Richards CL. Emergency hospitalisations for adverse drug events in older Americans. N Engl J Med 2011;365:2002–12.
59. Scott IA, Andersen K, Freeman C. Review of structured guides for deprescribing. Eur J Hosp Pharm 2016. In press.
60. Scott IA, Le Couteur D. Physicians need to take the lead in deprescribing. Intern Med J 2015;45:352–6.
61. Poudel A, Ballokova A, Hubbard RE, et al. An algorithm of medication review in residential aged care facilities: focus on minimizing use of high risk medications. Geriatr Gerontol Int Sep 3. [Epub ahead of print]
62. Scott IA, Martin JH, Gray LA, Mitchell CA. Effects of a drug minimisation guide on prescribing intentions in elderly persons with polypharmacy. Drugs Ageing 2012;29:659–67.
63. Bennett A, Gnjidic D, Gillett M, et al. Prevalence and impact of fall-risk-increasing drugs, polypharmacy, and drug-drug interactions in robust versus frail hospitalised falls patients: a prospective cohort study. Drugs Aging 2014;31:225–32.
64. Black DM, Schwartz AV, Ensrud KE, et al. FLEX Research Group. Effects of continuing or stopping alendronate after 5 years of treatment: the Fracture Intervention Trial Long-term Extension (FLEX): a randomised trial. JAMA 2006;296:2927–38.
65. Sever PS, Chang CL, Gupta AK, et al. The Anglo-Scandinavian Cardiac Outcomes Trial: 11-year mortality follow-up of the lipid lowering arm in the UK. Eur Heart J 2011;32:2525–32.
66. Anderson K, Stowasser D, Freeman C, Scott I. Prescriber barriers and enablers to minimising potentially inappropriate medications in adults: a systematic review and thematic synthesis. BMJ Open 2014;4.
67. Reeve E, To J, Hendrix I, et al. Patient barriers to and enablers of deprescribing: a systematic review. Drugs Aging 2013;30:793–807.
68. Palagyi A, Keay L, Harper J, et al. Barricades and brickwalls—a qualitative study exploring perceptions of medication use and deprescribing in long-term care. BMC Geriatr 2016;16:15.
69. Garfinkel D, Ilhan B, Bahat G. Routine deprescribing of chronic medications to combat polypharmacy. Ther Adv Drug Saf 2015;6:212–33.
70. Reeve E, Shakib S, Hendrix I, et al. The benefits and harms of deprescribing. Med J Aust 2014;201:386–9.
71. Betteridge TM, Frampton CM, Jardine DL. Polypharmacy – we make it worse! A cross-sectional study from an acute admissions unit. Intern Med J 2012;42:208–11.
72. Hubbard RE, Peel NM, Scott IA, et al. Polypharmacy among inpatients aged 70 years or older in Australia. Med J Aust 2015;202:373–7.
73. Klopotowska JE, Wierenga PC, Smorenburg SM, et al. Recognition of adverse drug events in older hospitalized medical patients. Eur J Clin Pharmacol 2013;69:75–85.
74. Reeve E, Wiese MD, Hendrix I, et al. People’s attitudes, beliefs, and experiences regarding polypharmacy and willingness to deprescribe. J Am Geriatr Soc 2013;61:1508–14.
75. Kalogianis MJ, Wimmer BC, Turner JP, et al. Are residents of aged care facilities willing to have their medications deprescribed? Res Social Adm Pharm 2015. Published online 18 Dec 2015.
76. Turner JP, Edwards S, Stanners M, et al. What factors are important for deprescribing in Australian long-term care facilities? Perspectives of residents and health professionals. BMJ Open 2016;6:e009781.
77. Page AT, Etherton-Beer CD, Clifford RM, et al. Deprescribing in frail older people - Do doctors and pharmacists agree? Res Social Adm Pharm 2015;12:438–49.
78. Luymes CH, van der Kleij RM, Poortvliet RK, et al. Deprescribing potentially inappropriate preventive cardiovascular medication: Barriers and enablers for patients and general practitioners. Ann Pharmacother 2016 Mar 3. [Epub ahead of print]
79. Hoffmann TC, Del Mar C. Patients’ expectations of the benefits and harms of treatments, screening, and tests: a systematic review. JAMA Intern Med 2015;175:274–86.
80. Martin P, Tamblyn R, Ahmed S, Tannenbaum C. A drug education tool developed for older adults changes knowledge, beliefs and risk perceptions about inappropriate benzodiazepine prescriptions in the elderly. Patient Educ Couns 2013;92:81–7.
81. Hamilton H, Gallagher P, Ryan C, et al. Potentially inappropriate medicines defined by STOPP criteria and the risk of adverse drug events in older hospitalized patients. Arch Intern Med 2011;171:1013–7.
82. NHS Highland. Polypharmacy: guidance for prescribing in frail adults. Accessed at: www.nhshighland.scot.nhs.uk/publications/documents/guidelines/polypharmacy guidance for prescribing in frail adults.pdf.
83. Anderson K, Foster MM, Freeman CR, Scott IA. A multifaceted intervention to reduce inappropriate polypharmacy in primary care: research co-creation opportunities in a pilot study. Med J Aust 2016;204:S41–4.
84. A practical guide to stopping medicines in older people. Accessed at: www.bpac.org.nz/magazine/2010/april/stopGuide.asp.
85. www.cpsedu.com.au/posts/view/46/Deprescribing-Documents-now-Available-for-Download.
86. Bregnhøj L, Thirstrup S, Kristensen MB, et al. Combined intervention programme reduces inappropriate prescribing in elderly patients exposed to polypharmacy in primary care. Eur J Clin Pharmacol 2009;65:199–207.
From the Department of Internal Medicine and Clinical Epidemiology, Princess Alexandra Hospital, Ipswich Road, Woolloongabba, Queensland, Australia (Dr. Scott), School of Medicine, The University of Queensland, Herston Road, Brisbane, Australia (Dr. Scott), Centre of Research Excellence in Quality & Safety in Integrated Primary-Secondary Care, The University of Queensland, Herston Road, Brisbane, Australia (Ms. Anderson), and Charming Institute, Camp Hill, Brisbane, Queensland, Australia (Dr. Freeman).
Abstract
- Objective: To review the adverse drug events (ADEs) risk of polypharmacy; the process of deprescribing and evidence of efficacy in reducing inappropriate polypharmacy; the enablers and barriers to deprescribing; and patient and system of care level strategies that can be employed to enhance deprescribing.
- Methods: Literature review.
- Results: Inappropriate polypharmacy, especially in older people, imposes a significant burden of ADEs, ill health, disability, hospitalization and even death. The single most important predictor of inappropriate prescribing and risk of ADEs in older patients is the number of prescribed medicines. Deprescribing is the process of systematically reviewing, identifying, and discontinuing potentially inappropriate medicines (PIMs), aimed at minimizing polypharmacy and improving patient outcomes. Evidence of efficacy for deprescribing is emerging from randomized trials and observational studies, and deprescribing protocols have been developed and validated for clinical use. Barriers and enablers to deprescribing by individual prescribers center on 4 themes: (1) raising awareness of the prevalence and characteristics of PIMs; (2) overcoming clinical inertia whereby discontinuing medicines is seen as being a low value proposition compared to maintaining the status quo; (3) increasing skills and competence (self-efficacy) in deprescribing; and (4) countering external and logistical factors that impede the process.
- Conclusion: In optimizing the scale and effects of deprescribing in clinical practice, strategies that promote depresribing will need to be applied at both the level of individual patient–prescriber encounters and systems of care.
In developed countries in the modern era, about 30% of patients aged 65 years or older are prescribed 5 or more medicines [1]. Over the past decade, the prevalence of polypharmacy (use of > 5 prescription drugs) in the adult population of the United States has doubled from 8.2% in 1999–2000 to 15% in 2011–2012 [2]. While many patients may benefit from such polypharmacy [3] (defined here as 5 or more regularly prescribed medicines), it comes with increased risk of adverse drug events (ADEs) in older people [4] due to physiological changes of aging that alter pharmacokinetic and pharmacodynamic responses to medicines [5]. Approximately 1 in 5 medicines commonly used in older people may be inappropriate [6], rising to a third among those living in residential aged care facilities [7]. Among nursing home residents with advanced dementia, more than half receive at least 1 medicine with questionable benefit [8]. Approximately 50% of hospitalized nursing home or ambulatory care patients receive 1 or more unnecessary medicines [9]. Observational studies have documented ADEs in at least 15% of older patients, contributing to ill health [10], disability [11], hospitalization [12] and readmissions [13], increased length of stay, and, in some cases, death [14]. This high level of iatrogenic harm from potentially inappropriate medicines (PIMs) mandates a response from clinicians responsible for managing medicines.
In this narrative review, we aim to detail the ADE risk of polypharmacy, the process of deprescribing and evidence of its efficacy in reducing potentially inappropriate polypharmacy, the enablers and barriers to deprescribing, and patient and system of care level strategies that can be employed in enhancing deprescribing.
Polypharmacy As a Risk Factor for Medicine-Related Harm
The number of medicines a patient is taking is the single most important predictor of medicine-related harm [15]. One report estimated the risk of ADEs as a contributory cause of patients presenting acutely to hospital emergency departments to be 13% for 2 drugs, 38% for 4 drugs, and 82% for 7 drugs or more [16]. The more medicines an individual takes, the greater their risk of experiencing an adverse drug reaction, a drug-drug interaction, a drug-disease interaction, cascade prescribing (where more medicines are added to counteract side effects of existing medicines), nonadherence, and drug errors (wrong drug, wrong dose, missed doses, erroneous dosing frequency) [17–20]. Once the number of regular medicines rises above 5 (commonly regarded as the threshold for defining polypharmacy), observational data suggest that additional medicines independently increase the risk of frailty, falling, and hospital admission [21].
The benefits of many medicines in frail older people remain unquantified. As many as 50% of clinical trials have a specific upper age limit and approximately 80% of clinical trials exclude people with comorbidities [22,23]. Single-disease treatment guidelines based on such trials are often extrapolated to older people with multimorbidity despite an absence of evidence for benefit [24] and with little consideration of the potential burdens and harms of polypharmacy resulting from treating multiple diseases in the one patient [25]. By contrast, the risks from many medicines in older people are well known. Older people are at high risk of ADEs and toxicity due to reduced renal and liver function and age-related changes in physiological reserve, body composition, and cellular metabolism [26]. While the adverse effects of polypharmacy or of comorbidities targeted for treatment are difficult to separate, the burden of medicine-induced decline in function and quality of life is becoming better defined and appreciated [27].
Defining Evidence-Based Deprescribing
While many definitions have been proposed [28], we define evidence-based deprescribing as follows: the active process of systematically reviewing medicines being used by individual patients and, using best available evidence, identifying and discontinuing those associated with unfavorable risk–benefit trade-offs within the context of illness severity, advanced age, multi-morbidity, physical and emotional capacity, life expectancy, care goals, and personal preferences [29]. An enlarging body of research has demonstrated the feasibility, safety and patient benefit of deprescribing, as discussed further below. It employs evidence-based frameworks that assist the prescriber [30] and are patient-centered [31].
Importantly, deprescribing should be seen as part of the good prescribing continuum, which spans medicine initiation, titrating, changing, or adding medicines, and switching or ceasing medicines. Deprescribing is not about denying effective treatment to eligible patients. It is a positive, patient-centered intervention, with inherent uncertainties, and requires shared decision-making, informed patient consent and close monitoring of effects [32]. Deprescribing involves diagnosing a problem (use of a PIM), making a therapeutic decision (withdrawing it with close follow-up) and altering the natural history of the problem (reducing incidence of medicine-related adverse events).
Our definition of evidence-based deprescribing is a form of direct deprescribing applied at the level of the individual patient-prescriber/pharmacist encounter. Direct deprescribing uses explicit, systematic processes (such as using an algorithm or structured deprescribing framework or guide) applied by individual prescribers (or pharmacists) to the medicine regimens of individual patients (ie, at the patient level), and which targets either specific classes of medicines or all medicines that are potentially inappropriate. This is in contrast to indirect deprescribing, which uses more generic, programmatic strategies aimed at prescribers as a whole (ie, at the population or system level) and which seek to improve quality use of medicines in general, including both underuse and overuse of medicines. Indirect deprescribing entails a broader aim of medicines optimization in which deprescribing is a possible outcome but not necessarily the sole focus. Such strategies include pharmacist or physician medicine reviews, education programs for clinicians and/or patients, academic detailing, audit and feedback, geriatric assessment, multidisciplinary teams, prescribing restrictions, and government policies, all of which aim to reduce the overall burden of PIMs among broad groups of patients. While intuitively the 2 approaches in combination should exert synergistic effects superior to those of either by itself, this has not been studied.
Evidence For Deprescribing
Indirect Deprescribing
Overall, the research into indirect interventions has been highly heterogenous in terms of interventions and measures of medicine use. Research has often been of low to moderate quality, focused more on changes to prescribing patterns and less on clinical outcomes, been of short duration, and produced mixed results [33]. In a 2013 systematic review of 36 studies involving different interventions involving frail older patients in various settings, 22 of 26 quantitative studies reported statistically significant reductions in the proportions of medicines deemed unnecessary (defined using various criteria), ranging from 3 to 20 percentage points [34]. A more recent review of 20 trials of pharmacist-led reviews in both inpatient and outpatient settings reported a small reduction in the mean number of prescribed medicines (–0.48, 95% confidence interval [CI] –0.89 to –0.07) but no effects on mortality or readmissions, although unplanned hospitalizations were reduced in patients with heart failure [35]. A 2012 review of 10 controlled and 20 randomized studies revealed statistically significant reductions in the number of medicines in most of the controlled studies, although mixed results in the randomized studies [36]. Another 2012 review of 10 studies of different designs concluded that interventions were beneficial in reducing potentially inappropriate prescribing and medicine-related problems [37]. A 2013 review of 15 studies of academic detailing of family physicians showed a modest decline in the number of medications of certain classes such as benzodiazepines and nonsteroidal anti-inflammatory drugs [38]. Another 2013 review restricted to 8 randomized trials of various interventions involving nursing home patients suggested medicine-related problems were more frequently identified and resolved, together with improvement in medicine appropriateness [39]. In 2 randomized trials conducted in aged care facilities and centered on educational interventions, one aimed at prescribers [40] and the other at nursing staff [41],the number of potentially harmful medicines and days in hospital was significantly reduced [40,41], combined with slower declines in health-related quality of life [40]. In a randomized trial, patient education provided through community pharmacists led to a 77% reduction in benzodiazepine use among chronic users at 6 months with no withdrawal seizures or other ill effects [42].
Direct Deprescribing Targeting Specific Classes of Medicines
The evidence base for direct patient-level deprescribing is more rigorous as it pertains to specific classes of medicines. A 2008 systematic review of 31 trials (15 randomized, 16 observational) that withdrew a single class of medicine in older people demonstrated that, with appropriate patient selection and education coupled with careful withdrawal and close monitoring, antihypertensive agents, psychotropic medicines, and benzodiazepines could be discontinued without harm in 20% to 100% of patients, although psychotropics showed a high post-trial rate of recommencement [43]. Another review of 9 randomized trials demonstrated the safety of withdrawing antipsychotic agents that had been used continuously for behavioural and psychological symptoms in more than 80% of subjects with dementia [44]. In an observational study, cessation of inappropriate antihypertensives was associated with fewer cardiovascular events and deaths over a 5-year follow-up period [45]. A recent randomized trial of statin withdrawal in patients with advanced illness and of whom half had a prognosis of less than 12 months demonstrated improved quality of life and no increased risk of cardiovascular events over the following 60 days [46].
Direct Deprescribing Targeting All Medicines
The evidence base for direct patient-level deprescribing that assesses all medicines, not just specific medicine classes, features several high-quality observational studies and controlled trials, and subgroup findings from a recent comprehensive systematic review. In this review of 132 studies, which included 56 randomized controlled trials [47], mortality was shown in randomized trials to be decreased by 38% as a result of direct (ie, patient-level) deprescribing interventions. However, this effect was not seen in studies of indirect deprescribing comprising mainly generic educational interventions. While space prevents a detailed analysis of all relevant trials, some of the more commonly cited sentinel studies are mentioned here.
In a controlled trial involving 190 patients in aged care facilities, a structured approach to deprescribing (Good Palliative–Geriatric Practice algorithm) resulted in 63% of patients having, on average, 2.8 medicines per patient discontinued, and was associated with a halving in both annual mortality and referrals to acute care hospitals [48]. In another prospective uncontrolled study, the same approach applied to a cohort of 70 community-dwelling older patients resulted in an average of 4.4 medicines prescribed to 64 patients being recommended for discontinuation, of which 81% were successfully discontinued, with 88% of patients reporting global improvements in health [49]. In a prospective cohort study of 50 older hospitalized patients receiving a median of 10 regular medicines on admission, a formal deprescribing process led to the cessation of just over 1 in 3 medicines by discharge, representing 4 fewer medicines per patient [50]. During a median follow-up period of just over 2.5 months for 39 patients, less than 5% of ceased medicines were recommenced in 3 patients for relapsing symptoms, with no deaths or acute presentations to hospital attributable to cessation of medicines. A multidisciplinary hospital clinic for older patients over a 3-month period achieved cessation of 22% of medicines in 17 patients without ill effect [51].
Two randomized studies used the Screening Tool of Older People’s Prescriptions (STOPP) to reduce the use of PIMs in older hospital inpatients [52,53]. One reported significantly reduced PIMs use in the intervention group at discharge and 6 months post-discharge, no change in the rate of hospital readmission, and non-significant reductions in falls, all cause-mortality, and primary care visits during the 6-month follow-up period [52]. The second study reported reduced PIMs use in the intervention group of frail older patients on discharge, although the proportion of people prescribed at least 1 PIM was not altered [53].
Recently, a randomized trial of a deprescribing intervention applied to aged care residents resulted in successful discontinuation of 207 (59%) of 348 medicines targeted for deprescribing, and a mean reduction of 2 medicines per patient at 12 months compared to none in controls, with no differences in mortality or hospital admissions [54]. The evidence for direct deprescribing is limited by relatively few high-quality randomized trials, small patient samples, short duration of follow-up, selection of specific subsets of patients, and the absence of comprehensive re-prescribing data and clinical outcomes.
Methods Used for Direct Deprescribing
At the level of individual patient care, various instruments have been developed to assist the deprescribing process. Screening tools or criteria such as the Beers criteria and STOPP tool help identify medicines more likely than not to be inappropriate for a given set of circumstances and are widely used by research pharmacists. Deprescribing guidelines directed at particular medications (or drug classes) [55], or specific patient populations [56], can identify clinical scenarios where a particular drug is likely to be inappropriate, and how to safely wean or discontinue it.
In applying a more nuanced, patient-centered approach to deprescribing, structured guides comprising algorithms, flowcharts, or tables describe sequential steps in deciding which medications used by an individual patient should be targeted for discontinuation after due attention to all relevant factors. Such guides prompt a more systematic appraisal of all medications being used. In a recent review of 7 structured guides that had undergone some form of efficacy testing [59], the strongest evidence of efficacy and clinician acceptability was seen for the Good Palliative–Geriatric Practice algorithm [48] (Figure) and the CEASE protocol [29,30,50,60] (Table). Both have been subject to a process of development and refinement over months to years involving multiple clinician prescribers and pharmacists.
Clinical Circumstances Conducive to Deprescribing
Deprescribing should be especially considered in any older patient presenting with a new symptom or clinical syndrome suggestive of adverse medicine effects. The advent of advanced or end-stage disease, terminal illness, dementia, extreme frailty, or full dependence on others for all cares marks a stage of a person’s life when limited life expectancy and changed goals of care call for a re-appraisal of the benefits of current medicines. Lack of response in controlling symptoms despite optimal adherence and dosing or conversely the absence of symptoms for long periods of time should challenge the need for ongoing regular use of medicines. Similarly, the lack of verification, or indeed repudiation, of past diagnostic labels which gave rise to indications for medicines in the first place should prompt consideration of discontinuation. Patients receiving single medicines or combinations of medicines, both of which are high risk, should attract attention [63], as should use of preventive medicines for scenarios associated with no increased disease risk despite medicine cessation (eg, ceasing alendronate after 5 years of treatment results in no increase in osteoporotic fracture risk over the ensuing 5 years [64]; ceasing statins for primary prevention after a prolonged period results in no increase in cardiovascular events 8 years after discontinuation [65]). Evidence that has emerged that strongly contradicts previously held beliefs as to the indications for certain medicines (eg, aspirin as primary prevention of cardiovascular disease) should lead to a higher frequency of their discontinuation. Finally, medicines which impose demands on patients which they deem intolerable in terms of dietary and lifestyle restrictions, adverse side effects, medicine monitoring (such as warfarin), financial cost, or any other reason likely to result in nonadherence, should be considered candidates for deprescribing [25].
Barriers to Deprescribing
The most effective strategy to reducing potentially inappropriate polypharmacy is for doctors to prescribe and patients to consume fewer medicines. Unfortunately, both doctors and patients often lack confidence about when and how to cease medicines [66–69]. In a recent systematic review comprised mostly of studies involving general practitioners in primary care [66], 4 themes emerged. First, prescribers may be unaware of their own instances of inappropriate prescribing in older people until this is pointed out to them. Poor insight may be attributable in part to insufficient education in geriatric pharmacology. Second, clinical inertia manifesting as failure to act despite an awareness of PIMs may arise from deprescribing being viewed as a risky affair [70], with doctors fearful of provoking withdrawal syndromes or disease complications, and damaging their reputation and relationships with patients or colleagues in the process. Continuing inappropriate medicines is reinforced by prescriber beliefs that to do so is a safer or kinder course of action for the patient. Third, self-perceptions of being ill-equipped, in terms of the necessary knowledge and skills, to deprescribe appropriately (lack of self-efficacy) may be a barrier, even if one accepts the need for deprescribing. Information deficits around benefit-harm trade-offs of particular drugs and alternative treatments (both drug and non-drug), especially for older, frail, multi-morbid patients, contribute to the problem. Confidence to deprescribe is further undermined by the lack of clear documentation regarding reasons drugs were originally prescribed by other doctors, outcomes of past trials of discontinuation, and current patient care goals. Fourth, several external or logistical constraints may hamper deprescribing efforts such as perceived patient unwillingness to deprescribe certain medicines, lack of prescriber time, poor remuneration, and community and professional attitudes toward more rather than less use of medicines.
Deprescribing in hospital settings led by specialists appears to be no better than in general practice, although it has been less well studied. While an episode of acute inpatient care may afford an opportunity to review and reduce medicine lists, studies suggest the opposite occurs. In a New Zealand audit of 424 patients of mean age 80 years admitted acutely to a medical unit, chronically administered medications increased during hospital stay from a mean of 6.6 to 7.7 [71]. Similarly, in an Australian study investigating medication changes for 1220 patients of mean age 81 years admitted to general medical units of 11 acute care hospitals, the mean number of regularly administered medications rose from 7.1 on admission to 7.6 at discharge [72]. It is likely the same drivers behind failure to deprescribe in primary care also operate in secondary and tertiary care settings. Part of the problem is under-recognition of medicine-related geriatric syndromes on the part of hospital physicians and pharmacists [73].
Patients in both the community and residential aged care facilities frequently express a desire to have their medicines reduced in number, especially if advised by their treating clinician [74,75]. Having said this, many remain wary of discontinuing specific medicines [67], sharing the same fears of evoking withdrawal syndromes or disease relapse as do prescribers, and recounting the strong advice of past specialists to never withhold any medicines without first seeking their advice.
A challenge for all involved in deprescribing is gaining agreement on what are the most important factors that determine when, how, and in whom deprescribing should be conducted. Recent qualitative studies suggest that doctors, pharmacists, nursing staff, and patients and their families, while in broad agreement that deprescribing is worthwhile, often differ in their perspectives on what takes priority in selecting medicines for deprescribing in individual patients, and how it should be done and by whom [76,77].
Strategies That May Facilitate Deprescribing
While deprescribing presents some challenges, there are several strategies that can facilitate it at both the level of individual clinical encounters and at the level of whole populations and systems of care.
Individual Clinical Encounters
Within individual clinician–patient encounters, patients should be empowered to ask their doctors and pharmacists the following questions:
- What are my treatment options (including non-medicine options) for my condition?
- What are the possible benefits and harms of each medicine?
- What might be reasonable grounds for stopping a medicine?
In turn, doctors and pharmacists should ask in a nonjudgmental fashion, at every encounter, whether patients are experiencing any side effects, administration and monitoring problems, or other barriers to adherence associated with any of their medicines.
The issue of deprescribing should be framed as an attempt to alleviate symptoms (of drug toxicity), improve quality of life (from drug-induced disability), and lessen the risk of morbid events (especially ADEs) in the future. Compelling evidence that identifies circumstances in which medicines can be safely withdrawn while reducing the risk of ADEs needs to be emphasized. Specialists must play a sentinel leadership role in advising and authorizing other health professionals to deprescribe in situations where benefits of medications they have prescribed are no longer outweighed by the harms [60,78].
In language they can understand, patients should be informed of the benefit–harm trade-offs specific to them of continuing or discontinuing a particular medicine, as far as these can be specified. Patients often overestimate the benefits and underestimate the harms of treatments [79]. Providing such personalised information can substantially alter perceptions of risk and change attitudes towards discontinuation [80]. Eliciting patients’ beliefs about the necessity for each individual medicine and spending time, using an empathic manner, to dispel or qualify those at odds with evidence and clinical judgement renders deprescribing more acceptable to patients.
In estimating treatment benefit–harm trade-offs in individual patients, disease risk prediction tools (http://www.medal.org/), evidence tables [81,82], and decision aids are increasingly available. Prognostication tools (http://eprognosis.ucsf.edu) combined with trial-based time-to-event data can be used to determine if medicine-specific time until benefit exceeds remaining life span.
Deprescribing is best performed by reducing medicines one at a time over several encounters with the same overseeing generalist clinician with whom patients have established a trusting and collaborative relationship. This provides repeated opportunities to discuss and assuage any fears of discontinuing a medicine, and to adjust the deprescribing plan according to changes in clinical circumstances and revised treatment goals. Practice-based pharmacists can review patients’ medicine lists and apply screening criteria to identify medicines more likely to be unnecessary or harmful, which then helps initiate and guide deprescribing. Integrating a structured deprescribing protocol—and reminders to use it—into electronic health records, and providing decision support and data collection for future reference, reduce the cognitive burden on prescribers [83]. Practical guidance in how to safely wean and cease particular classes of medicines in older people can be accessed from various sources [84,85]. Seeking input from clinical pharmacologists, pharmacists, nurses, and other salient care providers on a case-by-case basis in the form of interactive case conferences provides support, seeks consensus, and shares the risk and responsibility for deprescribing recommendations [86].
System of Care
The success of deprescribing efforts in realizing better population health will be compromised unless all key stakeholders involved in quality use of medicines commit to operationalizing deprescribing strategies at the system of care level. Position statements on deprescribing in multi-morbid populations should be formulated and promulgated by all professional societies of prescribers (primary care, specialists, pharmacists, dentists, nurse practitioners). Professional development programs as well as undergraduate, graduate, and postgraduate courses in medicine, pharmacy, and nursing should include training in deprescribing as a core curricular element.
Researchers seeking funding and/or ethics approval for research projects involving medicines should be required to collect, analyze, and report data on the frequency of, and reasons for, withdrawal of drugs in trial subjects. This helps build the evidence base of medicine-related harm. In turn, government funders of research should require more researchers to design and conduct clinical trials that recruit multi-morbid patients, including specific subgroups (eg, patients with dementia), and aim to define medicine benefits and harms using patient risk stratification methods. Pharmaceutical companies should sponsor research on how to deprescribe their medicines within trials that also aim to assess efficacy and safety. Medicine regulatory authorities such as the Food and Drug Administration should mandate that this information be supplied at the time the company submits their application to have the medicine approved and listed for public subsidy. Trialists should adopt the word “deprescribing” in abstract titles for research on prescriber-initiated medicine discontinuation so that relevant articles can be more accurately indexed in, and retrieved from, bibliographic databases using recently formulated medical subject headings in Medline (“depresciptions”).
Editors of medical journals should promote a deprescribing agenda as a quality and safety issue for patient care, with the “Less is More” series in JAMA Internal Medicine and “Too much medicine” series in BMJ being good examples. Clinical guideline developers should formulate treatment recommendations specific to the needs of multi-morbid patients which acknowledge the limited evidence base for many medicines in such populations. These should take account of commonly encountered clinical scenarios where disease-specific medicines may engender greater risk of harm, and provide cautionary notes regarding initiation and discontinuation of medicines associated with high-risk.
Pharmacists need to instruct patients in how to identify medicine-induced harm and side effects, and how to collaborate with their prescribing clinicians in safely discontinuing high-risk medicines. Ideally, patients being admitted to residential aged care facilities should have their medicine lists reviewed by a pharmacist in flagging medicines eligible for deprescribing. Organizations and services responsible for providing quality use of medicines information (medicines handbooks, prescribing guidelines, drug safety bulletins) should describe when and how deprescribing should be performed in regards to specific medicines. This information should be cross-referenced to clinical guidelines and position statements dealing with the same medicine. Vendors of medicine prescribing software should be encouraged to incorporate flags and alerts which prompt prescribers to consider medicine cessation in high-risk patients.
Government and statutory bodies with responsibility for health care (health departments, quality and safety commissions, practice accreditation services, health care standard–setting bodies) should fund more research to develop and evaluate medicine safety standards aimed at reducing inappropriate use of medicines. Accreditation procedures for hospitals and primary care organizations should mandate the adoption of professional development and quality measurement systems that support and monitor patients receiving multiple medicines. Organizations responsible for conducting pharmacovigilance studies should issue medicine-specific deprescribing alerts whenever their data suggest higher than expected incidence of medicine-related adverse events in older populations receiving such medicines.
Conclusion
Inappropriate medicine use and polypharmacy is a growing issue among older and multi-morbid patients. The cumulative evidence of the safety and benefits of deprescribing argues for its adoption on the part of all prescribers, as well as its support by pharmacists and others responsible for optimizing use of medicines. Widespread implementation within routine care of an evidence-based approach to deprescribing in all patients receiving polypharmacy has its challenges, but also considerable potential to relieve unnecessary suffering and disability. More high quality research is needed in defining the circumstances under which deprescribing confers maximal benefit in terms of improved clinical outcomes.
Corresponding author: Ian A. Scott, Dept. of Internal Medicine and Clinical Epidemiology, Princess Alexandra Hospital, Brisbane, Australia 4102, [email protected].
Financial disclosures: None.
1. Qato DM, Alexander GC, Conti RM, et . Use of prescription and over-the-counter medications and dietary supplements among older adults in the United States. JAMA 2008;300:2867–78.
2. Kantor ED, Rehm CD, Haas JS, et al. Trends in prescription drug use among adults in the United States from 1999-2012. JAMA 2015;314:1818–31.
3. Wise J. Polypharmacy: a necessary evil. BMJ 2013;347: f7033.
4. Gnjidic D, Hilmer SN, Blyth FM, et al. Polypharmacy cutoff and outcomes: five or more medicines were used to identify community-dwelling older men at risk of different adverse outcomes. J Clin Epidemiol 2012;65:989–95.
5. Atkin PA, Veitch PC, Veitch EM, Ogle SJ. The epidemiology of serious adverse drug reactions among the elderly. Medicines Aging 1999;14:141–52.
6. Roughead EE, Anderson B, Gilbert AL. Potentially inappropriate prescribing among Australian veterans and war widows/widowers. Intern Med J 2007;37:402–5.
7. Stafford AC, Alswayan MS, Tenni PC. Inappropriate prescribing in older residents of Australian care homes. Clin Pharmacol Therapeut 2011;36:33–44.
8. Tjia J, Briesacher BA, Peterson D, et al. Use of medications of questionable benefit in advanced dementia. JAMA Intern Med 2014;174:1763–71.
9. Tjia J, Velten SJ, Parsons C, et al. Studies to reduce unnecessary medication use in frail older adults: A systematic review. Drugs Aging 2013;30:285–307.
10. Anathhanam AS, Powis RA, Cracknell AL, Robson J. Impact of prescribed medicines on patient safety in older people. Ther Adv Drug Saf 2012;3:165–74.
11. Opondo D, Eslami S, Visscher S, et al. Inappropriateness of medication prescriptions to elderly patients in the primary care setting: a systematic review. PLoS One 2012;7(8):e43617.
12. Kalisch LM, Caughey GE, Barratt JD, et al. Prevalence of preventable medication-related hospitalizations in Australia: an opportunity to reduce harm. Int J Qual Health Care 2012;24:239–49.
13. Bero LA, Lipton HL, Bird JA. Characterisation of geriatric drug-related hospital readmissions. Med Care 1991;29:989–1003.
14. Jyrkkä J, Enlund H, Korhonen MJ, et al. Polypharmacy status as an indicator of mortality in an elderly population. Drugs Aging 2009;26:1039–48.
15. Steinman MA, Miao Y, Boscardin WJ, et al. Prescribing quality in older veterans: a multifocal approach. J Gen Intern Med 2014;29:1379–86.
16. Goldberg R, Mabee J, Chan L, Wong S. Drug-drug and drug-disease interactions in the ED: analysis of a high-risk population. Am J Emerg Med 1996;14:447–50.
17. Elliott RA, Booth JC. Problems with medicine use in older Australians: a review of recent literature. J Pharm Pract Res 2014;44:258–71.
18. Barat I, Andreasen F, Damsgaard EM. Drug therapy in the elderly: what doctors believe and patients actually do. Br J Clin Pharmacol 2001;51:615–22.
19. Chapman RH, Benner JS, Petrilla AA, et al. Predictors of adherence with antihypertensive and lipid-lowering therapy. Arch Intern Med 2005;165:1147–52.
20. Gnjidic D, Hilmer SN. Emergency hospitalizations for adverse drug events. N Engl J Med 2012;366:859.
21. Gnjidic D, Hilmer SN, Blyth FM, Naganathan V, Waite L, et al. Polypharmacy cutoff and outcomes: five or more medicines were used to identify community-dwelling older men at risk of different adverse outcomes. J Clin Epidemiol 2012;65:989–95.
22. Cherubini A, Oristrell J, Pla X, et al. The persistent exclusion of older patients from ongoing clinical trials regarding heart failure. Arch Intern Med 2011;171:550–6.
23. Bugeja G, Kumar A, Banerjee AK. Exclusion of elderly people from clinical research: a descriptive study of published reports. BMJ 1997;315:1059.
24. Mangin D, Heath I, Jamoulle M. Beyond diagnosis: rising to the multimorbidity challenge. BMJ 2012;344:e3526.
25. Boyd CM, Darer J, Boult C, et al. Clinical practice guidelines and quality of care for older patients with multiple comorbid diseases: implications for pay for performance. JAMA 2005;294:716–24.
26. McLean AJ, Le Couteur DG. Aging biology and geriatric clinical pharmacology. Pharmacol Rev 2004;56:163–84.
27. Hilmer SN, Mager DE, Simonsick EM, et al. Drug Burden Index score and functional decline in older people. Am J Med 2009;122:1142–9.
28. Reeve E, Gnjidic D, Long J, Hilmer S. A systematic review of the emerging definition of ‘deprescribing’ with network analysis: implications for future research and clinical practice. Br J Clin Pharmacol 2015;80:1254–68.
29. Scott IA, Hilmer SN, Reeve E, et al. Reducing inappropriate polypharmacy – the process of deprescribing. JAMA Intern Med 2015;175:827–34.
30. Scott IA, Gray LA, Martin JH, et al. Deciding when to stop: towards evidence-based deprescribing of drugs in older populations. Evidence-based Med 2013;18:121–4.
31. Reeve E, Shakib S, Hendrix I, et al. Review of deprescribing processes and development of an evidence-based, patient-centred deprescribing process. Br J Clin Pharmacol 2014;78:738–47.
32. Alldred D. Deprescribing: a brave new word? Int J Pharm Pract. 2014;22:2–3.
33. Kaur S, Mitchell G, Vitetta L, Roberts MS. Interventions that can reduce inappropriate prescribing in the elderly: a systematic review. Drugs Aging 2009;26:1013–28.
34. Tjia J, Velten SJ, Parsons C, et al. Studies to reduce unnecessary medication use in frail older adults: A systematic review. Drugs Aging 2013;30:285–307.
35. Thomas R, Huntley AL, Mann M, et al. Pharmacist-led interventions to reduce unplanned admissions for older people: a systematic review and meta-analysis of randomised controlled trials. Age Ageing 2014;43:174–87.
36. Gnjidic D, Le Couteur DG, Kouladjian L, Hilmer SN. Deprescribing trials: Methods to reduce polypharmacy and the impact on prescribing and clinical outcomes. Clin Geriatr Med 2012;28:237–53.
37. Patterson SM, Hughes C, Kerse N, et al. Interventions to improve use of polypharmacy for older people. Cochrane Database Syst Rev 2012;5:CD008165.
38. Chhina HK, Bhole VM, Goldsmith C, et al. Effectiveness of academic detailing to optimize medication prescribing behaviour of family physicians. J Pharm Pharm Sci 2013;16:511–29.
39. Alldred DP, Raynor DK, Hughes C, et al. Interventions to optimise prescribing for older people in care homes. Cochrane Database Syst Rev 2013;CD009095.
40. García-Gollarte F, Baleriola-Júlvez J, Ferrero-López I, et al. An educational intervention on drug use in nursing homes improves health outcomes and resource utilization and reduces inappropriate drug prescription. J Am Dir Assoc 2014;15:885–91.
41. Pitkälä KH, Juola A-L, Kautiainen H, Soini H, et al. Education to reduce potentially harmful medication use among residents of assisted living facilities: A randomized controlled trial. J Am Dir Assoc 2014;15:892–8.
42. Tannenbaum C, Martin P, Tamblyn R, et al. Reduction of inappropriate benzodiazepine prescriptions among older adults through direct patient education. The EMPOWER cluster randomized trial. JAMA Intern Med 2014;174:890–8.
43. Iyer S, Naganathan V, McLachlan AJ, Le Couteur DG. Medication withdrawal trials in people aged 65 years and older: a systematic review. Drugs Aging 2008;25:1021–31.
44. Declercq T, Petrovic M, Azermai M, et al. Withdrawal versus continuation of chronic antipsychotic medicines for behavioural and psychological symptoms in older people with dementia. Cochrane Database Syst Rev 2013;3:CD007726.
45. Ekbom T, Lindholm LH, Odén A, et al. A 5-year prospective, observational study of the withdrawal of antihypertensive treatment in elderly people. J Intern Med 1994;235:581–588.
46. Kutner JS, Blatchford PJ, Taylor DH Jr, et al. Safety and benefit of discontinuing statin therapy in the setting of advanced, life-limiting illness: a randomized clinical trial. JAMA Intern Med 2015;175:691–700.
47. Page AT, Clifford RM, Potter K, Schwartz D, Etherton-Beer CD. The feasibility and effect of deprescribing in older adults on mortality and health: a systematic review and meta-analysis. Br J Clin Pharmacol 2016 Apr 14. [Epub ahead of print]
48. Garfinkel D, Zur-Gil S, Ben-Israel J. The war against polypharmacy: a new cost-effective geriatric-palliative approach for improving drug therapy in disabled elderly people. Isr Med Assoc J 2007;9:430–4.
49. Garfinkel D, Mangin D. Feasibility study of a systematic approach for discontinuation of multiple medicines in older adults: addressing polypharmacy. Arch Intern Med 2010;170:1648–54.
50. McKean M, Pillans P, Scott IA. A medication review and deprescribing method for hospitalised older patients receiving multiple medications. Intern Med J 2016;46:35–42.
51. Mudge A, Radnedge K, Kasper K, et al. Effects of a pilot multidisciplinary clinic for frequent attending elderly patients on deprescribing. Aust Health Rev 2015; Jul 6. [Epub ahead of print]
52. Gallagher PF, O’Connor MN, O’Mahony D. Prevention of potentially inappropriate prescribing for elderly Patients: A randomized controlled trial using STOPP/START criteria. Clin Pharmacol Therap 2011;89:845–54.
53. Dalleur O, Boland B, Losseau C, et al. Reduction of potentially inappropriate medications using the STOPP criteria in frail older inpatients: a randomised controlled study. Drugs Aging 2014;31:291–8.
54. Potter K, Flicker L, Page A, Etherton-Beer C. Deprescribing in frail older people: A randomised controlled trial. PLoS One 2016;11(3):e0149984.
55. Conklin J, Farrell B, Ward N, et al. Developmental evaluation as a strategy to enhance the uptake and use of deprescribing guidelines: protocol for a multiple case study. Implement Sci 2015;10:91–101.
56. Lindsay J, Dooley M, Martin J, et al. The development and evaluation of an oncological palliative care deprescribing guideline: the ‘OncPal deprescribing guideline’ Support Care Cancer 2015;23:71–8.
57. Miller GC, Valenti L, Britt H, Bayram C. Drugs causing adverse events in patients aged 45 or older: a randomised survey of Australian general practice patients. BMJ Open 2013;3:e003701.
58. Budnitz DS, Lovegrove MC, Shebab N, Richards CL. Emergency hospitalisations for adverse drug events in older Americans. N Engl J Med 2011;365:2002–12.
59. Scott IA, Andersen K, Freeman C. Review of structured guides for deprescribing. Eur J Hosp Pharm 2016. In press.
60. Scott IA, Le Couteur D. Physicians need to take the lead in deprescribing. Intern Med J 2015;45:352–6.
61. Poudel A, Ballokova A, Hubbard RE, et al. An algorithm of medication review in residential aged care facilities: focus on minimizing use of high risk medications. Geriatr Gerontol Int Sep 3. [Epub ahead of print]
62. Scott IA, Martin JH, Gray LA, Mitchell CA. Effects of a drug minimisation guide on prescribing intentions in elderly persons with polypharmacy. Drugs Ageing 2012;29:659–67.
63. Bennett A, Gnjidic D, Gillett M, et al. Prevalence and impact of fall-risk-increasing drugs, polypharmacy, and drug-drug interactions in robust versus frail hospitalised falls patients: a prospective cohort study. Drugs Aging 2014;31:225–32.
64. Black DM, Schwartz AV, Ensrud KE, et al. FLEX Research Group. Effects of continuing or stopping alendronate after 5 years of treatment: the Fracture Intervention Trial Long-term Extension (FLEX): a randomised trial. JAMA 2006;296:2927–38.
65. Sever PS, Chang CL, Gupta AK, et al. The Anglo-Scandinavian Cardiac Outcomes Trial: 11-year mortality follow-up of the lipid lowering arm in the UK. Eur Heart J 2011;32:2525–32.
66. Anderson K, Stowasser D, Freeman C, Scott I. Prescriber barriers and enablers to minimising potentially inappropriate medications in adults: a systematic review and thematic synthesis. BMJ Open 2014;4.
67. Reeve E, To J, Hendrix I, et al. Patient barriers to and enablers of deprescribing: a systematic review. Drugs Aging 2013;30:793–807.
68. Palagyi A, Keay L, Harper J, et al. Barricades and brickwalls—a qualitative study exploring perceptions of medication use and deprescribing in long-term care. BMC Geriatr 2016;16:15.
69. Garfinkel D, Ilhan B, Bahat G. Routine deprescribing of chronic medications to combat polypharmacy. Ther Adv Drug Saf 2015;6:212–33.
70. Reeve E, Shakib S, Hendrix I, et al. The benefits and harms of deprescribing. Med J Aust 2014;201:386–9.
71. Betteridge TM, Frampton CM, Jardine DL. Polypharmacy – we make it worse! A cross-sectional study from an acute admissions unit. Intern Med J 2012;42:208–11.
72. Hubbard RE, Peel NM, Scott IA, et al. Polypharmacy among inpatients aged 70 years or older in Australia. Med J Aust 2015;202:373–7.
73. Klopotowska JE, Wierenga PC, Smorenburg SM, et al. Recognition of adverse drug events in older hospitalized medical patients. Eur J Clin Pharmacol 2013;69:75–85.
74. Reeve E, Wiese MD, Hendrix I, et al. People’s attitudes, beliefs, and experiences regarding polypharmacy and willingness to deprescribe. J Am Geriatr Soc 2013;61:1508–14.
75. Kalogianis MJ, Wimmer BC, Turner JP, et al. Are residents of aged care facilities willing to have their medications deprescribed? Res Social Adm Pharm 2015. Published online 18 Dec 2015.
76. Turner JP, Edwards S, Stanners M, et al. What factors are important for deprescribing in Australian long-term care facilities? Perspectives of residents and health professionals. BMJ Open 2016;6:e009781.
77. Page AT, Etherton-Beer CD, Clifford RM, et al. Deprescribing in frail older people - Do doctors and pharmacists agree? Res Social Adm Pharm 2015;12:438–49.
78. Luymes CH, van der Kleij RM, Poortvliet RK, et al. Deprescribing potentially inappropriate preventive cardiovascular medication: Barriers and enablers for patients and general practitioners. Ann Pharmacother 2016 Mar 3. [Epub ahead of print]
79. Hoffmann TC, Del Mar C. Patients’ expectations of the benefits and harms of treatments, screening, and tests: a systematic review. JAMA Intern Med 2015;175:274–86.
80. Martin P, Tamblyn R, Ahmed S, Tannenbaum C. A drug education tool developed for older adults changes knowledge, beliefs and risk perceptions about inappropriate benzodiazepine prescriptions in the elderly. Patient Educ Couns 2013;92:81–7.
81. Hamilton H, Gallagher P, Ryan C, et al. Potentially inappropriate medicines defined by STOPP criteria and the risk of adverse drug events in older hospitalized patients. Arch Intern Med 2011;171:1013–7.
82. NHS Highland. Polypharmacy: guidance for prescribing in frail adults. Accessed at: www.nhshighland.scot.nhs.uk/publications/documents/guidelines/polypharmacy guidance for prescribing in frail adults.pdf.
83. Anderson K, Foster MM, Freeman CR, Scott IA. A multifaceted intervention to reduce inappropriate polypharmacy in primary care: research co-creation opportunities in a pilot study. Med J Aust 2016;204:S41–4.
84. A practical guide to stopping medicines in older people. Accessed at: www.bpac.org.nz/magazine/2010/april/stopGuide.asp.
85. www.cpsedu.com.au/posts/view/46/Deprescribing-Documents-now-Available-for-Download.
86. Bregnhøj L, Thirstrup S, Kristensen MB, et al. Combined intervention programme reduces inappropriate prescribing in elderly patients exposed to polypharmacy in primary care. Eur J Clin Pharmacol 2009;65:199–207.
Concurrent fibromyalgia intensifies ankylosing spondylitis symptoms
DENVER – Fibromyalgia syndrome commonly occurred in patients with ankylosing spondylitis who were reviewed at one U.S. center, and when the two coexisted ankylosing spondylitis disease severity significantly increased.
In the study’s 62 patients with confirmed ankylosing spondylitis (AS), 27 (44%) also met the 2010 American College of Rheumatology diagnostic criteria for fibromyalgia syndrome, Sherilyn Diomampo, MD, said at the annual meeting of the Spondyloarthritis Research and Treatment Network. The fibromyalgia rate in these AS patients was substantially above prior reports of fibromyalgia prevalence rates in the range of 10%-15%, said Dr. Diomampo, a rheumatologist at MetroHealth Medical Center in Cleveland.

Patients with both disorders also had substantially higher scores across the board for all the measures of AS severity that Dr. Diomampo and her associates evaluated. For example, scores on the Bath AS Disease Activity Index averaged 6.8 in the patients with fibromyalgia and 3.8 in those without fibromyalgia. (A BASDAI score of 4.0 or higher generally suggests suboptimal disease control.) The average score of the AS Disease Activity Score using C-reactive protein (CRP) as the serum marker of inflammation was 4.2 in the subgroup with fibromyalgia and 2.8 in those without. (An ASDAS score of 3.5 or higher denotes high or very high disease activity. A score reduced by at least 1.1 indicates a clinically important improvement.) All these between-group differences were statistically significant.
Other measures of AS severity that were significantly higher with fibromyalgia included patient global self assessment, physician global assessment, average serum levels of CRP, and the average erythrocyte sedimentation rate.
The 2010 ACR diagnostic criteria for fibromyalgia syndrome used by Dr. Diomampo and her associates in their analysis require a patient to have a widespread pain index of at least 7 and symptom severity of at least 5, or alternatively, a widespread pain index of 3-6 and symptom severity of at least 9 (Arthritis Care Res. 2010 May;62[5]:600-10). In addition, for this study, the researchers stipulated that diagnosis of concomitant fibromyalgia meant patients had their fibromyalgia symptoms in place for at least 3 months, and the examining clinician could not attribute the patient’s pain to AS.
Using linear regression models with the widespread pain index and the symptom severity as the dependent variables, the researchers failed to see any statistically significant relationship between either of these two determinants of fibromyalgia severity and five different measures of AS severity, including the BASDAI and the ASDAS. In short, the assessment tools used to measure AS severity showed no ability to also measure the core characteristics of fibromyalgia, Dr. Diomampo said.
Overall, patients in the study averaged about 49 years old. The analysis showed a significantly higher rate of African-American patients in the fibromyalgia group, 63%, compared with a 37% rate of African Americans in those with AS and no fibromyalgia. The presence of acute, anterior uveitis was 27% among those with fibromyalgia and 73% of those with AS and no fibromyalgia. One notable similarity between the two subgroups was the percentage on treatment with a tumor necrosis factor inhibitor: 52% among those with concurrent fibromyalgia and 49% among those with AS alone.
Dr. Diomampo had no disclosures.
On Twitter @mitchelzoler
DENVER – Fibromyalgia syndrome commonly occurred in patients with ankylosing spondylitis who were reviewed at one U.S. center, and when the two coexisted ankylosing spondylitis disease severity significantly increased.
In the study’s 62 patients with confirmed ankylosing spondylitis (AS), 27 (44%) also met the 2010 American College of Rheumatology diagnostic criteria for fibromyalgia syndrome, Sherilyn Diomampo, MD, said at the annual meeting of the Spondyloarthritis Research and Treatment Network. The fibromyalgia rate in these AS patients was substantially above prior reports of fibromyalgia prevalence rates in the range of 10%-15%, said Dr. Diomampo, a rheumatologist at MetroHealth Medical Center in Cleveland.
Patients with both disorders also had substantially higher scores across the board for all the measures of AS severity that Dr. Diomampo and her associates evaluated. For example, scores on the Bath AS Disease Activity Index averaged 6.8 in the patients with fibromyalgia and 3.8 in those without fibromyalgia. (A BASDAI score of 4.0 or higher generally suggests suboptimal disease control.) The average score of the AS Disease Activity Score using C-reactive protein (CRP) as the serum marker of inflammation was 4.2 in the subgroup with fibromyalgia and 2.8 in those without. (An ASDAS score of 3.5 or higher denotes high or very high disease activity. A score reduced by at least 1.1 indicates a clinically important improvement.) All these between-group differences were statistically significant.
Other measures of AS severity that were significantly higher with fibromyalgia included patient global self assessment, physician global assessment, average serum levels of CRP, and the average erythrocyte sedimentation rate.
The 2010 ACR diagnostic criteria for fibromyalgia syndrome used by Dr. Diomampo and her associates in their analysis require a patient to have a widespread pain index of at least 7 and symptom severity of at least 5, or alternatively, a widespread pain index of 3-6 and symptom severity of at least 9 (Arthritis Care Res. 2010 May;62[5]:600-10). In addition, for this study, the researchers stipulated that diagnosis of concomitant fibromyalgia meant patients had their fibromyalgia symptoms in place for at least 3 months, and the examining clinician could not attribute the patient’s pain to AS.
Using linear regression models with the widespread pain index and the symptom severity as the dependent variables, the researchers failed to see any statistically significant relationship between either of these two determinants of fibromyalgia severity and five different measures of AS severity, including the BASDAI and the ASDAS. In short, the assessment tools used to measure AS severity showed no ability to also measure the core characteristics of fibromyalgia, Dr. Diomampo said.
Overall, patients in the study averaged about 49 years old. The analysis showed a significantly higher rate of African-American patients in the fibromyalgia group, 63%, compared with a 37% rate of African Americans in those with AS and no fibromyalgia. The presence of acute, anterior uveitis was 27% among those with fibromyalgia and 73% of those with AS and no fibromyalgia. One notable similarity between the two subgroups was the percentage on treatment with a tumor necrosis factor inhibitor: 52% among those with concurrent fibromyalgia and 49% among those with AS alone.
Dr. Diomampo had no disclosures.
On Twitter @mitchelzoler
AT THE 2016 SPARTAN ANNUAL MEETING
Key clinical point: Nearly half of patients with ankylosing spondylitis had concurrent fibromyalgia at one U.S. center, and patients with both had much greater AS severity.
Major finding: The average BASDAI was 6.8 in patients with ankylosing spondylitis and fibromyalgia and 3.8 in patients with AS only.
Data source: Observational data collected on 62 adults with ankylosing spondylitis at one U.S. center.
Disclosures: Dr. Diomampo had no disclosures.

CDC warns pregnant women to avoid Miami neighborhood due to Zika risk
Health officials in Florida have identified 10 new cases of locally transmitted Zika virus infections in the neighborhood just north of downtown Miami where four other cases were reported earlier.
Persistent mosquito populations in southern Florida are the leading cause of the disease’s growing incursion into the continental United States, according to Tom Frieden, MD, MPH, director of the Centers for Disease Control and Prevention.

“This suggests that there is a risk of continued, active transmission of Zika in that area,” Dr. Frieden said Aug. 1 during a press call regarding the discovery of new cases by Florida officials.
The CDC is issuing new recommendations for people who either have visited, are currently visiting, or plan to visit this Miami neighborhood at any point after June 15, the earliest known date on which the infected individuals could have been exposed to the virus.
Women who are pregnant or planning to become pregnant are advised to stay away from the neighborhood north of downtown Miami. Women who live in or around Miami, and who either are or plan to become pregnant, should take steps to protect themselves from mosquitoes. Individuals living in Miami should take precautions to prevent transmitting the disease sexually.
Additionally, the CDC is sending an Emergency Response Team to Florida to assist with efforts to quell the mosquito population and spread awareness about Zika virus prevention.
“These experts include individuals with extensive experience in Zika, in addressing pregnancy and birth defects, in mosquito control, in laboratory science, and community engagement,” Dr. Frieden said.
Dr. Frieden reiterated that controlling the local mosquito population is one of the most effective ways to stop ongoing Zika virus transmission. However, current efforts are being hampered by several factors, including small bodies of standing water near which mosquitoes are breeding, the inherent difficulty in killing this species of mosquito, and the possibility that the Aedes aegypti mosquito is resistant to the insecticides being used.
Vector control experts will work with health officials on the ground in Miami to conduct resistance testing on local mosquitoes, in order to confirm whether the insecticides are working. These tests could be done after just 1 week, but may take 3 or more weeks. Further discussion is also ongoing to determine other ways of bringing down the mosquito population.
“What we know about Zika is scary [but] in some ways, what we don’t know about Zika is even more unsettling,” said Dr. Frieden, who added that “at CDC, more than 1,600 of our experts have been working since January to learn more about Zika and protect the health of pregnant women and others.”
Health officials in Florida have identified 10 new cases of locally transmitted Zika virus infections in the neighborhood just north of downtown Miami where four other cases were reported earlier.
Persistent mosquito populations in southern Florida are the leading cause of the disease’s growing incursion into the continental United States, according to Tom Frieden, MD, MPH, director of the Centers for Disease Control and Prevention.
“This suggests that there is a risk of continued, active transmission of Zika in that area,” Dr. Frieden said Aug. 1 during a press call regarding the discovery of new cases by Florida officials.
The CDC is issuing new recommendations for people who either have visited, are currently visiting, or plan to visit this Miami neighborhood at any point after June 15, the earliest known date on which the infected individuals could have been exposed to the virus.
Women who are pregnant or planning to become pregnant are advised to stay away from the neighborhood north of downtown Miami. Women who live in or around Miami, and who either are or plan to become pregnant, should take steps to protect themselves from mosquitoes. Individuals living in Miami should take precautions to prevent transmitting the disease sexually.
Additionally, the CDC is sending an Emergency Response Team to Florida to assist with efforts to quell the mosquito population and spread awareness about Zika virus prevention.
“These experts include individuals with extensive experience in Zika, in addressing pregnancy and birth defects, in mosquito control, in laboratory science, and community engagement,” Dr. Frieden said.
Dr. Frieden reiterated that controlling the local mosquito population is one of the most effective ways to stop ongoing Zika virus transmission. However, current efforts are being hampered by several factors, including small bodies of standing water near which mosquitoes are breeding, the inherent difficulty in killing this species of mosquito, and the possibility that the Aedes aegypti mosquito is resistant to the insecticides being used.
Vector control experts will work with health officials on the ground in Miami to conduct resistance testing on local mosquitoes, in order to confirm whether the insecticides are working. These tests could be done after just 1 week, but may take 3 or more weeks. Further discussion is also ongoing to determine other ways of bringing down the mosquito population.
“What we know about Zika is scary [but] in some ways, what we don’t know about Zika is even more unsettling,” said Dr. Frieden, who added that “at CDC, more than 1,600 of our experts have been working since January to learn more about Zika and protect the health of pregnant women and others.”

Current Therapeutic Approaches to Renal Cell Carcinoma
From the Department of Medicine, Carole and Ray Neag Comprehensive Cancer Center, UConn Health, Farmington, CT (Dr. Namakydoust and Dr. Clement) and the UConn School of Pharmacy, Storrs, CT (Dr. Holle).
Abstract
- Objective: To review therapeutic options for the treatment of renal cell carcinoma (RCC).
- Methods: Review of the literature in the context of a clinical case.
- Results: RCC accounts for 90% of all renal tumors. For RCC patients with nondistant metastases, preferred treatment is curative-intent radical nephrectomy or partial nephrectomy; oncologic outcomes for the 2 procedures are similar. For patients who are deemed not to be surgical candidates, ablative techniques such as cryoablation and radiofrequency ablation may be considered. Systemic therapy for metastatic RCC is based on the histologic type of the tumor. Clear-cell is by far the predominant histologic type in RCC. First-line treatment options for patients with metastatic clear-cell RCC include biologic agents such as high-dose interleukin-2 immune therapy, as well as targeted therapies including tyrosine kinase inhibitors (TKIs) and anti-VEGF antibodies. The mammalian target of rapamycin (mTOR) inhibitor temsirolimus is recommended as first-line therapy in patients with poor prognosis. Second-line therapies in this setting include TKIs and nivolumab (PD-1 inhibitor). If TKIs were used as first-line therapy, mTOR inhibitors can be used in the second line. In addition, after initial cytokine therapy, TKIs, temsirolimus, and the anti-VEGF antibody bevacizumab are other treatment options. Best supportive care should always be provided along with initial and subsequent therapies.
- Conclusion: Multiple treatment options are now available for patients with metastatic or unresectable RCC. Given the aggressive course and poor prognosis of non-clear cell renal cell tumors and those with sarcomatoid features, evaluation of systemic and targeted therapies for these subtypes should remain active areas of research and investigation.
Renal cell carcinoma (RCC) is the most common malignancy arising in the kidney, comprising 90% of all renal tumors [1]. Approximately 55,000 new RCC cases are diagnosed each year [1]. Patients with RCC are often asymptomatic, and most cases are discovered as incidental findings on abdominal imaging performed during evaluation of nonrenal complaints. Limited-stage RCC that is found early can be cured sur-gically, with estimated 5-year survival rates approaching 90%; however, long-term survival for metastatic disease is poor, with rates ranging from 0% to 20% [2]. Advanced RCC is resistant to conventional chemotherapy and radiotherapy, and outcomes for patients with metastatic or unresectable RCC remain poor. However, the recent development of new therapeutic modalities that target tumor molecular pathways has expanded the treatment options for these patients and changed the management of RCC.
Epidemiology and Classification
Median age at diagnosis in the United States is 64 years. Men have a higher incidence of RCC than women, with the highest incidence seen in American Indian and Alaska Native men (30.1 per 100,000 population). Genetic syndromes account for 2% to 4% of all RCCs [2]. Risk factors for RCC include smoking, hypertension, obesity, and acquired cystic kidney disease that is associated with end-stage renal failure [3]. Longer duration of tobacco use is associated with a more aggressive course.
The 2004 World Health Organization classification of renal tumors summarizes the previous classification systems (including the Heidelberg and Mainz classification systems) to describe different categories of RCC based on histologic and molecular genetics characteristics [2]. Using the WHO classification criteria, RCC comprises 90% of all renal tumors, with clear cell being the most common type (80%) [2]. Other types of renal tumors include papillary, chromophobe, oncocytoma, and collecting-duct or Bellini duct tumors. Approximately 3% to 5% of tumors are unclassified. Oncocytomas are generally considered benign, and chromophobe tumors typically have an indolent course and rarely metastasize. Sarcomatoid differentiation can be seen in any histologic type and is associated with a worse prognosis.
Familial Syndromes
Several genetic syndromes have been identified by studying families with inherited RCC. Among these, von Hippel-Lindau (VHL) gene mutation is the most commonly found inherited genetic defect. Table 1 summarizes the incidence of gene mutations and the corresponding histologic appearance of the most common sporadic and hereditary RCCs [4].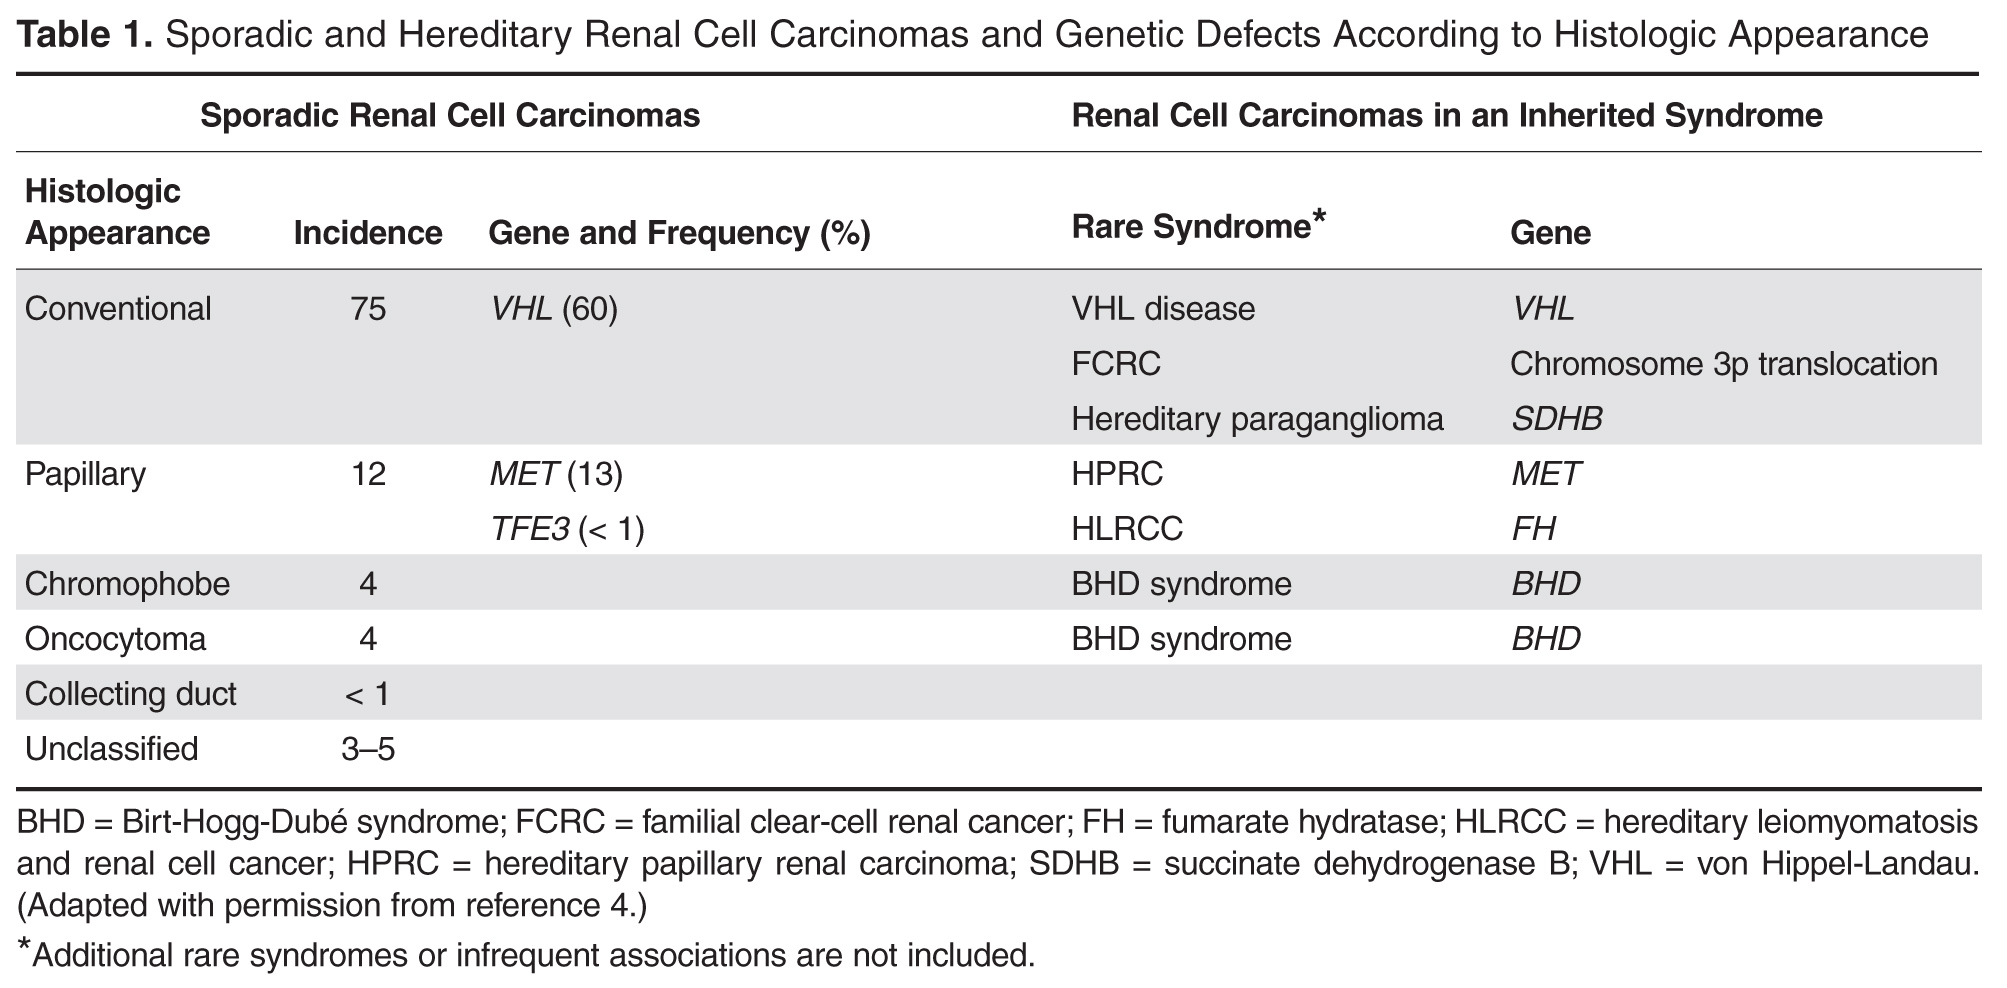
VHL disease is an autosomal dominant familial syndrome. Patients with this mutation are at higher risk for developing RCC (clear cell histology), retinal angiomas, pheochromocytomas, as well as hemangioblastomas of the central nervous system (CNS) [4]. Of all the genetic mutations seen in RCC, the somatic mutation in the VHL tumor-suppressor gene is by far the most common [5]. VHL targets hypoxia–inducible factor-1 alpha (HIF-α) for ubiquitination and subsequent degradation, which has been shown to suppress the growth of clear-cell RCC in mouse models [6–8]. HIF expression under hypoxic conditions leads to activation of a number of genes important in blood vessel development, cell proliferation, and glucose metabolism, including vascular endothelial growth factor (VEGF), erythropoietin, platelet-derived growth factor beta (PDGF-β), transforming growth factor alpha (TGF-α), and glucose transporter-1 (GLUT-1). Mutation in the VHL gene prevents degradation of the HIF-α protein, thereby leading to increased expression of these downstream proteins, including MET and Axl. The upregulation of these angiogenic factors is thought to be the underlying process for increased vascularity of CNS hemangioblastomas and clear-cell renal tumors in VHL disease [4–8].
Other less common genetic syndromes seen in hereditary RCC include hereditary papillary RCC, hereditary leiomyomatosis, and Birt-Hogg-Dubé (BHD) syndrome [9]. In hereditary papillary RCC, the MET gene is mutated. BHD syndrome is a rare, autosomal dominant syndrome characterized by hair follicle hamartomas of the face and neck. About 15% of patients have multiple renal tumors, the majority of which are of the chromophobe or mixed chromophobe-oncocytoma histology. The BHD gene encodes the protein folliculin, which is thought to be a tumor-suppressor gene.
Case Study
Initial Presentation
A 74-year-old man who works as an airplane mechanic repairman presents to the emergency department with sudden worsening of chronic right upper arm and shoulder pain after lifting a jug of orange juice. He does not have a significant past medical history and initially thought that his pain was due to a work-related injury. Upon initial evaluation in the emergency department he is found to have a fracture of his right humerus. Given that the fracture appears to be pathologic, further workup is recommended.
• What are common clinical presentations of RCC?
Most patients are asymptomatic until the disease becomes advanced. The classic triad of flank pain, hematuria, and palpable abdominal mass is seen in approximately 10% of patients with RCC, partly because of earlier detection of renal masses by imaging performed for other purposes [10]. Less frequently, patients present with signs or symptoms of metastatic disease such as bone pain or fracture (as seen in the case patient), painful adenopathy, and pulmonary symptoms related to mediastinal masses. Fever, weight loss, anemia, and/or varicocele often occur in young patients (≤ 46 years) and may indicate the presence of a hereditary form of the disease. Patients may present with paraneoplastic syndromes seen as abnormalities on routine blood work. These can include polycythemia or elevated liver function tests (LFTs) without the presence of liver metastases (known as Stauffer syndrome), which can be seen in localized renal tumors. Nearly half (45%) of patients present with localized disease, 25% present with locally advanced disease, and 30% present with metastatic disease [11]. Bone is the second most common site of distant metastatic spread (following lung) in patients with advanced RCC.
• What is the approach to initial evaluation for a patient with suspected RCC?
Initial evaluation consists of a physical exam, laboratory tests including complete blood count (CBC) and comprehensive metabolic panel (calcium, serum creatinine, LFTs, lactate dehydrogenase [LDH], and urinalysis), and imaging. Imaging studies include computed tomography (CT) scan with contrast of the abdomen and pelvis or magnetic resonance imaging (MRI) of the abdomen and chest imaging. A chest radiograph may be obtained, although a chest CT is more sensitive for the presence of pulmonary metastases. MRI can be used in patients with renal dysfunction to evaluate the renal vein and inferior vena cava (IVC) for thrombus or to determine the presence of local invasion [12]. Although bone and brain are common sites for metastases, routine imaging is not indicated unless the patient is symptomatic. The value of positron emission tomography in RCC remains undetermined at this time.
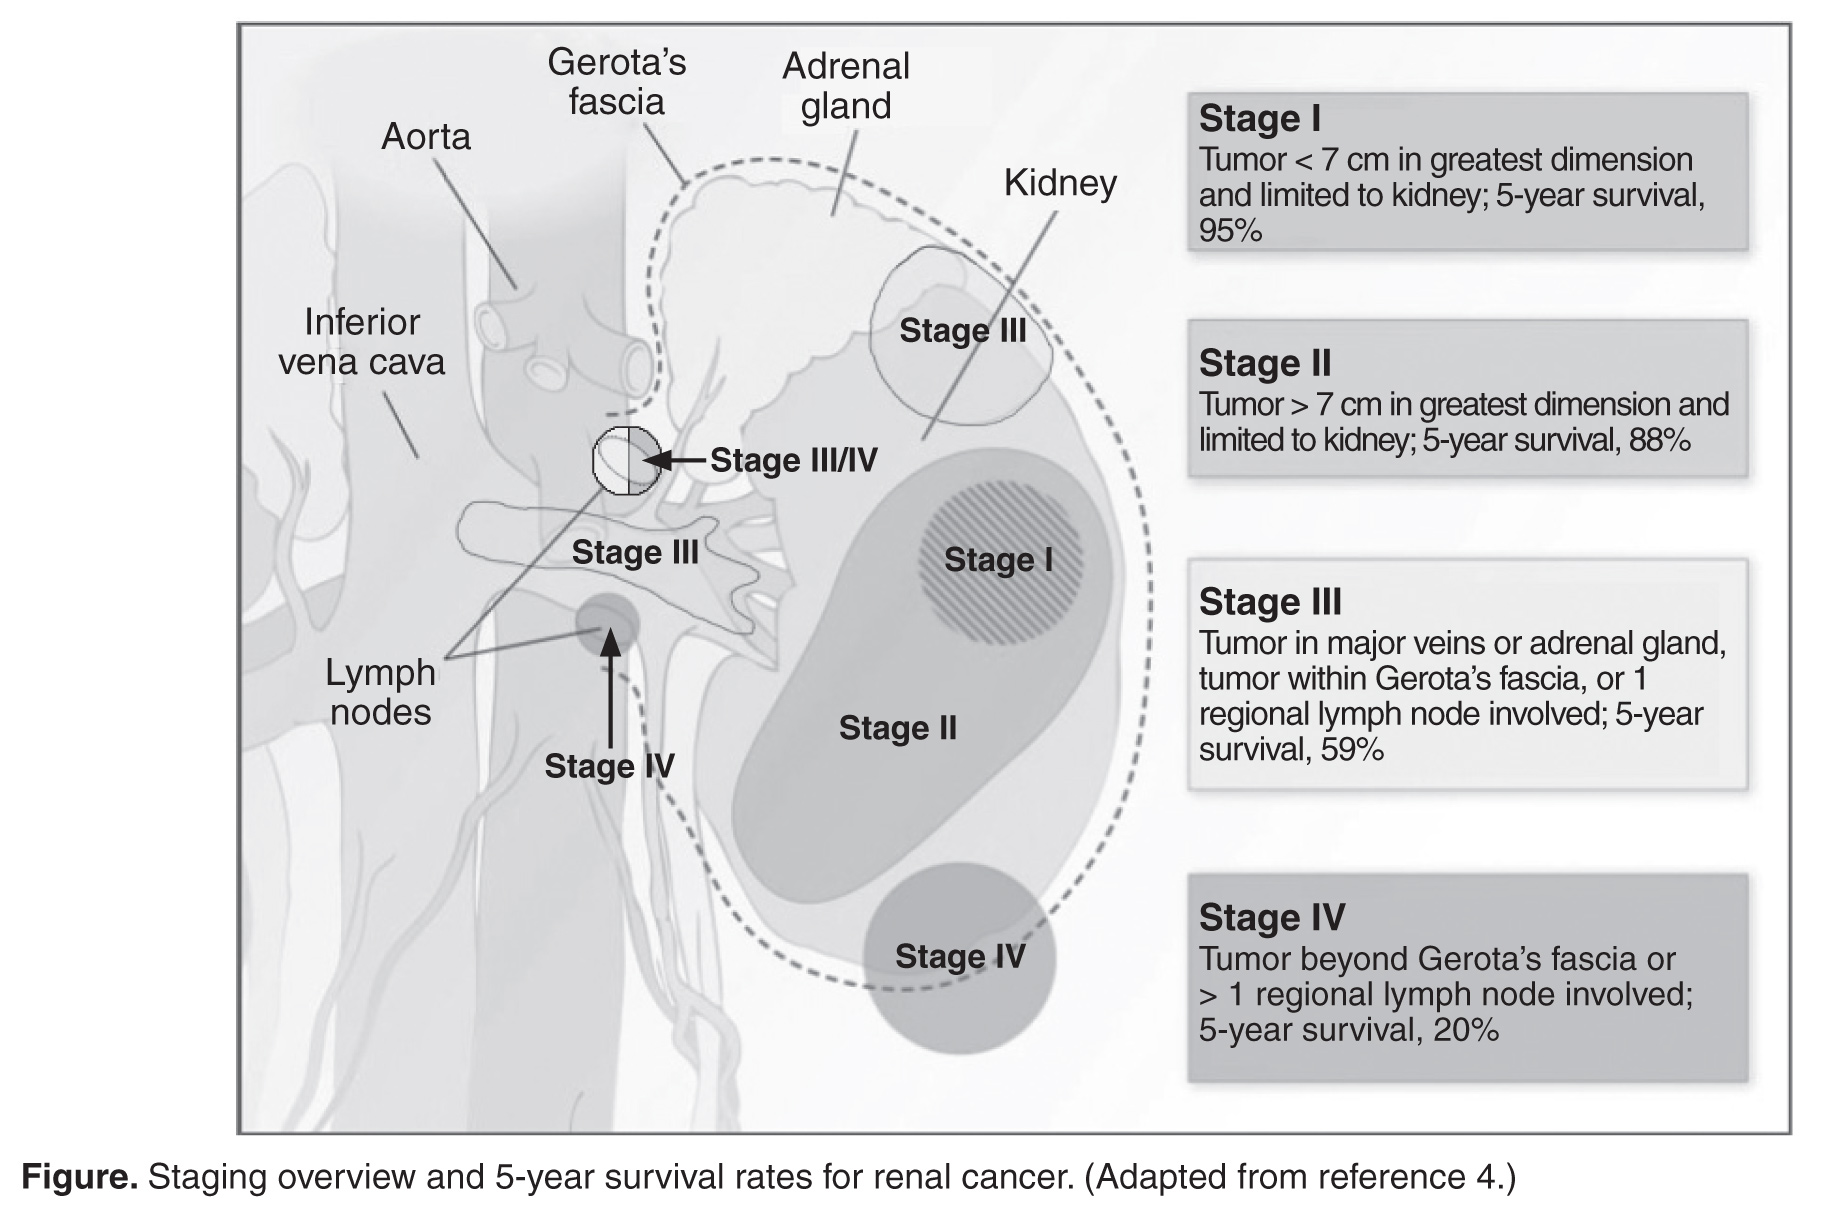
• What are the therapeutic options for limited-stage disease?
For patients with nondistant metastases, or limited-stage disease, surgical intervention with curative intent is considered. Convention suggests considering definitive surgery for patients with stage I and II disease, select patients with stage III disease with pathologically enlarged retroperitoneal lymph nodes, patients with IVC and/or cardiac atrium involvement of tumor thrombus, and patients with direct extension of the renal tumor into the ipsilateral adrenal gland if there is no evidence of distant disease. While there may be a role for aggressive surgical intervention in patients with distant metastatic disease, this topic will not be covered in this review.
Surgical Intervention
Once patients are determined to be appropriate candidates for surgical removal of a renal tumor, the urologist will perform either a radical nephrectomy or a nephron-sparing nephrectomy, also called a partial nephrectomy. The urologist will evaluate the patient based on his or her body habitus, the location of the tumor, whether multiple tumors in one kidney or bilateral tumors are present, whether the patient has a solitary kidney or otherwise impaired kidney function, and whether the patient has a history of a hereditary syndrome involving kidney cancer as this affects the risk of future kidney tumors.
A radical nephrectomy is surgically preferred in the presence of the following factors: tumor larger than 7 cm in diameter, a more centrally located tumor, suspicion of lymph node involvement, tumor involvement with renal vein or IVC, and/or direct extension of the tumor into the ipsilateral adrenal gland. Nephrectomy involves ligation of the vascular supply (renal artery and vein) followed by removal of the kidney and surrounding Gerota’s fascia. The ipsilateral adrenal gland is removed if there is a high-risk for or presence of invasion of the adrenal gland. Removal of the adrenal gland is not standard since the literature demonstrates there is less than a 10% chance of solitary, ipsilateral adrenal gland involvement of tumor at the time of nephrectomy in the absence of high-risk features, and a recent systematic review suggests that the chance may be as low as 1.8% [14]. Preoperative factors that correlated with adrenal involvement included upper pole kidney location, renal vein thrombosis, higher T stage (T3a and greater), multifocal tumors, and evidence for distant metastases or lymph node involvement. Lymphadenectomy previously had been included in radical nephrectomy but now is performed selectively. Radical nephrectomy may be performed as either an open or laparoscopic procedure, the latter of which may be performed robotically [15]. Oncologic outcomes appear to be comparable between the 2 approaches, with equivalent 5-year cancer-specific survival (91% with laparoscopic versus 93% with open approach) and recurrence-free survival (91% with laparoscopic versus 93% with open approach) [16]. The approach ultimately is selected based on provider- and patient-specific input, though in all cases the goal is to remove the specimen intact [16,17].
Conversely, a nephron-sparing approach is preferred for tumors less than 7 cm in diameter, for patients with a solitary kidney or impaired renal function, for patients with multiple small ipsilateral tumors or with bilateral tumors, or for radical nephrectomy candidates with comorbidities for whom a limited intervention is deemed to be a lower-risk procedure. A nephron-sparing procedure may also be performed open or laparoscopically. In nephron-sparing procedures, the tumor is removed along with a small margin of normal parenchyma [15].
In summary, the goal of surgical intervention is curative intent with removal of the tumor while maintaining as much residual renal function as possible to limit long-term morbidity of chronic kidney disease and associated cardiovascular events [18]. Oncologic outcomes for radical nephrectomy and partial nephrectomy are similar. In one study, overall survival was slightly lower in the partial nephrectomy cohort, but only a small number of the deaths were due to RCC [19].
Adjuvant Therapy
Adjuvant systemic therapy currently has no role following nephrectomy for RCC because no systemic therapy has been able to reduce the likelihood of relapse. Randomized trials of cytokine therapy (eg, interferon, interleukin 2) or tyrosine kinase inhibitors (TKIs; eg, sorafenib, sunitinib) with observation alone in patients with locally advanced completely resected RCC have shown no delay in time to relapse or improvement of survival with adjuvant therapy [20]. Similarly, adjuvant radiation therapy has not shown benefit even in patients with nodal involvement or incomplete resection [21]. Therefore, observation remains the standard of care after nephrectomy.
Renal Tumor Ablation
For patients who are deemed not to be surgical candidates due to age, comorbidities, or patient preference and who have tumors less than 4 cm in size (stage I tumors), ablative techniques may be considered. The 2 most well-studied and effective techniques at present are cryoablation and radiofrequency ablation (RFA). Microwave ablation may be an option in some facilities, but the data in RCC are limited. An emerging ablative technique under investigation is irreversible electroporation. At present, the long-term efficacy of all ablative techniques is unknown.
Patient selection is undertaken by urologists and interventional radiologists who evaluate the patient with ultrasound, CT, and/or MRI to determine the location and size of the tumor and the presence or absence of metastatic disease. A pretreatment biopsy is recommended to document the histology of the lesion to confirm a malignancy and to guide future treatment for recurrent or metastatic disease. Contraindications to the procedure include the presence of metastatic disease, a life expectancy of less than 1 year, general medical instability, or uncorrectable coagulopathy due to increased risk of bleeding complications. Tumors in close proximity to the renal hilum or collecting system are a contraindication to the procedure because of the risk for hemorrhage or damage to the collecting system. The location of the tumor in relation to the vasculature is also important to maximize efficacy because the vasculature acts as a “heat sink,” causing dissipation of the thermal energy. Occasionally, stenting of the proximal ureter due to upper tumor location is necessary to prevent thermal injury that could lead to urine leaks.
Selection of the modality to be used primarily depends on operator comfort, which translates to good patient outcomes, such as better cancer control and fewer complications. Cryoablation and RFA have both demonstrated good clinical efficacy and cancer control of 89% and 90%, respectively, with comparable complication rates [22]. There have been no studies performed directly comparing the modalities.
Cryoablation. Cryoablation is performed through the insertion of a probe into the tumor, which may be done through a surgical or percutaneous approach. Once the probe is in place, a high-pressure gas (argon, nitrogen) is passed through the probe and it cools once it enters a lower pressure region. The gas is able to cool to temperatures as low as –185°C. The tissue is then rewarmed through the use of helium, which conversely warms when entering a low pressure area. The process of freezing followed by rewarming subsequently causes cell death/tissue destruction through direct cell injury from cellular dehydration and vascular injury. Clinically, 2 freeze-thaw cycles are used to treat a tumor [23,24].
RFA. Radiofrequency ablation, or RFA, targets tumors via an electrode placed within the mass that produces intense frictional heat from medium-frequency alternating current (approximately 500 kHz) from a connected generator that is grounded on the patient. The thermal energy created causes coagulative necrosis. Due to the reliance on heat for tumor destruction, central lesions are less amenable to this approach because of the “heat sink” effect from the hilum [24].
Microwave ablation. Microwave ablation, like RFA, relies on the generation of frictional heat to cause cell death by coagulative necrosis. In this case, the friction is created through the activation of water molecules; because of the different thermal kinetics involved with microwave ablation, the “heat sink” effect is minimized when treatment is employed near large vessels, in comparison to RFA [24]. The data on this mechanism of ablation are still maturing, with varied outcomes thus far. One study demonstrated outcomes comparable to RFA and cryoablation, with cancer-specific survival of 97.8% at 3 years [25]. However, a study by Castle and colleagues [26] demonstrated higher recurrence rates. The overarching impediment to widespread adoption of microwave ablation is inconclusive data gleaned from studies with small numbers of patients with limited follow up. The role of this modality will need to be revisited.
Irreversible electroporation. Irreversible electroporation (IRE) is under investigation. IRE is a non-thermal ablative technique that employs rapid electrical pulses to create pores in cell membranes, leading to cell death. The postulated benefits of IRE include the lack of an effect from “heat sinks” and less collateral damage to the surrounding tissues, when compared with the thermal modalities. In a human phase 1 study of patients undergoing IRE prior to immediate surgical resection, the procedure appeared feasible and safe [27]. Significant concerns for this method of ablation possibly inducing cardiac arrhythmias, and the resultant need for sedation with neuromuscular blockade and associated electrocardiography monitoring, may impede its implementation in nonresearch settings [24].
Active Surveillance
Due to the more frequent use of imaging for various indications, there has been an increase in the discovery of small renal masses (SRM); 85% of RCC that present in an asymptomatic or incidental manner are tumors under 4 cm in diameter [28,29]. The role of active surveillance is evolving, but is primarily suggested for patients who are not candidates for more aggressive intervention based on comorbidities. A recent prospective, nonrandomized analysis of data from the Delayed Intervention and Surveillance for Small Renal Masses (DISSRM) registry evaluated outcomes for patients with SRM looking at primary intervention compared with active surveillance [30]. The primary intervention selected was at the discretion of the provider; treatments included partial nephrectomy, RFA, and cryoablation, and active surveillance patients were followed with imaging every 6 months. Progression of SRM, with recommendation for delayed intervention, was defined as a growth rate of mass greater than 0.5 cm/year, size greater than 4 cm, or hematuria. Thirty-six of 158 patients on active surveillance met criteria for progression; 21 underwent delayed intervention. Of note, even the patients who progressed but did not undergo delayed intervention did not develop metastatic disease during the follow-up interval. With a median follow up of 2 years, cancer-specific survival was noted to be 99% and 100% at 5 years for primary intervention and active surveillance, respectively. Overall survival at 2 years for primary intervention was 98% and 96% for active surveillance; at 5 years, the survival rates were 92% and 75% (P = 0.06). Of note, 2 patients in the primary intervention arm died of RCC, while none in the active surveillance arm died. As would be expected, active surveillance patients were older, had a worse performance status, and had more comorbidities. Interestingly, 40% of patients enrolled selected active surveillance as their preferred management for SRM. The DISSRM results were consistent with data from the Renal Cell Consortium of Canada and other retrospective reviews [31–33].
• What is the approach to follow-up after treatment of localized RCC?
After a patient undergoes treatment for a localized RCC, the goal is to optimize oncologic outcomes, monitor for treatment sequelae, such as renal failure, and focus on survivorship. At this time, there is no consensus in the literature or across published national and international guidelines with regards to the appropriate schedule for surveillance to achieve these goals. In principle, the greatest risk for recurrence occurs within the first 3 years, so many guidelines focus on this timeframe. Likewise, the route of spread tends to be hematogenous, so patients present with pulmonary, bone, and brain metastases, in addition to local recurrence within the renal bed. Symptomatic recurrences often are seen with bone and brain metastases, and thus bone scans and brain imaging are not listed as part of routine surveillance protocols in asymptomatic patients. Although there is inconclusive evidence that surveillance protocols improve outcomes in RCC, many professional associations have outlined recommendations based on expert opinion [34]. The American Urological Association released guidelines in 2013 and the National Comprehensive Cancer Network (NCCN) released their most recent set of guidelines in 2016 [21,35]. These guidelines use TNM staging to risk-stratify patients and recommend follow up.
Case Continued
CT scan with contrast of the chest, abdomen, and pelvis as well as bone scan are done. CT of the abdomen and pelvis demonstrates a 7.8-cm left renal mass arising from the lower pole of the left kidney. Paraesophageal lymphadenopathy and mesenteric nodules are also noted. CT of the chest demonstrates bilateral pulmonary emboli. Bone scan is significant for increased activity related to the pathological fracture involving the right humerus. The patient undergoes surgery to stabilize the pathologic fracture of his humerus. He is diagnosed with metastatic RCC (clear cell histology) and undergoes palliative debulking nephrectomy.
• How is prognosis defined for metastatic RCC?
Prognostic Models
Limited-stage RCC that is found early can be cured surgically, with estimated 5-year survival rates for stage T1 and T2 disease approaching 90%; however, long-term survival for metastatic disease is poor, with rates ranging from 0% to 20% [13]. Approximately 30% of patients have metastatic disease at diagnosis, and about one-third of patients who have undergone treatment for localized disease experience relapse [36,37]. Common sites of metastases include lung, lymph nodes, bone, liver, adrenal gland, and brain.
Prognostic scoring systems have been developed to define risk groups and assist with determining appropriate therapy in the metastatic setting. The most widely used validated prognostic factor model is that from the Memorial Sloan-Kettering Cancer Center (MSKCC), which was developed using a multivariate analysis derived from data of patients enrolled in clinical trials and treated with interferon alfa [38]. The factors included in the MSKCC model are Karnofsky performance status less than 80, time from diagnosis to treatment with interferon alfa less than 12 months, hemoglobin level less than lower limit of laboratory’s reference range, LDH level greater than 1.5 times the upper limit of laboratory’s reference range, and corrected serum calcium level greater than 10 mg/dL. Risk groups are categorized as favorable (0 risk factors), intermediate (1 to 2 risk factors), and poor (3 or more risk factors) [39]. Median survival for favorable-, intermediate-, and poor-risk patients was 20, 10, and 4 months, respectively [40].
Another prognostic model, the International Metastatic RCC Database Consortium, or Heng, model was developed to evaluate prognosis in patients treated with VEGF-targeted therapy [41]. This model was developed from a retrospective study of patients treated with sunitinib, sorafenib, and bevacizumab plus interferon alfa or prior immunotherapy. Prognostic factors in this model include 4 of the 5 MSKCC risk factors (hemoglobin level, corrected serum calcium level, Karnofsky performance status, and time to initial diagnosis). Additionally, this model includes both absolute neutrophil and platelet counts greater than the upper limit of normal. Risk groups are identified as favorable (0 risk factors), intermediate (1 to 2 risk factors), and poor (3 or more risk factors). Median survival for favorable-, intermediate-, and poor-risk patients were not reached, 27 months, and 8.8 months, respectively. The University of California, Los Angeles scoring algorithm to predict survival after nephrectomy and immunotherapy (SANI) in patients with metastatic RCC is another prognostic model that can be used. This simplified scoring system incorporates lymph node status, constitutional symptoms, metastases location, histology, and thyroid stimulating hormone (TSH) level [42].
The role of debulking or cytoreductive nephrectomy in treatment of metastatic RCC is well established. Large randomized studies have demonstrated a statistically significant medial survival benefit for patients undergoing nephrectomy plus interferon alfa therapy compared with patients treated with interferon alfa alone (13.6 months versus 7.8 months, respectively) [43]. The role of cytoreductive nephrectomy in combination with antiangiogenic agents is less clear. While a retrospective study investigating outcomes of patients with metastatic RCC receiving anti-VEGF agents showed a prolonged survival with nephrectomy, results of large randomized trials are not yet available [44,45]. Patients with lung-only metastases, good prognostic features, and a good performance status are historically the most likely to benefit from cytoreductive surgery.
Case Continued
Based on the MSKCC prognostic factor model, the patient is deemed to be in the intermediate-risk group (Karnofsky performance status of 80, calcium 9.5 mg/dL, LDH 204 U/L, hemoglobin 13.6 g/dL). He is started on treatment for his bilateral pulmonary emboli and recovers well from orthopedic surgery as well as palliative debulking nephrectomy.
• What is the appropriate first-line therapy in managing this patient’s metastatic disease?
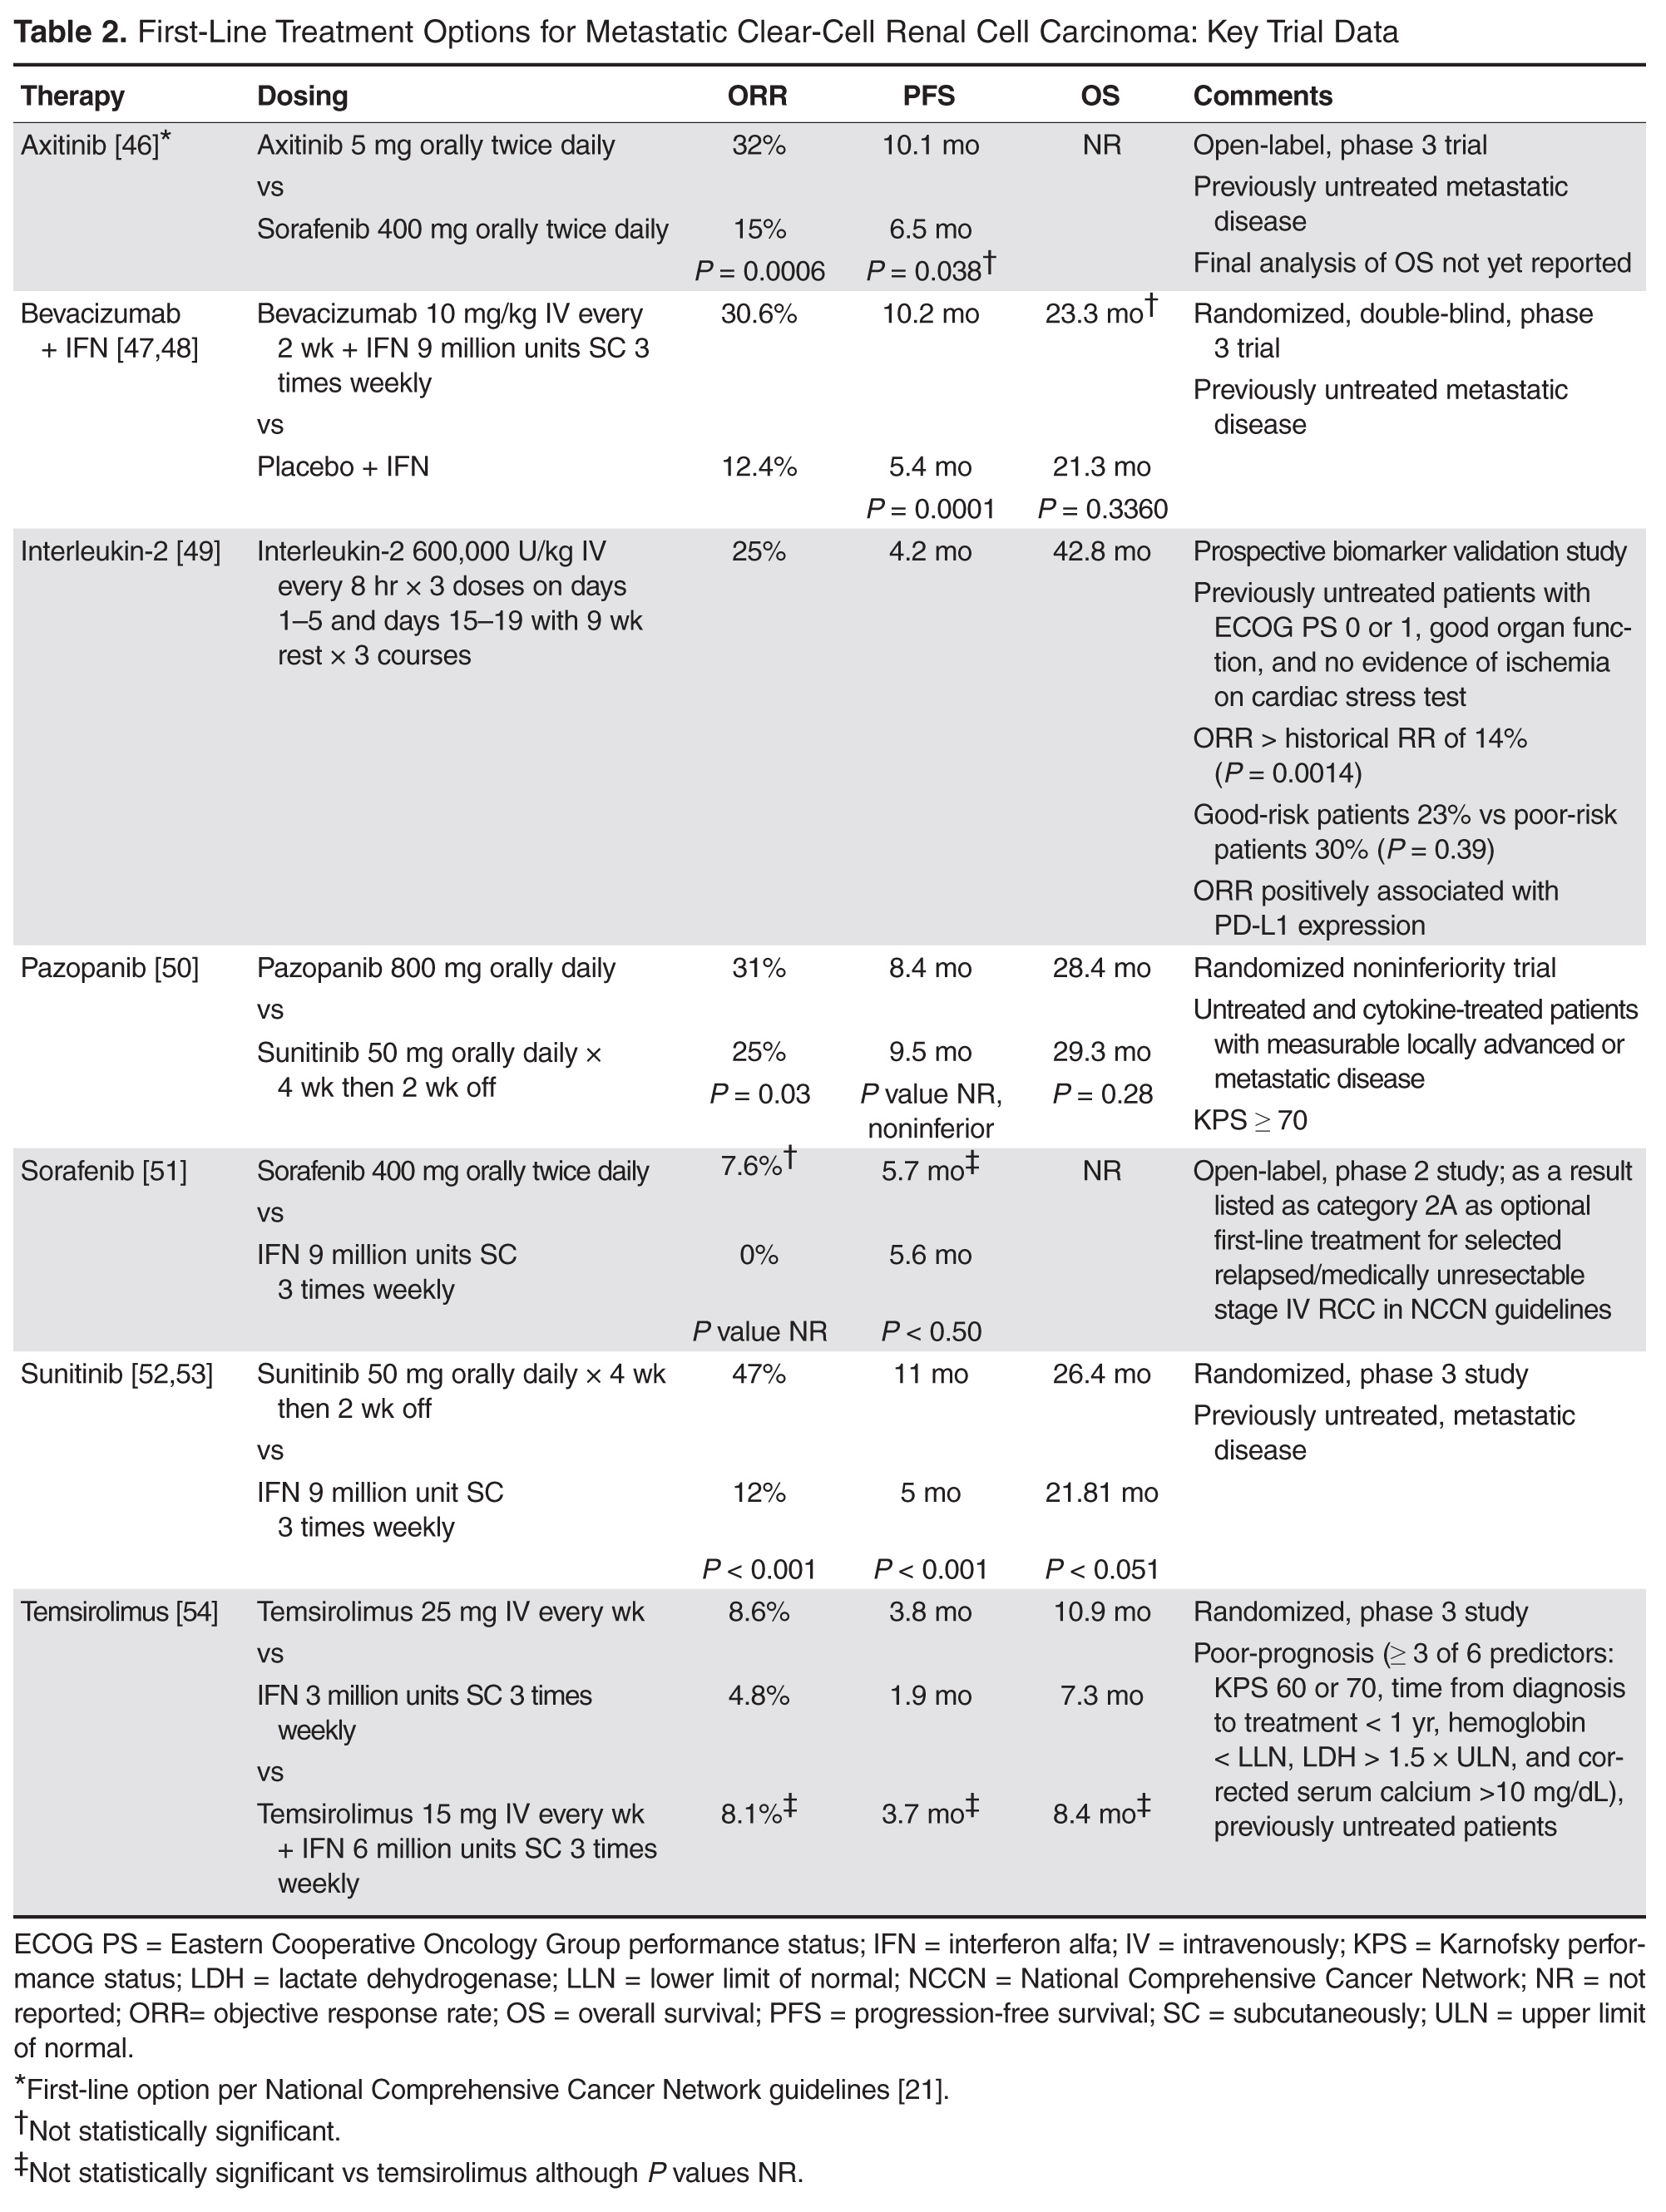
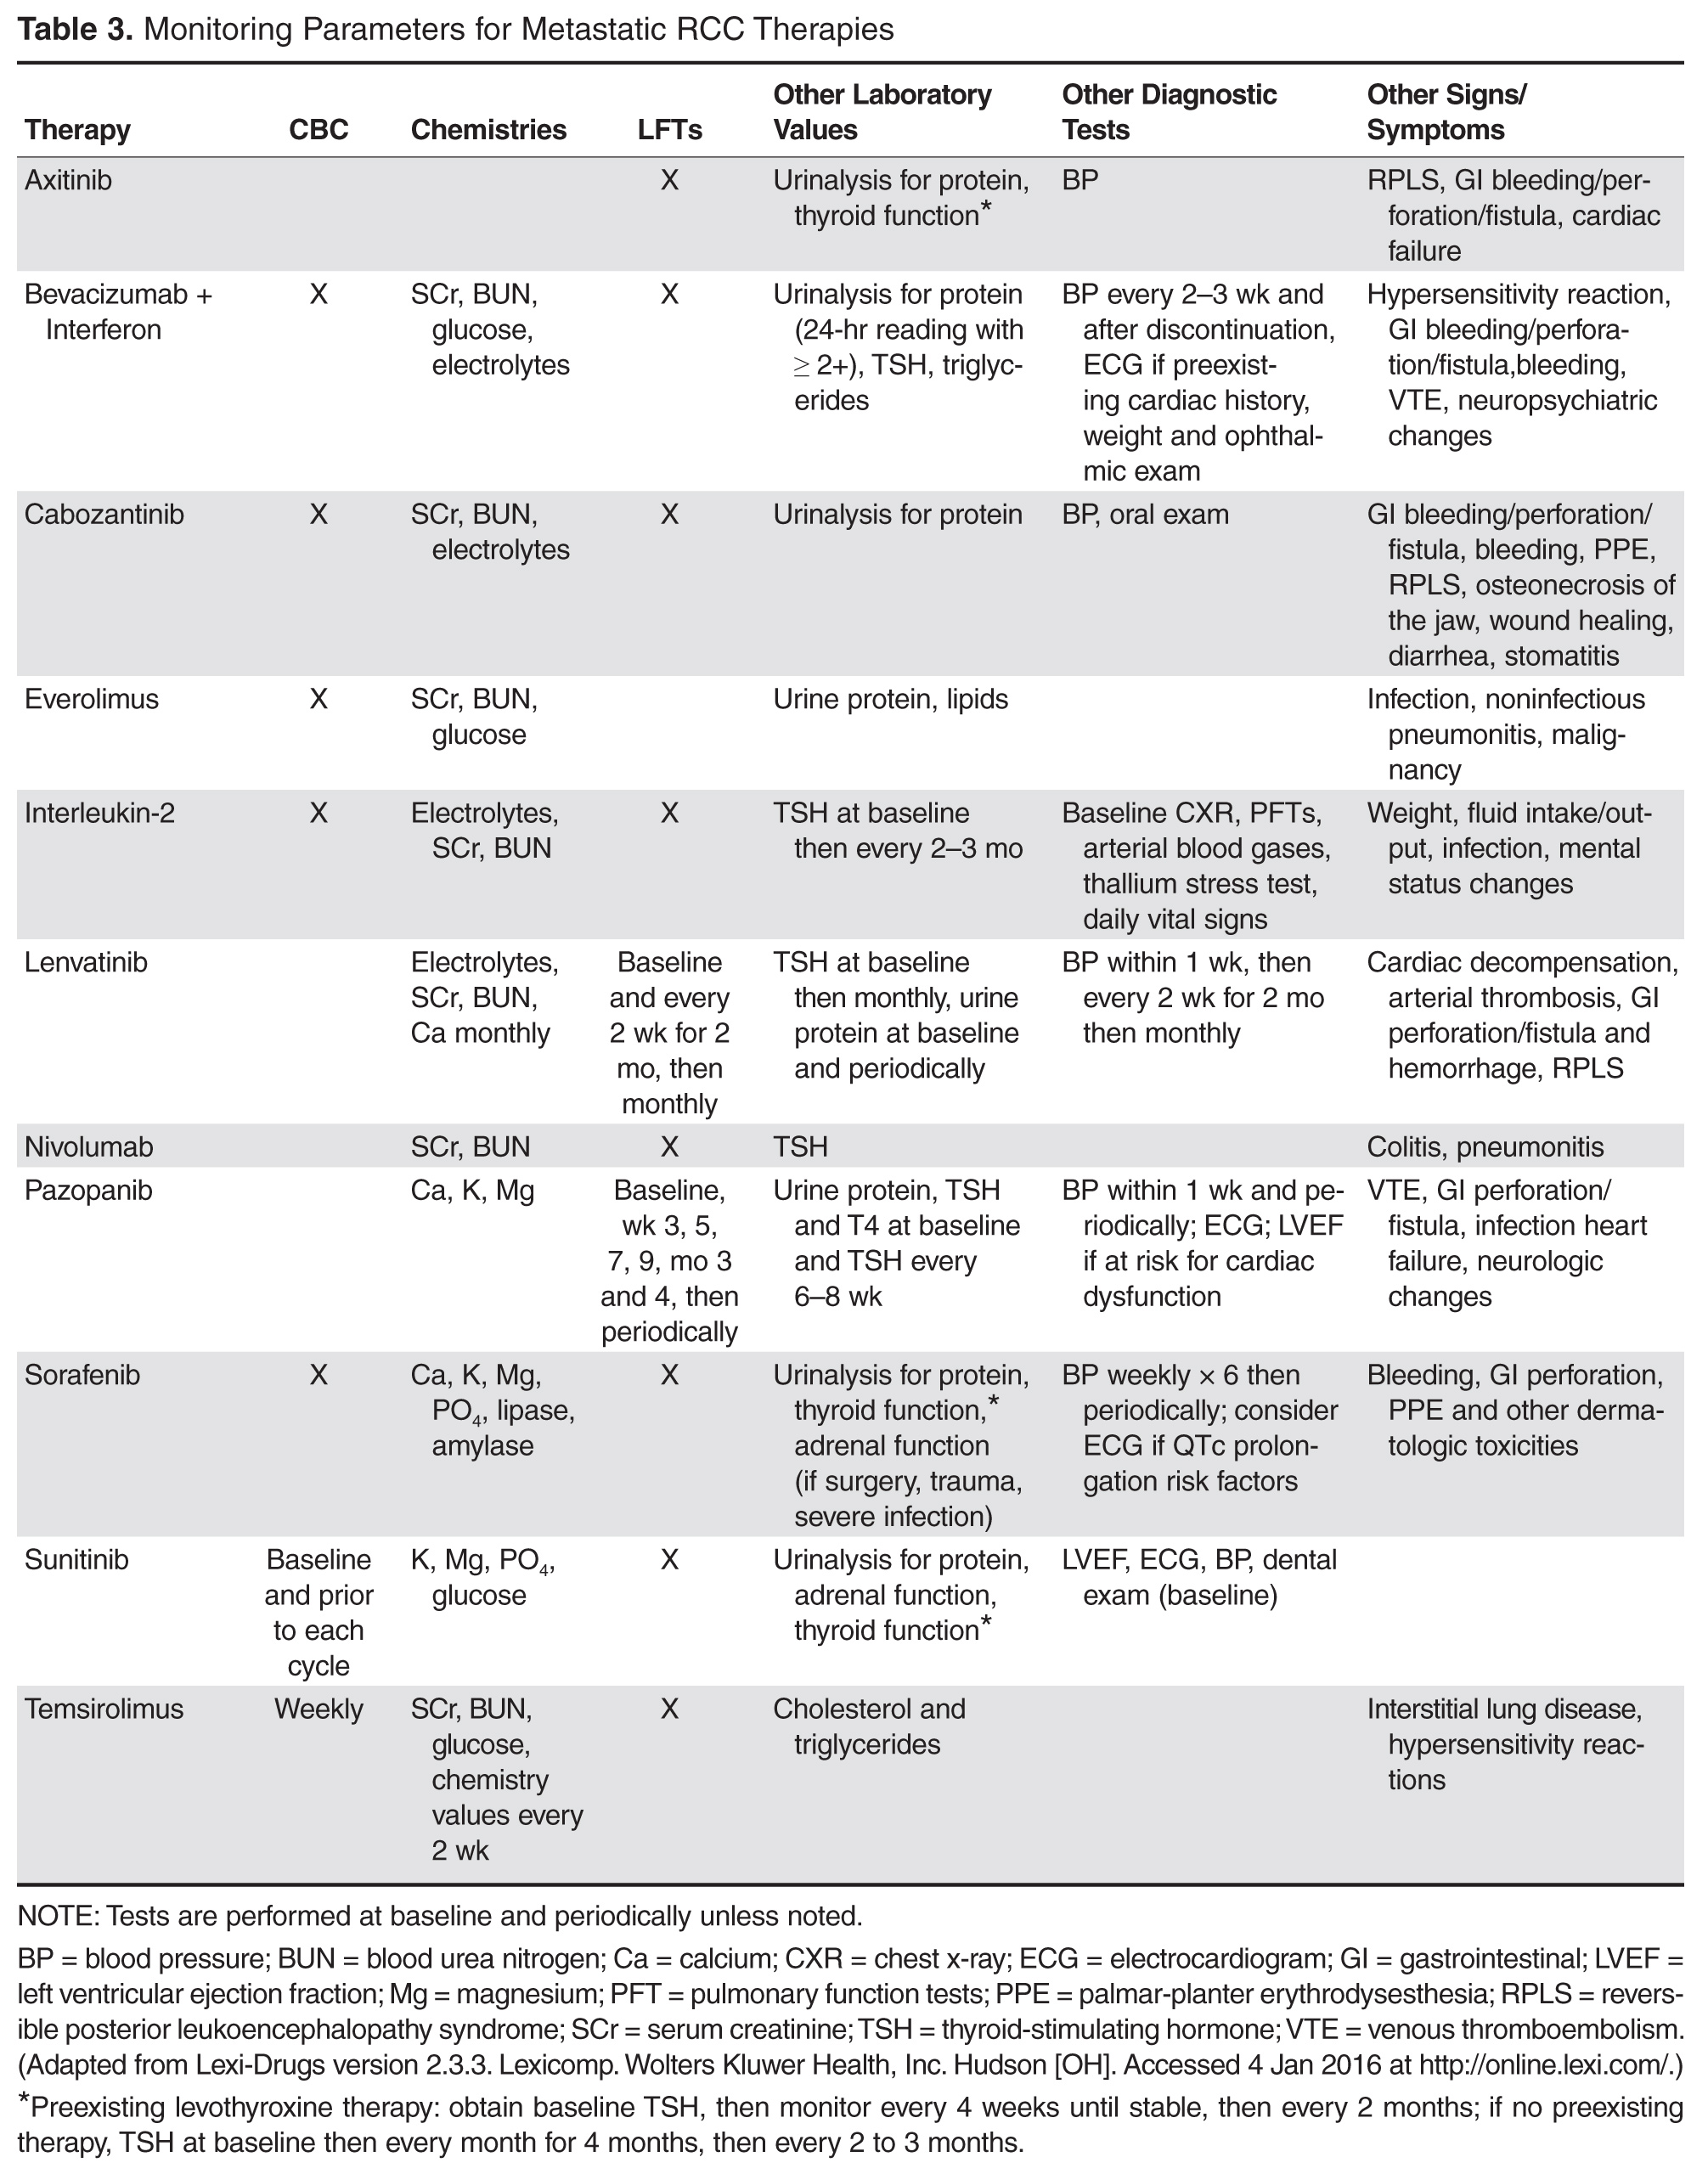
Based on several studies, TKIs seem to be less effective in patients with non–clear-cell type histology [57,58]. In these patients, risk factors can guide therapy. In the ASPEN trial, where 108 patients were randomly assigned to everolimus or sunitinib, patients in the good- and intermediate-risk groups had longer overall and median progression-free survival (PFS) on sunitinib (8.3 months versus 5.3 months, respectively). However, those in the poor-risk group had a longer median overall survival with everolimus [59]. Given that the role of targeted therapies in non–clear-cell RCCs is less well established, enrollment in clinical trials should be considered as a first-line treatment option [21].
Sarcomatoid features can be observed in any of the histologic types of RCC, and RCC with these features has an aggressive course and a poor prognosis. Currently, there is no standard therapy for treatment of patients with metastatic or unresectable RCC with sarcomatoid features [60]. Chemotherapeutic regimens used for soft tissue sarcomas, including a trial of ifosfamide and doxorubicin, did not show any objective response [61]. A small trial of 10 patients treated with doxorubicin and gemcitabine resulted in complete response in 2 patients and partial response in 1 patient [62].
Enrollment in a clinical trial remains a first-line treatment option for these patients. More recently, a phase 2 trial of sunitinib and gemcitabine in patients with sarcomatoid (39 patients) and/or poor-risk (33 patients) metastatic RCC showed overall response rates (ORR) of 26% and 24%, respectively. A higher clinical benefit rate (defined as ORR plus stable disease) was seen in patients with tumors containing more than 10% sarcomatoid histology, as compared with patients whose tumors contained less than 10% sarcomatoid histology. Neutropenia (n = 20), anemia (n = 10), and fatigue (n = 7) were the most common grade 3 toxicities seen in all the patients. Although this was a small study, the results showed a trend towards better efficacy of the combination therapy as compared with the single-agent regimen. Currently, another study is underway to further investigate this in a larger group of patients [63].
Biologics
Cytokine therapy, including high-dose IL-2 and interferon alfa, had long been the only first-line treatment option for patients with metastatic or unresectable RCC. Studies of high-dose IL-2 have shown an ORR of 25% and durable response in up to 11% of patients with clear-cell histology [64]. Toxicities were similar to those previously observed with high-dose IL-2 treatment; the most commonly observed grade 3 toxicities were hypotension and capillary leak syndrome. IL-2 requires strict monitoring (Table 3). It is important to note that retrospective studies evaluating the safety and efficacy of using IL-2 as second-line treatment in patients previously treated with TKIs demonstrated significant toxicity without achieving partial or complete response in any of the patients [65].
Prior to the advent of TKIs in the treatment of RCC, interferon alfa was a first-line treatment option for those who could not receive high-dose IL-2. It has been shown to produce response rates of approximately 20%, with maximum response seen with a higher dose range of 5 to 20 million units daily in 1 study [66,67]. However, with the introduction of TKIs, which produce a higher and more durable response, interferon alfa alone is no longer recommended as a treatment option.
VEGF Monoclonal Antibodies
Bevacizumab is a recombinant humanized monoclonal antibody that binds and neutralizes VEGF-A. Given overexpression of VEGF in RCC, the role of bevacizumab both as a single agent and in combination with interferon alfa has been investigated. In a randomized phase 2 study involving patients with cytokine-refractory disease, bevacizumab produced a 10% response rate and PFS of 4.8 months compared to patients treated with placebo [68]. In the AVOREN trial, the addition of bevacizumab (10 mg/kg intravenously [IV] every 2 weeks) to interferon alfa (9 million units subcutaneously [SQ] 3 times weekly) was shown to significantly increase PFS compared with interferon alfa alone (10.2 months versus 5.4 months; P = 0.0001) [47,48]. Adverse effects of this combination therapy include fatigue and asthenia. Additionally, hypertension, proteinuria, and bleeding occurred.
Tyrosine Kinase Inhibitors
TKIs have largely replaced IL-2 as first-line therapy for metastatic RCC. Axitinib, pazopanib, sorafenib, and sunitinib and can be used as first-line therapy. All of the TKIs can be used as subsequent therapy.
Sunitinib. Sunitinib is an orally administered TKI that inhibits VEGF receptor (VEGFR) types 1 and 2, PDGF receptors (PDGFR) α and β, stem cell factor receptor (c-Kit), and FLT-3 and RET kinases. Motzer and colleagues [52,53] compared sunitinib 50 mg daily orally for 4 weeks with 2 weeks off to the then standard of care, interferon alfa 9 million units SQ 3 times weekly. Sunitinib significantly increased the overall objective response rate (47% versus 12%; P < 0.001), PFS (11 versus 5 months; P < 0.001), and overall survival (26.4 versus 21.8 months; hazard ratio [HR], 0.821). The most common side effects are diarrhea, fatigue, nausea/vomiting, anorexia, hypertension, stomatitis, and hand-foot syndrome, occurring in more than 30% of patients. Often patients will require dose reductions or temporary discontinuations to tolerate therapy. Alternative dosing strategies (eg, 50 mg dose orally daily for 2 weeks alternating with 1-week free interval) have been attempted but not prospectively evaluated for efficacy [69–71].
Pazopanib. Pazopanib is an oral multi-kinase inhibitor of VEGFR types 1 and 2, PDGFR, and c-KIT. Results of a phase 3 trial comparing pazopanib (800 mg orally daily) to placebo favored the TKI, with a PFS of 9.2 months versus 4.2 months. A subset of treatment-naïve patients had a longer PFS of 11.1 versus 2.8 months and a response rate of 32% versus 4% [72]. This led to a noninferiority phase 3 trial comparing pazopanib with sunitinib as first-line therapy [50]. In this study, PFS was similar (8.4 versus 9.5 months; HR 1.05), and overall safety and quality-of-life endpoints favored pazopanib. Much less fatigue, stomatitis, hand-foot syndrome, and thrombocytopenia occurred with pazopanib, whereas hair color changes, weight loss, alopecia, and elevations of LFT enzymes occurred more frequently with pazopanib. Hypertension is common with the administration of pazopanib as well.
Sorafenib. Sorafenib is an orally administered inhibitor of Raf, serine/threonine kinase, VEGFR, PDGFR, FLT-3, c-Kit, and RET. The pivotal phase 3 Treatment Approaches in Renal Cancer Global Evaluation Trial (TARGET) compared sorafenib (400 mg orally twice daily) with placebo in patients who had progressed on prior cytokine-based therapy [73]. A final analysis, which excluded patients who were allowed to cross over therapies, found improved overall survival times (14.3 versus 1.8 months, P = 0.029) [51]. Sorafenib is associated with lower rates of diarrhea, rash, fatigue, hand-foot syndrome, alopecia, hypertension, and nausea than sunitinib, although these agents have not been compared to one another.
Axitinib. Axitinib is an oral inhibitor of VEGFRs 1, 2, and 3. Results of the phase 3 AXIS trial comparing axitinib (5 mg orally twice daily) with sorafenib (400 mg orally twice daily) in patients receiving one prior systemic therapy showed axitinib was more active than sorafenib in improving ORR (19% versus 9%; P = 0.001) and PFS (6.7 versus 4.7 months; P < 0.001), although no difference in overall survival times was noted [74]. In a subsequent phase 3 trial comparing these drugs in the first-line setting, axitinib showed a nonsignificantly higher response rate and PFS. Despite this, the National Comprehensive Cancer Network guidelines consider axitinib an acceptable first-line therapy because activity with acceptable toxicity was demonstrated (Table 2) [46]. The most common adverse effects of axitinib are diarrhea, hypertension, fatigue, decreased appetite, dysphonia, hypothyroidism, and upper abdominal pain.
Cabozantinib
Given that resistance eventually develops in most patients treated with standard treatments, including bevacizumab and TKIs, the need to evaluate the safety and efficacy of novel agents targeting VEGFR and overcoming this resistance is of vital importance. Cabozantinib is an oral small-molecule inhibitor of VEGFR, Met, and Axl, all tyrosine kinases implicated in metastatic RCC. Overexpression of Met and Axl, which occurs as a result of inactivation of the VHL gene, is associated with a poor prognosis in patients with RCC. In a randomized, open label, phase 3 trial of cabozantinib versus everolimus in advanced RCC, Choueiri and colleagues [75] compared the efficacy of cabozantinib with everolimus in patients with metastatic RCC who had progressed on previous VEGFR-targeted therapies. In this study, 658 patients were randomly assigned to receive cabozantinib (60 mg orally daily) or everolimus (10 mg orally daily). Results of the study found that PFS was longer with cabozantinib in patients who had previously been treated with other TKIs (median PFS of 7.4 months versus 3.8 months; HR 0.58), corresponding to a 42% reduction in the rate of disease progression or death. The most common grade 3 and 4 toxicities seen with cabozantinib were similar to its class effect and consisted of hypertension, diarrhea, and fatigue. In the final analysis of the data, the median overall survival was 21.4 months (95% CI 18.7–not estimable) with cabozantinib and 16.5 months (95% CI 14.7 to 18.8) with everolimus (HR 0.66; 95% CI 0.53 to 0.83; P = 0.00026). The median follow-up for overall survival and safety was 18.7 months. These results highlight the importance of cabozantinib as a first line option in treatment of previously treated patients with advanced RCC [76].
mTOR Inhibitors
The mTOR inhibitors, temsirolimus and everolimus, are also approved for the treatment of metastatic or advanced RCC. These drugs block mTOR’s phosphorylation and subsequent translation of mRNA to inhibit cell proliferation, cell growth, and angiogenesis [77]. Temsirolimus can be used as first-line therapy for patients with a poor prognosis, and everolimus is appropriate as a subsequent therapy.
Temsirolimus is an intravenous prodrug of rapamycin. It was the first of the class to be approved for metastatic RCC for treatment-naïve patients with a poor prognosis (ie, at least 3 of 6 predictors of poor survival based on MSKCC model) [54]. The pivotal ARCC trial compared temsirolimus (25 mg IV weekly) alone, interferon alfa (3 million units SQ 3 times weekly) alone, or the combination (temsirolimus 15 mg IV weekly plus interferon alfa 6 million units SQ 3 times weekly). In this trial, temsirolimus monotherapy produced a significantly longer overall survival time than interferon alfa alone (10.9 versus 7.3 months; P = 0.008) and improved PFS time when administered alone or in combination with interferon alfa (3.8 and 3.7 months, respectively, versus 1.9 months). Because no real efficacy advantage of the combination was demonstrated, temsirolimus is administered alone. The most common adverse effects of temsirolimus are asthenia, rash, anemia, nausea, anorexia, pain, and dyspnea. Additionally, hyperglycemia, hypercholesterolemia, and hyperlipidemia occur with these agents. Noninfectious pneumonitis is a rare but often fatal complication.
Everolimus is also an orally administered derivative of rapamycin that is approved for use after failure of VEGF-targeted therapies. The results of the landmark trial RECORD-1 demonstrated that everolimus (10 mg orally daily) is effective at prolonging PFS (4 versus 1.9 months; P < 0.001) when compared with best supportive care, a viable treatment option at the time of approval [78]. The most common adverse effects of everolimus are stomatitis, rash, fatigue, asthenia, and diarrhea. As with temsirolimus, elevations in glucose, lipids, and triglycerides and noninfectious pneumonitis can occur.
TKI + mTOR Inhibitor
Lenvatinib is also a small molecule targeting multiple tyrosine kinases, primarily VEGF2. Combined with the mTOR inhibitor, everolimus, it has been shown to be an effective regimen in patients with metastatic RCC who have failed other therapies. In a randomized phase 2 study involving patients with advanced or metastatic clear-cell RCC, patients were randomly assigned to receive either lenvatinib (24 mg/day), everolimus (10 mg/day), or lenvatinib plus everolimus (18 mg/day and 5 mg/day, respectively). Patients received the treatment continuously on a 28-day cycle until progression or inability to tolerate toxicity. Patients in the lenvatinib plus everolimus arm had median PFS of 14.6 months (95% CI 5.9 to 20.1) versus 5.5 months (95% CI 3.5 to 7.1) with everlolimus alone (HR 0.40; 95% CI 0.24 to 0.68; P = 0.0005). PFS with levantinib alone was 7.4 months (95% CI 5.6 to 10.20; HR 0.66, 95% CI 0.30 to 1.10, P = 0.12). In addition, PFS with levantinib alone was significantly prolonged in comparison with everolimus alone (HR 0.61; 95% CI 0.38 to 0.98; P = 0.048). Grade 3 or 4 toxicity were less frequent in the everolimus only arm and the most common grade 3 or 4 toxicity in the lenvatinib plus everolimus arm was diarrhea. The results of this study show that the combination of lenvatinib plus everolimus is an acceptable second-line option for treatment of patients with advanced or metastatic RCC [55].
Case Continued
The patient is initially started on pazopanib and tolerates the medication well, with partial response to the treatment. However, on restaging scans he is noted to have small bowel perforation. Pazopanib is discontinued until the patient has a full recovery. He is then started on everolimus. Restaging scans done 3 months after starting everolimus demonstrate disease progression.
• What is the appropriate next step in treatment?
PD1 Blockade
Programmed death 1 (PD-1) protein is a T-cell inhibitory receptor with 2 ligands, PD-L1 and PD-L2. PD-L1 is expressed on many tumors. Blocking the interaction between PD-1 and PD-L1 by anti-PD-1 humanized anti-bodies potentiates a robust immune response and has been a breakthrough in the field of cancer immunotherapy [79]. Previous studies have demonstrated that overexpression of PD-L1 leads to worse outcomes and poor prognosis in patients with RCC [80]. Nivolumab, a fully human IgG4 PD-1 immune checkpoint inhibitor, blocks the interaction between PD-1 and its ligands, PD-L1 and PD-L2. In a randomized, open-label, phase 3 study comparing nivolumab with everolimus in patients with RCC who had previously undergone treatment with other standard therapies, Motzer and colleagues [81] demonstrated a longer overall survival time and fewer adverse effects with nivolumab. In this study, 821 patients with clear-cell RCC were randomly assigned to receive nivolumab (3 mg/kg of body weight IV every 2 weeks) or everolimus (10 mg orally once daily). The median overall survival time with nivolumab was 25 months versus 19.6 months with everolimus (P < 0.0148). Nineteen percent of patients receiving nivolumab experienced grade 3 or 4 toxicities, with fatigue being the most common adverse effect. Grade 3 or 4 toxicities were observed in 37% of patients treated with everolimus, with anemia being the most common. Based on the results of this trial, on November 23, 2015, the U.S. Food and Drug Administration approved nivolumab to treat patients with metastatic RCC who have received a prior antiangiogenic therapy.
Case Conclusion
Both TKI and mTOR inhibitor therapy fail, and the patient is eligible for third-line therapy. Because of his previous GI perforation, other TKIs are not an option. The patient opts for enrollment in hospice due to declining performance status. For other patients in this situation with a good performance status, nivolumab would be a reasonable option.
Future Directions
With the approval of nivolumab, multiple treatment options are now available for patients with metastatic or unresectable RCC. Development of other PD-1 inhibitors and immunotherapies as well as multi-targeted TKIs will only serve to expand treatment options for these patients. Given the aggressive course and poor prognosis of non-clear cell renal cell tumors and those with sarcomatoid features, evaluation of systemic and targeted therapies for these subtypes should remain active areas of research and investigation.
Corresponding author: Jessica Clement, MD, UConn Health, 263 Farmington Avenue, Farmington, CT 06030, [email protected].
Financial disclosures: None.
1. Siegel R, Miller, K, Jemal A. Cancer Statistics, 2015. CA Cancer J Clin 2015;65:5–29.
2. Eble JN, Sauter G, Epstein JI, Sesterhenn IA. Pathology and genetics. Tumors of the urinary system and male genital organs. Lyon: IARC Press; 2004.
3. Chow WH, Gridley G, Fraumeni JF Jr, Jarvholm B. Obesity, hypertension, and the risk of kidney cancer in men. N Engl J Med 2000;343:1305–11.
4. Cohen H, McGovern F. Renal-cell carcinoma. N Engl J Med 2005;353:2477–90
5. Yao M, Yoshida M, Kishida T, et al. VHL tumor suppres sor gene alterations associated with good prognosis in sporadic clear-cell renal carcinoma. J Natl Cancer Inst 2002;94:1569–75.
6. Iliopoulos O, Kibel A, Gray S, Kaelin WG Jr. Tumour suppression by the human von Hippel-Lindau gene product. Nat Med 1995;1:822–6
7. Chen F, Kishida T, Duh FM, et al. Suppression of growth of renal carcinoma cells by the von Hippel-Lindau tumor suppressor gene. Cancer Res 1995;55:4804–7.
8. Iliopoulos O, Levy AP, Jiang C, et al. Negative regulation of hypoxia-inducible genes by the von Hippel Lindau protein. Proc Natl Acad Sci U S A 1996;93:10595–9.
9. Nickerson ML, Warren MB, Toro JR, et al. Mutations in a novel gene lead to kidney tumors, lung wall defects, and benign tumors of the hair follicle in patients with the Bir- Hogg-Dube syndrome. Cancer Cell 2002;2:157–64
10. Shuch B, Vorganit S, Ricketts CJ, et al. Defining early-onset kidney cancer: implications for germline and somatic mutation testing and clinical management. J Clin Oncol 2014;32:431–7.
11. Bukowski RM. Immunotherapy in renal cell carcinoma. Oncology 1999;13:801–10.
12. Mueller-Lisse UG, Mueller-Lisse UL. Imaging of advanced renal cell carcinoma. World J Urol 2010;28:253–61.
13. Edge SB, Byrd DR, Compton CC, et al, eds. AJCC cancer staging manual, 7th ed. New York: Springer Science and Business Media LLC; 2010.
14. O’Malley RL, Godoy G, Kanofsky JA, Taneja SS. The necessity of adrenalectomy at the time of radical nephrectomy: a systematic review. J Urol 2009;181:2009–17.
15. McDougal S, Wein AJ, Kavoussi LR, et al. Campbell-Walsh Urology. 10th ed. Philadelphia (PA): Saunders; 2012.
16. Colombo JR Jr, Haber GP, Kelovsek JE, et al. Seven years after laparoscopic radical nephrectomy: oncologic and renal functional outcomes. Urology 2008:71:1149–54.
17. Ferlay J, Steliarova-Foucher E, Lortet-Tieulent J, et al. Cancer incidence and mortality patterns in Europe: estimates for 40 countries in 2012. Eur J Ca 2013;49:1374–403.
18. Weight CJ, Larson BT, Fergany AF, et al. Nephrectomy induced chronic renal insufficiency is associated with increased risk of cardiovascular death and death from any cause in patients with localized cT1b renal masses. J Urol 2010;183:1317–23.
19. Van Poppel H, Da Pozzo L, Albrecht W, et al. A prospective, randomized EORTC intergroup phase 3 study comparing the oncologic outcome of elective nephron-sparing surgery and radical nephrectomy for low-stage renal cell carcinoma. Eur Urol 2011;59:543–52.
20. Smaldone MC, Fung C, Uzzo RG, Hass NB. Adjuvant and neoadjuvant therapies in high-risk renal cell carcioma. Hematol Oncol Clin North Am 2011;25:765–91.
21. NCCN clinical practice guidelines in oncology. Version 3.2016. www.nccn.org. Accessed July 13, 2016
22. El Dib R, Touma NJ, Kapoor A. Cryoablation vs radiofrequency ablation for the treatment of renal cell carcinoma: a meta-amalysis of case series studies. BJU Int 2012;110:510–6.
23. Theodorescu D. Cancer cryotherapy: evolution and biology. Rev Urol 2004;6 Suppl 4:S9–S19.
24. Khiatani V, Dixon RG. Renal ablation update. Sem Intervent Radiol 2014;31:157–66.
25. Yu J, Liang P, Yu XL, et al. US-guided percutaneous microwave ablation of renal cell carcinoma: intermediate-term results. Radiol 2012;263:900–8.
26. Castle SM, Salas N, Leveillee RJ. Initial experience using microwave ablation therapy for renal tumor treatment: 18- month follow-up. Urology 2011;77:792–7.
27. Pech M, Janitzky A, Wendler JJ, et al. Irreversible electroporation of renal cell carcinoma: a first-in-man phase I clinical study. Cardiovasc Intervent Radiol 2011;34:132–8.
28. Chow WH, Devesa SS, Warren JL, Fraumeni JF Jr. Rising incidence of renal cell cancer in the United States. JAMA 1999;281:1628–31.
29. Jayson M, Sanders H. Increased incidence of serendipitously discovered renal cell carcinoma. Urology 1998;51:203–5.
30. Pierorazio PM, Johnson MH, Ball MW, et al. Five-year analysis of a multi-institutional prospective clinical trial of delayed intervention and surveillance for small renal masses: the DISSRM registry. Eur Urol 2015;68:408–15.
31. Jewett MA, Mattar K, Basiuk J, et al. Active surveillance of small renal masses: progression patterns of early stage kidney cancer. Eur Urol 2011;60:39–44.
32. Chawla SN, Crispen PL, Hanlon AL, et al. The natural history of observed enhancing renal masses: meta-analysis and review of the world literature. J Urol 2006;175:425–31.
33. Smaldone MC, Kutikov A, Egleston BL, et al. Small renal masses progressing to metastases under active surveillance: a systematic review and pooled analysis. Cancer 2012;118:997–1006.
34. Williamson TJ, Pearson JR, Ischia J, et al.Guideline of guidelines: follow-up after nephrectomy for renal cell carcinoma. BJU Int 2016;117:555–62.
35. Donat S, Diaz M, Bishoff JT, et al. Follow-up for clinically localized renal neoplasms: AUA Guideline. J Urol 2013;190:407–16.
36. Janzen NK, Kim HL, Figlin RA, Bell-degrun AS. Surveillance after radical or partial nephrectomy for localized renal cell carcinoma and management of recurrent disease. Urol Clin North Am 2003:30:843–52.
37. Gupta K, Miller JD, Li JZ, Russell MW, Charbonneau C. Epidemiologic and socio-economic burden of metastatic renal cell carcinoma (mRCC): a literature review. Cancer Treat Rev 2008;34:193–205.
38. Mekhail T, Abou-Jawde R, Boumerhi G, et al. Validation and extension of the Memorial Sloan-Kettering Prognostic Factors Model for Survival in patients with previously untreated metastatic renal cell carcinoma. J Clin Oncol 2005;23: 832–41.
39. Motzer RJ, Bacik J, Murphy BA, et al. Interferon-alfa as a comparative treatment for clinical trials of new therapies against advanced renal cell carcinoma. J Clin Oncol 2002;20:289–96.
40. Motzer RJ, Mazumdar M, Bacik J, et al. Survival and prognostic stratification of 670 patients with advanced renal cell carcinoma. J Clin Oncol 1999;17:2530–40.
41. Heng DY, Xie W, Regan MM. Prognostic factors for overall survival in patients with metastatic renal cell carcinoma treated with vascular endothelial growth factor-targeted agents: results from a large, multicenter study. J Clin Oncol 2009;27:5794–9.
42. Leibovich BC, Han KR, Bui MH, et al. Scoring algorithm to predict survival after nephrectomy and immunotherapy in patients with metastatic renal cell carcinoma: A stratification tool for prospective clinical trials. Cancer 2003;98:2566–77.
43. Flanigan RC, Mickisch G, Sylvester R, et al. Cytoreductive nephrectomy in patients with metastatic renal cancer: a combined analysis. J Urol 2004;171:1071–6.
44. Choueiri TK, Xie W, Kollmannsberger C, et al. The impact of cytoreductive nephrectomy on survival of patients with metastatic renal cell carcinoma receiving vascular endothelial growth factor targeted therapy. J Urol 2011;185:60–6.
45. Chapin BF, Delacroix SE Jr, Culp SH, et al. Safety of presurgical targeted therapy in the setting of metastatic renal cell carcinoma. Eur Urol 2011;60:964–71.
46. Hutson TE, Lesovoy V, Al-Shukri S, et al. Axitinib versus sorafenib as first-line therapy in patients with metastatic renal-cell carcinoma: a randomized open-label phase 3 trial. Lancet Oncol 2013;14:1287–94.
47. Escudier B, Pluzanska A, Koralewski P, et al. Bevacizumab plus interferon alfa-2a for treatment of metatastic renal cell carcinoma: a randomized, double-blind phase III trial. Lancet 2007;370:2103–11.
48. Escudier B, Bellmunt J, Negrier S, et al. Phase III trial of bevacizumab plus interferon alfa-2a in patients with metastatic renal cell carcinoma (AVOREN): final analysis of overall survival. J Clin Oncol 2010;28:2144–50.
49. McDermott DF, Cheng SC, Signoretti S, et al. The high-dose aldesleukin “select”trial: a trial to prospectively validate predictive models of response to treatment in patients with metastatic renal cell carcinoma. Clin Cancer Res 2015;21:561–8.
50. Motzer RJ, Hutson TE, Cella D, et al. Pazopanib versus sunitinib in metastatic renal-cell carcinoma. N Engl J Med 2013;369:722–31.
51. Escudier B, Eisen T, Stadler WM, et al. Sorafenib for treatment of renal cell carcinoma: final efficacy and safety results of the phase III treatment approaches in renal cell global evaluation trial. J Clin Oncol 2009;27:3312–8.
52. Motzer RJ, Hutson TE, Tomczak P, et al. Sunitinib versus interferon alfa in metastatic renal-cell carcinoma. N Engl J Med 2007;356:115–24.
53. Motzer RJ, Hutson TE, Tomczak P, et al. Overall survival and updated results for sunitinib compared with interferon alfa in patients with metastatic renal cell carcinoma. J Clin Oncol 2009;27:3584–90.
54. Hudes G, Carducci M, Tomczak P, et al. Temsirolimus, interferon alfa, or both for advanced renal-cell carcinoma. N Engl J Med 2007;356:2271–81.
55. Motzer RJ, Hutson TE, Glen H, et al. Lenvatinib, everolimus and the combination in patients with metastatic renal cell carcinoma: a randomized, phase 2, open label, multicenter trial. Lancet Oncology 2015;16:1473–82.
56. Lexi-Comp, Inc. (Lexi-Drugs® ). Lexi-Drugs version 2.3.3. Lexicomp. Wolters Kluwer Health, Inc. Hudson, OH.
57. Choueiri TK, Plantade A, Elson P, et al. Efficacy of sunitinib and sorafenib in metastatic papillary and chromophobe renal cell carcinoma. J Clin Oncol 2008;26:127–31.
58. Lee JL, Ahn JH, Lim HY, et al. Multicenter phase II study of sunitinib in patients with non-clear cell renal cell carcinoma. Ann Oncol 2012;23:2108–14.
59. Armstrong AJ, Broderick S, Eisen T, et al. Final clinical results of a randomized phase II international trial of everolimus vs. sunitinib in patients with metastatic non-clear cell renal cell carcinoma (ASPEN). ASCO Meeting Abstracts 2015;33:4507.
60. Chowdhury S, Matrana MR, Tsang C, et al. Systemic therapy for metastatic non-clear-cell renal cell carcinoma: recent progress and future directions. Hematol Oncol Clin North Am 2011;25:853–69.
61. Escudier B, Droz JP, Rolland F, et al. Doxorubicin and ifosfamide in patients with metastatic sarcomatoid renal cell carcinoma: a phase II study of the Genitourinary Group of the French Federation of Cancer Centers. J Urol 2002; 168–71
62. Nanus DM, Garino A, Milowsky MI, et al. Active chemotherapy for sarcomatoid and rapidly progressing renal cell carcinoma. Cancer 2004;101:1545–51.
63. Michaelson MD, McKay RR, Werner L, et al. Phase 2 trial of sunitinib and gemcitabine in patients with sarcomatoid and/or poor-risk metastatic renal cell carcinoma. Cancer 2015;121:3435–43.
64. McDermott DF, Cheng SC, Signoretti S, et al. The high-dose aldesleukin “select”trial: a trial to prospectively validate predictive models of response to treatment in patients with metastatic renal cell carcinoma. Clin Cancer Res 2015;21:561–8
65. Cho DC, Puzanov I, Regan MM, et al. Retrospective analysis of the safety and efficacy of interleukin-2 after prior VEGF-targeted therapy in patients with advanced renal cell carcinoma. J Immunother 2009;32:181–5.
66. Pyrhönen S, Salminen E, Ruutu M, et al. Prospective randomized trial of interferon alfa-2a plus vinblastine versus vinblastine alone in patients with advanced renal cell cancer. J Clin Oncol 1999;17:2859–67.
67. Interferon-alpha and survival in metastatic renal carcinoma: early results of a randomised controlled trial. Medical Research Council Renal Cancer Collaborators. Lancet 1999;353:14–7.
68. Yang JC, Haworth L, Sherry RM, et al. A randomized trial of bevacizumab, an anti-vascular endothelial growth factor antibody, for metastatic renal cancer. N Engl J Med 2003;349:427–34.
69. Atkinson BJ, Kalra S, Wang X, et al. Clinical outcomes for patients with metastatic renal cell carcinoma treated with alternative sunitinib schedules. J Urol 2014;191:611–8.
70. Kollmannsberger C, Bjarnason G, Burnett P, et al. Sunitinib in metastatic renal cell carcinoma: recommendations for management of noncardiovascular toxicities. Oncologist 2011;16:543–53.
71. Najjar YG, Mittal K, Elson P, et al. A 2 weeks on and 1 week off schedule of sunitinib is associated with decreased toxicity in metastatic renal cell carcinoma. Eur J Cancer 2014;50:1084–9.
72. Sternberg CN, Davis ID, Mardiak J, et al. Pazopanib in locally advanced or metastatic renal cell carcinoma: results of a randomized phase III trial. J Clin Oncol 2010;28:1061–8.
73. Escudier B, Eisen T, Stadler WM, et al. Sorafenib in advanced clear-cell renal-cell carcinoma. N Engl J Med 2007;356:125–34
74. Rini BI, Escudier B, Tomczak P, et al. Comparative effectiveness of axitinib versus sorafenib in advanced renal cell carcinoma (AXIS): a randomised phase 3 trial. Lancet 2011;378:1931–9.
75. Choueiri TK, Escudier B, Powles T, et al. Cabozantinib versus everolimus in advanced renal-cell carcinoma. N Engl J Med 2015;373:1814–23.
76. Choueiri TK, Escudier B, Powles T, et al. Cabozantinib versus everolimus in advanced renal cell carcinoma (METEOR) final results from a randomized, open-label, phase 3 trial. Lancet Oncology 2016;17:917–27.
77. Bjornsti MA, Houghton PJ. The TOR pathway: a target for cancer therapy. Nat Rev Cancer 2004;4:335–48.
78. Motzer RJ, Escudier B, Oudard S, et al. Efficacy of everolimus in advanced renal cell carcinoma: a double-blind, randomised, placebo-controlled phase III trial. Lancet 2008;372:449–56.
79. Brahmer J, Tykodi S, Chow L, et al. Safety and activity of anti-PD-L1 antibody in patients with advanced cancer. N Engl J Med 2012;366:2455–65.
80. Thomson RH, Kuntz SM, Leibovich BC, et al. Tumor B7-H1 is associated with poor prognosis in renal cell carcinoma patients with long-term follow up. Cancer Res 2006;66: 3381–5.
81. Motzer RJ, Escudier B, McDermott DF, et al. Nivolumab versus everolimus in advanced renal-cell carcinoma. N Engl J Med 2015;373:1803–13.
From the Department of Medicine, Carole and Ray Neag Comprehensive Cancer Center, UConn Health, Farmington, CT (Dr. Namakydoust and Dr. Clement) and the UConn School of Pharmacy, Storrs, CT (Dr. Holle).
Abstract
- Objective: To review therapeutic options for the treatment of renal cell carcinoma (RCC).
- Methods: Review of the literature in the context of a clinical case.
- Results: RCC accounts for 90% of all renal tumors. For RCC patients with nondistant metastases, preferred treatment is curative-intent radical nephrectomy or partial nephrectomy; oncologic outcomes for the 2 procedures are similar. For patients who are deemed not to be surgical candidates, ablative techniques such as cryoablation and radiofrequency ablation may be considered. Systemic therapy for metastatic RCC is based on the histologic type of the tumor. Clear-cell is by far the predominant histologic type in RCC. First-line treatment options for patients with metastatic clear-cell RCC include biologic agents such as high-dose interleukin-2 immune therapy, as well as targeted therapies including tyrosine kinase inhibitors (TKIs) and anti-VEGF antibodies. The mammalian target of rapamycin (mTOR) inhibitor temsirolimus is recommended as first-line therapy in patients with poor prognosis. Second-line therapies in this setting include TKIs and nivolumab (PD-1 inhibitor). If TKIs were used as first-line therapy, mTOR inhibitors can be used in the second line. In addition, after initial cytokine therapy, TKIs, temsirolimus, and the anti-VEGF antibody bevacizumab are other treatment options. Best supportive care should always be provided along with initial and subsequent therapies.
- Conclusion: Multiple treatment options are now available for patients with metastatic or unresectable RCC. Given the aggressive course and poor prognosis of non-clear cell renal cell tumors and those with sarcomatoid features, evaluation of systemic and targeted therapies for these subtypes should remain active areas of research and investigation.
Renal cell carcinoma (RCC) is the most common malignancy arising in the kidney, comprising 90% of all renal tumors [1]. Approximately 55,000 new RCC cases are diagnosed each year [1]. Patients with RCC are often asymptomatic, and most cases are discovered as incidental findings on abdominal imaging performed during evaluation of nonrenal complaints. Limited-stage RCC that is found early can be cured sur-gically, with estimated 5-year survival rates approaching 90%; however, long-term survival for metastatic disease is poor, with rates ranging from 0% to 20% [2]. Advanced RCC is resistant to conventional chemotherapy and radiotherapy, and outcomes for patients with metastatic or unresectable RCC remain poor. However, the recent development of new therapeutic modalities that target tumor molecular pathways has expanded the treatment options for these patients and changed the management of RCC.
Epidemiology and Classification
Median age at diagnosis in the United States is 64 years. Men have a higher incidence of RCC than women, with the highest incidence seen in American Indian and Alaska Native men (30.1 per 100,000 population). Genetic syndromes account for 2% to 4% of all RCCs [2]. Risk factors for RCC include smoking, hypertension, obesity, and acquired cystic kidney disease that is associated with end-stage renal failure [3]. Longer duration of tobacco use is associated with a more aggressive course.
The 2004 World Health Organization classification of renal tumors summarizes the previous classification systems (including the Heidelberg and Mainz classification systems) to describe different categories of RCC based on histologic and molecular genetics characteristics [2]. Using the WHO classification criteria, RCC comprises 90% of all renal tumors, with clear cell being the most common type (80%) [2]. Other types of renal tumors include papillary, chromophobe, oncocytoma, and collecting-duct or Bellini duct tumors. Approximately 3% to 5% of tumors are unclassified. Oncocytomas are generally considered benign, and chromophobe tumors typically have an indolent course and rarely metastasize. Sarcomatoid differentiation can be seen in any histologic type and is associated with a worse prognosis.
Familial Syndromes
Several genetic syndromes have been identified by studying families with inherited RCC. Among these, von Hippel-Lindau (VHL) gene mutation is the most commonly found inherited genetic defect. Table 1 summarizes the incidence of gene mutations and the corresponding histologic appearance of the most common sporadic and hereditary RCCs [4].
VHL disease is an autosomal dominant familial syndrome. Patients with this mutation are at higher risk for developing RCC (clear cell histology), retinal angiomas, pheochromocytomas, as well as hemangioblastomas of the central nervous system (CNS) [4]. Of all the genetic mutations seen in RCC, the somatic mutation in the VHL tumor-suppressor gene is by far the most common [5]. VHL targets hypoxia–inducible factor-1 alpha (HIF-α) for ubiquitination and subsequent degradation, which has been shown to suppress the growth of clear-cell RCC in mouse models [6–8]. HIF expression under hypoxic conditions leads to activation of a number of genes important in blood vessel development, cell proliferation, and glucose metabolism, including vascular endothelial growth factor (VEGF), erythropoietin, platelet-derived growth factor beta (PDGF-β), transforming growth factor alpha (TGF-α), and glucose transporter-1 (GLUT-1). Mutation in the VHL gene prevents degradation of the HIF-α protein, thereby leading to increased expression of these downstream proteins, including MET and Axl. The upregulation of these angiogenic factors is thought to be the underlying process for increased vascularity of CNS hemangioblastomas and clear-cell renal tumors in VHL disease [4–8].
Other less common genetic syndromes seen in hereditary RCC include hereditary papillary RCC, hereditary leiomyomatosis, and Birt-Hogg-Dubé (BHD) syndrome [9]. In hereditary papillary RCC, the MET gene is mutated. BHD syndrome is a rare, autosomal dominant syndrome characterized by hair follicle hamartomas of the face and neck. About 15% of patients have multiple renal tumors, the majority of which are of the chromophobe or mixed chromophobe-oncocytoma histology. The BHD gene encodes the protein folliculin, which is thought to be a tumor-suppressor gene.
Case Study
Initial Presentation
A 74-year-old man who works as an airplane mechanic repairman presents to the emergency department with sudden worsening of chronic right upper arm and shoulder pain after lifting a jug of orange juice. He does not have a significant past medical history and initially thought that his pain was due to a work-related injury. Upon initial evaluation in the emergency department he is found to have a fracture of his right humerus. Given that the fracture appears to be pathologic, further workup is recommended.
• What are common clinical presentations of RCC?
Most patients are asymptomatic until the disease becomes advanced. The classic triad of flank pain, hematuria, and palpable abdominal mass is seen in approximately 10% of patients with RCC, partly because of earlier detection of renal masses by imaging performed for other purposes [10]. Less frequently, patients present with signs or symptoms of metastatic disease such as bone pain or fracture (as seen in the case patient), painful adenopathy, and pulmonary symptoms related to mediastinal masses. Fever, weight loss, anemia, and/or varicocele often occur in young patients (≤ 46 years) and may indicate the presence of a hereditary form of the disease. Patients may present with paraneoplastic syndromes seen as abnormalities on routine blood work. These can include polycythemia or elevated liver function tests (LFTs) without the presence of liver metastases (known as Stauffer syndrome), which can be seen in localized renal tumors. Nearly half (45%) of patients present with localized disease, 25% present with locally advanced disease, and 30% present with metastatic disease [11]. Bone is the second most common site of distant metastatic spread (following lung) in patients with advanced RCC.
• What is the approach to initial evaluation for a patient with suspected RCC?
Initial evaluation consists of a physical exam, laboratory tests including complete blood count (CBC) and comprehensive metabolic panel (calcium, serum creatinine, LFTs, lactate dehydrogenase [LDH], and urinalysis), and imaging. Imaging studies include computed tomography (CT) scan with contrast of the abdomen and pelvis or magnetic resonance imaging (MRI) of the abdomen and chest imaging. A chest radiograph may be obtained, although a chest CT is more sensitive for the presence of pulmonary metastases. MRI can be used in patients with renal dysfunction to evaluate the renal vein and inferior vena cava (IVC) for thrombus or to determine the presence of local invasion [12]. Although bone and brain are common sites for metastases, routine imaging is not indicated unless the patient is symptomatic. The value of positron emission tomography in RCC remains undetermined at this time.
• What are the therapeutic options for limited-stage disease?
For patients with nondistant metastases, or limited-stage disease, surgical intervention with curative intent is considered. Convention suggests considering definitive surgery for patients with stage I and II disease, select patients with stage III disease with pathologically enlarged retroperitoneal lymph nodes, patients with IVC and/or cardiac atrium involvement of tumor thrombus, and patients with direct extension of the renal tumor into the ipsilateral adrenal gland if there is no evidence of distant disease. While there may be a role for aggressive surgical intervention in patients with distant metastatic disease, this topic will not be covered in this review.
Surgical Intervention
Once patients are determined to be appropriate candidates for surgical removal of a renal tumor, the urologist will perform either a radical nephrectomy or a nephron-sparing nephrectomy, also called a partial nephrectomy. The urologist will evaluate the patient based on his or her body habitus, the location of the tumor, whether multiple tumors in one kidney or bilateral tumors are present, whether the patient has a solitary kidney or otherwise impaired kidney function, and whether the patient has a history of a hereditary syndrome involving kidney cancer as this affects the risk of future kidney tumors.
A radical nephrectomy is surgically preferred in the presence of the following factors: tumor larger than 7 cm in diameter, a more centrally located tumor, suspicion of lymph node involvement, tumor involvement with renal vein or IVC, and/or direct extension of the tumor into the ipsilateral adrenal gland. Nephrectomy involves ligation of the vascular supply (renal artery and vein) followed by removal of the kidney and surrounding Gerota’s fascia. The ipsilateral adrenal gland is removed if there is a high-risk for or presence of invasion of the adrenal gland. Removal of the adrenal gland is not standard since the literature demonstrates there is less than a 10% chance of solitary, ipsilateral adrenal gland involvement of tumor at the time of nephrectomy in the absence of high-risk features, and a recent systematic review suggests that the chance may be as low as 1.8% [14]. Preoperative factors that correlated with adrenal involvement included upper pole kidney location, renal vein thrombosis, higher T stage (T3a and greater), multifocal tumors, and evidence for distant metastases or lymph node involvement. Lymphadenectomy previously had been included in radical nephrectomy but now is performed selectively. Radical nephrectomy may be performed as either an open or laparoscopic procedure, the latter of which may be performed robotically [15]. Oncologic outcomes appear to be comparable between the 2 approaches, with equivalent 5-year cancer-specific survival (91% with laparoscopic versus 93% with open approach) and recurrence-free survival (91% with laparoscopic versus 93% with open approach) [16]. The approach ultimately is selected based on provider- and patient-specific input, though in all cases the goal is to remove the specimen intact [16,17].
Conversely, a nephron-sparing approach is preferred for tumors less than 7 cm in diameter, for patients with a solitary kidney or impaired renal function, for patients with multiple small ipsilateral tumors or with bilateral tumors, or for radical nephrectomy candidates with comorbidities for whom a limited intervention is deemed to be a lower-risk procedure. A nephron-sparing procedure may also be performed open or laparoscopically. In nephron-sparing procedures, the tumor is removed along with a small margin of normal parenchyma [15].
In summary, the goal of surgical intervention is curative intent with removal of the tumor while maintaining as much residual renal function as possible to limit long-term morbidity of chronic kidney disease and associated cardiovascular events [18]. Oncologic outcomes for radical nephrectomy and partial nephrectomy are similar. In one study, overall survival was slightly lower in the partial nephrectomy cohort, but only a small number of the deaths were due to RCC [19].
Adjuvant Therapy
Adjuvant systemic therapy currently has no role following nephrectomy for RCC because no systemic therapy has been able to reduce the likelihood of relapse. Randomized trials of cytokine therapy (eg, interferon, interleukin 2) or tyrosine kinase inhibitors (TKIs; eg, sorafenib, sunitinib) with observation alone in patients with locally advanced completely resected RCC have shown no delay in time to relapse or improvement of survival with adjuvant therapy [20]. Similarly, adjuvant radiation therapy has not shown benefit even in patients with nodal involvement or incomplete resection [21]. Therefore, observation remains the standard of care after nephrectomy.
Renal Tumor Ablation
For patients who are deemed not to be surgical candidates due to age, comorbidities, or patient preference and who have tumors less than 4 cm in size (stage I tumors), ablative techniques may be considered. The 2 most well-studied and effective techniques at present are cryoablation and radiofrequency ablation (RFA). Microwave ablation may be an option in some facilities, but the data in RCC are limited. An emerging ablative technique under investigation is irreversible electroporation. At present, the long-term efficacy of all ablative techniques is unknown.
Patient selection is undertaken by urologists and interventional radiologists who evaluate the patient with ultrasound, CT, and/or MRI to determine the location and size of the tumor and the presence or absence of metastatic disease. A pretreatment biopsy is recommended to document the histology of the lesion to confirm a malignancy and to guide future treatment for recurrent or metastatic disease. Contraindications to the procedure include the presence of metastatic disease, a life expectancy of less than 1 year, general medical instability, or uncorrectable coagulopathy due to increased risk of bleeding complications. Tumors in close proximity to the renal hilum or collecting system are a contraindication to the procedure because of the risk for hemorrhage or damage to the collecting system. The location of the tumor in relation to the vasculature is also important to maximize efficacy because the vasculature acts as a “heat sink,” causing dissipation of the thermal energy. Occasionally, stenting of the proximal ureter due to upper tumor location is necessary to prevent thermal injury that could lead to urine leaks.
Selection of the modality to be used primarily depends on operator comfort, which translates to good patient outcomes, such as better cancer control and fewer complications. Cryoablation and RFA have both demonstrated good clinical efficacy and cancer control of 89% and 90%, respectively, with comparable complication rates [22]. There have been no studies performed directly comparing the modalities.
Cryoablation. Cryoablation is performed through the insertion of a probe into the tumor, which may be done through a surgical or percutaneous approach. Once the probe is in place, a high-pressure gas (argon, nitrogen) is passed through the probe and it cools once it enters a lower pressure region. The gas is able to cool to temperatures as low as –185°C. The tissue is then rewarmed through the use of helium, which conversely warms when entering a low pressure area. The process of freezing followed by rewarming subsequently causes cell death/tissue destruction through direct cell injury from cellular dehydration and vascular injury. Clinically, 2 freeze-thaw cycles are used to treat a tumor [23,24].
RFA. Radiofrequency ablation, or RFA, targets tumors via an electrode placed within the mass that produces intense frictional heat from medium-frequency alternating current (approximately 500 kHz) from a connected generator that is grounded on the patient. The thermal energy created causes coagulative necrosis. Due to the reliance on heat for tumor destruction, central lesions are less amenable to this approach because of the “heat sink” effect from the hilum [24].
Microwave ablation. Microwave ablation, like RFA, relies on the generation of frictional heat to cause cell death by coagulative necrosis. In this case, the friction is created through the activation of water molecules; because of the different thermal kinetics involved with microwave ablation, the “heat sink” effect is minimized when treatment is employed near large vessels, in comparison to RFA [24]. The data on this mechanism of ablation are still maturing, with varied outcomes thus far. One study demonstrated outcomes comparable to RFA and cryoablation, with cancer-specific survival of 97.8% at 3 years [25]. However, a study by Castle and colleagues [26] demonstrated higher recurrence rates. The overarching impediment to widespread adoption of microwave ablation is inconclusive data gleaned from studies with small numbers of patients with limited follow up. The role of this modality will need to be revisited.
Irreversible electroporation. Irreversible electroporation (IRE) is under investigation. IRE is a non-thermal ablative technique that employs rapid electrical pulses to create pores in cell membranes, leading to cell death. The postulated benefits of IRE include the lack of an effect from “heat sinks” and less collateral damage to the surrounding tissues, when compared with the thermal modalities. In a human phase 1 study of patients undergoing IRE prior to immediate surgical resection, the procedure appeared feasible and safe [27]. Significant concerns for this method of ablation possibly inducing cardiac arrhythmias, and the resultant need for sedation with neuromuscular blockade and associated electrocardiography monitoring, may impede its implementation in nonresearch settings [24].
Active Surveillance
Due to the more frequent use of imaging for various indications, there has been an increase in the discovery of small renal masses (SRM); 85% of RCC that present in an asymptomatic or incidental manner are tumors under 4 cm in diameter [28,29]. The role of active surveillance is evolving, but is primarily suggested for patients who are not candidates for more aggressive intervention based on comorbidities. A recent prospective, nonrandomized analysis of data from the Delayed Intervention and Surveillance for Small Renal Masses (DISSRM) registry evaluated outcomes for patients with SRM looking at primary intervention compared with active surveillance [30]. The primary intervention selected was at the discretion of the provider; treatments included partial nephrectomy, RFA, and cryoablation, and active surveillance patients were followed with imaging every 6 months. Progression of SRM, with recommendation for delayed intervention, was defined as a growth rate of mass greater than 0.5 cm/year, size greater than 4 cm, or hematuria. Thirty-six of 158 patients on active surveillance met criteria for progression; 21 underwent delayed intervention. Of note, even the patients who progressed but did not undergo delayed intervention did not develop metastatic disease during the follow-up interval. With a median follow up of 2 years, cancer-specific survival was noted to be 99% and 100% at 5 years for primary intervention and active surveillance, respectively. Overall survival at 2 years for primary intervention was 98% and 96% for active surveillance; at 5 years, the survival rates were 92% and 75% (P = 0.06). Of note, 2 patients in the primary intervention arm died of RCC, while none in the active surveillance arm died. As would be expected, active surveillance patients were older, had a worse performance status, and had more comorbidities. Interestingly, 40% of patients enrolled selected active surveillance as their preferred management for SRM. The DISSRM results were consistent with data from the Renal Cell Consortium of Canada and other retrospective reviews [31–33].
• What is the approach to follow-up after treatment of localized RCC?
After a patient undergoes treatment for a localized RCC, the goal is to optimize oncologic outcomes, monitor for treatment sequelae, such as renal failure, and focus on survivorship. At this time, there is no consensus in the literature or across published national and international guidelines with regards to the appropriate schedule for surveillance to achieve these goals. In principle, the greatest risk for recurrence occurs within the first 3 years, so many guidelines focus on this timeframe. Likewise, the route of spread tends to be hematogenous, so patients present with pulmonary, bone, and brain metastases, in addition to local recurrence within the renal bed. Symptomatic recurrences often are seen with bone and brain metastases, and thus bone scans and brain imaging are not listed as part of routine surveillance protocols in asymptomatic patients. Although there is inconclusive evidence that surveillance protocols improve outcomes in RCC, many professional associations have outlined recommendations based on expert opinion [34]. The American Urological Association released guidelines in 2013 and the National Comprehensive Cancer Network (NCCN) released their most recent set of guidelines in 2016 [21,35]. These guidelines use TNM staging to risk-stratify patients and recommend follow up.
Case Continued
CT scan with contrast of the chest, abdomen, and pelvis as well as bone scan are done. CT of the abdomen and pelvis demonstrates a 7.8-cm left renal mass arising from the lower pole of the left kidney. Paraesophageal lymphadenopathy and mesenteric nodules are also noted. CT of the chest demonstrates bilateral pulmonary emboli. Bone scan is significant for increased activity related to the pathological fracture involving the right humerus. The patient undergoes surgery to stabilize the pathologic fracture of his humerus. He is diagnosed with metastatic RCC (clear cell histology) and undergoes palliative debulking nephrectomy.
• How is prognosis defined for metastatic RCC?
Prognostic Models
Limited-stage RCC that is found early can be cured surgically, with estimated 5-year survival rates for stage T1 and T2 disease approaching 90%; however, long-term survival for metastatic disease is poor, with rates ranging from 0% to 20% [13]. Approximately 30% of patients have metastatic disease at diagnosis, and about one-third of patients who have undergone treatment for localized disease experience relapse [36,37]. Common sites of metastases include lung, lymph nodes, bone, liver, adrenal gland, and brain.
Prognostic scoring systems have been developed to define risk groups and assist with determining appropriate therapy in the metastatic setting. The most widely used validated prognostic factor model is that from the Memorial Sloan-Kettering Cancer Center (MSKCC), which was developed using a multivariate analysis derived from data of patients enrolled in clinical trials and treated with interferon alfa [38]. The factors included in the MSKCC model are Karnofsky performance status less than 80, time from diagnosis to treatment with interferon alfa less than 12 months, hemoglobin level less than lower limit of laboratory’s reference range, LDH level greater than 1.5 times the upper limit of laboratory’s reference range, and corrected serum calcium level greater than 10 mg/dL. Risk groups are categorized as favorable (0 risk factors), intermediate (1 to 2 risk factors), and poor (3 or more risk factors) [39]. Median survival for favorable-, intermediate-, and poor-risk patients was 20, 10, and 4 months, respectively [40].
Another prognostic model, the International Metastatic RCC Database Consortium, or Heng, model was developed to evaluate prognosis in patients treated with VEGF-targeted therapy [41]. This model was developed from a retrospective study of patients treated with sunitinib, sorafenib, and bevacizumab plus interferon alfa or prior immunotherapy. Prognostic factors in this model include 4 of the 5 MSKCC risk factors (hemoglobin level, corrected serum calcium level, Karnofsky performance status, and time to initial diagnosis). Additionally, this model includes both absolute neutrophil and platelet counts greater than the upper limit of normal. Risk groups are identified as favorable (0 risk factors), intermediate (1 to 2 risk factors), and poor (3 or more risk factors). Median survival for favorable-, intermediate-, and poor-risk patients were not reached, 27 months, and 8.8 months, respectively. The University of California, Los Angeles scoring algorithm to predict survival after nephrectomy and immunotherapy (SANI) in patients with metastatic RCC is another prognostic model that can be used. This simplified scoring system incorporates lymph node status, constitutional symptoms, metastases location, histology, and thyroid stimulating hormone (TSH) level [42].
The role of debulking or cytoreductive nephrectomy in treatment of metastatic RCC is well established. Large randomized studies have demonstrated a statistically significant medial survival benefit for patients undergoing nephrectomy plus interferon alfa therapy compared with patients treated with interferon alfa alone (13.6 months versus 7.8 months, respectively) [43]. The role of cytoreductive nephrectomy in combination with antiangiogenic agents is less clear. While a retrospective study investigating outcomes of patients with metastatic RCC receiving anti-VEGF agents showed a prolonged survival with nephrectomy, results of large randomized trials are not yet available [44,45]. Patients with lung-only metastases, good prognostic features, and a good performance status are historically the most likely to benefit from cytoreductive surgery.
Case Continued
Based on the MSKCC prognostic factor model, the patient is deemed to be in the intermediate-risk group (Karnofsky performance status of 80, calcium 9.5 mg/dL, LDH 204 U/L, hemoglobin 13.6 g/dL). He is started on treatment for his bilateral pulmonary emboli and recovers well from orthopedic surgery as well as palliative debulking nephrectomy.
• What is the appropriate first-line therapy in managing this patient’s metastatic disease?
Based on several studies, TKIs seem to be less effective in patients with non–clear-cell type histology [57,58]. In these patients, risk factors can guide therapy. In the ASPEN trial, where 108 patients were randomly assigned to everolimus or sunitinib, patients in the good- and intermediate-risk groups had longer overall and median progression-free survival (PFS) on sunitinib (8.3 months versus 5.3 months, respectively). However, those in the poor-risk group had a longer median overall survival with everolimus [59]. Given that the role of targeted therapies in non–clear-cell RCCs is less well established, enrollment in clinical trials should be considered as a first-line treatment option [21].
Sarcomatoid features can be observed in any of the histologic types of RCC, and RCC with these features has an aggressive course and a poor prognosis. Currently, there is no standard therapy for treatment of patients with metastatic or unresectable RCC with sarcomatoid features [60]. Chemotherapeutic regimens used for soft tissue sarcomas, including a trial of ifosfamide and doxorubicin, did not show any objective response [61]. A small trial of 10 patients treated with doxorubicin and gemcitabine resulted in complete response in 2 patients and partial response in 1 patient [62].
Enrollment in a clinical trial remains a first-line treatment option for these patients. More recently, a phase 2 trial of sunitinib and gemcitabine in patients with sarcomatoid (39 patients) and/or poor-risk (33 patients) metastatic RCC showed overall response rates (ORR) of 26% and 24%, respectively. A higher clinical benefit rate (defined as ORR plus stable disease) was seen in patients with tumors containing more than 10% sarcomatoid histology, as compared with patients whose tumors contained less than 10% sarcomatoid histology. Neutropenia (n = 20), anemia (n = 10), and fatigue (n = 7) were the most common grade 3 toxicities seen in all the patients. Although this was a small study, the results showed a trend towards better efficacy of the combination therapy as compared with the single-agent regimen. Currently, another study is underway to further investigate this in a larger group of patients [63].
Biologics
Cytokine therapy, including high-dose IL-2 and interferon alfa, had long been the only first-line treatment option for patients with metastatic or unresectable RCC. Studies of high-dose IL-2 have shown an ORR of 25% and durable response in up to 11% of patients with clear-cell histology [64]. Toxicities were similar to those previously observed with high-dose IL-2 treatment; the most commonly observed grade 3 toxicities were hypotension and capillary leak syndrome. IL-2 requires strict monitoring (Table 3). It is important to note that retrospective studies evaluating the safety and efficacy of using IL-2 as second-line treatment in patients previously treated with TKIs demonstrated significant toxicity without achieving partial or complete response in any of the patients [65].
Prior to the advent of TKIs in the treatment of RCC, interferon alfa was a first-line treatment option for those who could not receive high-dose IL-2. It has been shown to produce response rates of approximately 20%, with maximum response seen with a higher dose range of 5 to 20 million units daily in 1 study [66,67]. However, with the introduction of TKIs, which produce a higher and more durable response, interferon alfa alone is no longer recommended as a treatment option.
VEGF Monoclonal Antibodies
Bevacizumab is a recombinant humanized monoclonal antibody that binds and neutralizes VEGF-A. Given overexpression of VEGF in RCC, the role of bevacizumab both as a single agent and in combination with interferon alfa has been investigated. In a randomized phase 2 study involving patients with cytokine-refractory disease, bevacizumab produced a 10% response rate and PFS of 4.8 months compared to patients treated with placebo [68]. In the AVOREN trial, the addition of bevacizumab (10 mg/kg intravenously [IV] every 2 weeks) to interferon alfa (9 million units subcutaneously [SQ] 3 times weekly) was shown to significantly increase PFS compared with interferon alfa alone (10.2 months versus 5.4 months; P = 0.0001) [47,48]. Adverse effects of this combination therapy include fatigue and asthenia. Additionally, hypertension, proteinuria, and bleeding occurred.
Tyrosine Kinase Inhibitors
TKIs have largely replaced IL-2 as first-line therapy for metastatic RCC. Axitinib, pazopanib, sorafenib, and sunitinib and can be used as first-line therapy. All of the TKIs can be used as subsequent therapy.
Sunitinib. Sunitinib is an orally administered TKI that inhibits VEGF receptor (VEGFR) types 1 and 2, PDGF receptors (PDGFR) α and β, stem cell factor receptor (c-Kit), and FLT-3 and RET kinases. Motzer and colleagues [52,53] compared sunitinib 50 mg daily orally for 4 weeks with 2 weeks off to the then standard of care, interferon alfa 9 million units SQ 3 times weekly. Sunitinib significantly increased the overall objective response rate (47% versus 12%; P < 0.001), PFS (11 versus 5 months; P < 0.001), and overall survival (26.4 versus 21.8 months; hazard ratio [HR], 0.821). The most common side effects are diarrhea, fatigue, nausea/vomiting, anorexia, hypertension, stomatitis, and hand-foot syndrome, occurring in more than 30% of patients. Often patients will require dose reductions or temporary discontinuations to tolerate therapy. Alternative dosing strategies (eg, 50 mg dose orally daily for 2 weeks alternating with 1-week free interval) have been attempted but not prospectively evaluated for efficacy [69–71].
Pazopanib. Pazopanib is an oral multi-kinase inhibitor of VEGFR types 1 and 2, PDGFR, and c-KIT. Results of a phase 3 trial comparing pazopanib (800 mg orally daily) to placebo favored the TKI, with a PFS of 9.2 months versus 4.2 months. A subset of treatment-naïve patients had a longer PFS of 11.1 versus 2.8 months and a response rate of 32% versus 4% [72]. This led to a noninferiority phase 3 trial comparing pazopanib with sunitinib as first-line therapy [50]. In this study, PFS was similar (8.4 versus 9.5 months; HR 1.05), and overall safety and quality-of-life endpoints favored pazopanib. Much less fatigue, stomatitis, hand-foot syndrome, and thrombocytopenia occurred with pazopanib, whereas hair color changes, weight loss, alopecia, and elevations of LFT enzymes occurred more frequently with pazopanib. Hypertension is common with the administration of pazopanib as well.
Sorafenib. Sorafenib is an orally administered inhibitor of Raf, serine/threonine kinase, VEGFR, PDGFR, FLT-3, c-Kit, and RET. The pivotal phase 3 Treatment Approaches in Renal Cancer Global Evaluation Trial (TARGET) compared sorafenib (400 mg orally twice daily) with placebo in patients who had progressed on prior cytokine-based therapy [73]. A final analysis, which excluded patients who were allowed to cross over therapies, found improved overall survival times (14.3 versus 1.8 months, P = 0.029) [51]. Sorafenib is associated with lower rates of diarrhea, rash, fatigue, hand-foot syndrome, alopecia, hypertension, and nausea than sunitinib, although these agents have not been compared to one another.
Axitinib. Axitinib is an oral inhibitor of VEGFRs 1, 2, and 3. Results of the phase 3 AXIS trial comparing axitinib (5 mg orally twice daily) with sorafenib (400 mg orally twice daily) in patients receiving one prior systemic therapy showed axitinib was more active than sorafenib in improving ORR (19% versus 9%; P = 0.001) and PFS (6.7 versus 4.7 months; P < 0.001), although no difference in overall survival times was noted [74]. In a subsequent phase 3 trial comparing these drugs in the first-line setting, axitinib showed a nonsignificantly higher response rate and PFS. Despite this, the National Comprehensive Cancer Network guidelines consider axitinib an acceptable first-line therapy because activity with acceptable toxicity was demonstrated (Table 2) [46]. The most common adverse effects of axitinib are diarrhea, hypertension, fatigue, decreased appetite, dysphonia, hypothyroidism, and upper abdominal pain.
Cabozantinib
Given that resistance eventually develops in most patients treated with standard treatments, including bevacizumab and TKIs, the need to evaluate the safety and efficacy of novel agents targeting VEGFR and overcoming this resistance is of vital importance. Cabozantinib is an oral small-molecule inhibitor of VEGFR, Met, and Axl, all tyrosine kinases implicated in metastatic RCC. Overexpression of Met and Axl, which occurs as a result of inactivation of the VHL gene, is associated with a poor prognosis in patients with RCC. In a randomized, open label, phase 3 trial of cabozantinib versus everolimus in advanced RCC, Choueiri and colleagues [75] compared the efficacy of cabozantinib with everolimus in patients with metastatic RCC who had progressed on previous VEGFR-targeted therapies. In this study, 658 patients were randomly assigned to receive cabozantinib (60 mg orally daily) or everolimus (10 mg orally daily). Results of the study found that PFS was longer with cabozantinib in patients who had previously been treated with other TKIs (median PFS of 7.4 months versus 3.8 months; HR 0.58), corresponding to a 42% reduction in the rate of disease progression or death. The most common grade 3 and 4 toxicities seen with cabozantinib were similar to its class effect and consisted of hypertension, diarrhea, and fatigue. In the final analysis of the data, the median overall survival was 21.4 months (95% CI 18.7–not estimable) with cabozantinib and 16.5 months (95% CI 14.7 to 18.8) with everolimus (HR 0.66; 95% CI 0.53 to 0.83; P = 0.00026). The median follow-up for overall survival and safety was 18.7 months. These results highlight the importance of cabozantinib as a first line option in treatment of previously treated patients with advanced RCC [76].
mTOR Inhibitors
The mTOR inhibitors, temsirolimus and everolimus, are also approved for the treatment of metastatic or advanced RCC. These drugs block mTOR’s phosphorylation and subsequent translation of mRNA to inhibit cell proliferation, cell growth, and angiogenesis [77]. Temsirolimus can be used as first-line therapy for patients with a poor prognosis, and everolimus is appropriate as a subsequent therapy.
Temsirolimus is an intravenous prodrug of rapamycin. It was the first of the class to be approved for metastatic RCC for treatment-naïve patients with a poor prognosis (ie, at least 3 of 6 predictors of poor survival based on MSKCC model) [54]. The pivotal ARCC trial compared temsirolimus (25 mg IV weekly) alone, interferon alfa (3 million units SQ 3 times weekly) alone, or the combination (temsirolimus 15 mg IV weekly plus interferon alfa 6 million units SQ 3 times weekly). In this trial, temsirolimus monotherapy produced a significantly longer overall survival time than interferon alfa alone (10.9 versus 7.3 months; P = 0.008) and improved PFS time when administered alone or in combination with interferon alfa (3.8 and 3.7 months, respectively, versus 1.9 months). Because no real efficacy advantage of the combination was demonstrated, temsirolimus is administered alone. The most common adverse effects of temsirolimus are asthenia, rash, anemia, nausea, anorexia, pain, and dyspnea. Additionally, hyperglycemia, hypercholesterolemia, and hyperlipidemia occur with these agents. Noninfectious pneumonitis is a rare but often fatal complication.
Everolimus is also an orally administered derivative of rapamycin that is approved for use after failure of VEGF-targeted therapies. The results of the landmark trial RECORD-1 demonstrated that everolimus (10 mg orally daily) is effective at prolonging PFS (4 versus 1.9 months; P < 0.001) when compared with best supportive care, a viable treatment option at the time of approval [78]. The most common adverse effects of everolimus are stomatitis, rash, fatigue, asthenia, and diarrhea. As with temsirolimus, elevations in glucose, lipids, and triglycerides and noninfectious pneumonitis can occur.
TKI + mTOR Inhibitor
Lenvatinib is also a small molecule targeting multiple tyrosine kinases, primarily VEGF2. Combined with the mTOR inhibitor, everolimus, it has been shown to be an effective regimen in patients with metastatic RCC who have failed other therapies. In a randomized phase 2 study involving patients with advanced or metastatic clear-cell RCC, patients were randomly assigned to receive either lenvatinib (24 mg/day), everolimus (10 mg/day), or lenvatinib plus everolimus (18 mg/day and 5 mg/day, respectively). Patients received the treatment continuously on a 28-day cycle until progression or inability to tolerate toxicity. Patients in the lenvatinib plus everolimus arm had median PFS of 14.6 months (95% CI 5.9 to 20.1) versus 5.5 months (95% CI 3.5 to 7.1) with everlolimus alone (HR 0.40; 95% CI 0.24 to 0.68; P = 0.0005). PFS with levantinib alone was 7.4 months (95% CI 5.6 to 10.20; HR 0.66, 95% CI 0.30 to 1.10, P = 0.12). In addition, PFS with levantinib alone was significantly prolonged in comparison with everolimus alone (HR 0.61; 95% CI 0.38 to 0.98; P = 0.048). Grade 3 or 4 toxicity were less frequent in the everolimus only arm and the most common grade 3 or 4 toxicity in the lenvatinib plus everolimus arm was diarrhea. The results of this study show that the combination of lenvatinib plus everolimus is an acceptable second-line option for treatment of patients with advanced or metastatic RCC [55].
Case Continued
The patient is initially started on pazopanib and tolerates the medication well, with partial response to the treatment. However, on restaging scans he is noted to have small bowel perforation. Pazopanib is discontinued until the patient has a full recovery. He is then started on everolimus. Restaging scans done 3 months after starting everolimus demonstrate disease progression.
• What is the appropriate next step in treatment?
PD1 Blockade
Programmed death 1 (PD-1) protein is a T-cell inhibitory receptor with 2 ligands, PD-L1 and PD-L2. PD-L1 is expressed on many tumors. Blocking the interaction between PD-1 and PD-L1 by anti-PD-1 humanized anti-bodies potentiates a robust immune response and has been a breakthrough in the field of cancer immunotherapy [79]. Previous studies have demonstrated that overexpression of PD-L1 leads to worse outcomes and poor prognosis in patients with RCC [80]. Nivolumab, a fully human IgG4 PD-1 immune checkpoint inhibitor, blocks the interaction between PD-1 and its ligands, PD-L1 and PD-L2. In a randomized, open-label, phase 3 study comparing nivolumab with everolimus in patients with RCC who had previously undergone treatment with other standard therapies, Motzer and colleagues [81] demonstrated a longer overall survival time and fewer adverse effects with nivolumab. In this study, 821 patients with clear-cell RCC were randomly assigned to receive nivolumab (3 mg/kg of body weight IV every 2 weeks) or everolimus (10 mg orally once daily). The median overall survival time with nivolumab was 25 months versus 19.6 months with everolimus (P < 0.0148). Nineteen percent of patients receiving nivolumab experienced grade 3 or 4 toxicities, with fatigue being the most common adverse effect. Grade 3 or 4 toxicities were observed in 37% of patients treated with everolimus, with anemia being the most common. Based on the results of this trial, on November 23, 2015, the U.S. Food and Drug Administration approved nivolumab to treat patients with metastatic RCC who have received a prior antiangiogenic therapy.
Case Conclusion
Both TKI and mTOR inhibitor therapy fail, and the patient is eligible for third-line therapy. Because of his previous GI perforation, other TKIs are not an option. The patient opts for enrollment in hospice due to declining performance status. For other patients in this situation with a good performance status, nivolumab would be a reasonable option.
Future Directions
With the approval of nivolumab, multiple treatment options are now available for patients with metastatic or unresectable RCC. Development of other PD-1 inhibitors and immunotherapies as well as multi-targeted TKIs will only serve to expand treatment options for these patients. Given the aggressive course and poor prognosis of non-clear cell renal cell tumors and those with sarcomatoid features, evaluation of systemic and targeted therapies for these subtypes should remain active areas of research and investigation.
Corresponding author: Jessica Clement, MD, UConn Health, 263 Farmington Avenue, Farmington, CT 06030, [email protected].
Financial disclosures: None.
1. Siegel R, Miller, K, Jemal A. Cancer Statistics, 2015. CA Cancer J Clin 2015;65:5–29.
2. Eble JN, Sauter G, Epstein JI, Sesterhenn IA. Pathology and genetics. Tumors of the urinary system and male genital organs. Lyon: IARC Press; 2004.
3. Chow WH, Gridley G, Fraumeni JF Jr, Jarvholm B. Obesity, hypertension, and the risk of kidney cancer in men. N Engl J Med 2000;343:1305–11.
4. Cohen H, McGovern F. Renal-cell carcinoma. N Engl J Med 2005;353:2477–90
5. Yao M, Yoshida M, Kishida T, et al. VHL tumor suppres sor gene alterations associated with good prognosis in sporadic clear-cell renal carcinoma. J Natl Cancer Inst 2002;94:1569–75.
6. Iliopoulos O, Kibel A, Gray S, Kaelin WG Jr. Tumour suppression by the human von Hippel-Lindau gene product. Nat Med 1995;1:822–6
7. Chen F, Kishida T, Duh FM, et al. Suppression of growth of renal carcinoma cells by the von Hippel-Lindau tumor suppressor gene. Cancer Res 1995;55:4804–7.
8. Iliopoulos O, Levy AP, Jiang C, et al. Negative regulation of hypoxia-inducible genes by the von Hippel Lindau protein. Proc Natl Acad Sci U S A 1996;93:10595–9.
9. Nickerson ML, Warren MB, Toro JR, et al. Mutations in a novel gene lead to kidney tumors, lung wall defects, and benign tumors of the hair follicle in patients with the Bir- Hogg-Dube syndrome. Cancer Cell 2002;2:157–64
10. Shuch B, Vorganit S, Ricketts CJ, et al. Defining early-onset kidney cancer: implications for germline and somatic mutation testing and clinical management. J Clin Oncol 2014;32:431–7.
11. Bukowski RM. Immunotherapy in renal cell carcinoma. Oncology 1999;13:801–10.
12. Mueller-Lisse UG, Mueller-Lisse UL. Imaging of advanced renal cell carcinoma. World J Urol 2010;28:253–61.
13. Edge SB, Byrd DR, Compton CC, et al, eds. AJCC cancer staging manual, 7th ed. New York: Springer Science and Business Media LLC; 2010.
14. O’Malley RL, Godoy G, Kanofsky JA, Taneja SS. The necessity of adrenalectomy at the time of radical nephrectomy: a systematic review. J Urol 2009;181:2009–17.
15. McDougal S, Wein AJ, Kavoussi LR, et al. Campbell-Walsh Urology. 10th ed. Philadelphia (PA): Saunders; 2012.
16. Colombo JR Jr, Haber GP, Kelovsek JE, et al. Seven years after laparoscopic radical nephrectomy: oncologic and renal functional outcomes. Urology 2008:71:1149–54.
17. Ferlay J, Steliarova-Foucher E, Lortet-Tieulent J, et al. Cancer incidence and mortality patterns in Europe: estimates for 40 countries in 2012. Eur J Ca 2013;49:1374–403.
18. Weight CJ, Larson BT, Fergany AF, et al. Nephrectomy induced chronic renal insufficiency is associated with increased risk of cardiovascular death and death from any cause in patients with localized cT1b renal masses. J Urol 2010;183:1317–23.
19. Van Poppel H, Da Pozzo L, Albrecht W, et al. A prospective, randomized EORTC intergroup phase 3 study comparing the oncologic outcome of elective nephron-sparing surgery and radical nephrectomy for low-stage renal cell carcinoma. Eur Urol 2011;59:543–52.
20. Smaldone MC, Fung C, Uzzo RG, Hass NB. Adjuvant and neoadjuvant therapies in high-risk renal cell carcioma. Hematol Oncol Clin North Am 2011;25:765–91.
21. NCCN clinical practice guidelines in oncology. Version 3.2016. www.nccn.org. Accessed July 13, 2016
22. El Dib R, Touma NJ, Kapoor A. Cryoablation vs radiofrequency ablation for the treatment of renal cell carcinoma: a meta-amalysis of case series studies. BJU Int 2012;110:510–6.
23. Theodorescu D. Cancer cryotherapy: evolution and biology. Rev Urol 2004;6 Suppl 4:S9–S19.
24. Khiatani V, Dixon RG. Renal ablation update. Sem Intervent Radiol 2014;31:157–66.
25. Yu J, Liang P, Yu XL, et al. US-guided percutaneous microwave ablation of renal cell carcinoma: intermediate-term results. Radiol 2012;263:900–8.
26. Castle SM, Salas N, Leveillee RJ. Initial experience using microwave ablation therapy for renal tumor treatment: 18- month follow-up. Urology 2011;77:792–7.
27. Pech M, Janitzky A, Wendler JJ, et al. Irreversible electroporation of renal cell carcinoma: a first-in-man phase I clinical study. Cardiovasc Intervent Radiol 2011;34:132–8.
28. Chow WH, Devesa SS, Warren JL, Fraumeni JF Jr. Rising incidence of renal cell cancer in the United States. JAMA 1999;281:1628–31.
29. Jayson M, Sanders H. Increased incidence of serendipitously discovered renal cell carcinoma. Urology 1998;51:203–5.
30. Pierorazio PM, Johnson MH, Ball MW, et al. Five-year analysis of a multi-institutional prospective clinical trial of delayed intervention and surveillance for small renal masses: the DISSRM registry. Eur Urol 2015;68:408–15.
31. Jewett MA, Mattar K, Basiuk J, et al. Active surveillance of small renal masses: progression patterns of early stage kidney cancer. Eur Urol 2011;60:39–44.
32. Chawla SN, Crispen PL, Hanlon AL, et al. The natural history of observed enhancing renal masses: meta-analysis and review of the world literature. J Urol 2006;175:425–31.
33. Smaldone MC, Kutikov A, Egleston BL, et al. Small renal masses progressing to metastases under active surveillance: a systematic review and pooled analysis. Cancer 2012;118:997–1006.
34. Williamson TJ, Pearson JR, Ischia J, et al.Guideline of guidelines: follow-up after nephrectomy for renal cell carcinoma. BJU Int 2016;117:555–62.
35. Donat S, Diaz M, Bishoff JT, et al. Follow-up for clinically localized renal neoplasms: AUA Guideline. J Urol 2013;190:407–16.
36. Janzen NK, Kim HL, Figlin RA, Bell-degrun AS. Surveillance after radical or partial nephrectomy for localized renal cell carcinoma and management of recurrent disease. Urol Clin North Am 2003:30:843–52.
37. Gupta K, Miller JD, Li JZ, Russell MW, Charbonneau C. Epidemiologic and socio-economic burden of metastatic renal cell carcinoma (mRCC): a literature review. Cancer Treat Rev 2008;34:193–205.
38. Mekhail T, Abou-Jawde R, Boumerhi G, et al. Validation and extension of the Memorial Sloan-Kettering Prognostic Factors Model for Survival in patients with previously untreated metastatic renal cell carcinoma. J Clin Oncol 2005;23: 832–41.
39. Motzer RJ, Bacik J, Murphy BA, et al. Interferon-alfa as a comparative treatment for clinical trials of new therapies against advanced renal cell carcinoma. J Clin Oncol 2002;20:289–96.
40. Motzer RJ, Mazumdar M, Bacik J, et al. Survival and prognostic stratification of 670 patients with advanced renal cell carcinoma. J Clin Oncol 1999;17:2530–40.
41. Heng DY, Xie W, Regan MM. Prognostic factors for overall survival in patients with metastatic renal cell carcinoma treated with vascular endothelial growth factor-targeted agents: results from a large, multicenter study. J Clin Oncol 2009;27:5794–9.
42. Leibovich BC, Han KR, Bui MH, et al. Scoring algorithm to predict survival after nephrectomy and immunotherapy in patients with metastatic renal cell carcinoma: A stratification tool for prospective clinical trials. Cancer 2003;98:2566–77.
43. Flanigan RC, Mickisch G, Sylvester R, et al. Cytoreductive nephrectomy in patients with metastatic renal cancer: a combined analysis. J Urol 2004;171:1071–6.
44. Choueiri TK, Xie W, Kollmannsberger C, et al. The impact of cytoreductive nephrectomy on survival of patients with metastatic renal cell carcinoma receiving vascular endothelial growth factor targeted therapy. J Urol 2011;185:60–6.
45. Chapin BF, Delacroix SE Jr, Culp SH, et al. Safety of presurgical targeted therapy in the setting of metastatic renal cell carcinoma. Eur Urol 2011;60:964–71.
46. Hutson TE, Lesovoy V, Al-Shukri S, et al. Axitinib versus sorafenib as first-line therapy in patients with metastatic renal-cell carcinoma: a randomized open-label phase 3 trial. Lancet Oncol 2013;14:1287–94.
47. Escudier B, Pluzanska A, Koralewski P, et al. Bevacizumab plus interferon alfa-2a for treatment of metatastic renal cell carcinoma: a randomized, double-blind phase III trial. Lancet 2007;370:2103–11.
48. Escudier B, Bellmunt J, Negrier S, et al. Phase III trial of bevacizumab plus interferon alfa-2a in patients with metastatic renal cell carcinoma (AVOREN): final analysis of overall survival. J Clin Oncol 2010;28:2144–50.
49. McDermott DF, Cheng SC, Signoretti S, et al. The high-dose aldesleukin “select”trial: a trial to prospectively validate predictive models of response to treatment in patients with metastatic renal cell carcinoma. Clin Cancer Res 2015;21:561–8.
50. Motzer RJ, Hutson TE, Cella D, et al. Pazopanib versus sunitinib in metastatic renal-cell carcinoma. N Engl J Med 2013;369:722–31.
51. Escudier B, Eisen T, Stadler WM, et al. Sorafenib for treatment of renal cell carcinoma: final efficacy and safety results of the phase III treatment approaches in renal cell global evaluation trial. J Clin Oncol 2009;27:3312–8.
52. Motzer RJ, Hutson TE, Tomczak P, et al. Sunitinib versus interferon alfa in metastatic renal-cell carcinoma. N Engl J Med 2007;356:115–24.
53. Motzer RJ, Hutson TE, Tomczak P, et al. Overall survival and updated results for sunitinib compared with interferon alfa in patients with metastatic renal cell carcinoma. J Clin Oncol 2009;27:3584–90.
54. Hudes G, Carducci M, Tomczak P, et al. Temsirolimus, interferon alfa, or both for advanced renal-cell carcinoma. N Engl J Med 2007;356:2271–81.
55. Motzer RJ, Hutson TE, Glen H, et al. Lenvatinib, everolimus and the combination in patients with metastatic renal cell carcinoma: a randomized, phase 2, open label, multicenter trial. Lancet Oncology 2015;16:1473–82.
56. Lexi-Comp, Inc. (Lexi-Drugs® ). Lexi-Drugs version 2.3.3. Lexicomp. Wolters Kluwer Health, Inc. Hudson, OH.
57. Choueiri TK, Plantade A, Elson P, et al. Efficacy of sunitinib and sorafenib in metastatic papillary and chromophobe renal cell carcinoma. J Clin Oncol 2008;26:127–31.
58. Lee JL, Ahn JH, Lim HY, et al. Multicenter phase II study of sunitinib in patients with non-clear cell renal cell carcinoma. Ann Oncol 2012;23:2108–14.
59. Armstrong AJ, Broderick S, Eisen T, et al. Final clinical results of a randomized phase II international trial of everolimus vs. sunitinib in patients with metastatic non-clear cell renal cell carcinoma (ASPEN). ASCO Meeting Abstracts 2015;33:4507.
60. Chowdhury S, Matrana MR, Tsang C, et al. Systemic therapy for metastatic non-clear-cell renal cell carcinoma: recent progress and future directions. Hematol Oncol Clin North Am 2011;25:853–69.
61. Escudier B, Droz JP, Rolland F, et al. Doxorubicin and ifosfamide in patients with metastatic sarcomatoid renal cell carcinoma: a phase II study of the Genitourinary Group of the French Federation of Cancer Centers. J Urol 2002; 168–71
62. Nanus DM, Garino A, Milowsky MI, et al. Active chemotherapy for sarcomatoid and rapidly progressing renal cell carcinoma. Cancer 2004;101:1545–51.
63. Michaelson MD, McKay RR, Werner L, et al. Phase 2 trial of sunitinib and gemcitabine in patients with sarcomatoid and/or poor-risk metastatic renal cell carcinoma. Cancer 2015;121:3435–43.
64. McDermott DF, Cheng SC, Signoretti S, et al. The high-dose aldesleukin “select”trial: a trial to prospectively validate predictive models of response to treatment in patients with metastatic renal cell carcinoma. Clin Cancer Res 2015;21:561–8
65. Cho DC, Puzanov I, Regan MM, et al. Retrospective analysis of the safety and efficacy of interleukin-2 after prior VEGF-targeted therapy in patients with advanced renal cell carcinoma. J Immunother 2009;32:181–5.
66. Pyrhönen S, Salminen E, Ruutu M, et al. Prospective randomized trial of interferon alfa-2a plus vinblastine versus vinblastine alone in patients with advanced renal cell cancer. J Clin Oncol 1999;17:2859–67.
67. Interferon-alpha and survival in metastatic renal carcinoma: early results of a randomised controlled trial. Medical Research Council Renal Cancer Collaborators. Lancet 1999;353:14–7.
68. Yang JC, Haworth L, Sherry RM, et al. A randomized trial of bevacizumab, an anti-vascular endothelial growth factor antibody, for metastatic renal cancer. N Engl J Med 2003;349:427–34.
69. Atkinson BJ, Kalra S, Wang X, et al. Clinical outcomes for patients with metastatic renal cell carcinoma treated with alternative sunitinib schedules. J Urol 2014;191:611–8.
70. Kollmannsberger C, Bjarnason G, Burnett P, et al. Sunitinib in metastatic renal cell carcinoma: recommendations for management of noncardiovascular toxicities. Oncologist 2011;16:543–53.
71. Najjar YG, Mittal K, Elson P, et al. A 2 weeks on and 1 week off schedule of sunitinib is associated with decreased toxicity in metastatic renal cell carcinoma. Eur J Cancer 2014;50:1084–9.
72. Sternberg CN, Davis ID, Mardiak J, et al. Pazopanib in locally advanced or metastatic renal cell carcinoma: results of a randomized phase III trial. J Clin Oncol 2010;28:1061–8.
73. Escudier B, Eisen T, Stadler WM, et al. Sorafenib in advanced clear-cell renal-cell carcinoma. N Engl J Med 2007;356:125–34
74. Rini BI, Escudier B, Tomczak P, et al. Comparative effectiveness of axitinib versus sorafenib in advanced renal cell carcinoma (AXIS): a randomised phase 3 trial. Lancet 2011;378:1931–9.
75. Choueiri TK, Escudier B, Powles T, et al. Cabozantinib versus everolimus in advanced renal-cell carcinoma. N Engl J Med 2015;373:1814–23.
76. Choueiri TK, Escudier B, Powles T, et al. Cabozantinib versus everolimus in advanced renal cell carcinoma (METEOR) final results from a randomized, open-label, phase 3 trial. Lancet Oncology 2016;17:917–27.
77. Bjornsti MA, Houghton PJ. The TOR pathway: a target for cancer therapy. Nat Rev Cancer 2004;4:335–48.
78. Motzer RJ, Escudier B, Oudard S, et al. Efficacy of everolimus in advanced renal cell carcinoma: a double-blind, randomised, placebo-controlled phase III trial. Lancet 2008;372:449–56.
79. Brahmer J, Tykodi S, Chow L, et al. Safety and activity of anti-PD-L1 antibody in patients with advanced cancer. N Engl J Med 2012;366:2455–65.
80. Thomson RH, Kuntz SM, Leibovich BC, et al. Tumor B7-H1 is associated with poor prognosis in renal cell carcinoma patients with long-term follow up. Cancer Res 2006;66: 3381–5.
81. Motzer RJ, Escudier B, McDermott DF, et al. Nivolumab versus everolimus in advanced renal-cell carcinoma. N Engl J Med 2015;373:1803–13.
Oxaliplatin boosts pCR in patients with locally advanced rectal cancer
Adding oxaliplatin to perioperative fluorouracil and radiotherapy was associated with a higher rate of pathologic complete response (pCR) in advanced rectal cancer patients, compared with single-agent fluorouracil plus radiotherapy, investigators report in the Journal of Clinical Oncology.
For the Neoadjuvant FOLFOX6 Chemotherapy With or Without Radiation in Rectal Cancer (FOWARC) study, 495 patients with locally advanced rectal cancer (LARC) who were undergoing total mesorectal excision were randomly assigned to one of three preoperative treatment arms: neoadjuvant therapy with fluorouracil plus radiotherapy (fluorouracil-radiotherapy group), fluorouracil chemotherapy with perioperative fluorouracil and oxaliplatin plus radiotherapy (mFOLFOX6-radiotherapy group), or fluorouracil chemotherapy with perioperative fluorouracil and oxaliplatin without radiotherapy (mFOLFOX6 group).The rates of pCR were 14.0%, 27.5%, and 6.6% for patients in the fluorouracil-radiotherapy, mFOLFOX6-radiotherapy, and mFOLFOX6 groups, respectively, Dr. Yanhong Deng of the Sixth Affiliated Hospital of Sun Yat-sen University, Guangzhou City, China, and her associates reported (J Clin Oncol. 2016. doi: 10.1200/JCO.2016.66.6198).
No patients died during neoadjuvant treatment. Grade 3 or 4 toxicities occurred in 55.5% (n = 86), 88% (n = 139), and 24.5% (n = 40) of patients in the fluorouracil-radiotherapy group, mFOLFOX6-radiotherapy, and mFOLFOX6 groups, respectively. The most common grade 3 to 4 toxicities were leukopenia, radiodermatitis, and radiation proctitis.
Initial analysis of this study showed that “compared with the single-agent fluorouracil, mFOLFOX6 concurrent with radiotherapy preoperatively results in a higher rate of pCR (14.0% vs. 27.5%), a higher good response rate, good compliance, and acceptable toxicity for patients with stage II/III rectal cancer,” the investigators wrote.
“These preliminary results suggest that a strategy of combining full-dose chemotherapy with radiation over chemosensitizing radiation may be a new option for neoadjuvant treatment in LARC,” they added.
Sun Yat-sen University funded this study. Dr. Deng and her associates did not have any disclosures to report.
On Twitter @jessnicolecraig
FROM JOURNAL OF CLINICAL ONCOLOGY
Key clinical point: Perioperative oxaliplatin administered in combination with fluorouracil and radiotherapy was associated with a higher rate of pathologic complete response in advanced rectal cancer patients compared with single-agent fluorouracil and radiotherapy.
Major finding: The rate of pathologic complete response was 27.5% for patients receiving oxaliplatin, fluorouracil, and radiotherapy vs. 14.0% for patients receiving single-agent fluorouracil and radiotherapy.
Data source: A multicenter, open-label, phase III trial involving 495 patients with locally advanced stage II/III rectal cancer.
Disclosures: Sun Yat-sen University funded this study. Dr. Deng and her associates did not have any disclosures to report.