User login
VIDEO: Varenicline underused for smoking cessation
ROME – “Unfounded” concerns about cardiovascular effects have contributed to underuse of varenicline for smoking cessation, Kornelia Kotseva, MD, said at the annual congress of the European Society of Cardiology.
In an exclusive video interview, Dr. Kotseva of Imperial College, London, told our reporter Bruce Jancin that meta-analyses have shown no significant difference in serious cardiovascular events between varenicline-treated patients and those on placebo, regardless of whether the patients had underlying cardiovascular disease.
Varenicline use for smoking cessation reduces the risk of cardiovascular events by 36%, she reported, more than reductions seen with either nicotine replacement therapy or bupropion.
The video associated with this article is no longer available on this site. Please view all of our videos on the MDedge YouTube channel
ROME – “Unfounded” concerns about cardiovascular effects have contributed to underuse of varenicline for smoking cessation, Kornelia Kotseva, MD, said at the annual congress of the European Society of Cardiology.
In an exclusive video interview, Dr. Kotseva of Imperial College, London, told our reporter Bruce Jancin that meta-analyses have shown no significant difference in serious cardiovascular events between varenicline-treated patients and those on placebo, regardless of whether the patients had underlying cardiovascular disease.
Varenicline use for smoking cessation reduces the risk of cardiovascular events by 36%, she reported, more than reductions seen with either nicotine replacement therapy or bupropion.
The video associated with this article is no longer available on this site. Please view all of our videos on the MDedge YouTube channel
ROME – “Unfounded” concerns about cardiovascular effects have contributed to underuse of varenicline for smoking cessation, Kornelia Kotseva, MD, said at the annual congress of the European Society of Cardiology.
In an exclusive video interview, Dr. Kotseva of Imperial College, London, told our reporter Bruce Jancin that meta-analyses have shown no significant difference in serious cardiovascular events between varenicline-treated patients and those on placebo, regardless of whether the patients had underlying cardiovascular disease.
Varenicline use for smoking cessation reduces the risk of cardiovascular events by 36%, she reported, more than reductions seen with either nicotine replacement therapy or bupropion.
The video associated with this article is no longer available on this site. Please view all of our videos on the MDedge YouTube channel
AT THE ESC CONGRESS 2016
Thinking through the State of Hospital Medicine Report
sSHM’s 2016 State of Hospital Medicine Report (SoHM) is now available, and it’s unquestionably the best source of detail regarding how hospital medicine groups are configured and operated.1
The SoHM is published in even years and combines data from two sources:
- Hospitalist data from Medical Group Management Association’s Physician Compensation and Productivity Survey. Within the SoHM, you will find the same figures for hospitalist compensation, production, and a few related metrics that are from the MGMA survey report.
- SHM’s survey of hospital medicine groups. This survey drills into significant detail on things like scope of clinical practice, staffing levels, work schedules, bonus metrics, CPT code distribution, roles for NPs and PAs, and the amount of financial support provided to the group.
There are several new topics in this year’s SoHM, including CME allowances, utilization of prolonged service codes, and charge capture methodologies being used by hospital medicine groups. My colleague, Leslie Flores, has been very involved in the survey for 10 years and has written a blog with more details.
One Caveat …
The mix of survey respondents varies and includes a much larger portion of hospital medicine groups employed by multi-state management companies than prior surveys. Even if a parameter hasn’t changed for any hospitalist group, the fact that responses come from different contingents of the hospitalist workforce can result in a different result from one survey to the next. It is difficult to be certain if variations across successive surveys reflect a real change in the marketplace or are a function of variation in the respondent population.
Now let’s review and analyze some of this year’s survey findings for hospital medicine groups caring for adults:
Financial Support Stayed Flat
The amount of financial support provided to a hospital medicine group per FTE has increased significantly in every prior survey. This money typically comes from the hospital that the hospital medicine group serves and is sometimes referred to as the “subsidy.” For hospital medicine groups serving adults, it was $139,000 in 2012 and $156,000 in 2014.
The current survey showed a median of $157,500, essentially unchanged from two years prior. This is either an aberration in the survey (e.g., a result of a different survey population) or an indicator that this amount has begun to level off. Clearly, there is an upper limit to the amount of financial support the marketplace can support, but from my experience working with hospitalist groups around the country, I haven’t seen evidence that we’ve reached that point. I suspect it is an aberration and future surveys will show a continued rising trend, though perhaps not as rapidly as in years past.
Compensation Method Is Evolving
A mean of 14.7% of compensation was tied to production, up from around 10% in prior surveys. And the portion tied to performance (e.g., patient satisfaction, quality metrics) was unchanged at 6%. It’s interesting that despite proliferation of pay-for-performance programs and increasing emphasis on quality and value, it is the productivity portion of compensation that increased. It’s hard to know if that is a meaningful trend.
Compensation Amount Continues to Increase
For hospitalists caring for adults, the median amount of compensation rose to $278,746, up from $253,000 in 2014, $234,000 in 2013, and $221,000 in 2011. These figures come from the MGMA survey, and the financial support figures above come from the separate SHM survey. That means it’s impossible to make firm conclusions about how the numbers do or don’t interrelate.
Don’t forget that surveys report all forms of compensation, including base, production, bonus, extra shifts, and other elements. This year’s $278,746 includes all the bonus dollars earned by each hospitalist in the survey. We can make a very rough guess at the bonus by multiplying the portion of total compensation tied to performance in the SHM survey (6%) by the total compensation ($278,746) from the MGMA survey, which comes to $13,397. But we still don’t know the portion of the total bonus dollars available that represents. My experience is that the total bonus dollars available is around $20,000 or more at most hospital medicine groups. Therefore, a doctor who earned $13,397 presumably didn’t meet all performance goals.
A Deeper Dive into Hospital Medicine Group Finances
It is really interesting to ponder where the dollars come from to fund higher hospitalist compensation if the financial support provided per FTE hasn’t increased. Perhaps hospitalists are generating more encounters, work relative value units (wRVUs), or professional fee collections?
Median professional fee collections were $213,000 this year, up from $151,000 in the prior survey two years ago. This increase could, in theory, fully fund the higher hospitalist compensation without the need for an increase in other sources of revenue.
So why are collections up? It could be because hospitalists are coding the average visit at a higher level: 2.02 wRVUs per encounter this year compared to 1.97 in 2014 and 1.91 in 2012. The survey can’t help distinguish whether this increase is because we’re seeing more complex patients or whether we’re improving our documentation to catch up with the complexity of the patients we’ve been seeing all along. I suspect it is both.
The increase in wRVUs per encounter, however, is offset by a continued downward trend in numbers of encounters: 1,684 this year compared to 1,850 in 2014 and 2,078 in 2012. The total wRVUs generated per hospitalist in a year stayed about the same at 4,247 compared to 4,298 in 2014.
The best explanation for why total collections are up would be that payor rates have increased. But Medicare, which accounts for about 60%–65% of the payor mix for most hospital medicine groups, hasn’t increased rates enough to explain this, and I’m not aware of other payor classes that have increased significantly. Another explanation could be that hospital medicine groups are simply doing a better job with billing and collections and other revenue-cycle management activities, resulting in increased revenue.
I guess it shouldn’t be surprising that some of the survey results don’t seem internally consistent. The data come from two different surveys, the response rate for each question varies, and other issues mean the survey just can’t provide that level of precision. We also need to keep in mind that analyses like I’ve provided here are only very rough explanations. But I think they’re still valuable to think about even if they don’t provide definitive answers. TH
Reference
- 2016 State of Hospital Medicine Report. Society of Hospital Medicine website. Accessed August 9, 2016.

sSHM’s 2016 State of Hospital Medicine Report (SoHM) is now available, and it’s unquestionably the best source of detail regarding how hospital medicine groups are configured and operated.1
The SoHM is published in even years and combines data from two sources:
- Hospitalist data from Medical Group Management Association’s Physician Compensation and Productivity Survey. Within the SoHM, you will find the same figures for hospitalist compensation, production, and a few related metrics that are from the MGMA survey report.
- SHM’s survey of hospital medicine groups. This survey drills into significant detail on things like scope of clinical practice, staffing levels, work schedules, bonus metrics, CPT code distribution, roles for NPs and PAs, and the amount of financial support provided to the group.
There are several new topics in this year’s SoHM, including CME allowances, utilization of prolonged service codes, and charge capture methodologies being used by hospital medicine groups. My colleague, Leslie Flores, has been very involved in the survey for 10 years and has written a blog with more details.
One Caveat …
The mix of survey respondents varies and includes a much larger portion of hospital medicine groups employed by multi-state management companies than prior surveys. Even if a parameter hasn’t changed for any hospitalist group, the fact that responses come from different contingents of the hospitalist workforce can result in a different result from one survey to the next. It is difficult to be certain if variations across successive surveys reflect a real change in the marketplace or are a function of variation in the respondent population.
Now let’s review and analyze some of this year’s survey findings for hospital medicine groups caring for adults:
Financial Support Stayed Flat
The amount of financial support provided to a hospital medicine group per FTE has increased significantly in every prior survey. This money typically comes from the hospital that the hospital medicine group serves and is sometimes referred to as the “subsidy.” For hospital medicine groups serving adults, it was $139,000 in 2012 and $156,000 in 2014.
The current survey showed a median of $157,500, essentially unchanged from two years prior. This is either an aberration in the survey (e.g., a result of a different survey population) or an indicator that this amount has begun to level off. Clearly, there is an upper limit to the amount of financial support the marketplace can support, but from my experience working with hospitalist groups around the country, I haven’t seen evidence that we’ve reached that point. I suspect it is an aberration and future surveys will show a continued rising trend, though perhaps not as rapidly as in years past.
Compensation Method Is Evolving
A mean of 14.7% of compensation was tied to production, up from around 10% in prior surveys. And the portion tied to performance (e.g., patient satisfaction, quality metrics) was unchanged at 6%. It’s interesting that despite proliferation of pay-for-performance programs and increasing emphasis on quality and value, it is the productivity portion of compensation that increased. It’s hard to know if that is a meaningful trend.
Compensation Amount Continues to Increase
For hospitalists caring for adults, the median amount of compensation rose to $278,746, up from $253,000 in 2014, $234,000 in 2013, and $221,000 in 2011. These figures come from the MGMA survey, and the financial support figures above come from the separate SHM survey. That means it’s impossible to make firm conclusions about how the numbers do or don’t interrelate.
Don’t forget that surveys report all forms of compensation, including base, production, bonus, extra shifts, and other elements. This year’s $278,746 includes all the bonus dollars earned by each hospitalist in the survey. We can make a very rough guess at the bonus by multiplying the portion of total compensation tied to performance in the SHM survey (6%) by the total compensation ($278,746) from the MGMA survey, which comes to $13,397. But we still don’t know the portion of the total bonus dollars available that represents. My experience is that the total bonus dollars available is around $20,000 or more at most hospital medicine groups. Therefore, a doctor who earned $13,397 presumably didn’t meet all performance goals.
A Deeper Dive into Hospital Medicine Group Finances
It is really interesting to ponder where the dollars come from to fund higher hospitalist compensation if the financial support provided per FTE hasn’t increased. Perhaps hospitalists are generating more encounters, work relative value units (wRVUs), or professional fee collections?
Median professional fee collections were $213,000 this year, up from $151,000 in the prior survey two years ago. This increase could, in theory, fully fund the higher hospitalist compensation without the need for an increase in other sources of revenue.
So why are collections up? It could be because hospitalists are coding the average visit at a higher level: 2.02 wRVUs per encounter this year compared to 1.97 in 2014 and 1.91 in 2012. The survey can’t help distinguish whether this increase is because we’re seeing more complex patients or whether we’re improving our documentation to catch up with the complexity of the patients we’ve been seeing all along. I suspect it is both.
The increase in wRVUs per encounter, however, is offset by a continued downward trend in numbers of encounters: 1,684 this year compared to 1,850 in 2014 and 2,078 in 2012. The total wRVUs generated per hospitalist in a year stayed about the same at 4,247 compared to 4,298 in 2014.
The best explanation for why total collections are up would be that payor rates have increased. But Medicare, which accounts for about 60%–65% of the payor mix for most hospital medicine groups, hasn’t increased rates enough to explain this, and I’m not aware of other payor classes that have increased significantly. Another explanation could be that hospital medicine groups are simply doing a better job with billing and collections and other revenue-cycle management activities, resulting in increased revenue.
I guess it shouldn’t be surprising that some of the survey results don’t seem internally consistent. The data come from two different surveys, the response rate for each question varies, and other issues mean the survey just can’t provide that level of precision. We also need to keep in mind that analyses like I’ve provided here are only very rough explanations. But I think they’re still valuable to think about even if they don’t provide definitive answers. TH
Reference
- 2016 State of Hospital Medicine Report. Society of Hospital Medicine website. Accessed August 9, 2016.
sSHM’s 2016 State of Hospital Medicine Report (SoHM) is now available, and it’s unquestionably the best source of detail regarding how hospital medicine groups are configured and operated.1
The SoHM is published in even years and combines data from two sources:
- Hospitalist data from Medical Group Management Association’s Physician Compensation and Productivity Survey. Within the SoHM, you will find the same figures for hospitalist compensation, production, and a few related metrics that are from the MGMA survey report.
- SHM’s survey of hospital medicine groups. This survey drills into significant detail on things like scope of clinical practice, staffing levels, work schedules, bonus metrics, CPT code distribution, roles for NPs and PAs, and the amount of financial support provided to the group.
There are several new topics in this year’s SoHM, including CME allowances, utilization of prolonged service codes, and charge capture methodologies being used by hospital medicine groups. My colleague, Leslie Flores, has been very involved in the survey for 10 years and has written a blog with more details.
One Caveat …
The mix of survey respondents varies and includes a much larger portion of hospital medicine groups employed by multi-state management companies than prior surveys. Even if a parameter hasn’t changed for any hospitalist group, the fact that responses come from different contingents of the hospitalist workforce can result in a different result from one survey to the next. It is difficult to be certain if variations across successive surveys reflect a real change in the marketplace or are a function of variation in the respondent population.
Now let’s review and analyze some of this year’s survey findings for hospital medicine groups caring for adults:
Financial Support Stayed Flat
The amount of financial support provided to a hospital medicine group per FTE has increased significantly in every prior survey. This money typically comes from the hospital that the hospital medicine group serves and is sometimes referred to as the “subsidy.” For hospital medicine groups serving adults, it was $139,000 in 2012 and $156,000 in 2014.
The current survey showed a median of $157,500, essentially unchanged from two years prior. This is either an aberration in the survey (e.g., a result of a different survey population) or an indicator that this amount has begun to level off. Clearly, there is an upper limit to the amount of financial support the marketplace can support, but from my experience working with hospitalist groups around the country, I haven’t seen evidence that we’ve reached that point. I suspect it is an aberration and future surveys will show a continued rising trend, though perhaps not as rapidly as in years past.
Compensation Method Is Evolving
A mean of 14.7% of compensation was tied to production, up from around 10% in prior surveys. And the portion tied to performance (e.g., patient satisfaction, quality metrics) was unchanged at 6%. It’s interesting that despite proliferation of pay-for-performance programs and increasing emphasis on quality and value, it is the productivity portion of compensation that increased. It’s hard to know if that is a meaningful trend.
Compensation Amount Continues to Increase
For hospitalists caring for adults, the median amount of compensation rose to $278,746, up from $253,000 in 2014, $234,000 in 2013, and $221,000 in 2011. These figures come from the MGMA survey, and the financial support figures above come from the separate SHM survey. That means it’s impossible to make firm conclusions about how the numbers do or don’t interrelate.
Don’t forget that surveys report all forms of compensation, including base, production, bonus, extra shifts, and other elements. This year’s $278,746 includes all the bonus dollars earned by each hospitalist in the survey. We can make a very rough guess at the bonus by multiplying the portion of total compensation tied to performance in the SHM survey (6%) by the total compensation ($278,746) from the MGMA survey, which comes to $13,397. But we still don’t know the portion of the total bonus dollars available that represents. My experience is that the total bonus dollars available is around $20,000 or more at most hospital medicine groups. Therefore, a doctor who earned $13,397 presumably didn’t meet all performance goals.
A Deeper Dive into Hospital Medicine Group Finances
It is really interesting to ponder where the dollars come from to fund higher hospitalist compensation if the financial support provided per FTE hasn’t increased. Perhaps hospitalists are generating more encounters, work relative value units (wRVUs), or professional fee collections?
Median professional fee collections were $213,000 this year, up from $151,000 in the prior survey two years ago. This increase could, in theory, fully fund the higher hospitalist compensation without the need for an increase in other sources of revenue.
So why are collections up? It could be because hospitalists are coding the average visit at a higher level: 2.02 wRVUs per encounter this year compared to 1.97 in 2014 and 1.91 in 2012. The survey can’t help distinguish whether this increase is because we’re seeing more complex patients or whether we’re improving our documentation to catch up with the complexity of the patients we’ve been seeing all along. I suspect it is both.
The increase in wRVUs per encounter, however, is offset by a continued downward trend in numbers of encounters: 1,684 this year compared to 1,850 in 2014 and 2,078 in 2012. The total wRVUs generated per hospitalist in a year stayed about the same at 4,247 compared to 4,298 in 2014.
The best explanation for why total collections are up would be that payor rates have increased. But Medicare, which accounts for about 60%–65% of the payor mix for most hospital medicine groups, hasn’t increased rates enough to explain this, and I’m not aware of other payor classes that have increased significantly. Another explanation could be that hospital medicine groups are simply doing a better job with billing and collections and other revenue-cycle management activities, resulting in increased revenue.
I guess it shouldn’t be surprising that some of the survey results don’t seem internally consistent. The data come from two different surveys, the response rate for each question varies, and other issues mean the survey just can’t provide that level of precision. We also need to keep in mind that analyses like I’ve provided here are only very rough explanations. But I think they’re still valuable to think about even if they don’t provide definitive answers. TH
Reference
- 2016 State of Hospital Medicine Report. Society of Hospital Medicine website. Accessed August 9, 2016.
FDA advises testing all donated blood for Zika virus
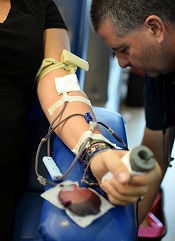
The US Food and Drug Administration (FDA) has issued a revised guidance intended to reduce the risk of Zika virus transmission via blood.
The guidance recommends that all states and US territories screen donated whole blood and blood components for the Zika virus with a test authorized under an investigational new drug application or a licensed test when available.
For plasma and certain platelet products, an FDA-approved pathogen-reduction device can be used instead of a screening test.
“There is still much uncertainty regarding the nature and extent of Zika virus transmission,” said Peter Marks, MD, PhD, director of the FDA’s Center for Biologics Evaluation and Research.
“At this time, the recommendation for testing the entire blood supply will help ensure that safe blood is available for all individuals who might need transfusion.”
In February, the FDA issued a guidance recommending that areas with active Zika virus transmission screen donated whole blood and blood components for the Zika virus, use pathogen-reduction devices, or halt blood collection and obtain blood from areas of the US without active virus transmission.
The FDA decided to update its guidance after considering the available scientific evidence, consulting with other public health agencies, and taking into consideration the potential serious health consequences of Zika virus infection to pregnant women and children born to women exposed to Zika virus during pregnancy.
“As new scientific and epidemiological information regarding Zika virus has become available, it’s clear that additional precautionary measures are necessary,” said Luciana Borio, MD, the FDA’s acting chief scientist.
“We are issuing revised guidance for immediate implementation in order to help maintain the safety of the US blood supply.”
Testing of donated blood is already underway in Florida, Puerto Rico, and other areas, and it has proven effective in identifying donations infected with Zika virus.
The FDA said nationwide testing will be in effect until the risk of Zika virus transmission via transfusion is reduced. 
The US Food and Drug Administration (FDA) has issued a revised guidance intended to reduce the risk of Zika virus transmission via blood.
The guidance recommends that all states and US territories screen donated whole blood and blood components for the Zika virus with a test authorized under an investigational new drug application or a licensed test when available.
For plasma and certain platelet products, an FDA-approved pathogen-reduction device can be used instead of a screening test.
“There is still much uncertainty regarding the nature and extent of Zika virus transmission,” said Peter Marks, MD, PhD, director of the FDA’s Center for Biologics Evaluation and Research.
“At this time, the recommendation for testing the entire blood supply will help ensure that safe blood is available for all individuals who might need transfusion.”
In February, the FDA issued a guidance recommending that areas with active Zika virus transmission screen donated whole blood and blood components for the Zika virus, use pathogen-reduction devices, or halt blood collection and obtain blood from areas of the US without active virus transmission.
The FDA decided to update its guidance after considering the available scientific evidence, consulting with other public health agencies, and taking into consideration the potential serious health consequences of Zika virus infection to pregnant women and children born to women exposed to Zika virus during pregnancy.
“As new scientific and epidemiological information regarding Zika virus has become available, it’s clear that additional precautionary measures are necessary,” said Luciana Borio, MD, the FDA’s acting chief scientist.
“We are issuing revised guidance for immediate implementation in order to help maintain the safety of the US blood supply.”
Testing of donated blood is already underway in Florida, Puerto Rico, and other areas, and it has proven effective in identifying donations infected with Zika virus.
The FDA said nationwide testing will be in effect until the risk of Zika virus transmission via transfusion is reduced.
The US Food and Drug Administration (FDA) has issued a revised guidance intended to reduce the risk of Zika virus transmission via blood.
The guidance recommends that all states and US territories screen donated whole blood and blood components for the Zika virus with a test authorized under an investigational new drug application or a licensed test when available.
For plasma and certain platelet products, an FDA-approved pathogen-reduction device can be used instead of a screening test.
“There is still much uncertainty regarding the nature and extent of Zika virus transmission,” said Peter Marks, MD, PhD, director of the FDA’s Center for Biologics Evaluation and Research.
“At this time, the recommendation for testing the entire blood supply will help ensure that safe blood is available for all individuals who might need transfusion.”
In February, the FDA issued a guidance recommending that areas with active Zika virus transmission screen donated whole blood and blood components for the Zika virus, use pathogen-reduction devices, or halt blood collection and obtain blood from areas of the US without active virus transmission.
The FDA decided to update its guidance after considering the available scientific evidence, consulting with other public health agencies, and taking into consideration the potential serious health consequences of Zika virus infection to pregnant women and children born to women exposed to Zika virus during pregnancy.
“As new scientific and epidemiological information regarding Zika virus has become available, it’s clear that additional precautionary measures are necessary,” said Luciana Borio, MD, the FDA’s acting chief scientist.
“We are issuing revised guidance for immediate implementation in order to help maintain the safety of the US blood supply.”
Testing of donated blood is already underway in Florida, Puerto Rico, and other areas, and it has proven effective in identifying donations infected with Zika virus.
The FDA said nationwide testing will be in effect until the risk of Zika virus transmission via transfusion is reduced.
Hyperammonemia May Signal the Presence of Generalized Convulsive Seizures
Elevated blood ammonia levels may help differentiate epileptic generalized convulsive seizures (GCS) from other events, suggests a recent report in Epilepsia. When Rawan Albadareen and associates measured blood ammonia levels in 78 patients with GCS, psychogenic nonepileptic seizures with convulsions (PNES-C), or focal seizures using video–electroencephalography (vEEG) monitoring, they discovered that ammonia levels at or above 80 μmol/L could classify generalized convulsive seizures in 80% of patients with a sensitivity of 53.9% and specificity of 100%. Their findings suggest that transient hyperammonemia may serve as an inexpensive test for the diagnosis of GCS.
Albadareen R, Gronseth G, Landazuri P, et al. Postictal ammonia as a biomarker for electrographic convulsive seizures: a prospective study. Epilepsia. 2016;57(8): 1221-1227.
Elevated blood ammonia levels may help differentiate epileptic generalized convulsive seizures (GCS) from other events, suggests a recent report in Epilepsia. When Rawan Albadareen and associates measured blood ammonia levels in 78 patients with GCS, psychogenic nonepileptic seizures with convulsions (PNES-C), or focal seizures using video–electroencephalography (vEEG) monitoring, they discovered that ammonia levels at or above 80 μmol/L could classify generalized convulsive seizures in 80% of patients with a sensitivity of 53.9% and specificity of 100%. Their findings suggest that transient hyperammonemia may serve as an inexpensive test for the diagnosis of GCS.
Albadareen R, Gronseth G, Landazuri P, et al. Postictal ammonia as a biomarker for electrographic convulsive seizures: a prospective study. Epilepsia. 2016;57(8): 1221-1227.
Elevated blood ammonia levels may help differentiate epileptic generalized convulsive seizures (GCS) from other events, suggests a recent report in Epilepsia. When Rawan Albadareen and associates measured blood ammonia levels in 78 patients with GCS, psychogenic nonepileptic seizures with convulsions (PNES-C), or focal seizures using video–electroencephalography (vEEG) monitoring, they discovered that ammonia levels at or above 80 μmol/L could classify generalized convulsive seizures in 80% of patients with a sensitivity of 53.9% and specificity of 100%. Their findings suggest that transient hyperammonemia may serve as an inexpensive test for the diagnosis of GCS.
Albadareen R, Gronseth G, Landazuri P, et al. Postictal ammonia as a biomarker for electrographic convulsive seizures: a prospective study. Epilepsia. 2016;57(8): 1221-1227.
Finding a Link Between Ictal Fear and Auras
In order to determine if there is an association between ictal fear and other auras and with patients’ gender and age, investigators analyzed 536 participants in the Epilepsy Phenome/Genome Project. Among 36 patients with confirmed ictal fear, the phenomenon was associated with temporal lobe auras, including cephalic, olfactory, and visceral symptoms, as well as déjà vu and derealization. Aphasias were also correlated with ictal fear but researchers found no link between such fear and age or gender.
Chong DJ, Dugan P; The EPGP Investigators. Ictal fear: associations with age, gender, and other experiential phenomena. Epilepsy Behav. 2016;62:153-158.
In order to determine if there is an association between ictal fear and other auras and with patients’ gender and age, investigators analyzed 536 participants in the Epilepsy Phenome/Genome Project. Among 36 patients with confirmed ictal fear, the phenomenon was associated with temporal lobe auras, including cephalic, olfactory, and visceral symptoms, as well as déjà vu and derealization. Aphasias were also correlated with ictal fear but researchers found no link between such fear and age or gender.
Chong DJ, Dugan P; The EPGP Investigators. Ictal fear: associations with age, gender, and other experiential phenomena. Epilepsy Behav. 2016;62:153-158.
In order to determine if there is an association between ictal fear and other auras and with patients’ gender and age, investigators analyzed 536 participants in the Epilepsy Phenome/Genome Project. Among 36 patients with confirmed ictal fear, the phenomenon was associated with temporal lobe auras, including cephalic, olfactory, and visceral symptoms, as well as déjà vu and derealization. Aphasias were also correlated with ictal fear but researchers found no link between such fear and age or gender.
Chong DJ, Dugan P; The EPGP Investigators. Ictal fear: associations with age, gender, and other experiential phenomena. Epilepsy Behav. 2016;62:153-158.
JZP-110 May Have Low Potential for Abuse
DENVER—The abuse potential of the investigational drug JZP-110 may be similar to or lower than that of the Schedule IV stimulant phentermine, according to data presented at the 30th Anniversary Meeting of the Associated Professional Sleep Societies. Results also indicate that the 300-mg therapeutic dose of JZP-110 is well tolerated and entails no new safety concerns.
JZP-110 is a selective dopamine and norepinephrine reuptake inhibitor and wake-promoting agent under evaluation for the treatment of narcolepsy and obstructive sleep apnea. The use of some therapies for narcolepsy is limited by their abuse potential. Lawrence P. Carter, PhD, Senior Director in Clinical Development at Jazz Pharmaceuticals and Assistant Professor of Pharmacology and Toxicology at the University of Arkansas for Medical Sciences in Little Rock, and colleagues sought to evaluate the abuse potential of JZP-110, compared with phentermine as a positive control in a human abuse liability study.
Eligible participants were healthy individuals between ages 18 and 55, had a self-reported history of recreational polydrug use, and had used a stimulant recreationally 10 or more times in the previous five years and once or more in the previous three months. Participants who tolerated phentermine in a qualification phase and who preferred it to placebo were enrolled in the test phase. In the test phase, participants were randomized to one of six double-blind treatment sequences that included single administration of placebo; 300-mg, 600-mg, and 1,200-mg doses of JZP-110; and 45-mg and 90-mg doses of phentermine. The primary end point was peak rating of Liking at the Moment during the first 12 hours on the Visual Analog Scale (VAS). Secondary end points included retrospective VAS ratings at 24 hours after administration for Overall Drug Liking, and how much the participant would like to take the drug again.
In all, 43 participants (mean age, 29.3) were enrolled, 74.4% of whom were African American. Thirty-seven participants completed the study, and two discontinued the study because of adverse events. Liking at the Moment was generally greater after taking phentermine than after taking JZP-110. For all doses of JZP-110, peak Liking at the Moment was significantly greater than for placebo and significantly less than for 90 mg of phentermine. Retrospective evaluation of Overall Drug Liking for JZP-110 at 600 mg and 1,200 mg was not significantly different from placebo and was significantly less than both doses of phentermine. At all doses of JZP-110, participants were significantly less willing to take the drug again, compared with both doses of phentermine.
—Erik Greb
DENVER—The abuse potential of the investigational drug JZP-110 may be similar to or lower than that of the Schedule IV stimulant phentermine, according to data presented at the 30th Anniversary Meeting of the Associated Professional Sleep Societies. Results also indicate that the 300-mg therapeutic dose of JZP-110 is well tolerated and entails no new safety concerns.
JZP-110 is a selective dopamine and norepinephrine reuptake inhibitor and wake-promoting agent under evaluation for the treatment of narcolepsy and obstructive sleep apnea. The use of some therapies for narcolepsy is limited by their abuse potential. Lawrence P. Carter, PhD, Senior Director in Clinical Development at Jazz Pharmaceuticals and Assistant Professor of Pharmacology and Toxicology at the University of Arkansas for Medical Sciences in Little Rock, and colleagues sought to evaluate the abuse potential of JZP-110, compared with phentermine as a positive control in a human abuse liability study.
Eligible participants were healthy individuals between ages 18 and 55, had a self-reported history of recreational polydrug use, and had used a stimulant recreationally 10 or more times in the previous five years and once or more in the previous three months. Participants who tolerated phentermine in a qualification phase and who preferred it to placebo were enrolled in the test phase. In the test phase, participants were randomized to one of six double-blind treatment sequences that included single administration of placebo; 300-mg, 600-mg, and 1,200-mg doses of JZP-110; and 45-mg and 90-mg doses of phentermine. The primary end point was peak rating of Liking at the Moment during the first 12 hours on the Visual Analog Scale (VAS). Secondary end points included retrospective VAS ratings at 24 hours after administration for Overall Drug Liking, and how much the participant would like to take the drug again.
In all, 43 participants (mean age, 29.3) were enrolled, 74.4% of whom were African American. Thirty-seven participants completed the study, and two discontinued the study because of adverse events. Liking at the Moment was generally greater after taking phentermine than after taking JZP-110. For all doses of JZP-110, peak Liking at the Moment was significantly greater than for placebo and significantly less than for 90 mg of phentermine. Retrospective evaluation of Overall Drug Liking for JZP-110 at 600 mg and 1,200 mg was not significantly different from placebo and was significantly less than both doses of phentermine. At all doses of JZP-110, participants were significantly less willing to take the drug again, compared with both doses of phentermine.
—Erik Greb
DENVER—The abuse potential of the investigational drug JZP-110 may be similar to or lower than that of the Schedule IV stimulant phentermine, according to data presented at the 30th Anniversary Meeting of the Associated Professional Sleep Societies. Results also indicate that the 300-mg therapeutic dose of JZP-110 is well tolerated and entails no new safety concerns.
JZP-110 is a selective dopamine and norepinephrine reuptake inhibitor and wake-promoting agent under evaluation for the treatment of narcolepsy and obstructive sleep apnea. The use of some therapies for narcolepsy is limited by their abuse potential. Lawrence P. Carter, PhD, Senior Director in Clinical Development at Jazz Pharmaceuticals and Assistant Professor of Pharmacology and Toxicology at the University of Arkansas for Medical Sciences in Little Rock, and colleagues sought to evaluate the abuse potential of JZP-110, compared with phentermine as a positive control in a human abuse liability study.
Eligible participants were healthy individuals between ages 18 and 55, had a self-reported history of recreational polydrug use, and had used a stimulant recreationally 10 or more times in the previous five years and once or more in the previous three months. Participants who tolerated phentermine in a qualification phase and who preferred it to placebo were enrolled in the test phase. In the test phase, participants were randomized to one of six double-blind treatment sequences that included single administration of placebo; 300-mg, 600-mg, and 1,200-mg doses of JZP-110; and 45-mg and 90-mg doses of phentermine. The primary end point was peak rating of Liking at the Moment during the first 12 hours on the Visual Analog Scale (VAS). Secondary end points included retrospective VAS ratings at 24 hours after administration for Overall Drug Liking, and how much the participant would like to take the drug again.
In all, 43 participants (mean age, 29.3) were enrolled, 74.4% of whom were African American. Thirty-seven participants completed the study, and two discontinued the study because of adverse events. Liking at the Moment was generally greater after taking phentermine than after taking JZP-110. For all doses of JZP-110, peak Liking at the Moment was significantly greater than for placebo and significantly less than for 90 mg of phentermine. Retrospective evaluation of Overall Drug Liking for JZP-110 at 600 mg and 1,200 mg was not significantly different from placebo and was significantly less than both doses of phentermine. At all doses of JZP-110, participants were significantly less willing to take the drug again, compared with both doses of phentermine.
—Erik Greb
Take back a patient who fired you? No way
I refuse to do retreads.
This has nothing to do with my car. If a retread tire gives me the same performance and safety at a lower price, I’m all for it.
Sometimes patients fire me. This is often acrimonious, with them sending me a letter complaining about my competence, bedside manner, personal appearance, staff, office decor, phone system ... whatever. For some reason they weren’t happy with me and instead of just sending a release of records, they decided to let me know in no uncertain terms that they aren’t coming back. We all get these notes.

When I was younger this would really upset me. I took a lot of things personally when I first started out. Now, after almost 20 years on the neurology front lines, it’s just another day. I learned a long time ago that you can’t please everyone or be the doctor they all love. So I fax their chart to wherever they want and move on.
Surprisingly, a few times a year patients will try to come back. Maybe they didn’t like the new doc, or are sorry about their outburst, or can’t find someone else nearby who takes their insurance. So they call and try to make a follow-up. Not surprisingly, they never mention their previous letter. When it’s brought up, they typically claim we misinterpreted it, that they didn’t mean it, or that they’ve decided to forgive me.
This is what I call a retread. A patient who wants to come back after leaving under unpleasant circumstances. I don’t allow it.
To me the doctor-patient relationship is based on trust and objectivity. Once a patient sends an acrimonious letter, it’s very difficult to return to an impartial condition. The fact that they did it once means they may do it again, or think they can get their way with threatening or insulting behavior. These are not things that are good for the connection between us.
So I turn them away. Some just hang up. Others yell, and a few threaten me with legal action. But I don’t back down. Do you want to care for someone who’s done the same to you?
This is a high-stress field. I don’t need the additional distraction of dealing with a toxic medical relationship. If you don’t like me, I have no issue with that. Not everyone does. But once you’ve made that decision, you’re stuck with it.
Dr. Block has a solo neurology practice in Scottsdale, Ariz.
I refuse to do retreads.
This has nothing to do with my car. If a retread tire gives me the same performance and safety at a lower price, I’m all for it.
Sometimes patients fire me. This is often acrimonious, with them sending me a letter complaining about my competence, bedside manner, personal appearance, staff, office decor, phone system ... whatever. For some reason they weren’t happy with me and instead of just sending a release of records, they decided to let me know in no uncertain terms that they aren’t coming back. We all get these notes.
When I was younger this would really upset me. I took a lot of things personally when I first started out. Now, after almost 20 years on the neurology front lines, it’s just another day. I learned a long time ago that you can’t please everyone or be the doctor they all love. So I fax their chart to wherever they want and move on.
Surprisingly, a few times a year patients will try to come back. Maybe they didn’t like the new doc, or are sorry about their outburst, or can’t find someone else nearby who takes their insurance. So they call and try to make a follow-up. Not surprisingly, they never mention their previous letter. When it’s brought up, they typically claim we misinterpreted it, that they didn’t mean it, or that they’ve decided to forgive me.
This is what I call a retread. A patient who wants to come back after leaving under unpleasant circumstances. I don’t allow it.
To me the doctor-patient relationship is based on trust and objectivity. Once a patient sends an acrimonious letter, it’s very difficult to return to an impartial condition. The fact that they did it once means they may do it again, or think they can get their way with threatening or insulting behavior. These are not things that are good for the connection between us.
So I turn them away. Some just hang up. Others yell, and a few threaten me with legal action. But I don’t back down. Do you want to care for someone who’s done the same to you?
This is a high-stress field. I don’t need the additional distraction of dealing with a toxic medical relationship. If you don’t like me, I have no issue with that. Not everyone does. But once you’ve made that decision, you’re stuck with it.
Dr. Block has a solo neurology practice in Scottsdale, Ariz.
I refuse to do retreads.
This has nothing to do with my car. If a retread tire gives me the same performance and safety at a lower price, I’m all for it.
Sometimes patients fire me. This is often acrimonious, with them sending me a letter complaining about my competence, bedside manner, personal appearance, staff, office decor, phone system ... whatever. For some reason they weren’t happy with me and instead of just sending a release of records, they decided to let me know in no uncertain terms that they aren’t coming back. We all get these notes.
When I was younger this would really upset me. I took a lot of things personally when I first started out. Now, after almost 20 years on the neurology front lines, it’s just another day. I learned a long time ago that you can’t please everyone or be the doctor they all love. So I fax their chart to wherever they want and move on.
Surprisingly, a few times a year patients will try to come back. Maybe they didn’t like the new doc, or are sorry about their outburst, or can’t find someone else nearby who takes their insurance. So they call and try to make a follow-up. Not surprisingly, they never mention their previous letter. When it’s brought up, they typically claim we misinterpreted it, that they didn’t mean it, or that they’ve decided to forgive me.
This is what I call a retread. A patient who wants to come back after leaving under unpleasant circumstances. I don’t allow it.
To me the doctor-patient relationship is based on trust and objectivity. Once a patient sends an acrimonious letter, it’s very difficult to return to an impartial condition. The fact that they did it once means they may do it again, or think they can get their way with threatening or insulting behavior. These are not things that are good for the connection between us.
So I turn them away. Some just hang up. Others yell, and a few threaten me with legal action. But I don’t back down. Do you want to care for someone who’s done the same to you?
This is a high-stress field. I don’t need the additional distraction of dealing with a toxic medical relationship. If you don’t like me, I have no issue with that. Not everyone does. But once you’ve made that decision, you’re stuck with it.
Dr. Block has a solo neurology practice in Scottsdale, Ariz.

IPF Patient Registry will expand
The number of patients enrolled in the Idiopathic Pulmonary Fibrosis–Prospective Outcomes (IPF-PRO) Registry will be increased to 1,500, Boehringer Ingelheim Pharmaceuticals and the Duke Clinical Research Institute have announced.
The organizations plan to accomplish this goal by increasing the number of sites they use to gather IPF patient data, according to a statement; the patients enrolled in the registry will now come from 45 sites instead of 18 sites.
IPF-PRO, which was launched in June 2014, is the first multicenter longitudinal disease state registry in the United States focused specifically on IPF. It was designed for the purpose of studying the progression of IPF and the effectiveness of various treatment approaches for the disease. The registry includes a biorepository that stores blood samples that provide patient genetic material.
“In collecting data from a larger, more diverse group of patients ... this registry will allow us to better assess the impact of the disease over time on clinical and patient-centered outcomes,” said Scott M. Palmer, MD, director of pulmonary research at the Duke Clinical Research Institute, Durham, N.C., in the statement.
More information on the registry is available at clinicaltrials.gov/ct2/show/NCT01915511.
The number of patients enrolled in the Idiopathic Pulmonary Fibrosis–Prospective Outcomes (IPF-PRO) Registry will be increased to 1,500, Boehringer Ingelheim Pharmaceuticals and the Duke Clinical Research Institute have announced.
The organizations plan to accomplish this goal by increasing the number of sites they use to gather IPF patient data, according to a statement; the patients enrolled in the registry will now come from 45 sites instead of 18 sites.
IPF-PRO, which was launched in June 2014, is the first multicenter longitudinal disease state registry in the United States focused specifically on IPF. It was designed for the purpose of studying the progression of IPF and the effectiveness of various treatment approaches for the disease. The registry includes a biorepository that stores blood samples that provide patient genetic material.
“In collecting data from a larger, more diverse group of patients ... this registry will allow us to better assess the impact of the disease over time on clinical and patient-centered outcomes,” said Scott M. Palmer, MD, director of pulmonary research at the Duke Clinical Research Institute, Durham, N.C., in the statement.
More information on the registry is available at clinicaltrials.gov/ct2/show/NCT01915511.
The number of patients enrolled in the Idiopathic Pulmonary Fibrosis–Prospective Outcomes (IPF-PRO) Registry will be increased to 1,500, Boehringer Ingelheim Pharmaceuticals and the Duke Clinical Research Institute have announced.
The organizations plan to accomplish this goal by increasing the number of sites they use to gather IPF patient data, according to a statement; the patients enrolled in the registry will now come from 45 sites instead of 18 sites.
IPF-PRO, which was launched in June 2014, is the first multicenter longitudinal disease state registry in the United States focused specifically on IPF. It was designed for the purpose of studying the progression of IPF and the effectiveness of various treatment approaches for the disease. The registry includes a biorepository that stores blood samples that provide patient genetic material.
“In collecting data from a larger, more diverse group of patients ... this registry will allow us to better assess the impact of the disease over time on clinical and patient-centered outcomes,” said Scott M. Palmer, MD, director of pulmonary research at the Duke Clinical Research Institute, Durham, N.C., in the statement.
More information on the registry is available at clinicaltrials.gov/ct2/show/NCT01915511.
Investigational Drug Improves Maintenance of Wakefulness
DENVER—An investigational drug known as JZP-110 significantly improves the ability to stay awake, compared with placebo, in patients with narcolepsy, according to data presented at the 30th Anniversary Meeting of the Associated Professional Sleep Societies. The large effect sizes associated with the drug confirm the robustness of the results, according to the researchers.
JZP-110 is a selective dopamine and norepinephrine reuptake inhibitor in development as a treatment for excessive sleepiness and impaired wakefulness associated with narcolepsy and obstructive sleep apnea. In phase II trials, the drug improved wakefulness, compared with placebo, on the 40-minute Maintenance of Wakefulness Test (MWT). Studies of other agents, however, have reported sleep latency results using a 20-minute MWT.
Chad Ruoff, MD, Clinical Assistant Professor of Psychiatry and Behavioral Sciences at the Stanford Center for Sleep Sciences and Medicine in California, and colleagues conducted a post hoc analysis of data from two phase II trials to evaluate changes from baseline in mean MWT sleep latency associated with JZP-110, censoring data to include only the first 20 minutes of the 40-minute MWT. In one study, 33 adults with narcolepsy (with or without cataplexy) were randomized to receive two weeks of treatment with placebo or JZP-110. Active treatment was administered at a dose of 150 mg/day during the first week and at a dose of 300 mg/day during the second week. In the second study, 93 adults with narcolepsy (with or without cataplexy) were randomized to receive placebo or JZP-110 for 12 weeks. The dose of drug was 150 mg/day during the first four weeks and 300 mg/day for the remaining eight weeks.

Regardless of whether the data were censored at 20 minutes or at 40 minutes, JZP-110 resulted in a statistically significant increase from baseline in MWT sleep latency, compared with placebo, in both studies. In the first study, mean changes in sleep latency were 12.7 minutes with the drug versus 0.9 minutes with placebo when censored at 40 minutes. The changes were 8.9 minutes with drug and 0.4 minutes with placebo when data were censored at 20 minutes. In the second study, mean changes in MWT were 12.8 minutes with JZP-110 and 2.1 minutes with placebo when data were censored at 40 minutes. Mean changes were 8.9 minutes for drug and 1.1 minutes for placebo when data were censored at 20 minutes.
Effect sizes were large and slightly greater for 20-minute censored data (1.54 in the first study and 1.41 in the second study) than for 40-minute censored data (1.37 in the first study and 1.17 in the second study). Researchers observed two serious adverse events--one case of conversion disorder and one case of acute cholecystitis--that they considered unrelated to the study drug. Few discontinuations resulted from adverse events.
—Erik Greb
DENVER—An investigational drug known as JZP-110 significantly improves the ability to stay awake, compared with placebo, in patients with narcolepsy, according to data presented at the 30th Anniversary Meeting of the Associated Professional Sleep Societies. The large effect sizes associated with the drug confirm the robustness of the results, according to the researchers.
JZP-110 is a selective dopamine and norepinephrine reuptake inhibitor in development as a treatment for excessive sleepiness and impaired wakefulness associated with narcolepsy and obstructive sleep apnea. In phase II trials, the drug improved wakefulness, compared with placebo, on the 40-minute Maintenance of Wakefulness Test (MWT). Studies of other agents, however, have reported sleep latency results using a 20-minute MWT.
Chad Ruoff, MD, Clinical Assistant Professor of Psychiatry and Behavioral Sciences at the Stanford Center for Sleep Sciences and Medicine in California, and colleagues conducted a post hoc analysis of data from two phase II trials to evaluate changes from baseline in mean MWT sleep latency associated with JZP-110, censoring data to include only the first 20 minutes of the 40-minute MWT. In one study, 33 adults with narcolepsy (with or without cataplexy) were randomized to receive two weeks of treatment with placebo or JZP-110. Active treatment was administered at a dose of 150 mg/day during the first week and at a dose of 300 mg/day during the second week. In the second study, 93 adults with narcolepsy (with or without cataplexy) were randomized to receive placebo or JZP-110 for 12 weeks. The dose of drug was 150 mg/day during the first four weeks and 300 mg/day for the remaining eight weeks.
Regardless of whether the data were censored at 20 minutes or at 40 minutes, JZP-110 resulted in a statistically significant increase from baseline in MWT sleep latency, compared with placebo, in both studies. In the first study, mean changes in sleep latency were 12.7 minutes with the drug versus 0.9 minutes with placebo when censored at 40 minutes. The changes were 8.9 minutes with drug and 0.4 minutes with placebo when data were censored at 20 minutes. In the second study, mean changes in MWT were 12.8 minutes with JZP-110 and 2.1 minutes with placebo when data were censored at 40 minutes. Mean changes were 8.9 minutes for drug and 1.1 minutes for placebo when data were censored at 20 minutes.
Effect sizes were large and slightly greater for 20-minute censored data (1.54 in the first study and 1.41 in the second study) than for 40-minute censored data (1.37 in the first study and 1.17 in the second study). Researchers observed two serious adverse events--one case of conversion disorder and one case of acute cholecystitis--that they considered unrelated to the study drug. Few discontinuations resulted from adverse events.
—Erik Greb
DENVER—An investigational drug known as JZP-110 significantly improves the ability to stay awake, compared with placebo, in patients with narcolepsy, according to data presented at the 30th Anniversary Meeting of the Associated Professional Sleep Societies. The large effect sizes associated with the drug confirm the robustness of the results, according to the researchers.
JZP-110 is a selective dopamine and norepinephrine reuptake inhibitor in development as a treatment for excessive sleepiness and impaired wakefulness associated with narcolepsy and obstructive sleep apnea. In phase II trials, the drug improved wakefulness, compared with placebo, on the 40-minute Maintenance of Wakefulness Test (MWT). Studies of other agents, however, have reported sleep latency results using a 20-minute MWT.
Chad Ruoff, MD, Clinical Assistant Professor of Psychiatry and Behavioral Sciences at the Stanford Center for Sleep Sciences and Medicine in California, and colleagues conducted a post hoc analysis of data from two phase II trials to evaluate changes from baseline in mean MWT sleep latency associated with JZP-110, censoring data to include only the first 20 minutes of the 40-minute MWT. In one study, 33 adults with narcolepsy (with or without cataplexy) were randomized to receive two weeks of treatment with placebo or JZP-110. Active treatment was administered at a dose of 150 mg/day during the first week and at a dose of 300 mg/day during the second week. In the second study, 93 adults with narcolepsy (with or without cataplexy) were randomized to receive placebo or JZP-110 for 12 weeks. The dose of drug was 150 mg/day during the first four weeks and 300 mg/day for the remaining eight weeks.
Regardless of whether the data were censored at 20 minutes or at 40 minutes, JZP-110 resulted in a statistically significant increase from baseline in MWT sleep latency, compared with placebo, in both studies. In the first study, mean changes in sleep latency were 12.7 minutes with the drug versus 0.9 minutes with placebo when censored at 40 minutes. The changes were 8.9 minutes with drug and 0.4 minutes with placebo when data were censored at 20 minutes. In the second study, mean changes in MWT were 12.8 minutes with JZP-110 and 2.1 minutes with placebo when data were censored at 40 minutes. Mean changes were 8.9 minutes for drug and 1.1 minutes for placebo when data were censored at 20 minutes.
Effect sizes were large and slightly greater for 20-minute censored data (1.54 in the first study and 1.41 in the second study) than for 40-minute censored data (1.37 in the first study and 1.17 in the second study). Researchers observed two serious adverse events--one case of conversion disorder and one case of acute cholecystitis--that they considered unrelated to the study drug. Few discontinuations resulted from adverse events.
—Erik Greb

Remission of lupus often short-lasting and variable
The time it takes for patients with systemic lupus erythematosus to achieve remission greatly depends on how remission is defined, and such episodes are usually short-lasting, according to an analysis of more than 2,000 patients in the Hopkins Lupus Cohort.
“Our results concerning durability of remission show the relapsing-remitting nature of SLE [systemic lupus erythematosus]. The median duration of remission was only about 3 months for all [four] definitions [used in the study]. This was the time to the next quarterly cohort visit. Even though achieving remission was frequent, durable remission was rare,” wrote the authors, led by Theresa R. Wilhelm, MD, of Johns Hopkins University in Baltimore.
Dr. Wilhelm and her coauthors chose to examine remission in SLE based on four DORIS (Definitions Of Remission In SLE) working group clinical definitions: clinical remission, complete remission, clinical ROT (Remission on Treatment), and complete ROT. To define them, a clinical SLE Disease Activity Index (cSLEDAI) score of 0 and a Physician Global Assessment of less than 0.5 were applicable to all definitions. Zero prednisone was applicable to clinical and complete remission, while clinical ROT and complete ROT allowed for 5 mg or less daily. Immunosuppressive drugs were not allowed for a patient to be deemed in either clinical or complete remission, but were allowed for both ROT definitions. Serologically negative results were deemed permissible for both complete remission and ROT, but not for clinical remission or clinical ROT (Ann Rheum Dis. 2016 Aug 24. doi: 10.1136/annrheumdis-2016-209489).
For a total of 2,307 SLE patients who were enrolled into the Hopkins Lupus Cohort during 1987-2014, the median time for clinical remission to be achieved was 8.7 years, while complete remission took 11.0 years, clinical ROT took 1.8 years, and complete ROT took 3.1 years. These Kaplan-Meier estimates of the distribution of time to remission after entry into the cohort did not include patients who had a gap in their follow-up or dropped out before satisfying the definition of remission.
However, across all four definitions, the median length of remission was only 3 months, as sustained remission proved elusive. Those with high disease activity and greater treatment had longer median times to achieve remission than did those with low disease activity and less treatment.
“Not surprisingly, we found that the level of baseline treatment and baseline disease activity were strongly associated with the time to remission for all definitions,” Dr. Wilhelm and her coauthors noted.
“Testing definitions of remission is of great relevance for clinical practice, as much as for clinical trials,” the authors concluded. “Our future goal is to find out which definitions are most successful in predicting the best possible outcome for our patients.”
The Hopkins Lupus Cohort receives funding from the National Institutes of Health. Dr. Wilhelm and her coauthors did not report any relevant financial disclosures.
The time it takes for patients with systemic lupus erythematosus to achieve remission greatly depends on how remission is defined, and such episodes are usually short-lasting, according to an analysis of more than 2,000 patients in the Hopkins Lupus Cohort.
“Our results concerning durability of remission show the relapsing-remitting nature of SLE [systemic lupus erythematosus]. The median duration of remission was only about 3 months for all [four] definitions [used in the study]. This was the time to the next quarterly cohort visit. Even though achieving remission was frequent, durable remission was rare,” wrote the authors, led by Theresa R. Wilhelm, MD, of Johns Hopkins University in Baltimore.
Dr. Wilhelm and her coauthors chose to examine remission in SLE based on four DORIS (Definitions Of Remission In SLE) working group clinical definitions: clinical remission, complete remission, clinical ROT (Remission on Treatment), and complete ROT. To define them, a clinical SLE Disease Activity Index (cSLEDAI) score of 0 and a Physician Global Assessment of less than 0.5 were applicable to all definitions. Zero prednisone was applicable to clinical and complete remission, while clinical ROT and complete ROT allowed for 5 mg or less daily. Immunosuppressive drugs were not allowed for a patient to be deemed in either clinical or complete remission, but were allowed for both ROT definitions. Serologically negative results were deemed permissible for both complete remission and ROT, but not for clinical remission or clinical ROT (Ann Rheum Dis. 2016 Aug 24. doi: 10.1136/annrheumdis-2016-209489).
For a total of 2,307 SLE patients who were enrolled into the Hopkins Lupus Cohort during 1987-2014, the median time for clinical remission to be achieved was 8.7 years, while complete remission took 11.0 years, clinical ROT took 1.8 years, and complete ROT took 3.1 years. These Kaplan-Meier estimates of the distribution of time to remission after entry into the cohort did not include patients who had a gap in their follow-up or dropped out before satisfying the definition of remission.
However, across all four definitions, the median length of remission was only 3 months, as sustained remission proved elusive. Those with high disease activity and greater treatment had longer median times to achieve remission than did those with low disease activity and less treatment.
“Not surprisingly, we found that the level of baseline treatment and baseline disease activity were strongly associated with the time to remission for all definitions,” Dr. Wilhelm and her coauthors noted.
“Testing definitions of remission is of great relevance for clinical practice, as much as for clinical trials,” the authors concluded. “Our future goal is to find out which definitions are most successful in predicting the best possible outcome for our patients.”
The Hopkins Lupus Cohort receives funding from the National Institutes of Health. Dr. Wilhelm and her coauthors did not report any relevant financial disclosures.
The time it takes for patients with systemic lupus erythematosus to achieve remission greatly depends on how remission is defined, and such episodes are usually short-lasting, according to an analysis of more than 2,000 patients in the Hopkins Lupus Cohort.
“Our results concerning durability of remission show the relapsing-remitting nature of SLE [systemic lupus erythematosus]. The median duration of remission was only about 3 months for all [four] definitions [used in the study]. This was the time to the next quarterly cohort visit. Even though achieving remission was frequent, durable remission was rare,” wrote the authors, led by Theresa R. Wilhelm, MD, of Johns Hopkins University in Baltimore.
Dr. Wilhelm and her coauthors chose to examine remission in SLE based on four DORIS (Definitions Of Remission In SLE) working group clinical definitions: clinical remission, complete remission, clinical ROT (Remission on Treatment), and complete ROT. To define them, a clinical SLE Disease Activity Index (cSLEDAI) score of 0 and a Physician Global Assessment of less than 0.5 were applicable to all definitions. Zero prednisone was applicable to clinical and complete remission, while clinical ROT and complete ROT allowed for 5 mg or less daily. Immunosuppressive drugs were not allowed for a patient to be deemed in either clinical or complete remission, but were allowed for both ROT definitions. Serologically negative results were deemed permissible for both complete remission and ROT, but not for clinical remission or clinical ROT (Ann Rheum Dis. 2016 Aug 24. doi: 10.1136/annrheumdis-2016-209489).
For a total of 2,307 SLE patients who were enrolled into the Hopkins Lupus Cohort during 1987-2014, the median time for clinical remission to be achieved was 8.7 years, while complete remission took 11.0 years, clinical ROT took 1.8 years, and complete ROT took 3.1 years. These Kaplan-Meier estimates of the distribution of time to remission after entry into the cohort did not include patients who had a gap in their follow-up or dropped out before satisfying the definition of remission.
However, across all four definitions, the median length of remission was only 3 months, as sustained remission proved elusive. Those with high disease activity and greater treatment had longer median times to achieve remission than did those with low disease activity and less treatment.
“Not surprisingly, we found that the level of baseline treatment and baseline disease activity were strongly associated with the time to remission for all definitions,” Dr. Wilhelm and her coauthors noted.
“Testing definitions of remission is of great relevance for clinical practice, as much as for clinical trials,” the authors concluded. “Our future goal is to find out which definitions are most successful in predicting the best possible outcome for our patients.”
The Hopkins Lupus Cohort receives funding from the National Institutes of Health. Dr. Wilhelm and her coauthors did not report any relevant financial disclosures.
FROM ANNALS OF THE RHEUMATIC DISEASES
Key clinical point: Sustained remission in systemic lupus erythematosus patients varies considerably according to different definitions and is less likely than previously believed.
Major finding: The median times for remission were 8.7 years (clinical remission), 11.0 years (complete remission), 1.8 years (clinical remission on treatment), and 3.1 years (complete remission on treatment), while median duration of remission was 3 months across all four definitions.
Data source: Prospective clinical cohort study of 2,307 patients enrolled during 1987-2014.
Disclosures: The Hopkins Lupus Cohort receives funding from the National Institutes of Health. The authors reported no relevant financial disclosures.