User login
VIDEO: PRECISION exonerates celecoxib: cardiovascular risk is no worse than that of nonselective NSAIDs
NEW ORLEANS – The cardiovascular safety profile of the nonsteroidal anti-inflammatory drug (NSAID) celecoxib, a selective inhibitor of COX-2, is no worse than those of the nonselective NSAIDs naproxen and ibuprofen, according to a trial reported at the American Heart Association scientific sessions.
The trial, known as PRECISION (Prospective Randomized Evaluation of Celecoxib Integrated Safety vs Ibuprofen Or Naproxen) was undertaken after another selective COX-2 inhibitor, rofecoxib (Vioxx), was withdrawn from the market because of associated cardiovascular events. It compared the three drugs among more than 24,000 patients with painful arthritis and elevated cardiovascular risk.
Main results showed that 2%-3% of patients experienced a cardiovascular event (cardiovascular death, myocardial infarction, or stroke) during a follow-up approaching 3 years, regardless of which drug they were assigned to take, with the slight differences falling within predefined margins for noninferiority of celecoxib, investigators reported in a session and related press conference.
Additionally, celecoxib yielded a lower rate of gastrointestinal events when compared with each of the other drugs and a lower rate of renal events when compared with ibuprofen.
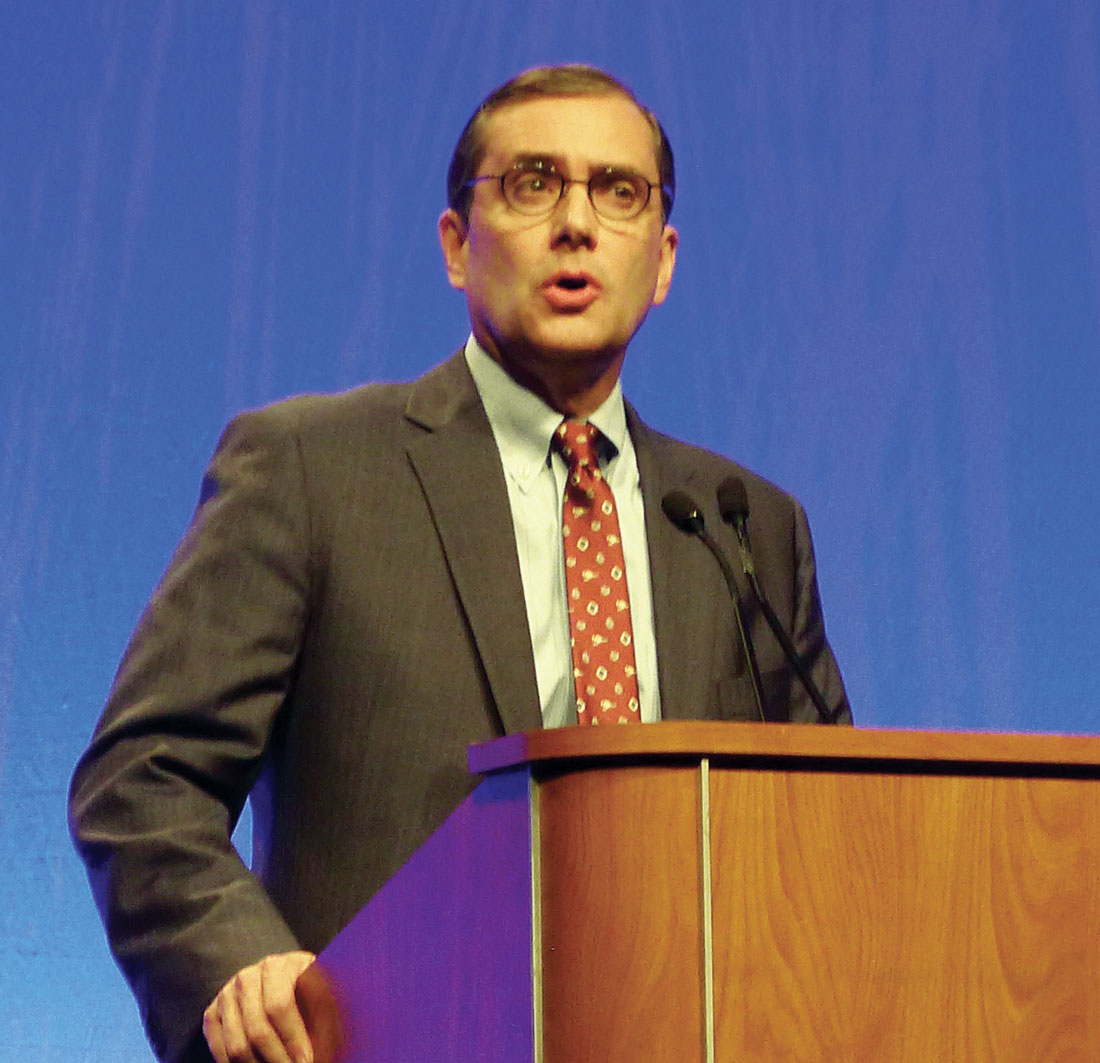
“After the withdrawal of rofecoxib, everybody thought they knew the answer, that COX-2 inhibitors had an unfavorable cardiovascular profile,” commented first author Steven E. Nissen, MD, chair of cardiovascular medicine at the Cleveland Clinic in Ohio. “We didn’t find that. And this is the type of study that once again teaches us that if we jump to conclusions about this based on mechanistic considerations, we often make very bad decisions.”
The video associated with this article is no longer available on this site. Please view all of our videos on the MDedge YouTube channel
Efforts are under way to disseminate the PRECISION findings to rheumatologists and other groups who do much of the NSAID prescribing.
“Any time you have something that has findings like the findings we have, it takes some time to trickle down to the prescribers. It’s going to be our job to communicate both the value and the important limitations of the trial so that people can make informed decisions about which of these drugs to use and in whom,” Dr. Nissen said.
A cautionary view
“The investigators addressed an extremely important question, which is what is the cardiovascular safety of agents that we administer for a general medical condition over the long term,” commented invited discussant Elliott M. Antman, MD, a senior physician at Brigham and Women’s Hospital and associate dean for Clinical and Translational Research at Harvard Medical School in Boston. “We don’t see a lot of trials like that, but we do need this information.”
“This is not a comparison of drugs; this is a comparison of drug regimens because the investigators were able to increase the dose to control the subjects’ pain,” Dr. Antman elaborated. “And they were able to increase the dose of naproxen and ibuprofen comparatively more than they could for celecoxib,” which was capped at 200 mg per day at most study sites.
Furthermore, only about one-fifth of the patients studied had known heart disease. “We know that the more likely a person is to have atherosclerosis, the more likely they are to experience harm from COX-2 inhibition,” he said. “So given the profile of the patients in this trial, it’s unlikely that we would have been able to detect that signal of harm from COX-2 inhibition, particularly at this dose.”
Dr. Antman also had concerns about the impact on concomitant aspirin therapy (the benefit of which can be affected by nonselective NSAIDs) and about possible differences in the reasons for dropouts that may have biased findings toward celecoxib. “I believe we need more information in order to more completely interpret this trial,” he summarized.
For now, he advised physicians to follow guidance put forth by the American Heart Association: Avoid NSAIDs in patients with known heart disease, and if one must use them, try to use the lowest-risk drug in the lowest dose needed for the shortest period of time.
In the future, “we should actually break out of the mold of assigning everybody in the trial a common phenotype and reporting the average result, but instead take a precision medicine approach, where we look at the polymorphisms in the COX enzyme, look at the polymorphisms in the ability to metabolize these drugs, and actually see if we can be more precise,” Dr. Antman maintained. “Finally, there is an urgent clinical need for the development of novel analgesics and other therapeutics to avoid the cardiovascular risk from all NSAIDs.”
Trial details
Patients were eligible for PRECISION, a Pfizer-funded trial, if they had osteoarthritis or rheumatoid arthritis and were at increased cardiovascular risk.
In all, 24,081 patients from 926 centers globally were randomly assigned to double-blind treatment with celecoxib, naproxen, or ibuprofen, all of which are now available as generics in the United States.
“Patients were randomized to the FDA-approved doses of these drugs, and they could have their dose increased if they had unrelieved pain up to the maximum allowed by regulatory authorities in the local jurisdictions where the study was done,” Dr. Nissen noted, pointing out that studies initially generating some concern about celecoxib used a supratherapeutic dose of 800 mg daily.
As COX-2 inhibitors are less likely than nonselective NSAIDs to cause ulcers, which might affect compliance and outcomes, all patients additionally received esomeprazole for gastroprotection “to try to level the playing field,” he explained.
The mean treatment duration was 20.3 months, and the mean follow-up duration was 34.1 months, according to data reported at the meeting and simultaneously published (N Engl J Med. 2016 Nov 13. doi: 10.1056/NEJMoa1611593). On average, the daily dose of drug received was 209 mg for celecoxib, 852 mg for naproxen, and 2,045 mg for ibuprofen.
In intention-to-treat analyses, the rate of the primary composite outcome of cardiovascular death (including hemorrhagic death), nonfatal myocardial infarction, or nonfatal stroke was 2.3% in the celecoxib group, 2.5% in the naproxen group, and 2.7% in the ibuprofen group. The hazard ratio was 0.93 for celecoxib versus naproxen (P less than .001 for noninferiority) and 0.85 for celecoxib versus ibuprofen (P less than .001 for noninferiority).
Differences were more marked in the on-treatment population. Here, the rate of the primary outcome was 1.7% in the celecoxib group, 1.8% in the naproxen group, and 1.9% in the ibuprofen group. The HR was 0.90 for celecoxib versus naproxen (P less than .001 for noninferiority) and 0.81 for celecoxib versus ibuprofen (P less than .001 for noninferiority).
Secondary outcomes, which tested for superiority, showed that the rate of major adverse cardiovascular events was 15% higher in the ibuprofen group as compared with the celecoxib group in the intent-to-treat population. The difference translated to a near-significant reduction in risk with the latter (HR, 0.87; P = .06) that appeared greater in the on-treatment population.
However, Dr. Nissen cautioned that he could not state that celecoxib was superior. “Secondary and tertiary endpoints in a clinical trial are hypothesis generating, and they are not considered definitive evidence,” he commented. At the same time, “the FDA is going to have to deal with that because what do they do with labeling? What do they do with over-the-counter access to these various drugs?”
The rate of all-cause mortality was 25% higher with naproxen than with celecoxib (HR, 0.80; P = .052).
The rate of gastrointestinal events was 54% higher with ibuprofen (HR, 0.65; P = .002) and 41% higher with naproxen (HR, 0.71; P = .01) as compared with celecoxib. And the rate of renal events was 64% higher with ibuprofen than with celecoxib (HR, 0.61; P = .004).
In a post hoc analysis of global safety, the rate of serious cardiovascular, gastrointestinal, and renal events was 28% higher with ibuprofen (HR, 0.78; P less than .001) and 15% higher with naproxen (HR, 0.87; P = .03) than with celecoxib.
Of note, the findings for the primary endpoint were similar regardless of whether patients were taking low-dose aspirin or not. “There was no interaction with aspirin use,” Dr. Nissen stated. “This was not about the interference of ibuprofen or naproxen with aspirin use.”
Analyses of pain relief using a visual analogue scale showed no clinically meaningful differences, suggesting that the drug doses used were equally analgesic, he said. Stopping of study drug because of lack of efficacy was slightly more common in the celecoxib group.
“We didn’t study the low-dose, intermittent use of these drugs that most of the public engages in, and it’s really important that we crisply communicate that to the public because somebody who takes occasionally ibuprofen or naproxen for a headache should not look at these comparative data in a way that should necessarily influence their behavior. We just don’t know the answer,” cautioned Dr. Nissen, who disclosed that he received grant support from Pfizer during the conduct of the trial.
But the findings are relevant for individuals who take over-the-counter NSAIDs at doses exceeding the label, a phenomenon known as dose creep. “We need to reemphasize to the public that the labeled over-the-counter dose is what you should take. You shouldn’t double up or triple up on the drugs because the issue of high-dose therapy, which is what we studied, suggests that there are really potentially important gastrointestinal, renal, and cardiovascular risks,” he said.
NEW ORLEANS – The cardiovascular safety profile of the nonsteroidal anti-inflammatory drug (NSAID) celecoxib, a selective inhibitor of COX-2, is no worse than those of the nonselective NSAIDs naproxen and ibuprofen, according to a trial reported at the American Heart Association scientific sessions.
The trial, known as PRECISION (Prospective Randomized Evaluation of Celecoxib Integrated Safety vs Ibuprofen Or Naproxen) was undertaken after another selective COX-2 inhibitor, rofecoxib (Vioxx), was withdrawn from the market because of associated cardiovascular events. It compared the three drugs among more than 24,000 patients with painful arthritis and elevated cardiovascular risk.
Main results showed that 2%-3% of patients experienced a cardiovascular event (cardiovascular death, myocardial infarction, or stroke) during a follow-up approaching 3 years, regardless of which drug they were assigned to take, with the slight differences falling within predefined margins for noninferiority of celecoxib, investigators reported in a session and related press conference.
Additionally, celecoxib yielded a lower rate of gastrointestinal events when compared with each of the other drugs and a lower rate of renal events when compared with ibuprofen.
“After the withdrawal of rofecoxib, everybody thought they knew the answer, that COX-2 inhibitors had an unfavorable cardiovascular profile,” commented first author Steven E. Nissen, MD, chair of cardiovascular medicine at the Cleveland Clinic in Ohio. “We didn’t find that. And this is the type of study that once again teaches us that if we jump to conclusions about this based on mechanistic considerations, we often make very bad decisions.”
The video associated with this article is no longer available on this site. Please view all of our videos on the MDedge YouTube channel
Efforts are under way to disseminate the PRECISION findings to rheumatologists and other groups who do much of the NSAID prescribing.
“Any time you have something that has findings like the findings we have, it takes some time to trickle down to the prescribers. It’s going to be our job to communicate both the value and the important limitations of the trial so that people can make informed decisions about which of these drugs to use and in whom,” Dr. Nissen said.
A cautionary view
“The investigators addressed an extremely important question, which is what is the cardiovascular safety of agents that we administer for a general medical condition over the long term,” commented invited discussant Elliott M. Antman, MD, a senior physician at Brigham and Women’s Hospital and associate dean for Clinical and Translational Research at Harvard Medical School in Boston. “We don’t see a lot of trials like that, but we do need this information.”
“This is not a comparison of drugs; this is a comparison of drug regimens because the investigators were able to increase the dose to control the subjects’ pain,” Dr. Antman elaborated. “And they were able to increase the dose of naproxen and ibuprofen comparatively more than they could for celecoxib,” which was capped at 200 mg per day at most study sites.
Furthermore, only about one-fifth of the patients studied had known heart disease. “We know that the more likely a person is to have atherosclerosis, the more likely they are to experience harm from COX-2 inhibition,” he said. “So given the profile of the patients in this trial, it’s unlikely that we would have been able to detect that signal of harm from COX-2 inhibition, particularly at this dose.”
Dr. Antman also had concerns about the impact on concomitant aspirin therapy (the benefit of which can be affected by nonselective NSAIDs) and about possible differences in the reasons for dropouts that may have biased findings toward celecoxib. “I believe we need more information in order to more completely interpret this trial,” he summarized.
For now, he advised physicians to follow guidance put forth by the American Heart Association: Avoid NSAIDs in patients with known heart disease, and if one must use them, try to use the lowest-risk drug in the lowest dose needed for the shortest period of time.
In the future, “we should actually break out of the mold of assigning everybody in the trial a common phenotype and reporting the average result, but instead take a precision medicine approach, where we look at the polymorphisms in the COX enzyme, look at the polymorphisms in the ability to metabolize these drugs, and actually see if we can be more precise,” Dr. Antman maintained. “Finally, there is an urgent clinical need for the development of novel analgesics and other therapeutics to avoid the cardiovascular risk from all NSAIDs.”
Trial details
Patients were eligible for PRECISION, a Pfizer-funded trial, if they had osteoarthritis or rheumatoid arthritis and were at increased cardiovascular risk.
In all, 24,081 patients from 926 centers globally were randomly assigned to double-blind treatment with celecoxib, naproxen, or ibuprofen, all of which are now available as generics in the United States.
“Patients were randomized to the FDA-approved doses of these drugs, and they could have their dose increased if they had unrelieved pain up to the maximum allowed by regulatory authorities in the local jurisdictions where the study was done,” Dr. Nissen noted, pointing out that studies initially generating some concern about celecoxib used a supratherapeutic dose of 800 mg daily.
As COX-2 inhibitors are less likely than nonselective NSAIDs to cause ulcers, which might affect compliance and outcomes, all patients additionally received esomeprazole for gastroprotection “to try to level the playing field,” he explained.
The mean treatment duration was 20.3 months, and the mean follow-up duration was 34.1 months, according to data reported at the meeting and simultaneously published (N Engl J Med. 2016 Nov 13. doi: 10.1056/NEJMoa1611593). On average, the daily dose of drug received was 209 mg for celecoxib, 852 mg for naproxen, and 2,045 mg for ibuprofen.
In intention-to-treat analyses, the rate of the primary composite outcome of cardiovascular death (including hemorrhagic death), nonfatal myocardial infarction, or nonfatal stroke was 2.3% in the celecoxib group, 2.5% in the naproxen group, and 2.7% in the ibuprofen group. The hazard ratio was 0.93 for celecoxib versus naproxen (P less than .001 for noninferiority) and 0.85 for celecoxib versus ibuprofen (P less than .001 for noninferiority).
Differences were more marked in the on-treatment population. Here, the rate of the primary outcome was 1.7% in the celecoxib group, 1.8% in the naproxen group, and 1.9% in the ibuprofen group. The HR was 0.90 for celecoxib versus naproxen (P less than .001 for noninferiority) and 0.81 for celecoxib versus ibuprofen (P less than .001 for noninferiority).
Secondary outcomes, which tested for superiority, showed that the rate of major adverse cardiovascular events was 15% higher in the ibuprofen group as compared with the celecoxib group in the intent-to-treat population. The difference translated to a near-significant reduction in risk with the latter (HR, 0.87; P = .06) that appeared greater in the on-treatment population.
However, Dr. Nissen cautioned that he could not state that celecoxib was superior. “Secondary and tertiary endpoints in a clinical trial are hypothesis generating, and they are not considered definitive evidence,” he commented. At the same time, “the FDA is going to have to deal with that because what do they do with labeling? What do they do with over-the-counter access to these various drugs?”
The rate of all-cause mortality was 25% higher with naproxen than with celecoxib (HR, 0.80; P = .052).
The rate of gastrointestinal events was 54% higher with ibuprofen (HR, 0.65; P = .002) and 41% higher with naproxen (HR, 0.71; P = .01) as compared with celecoxib. And the rate of renal events was 64% higher with ibuprofen than with celecoxib (HR, 0.61; P = .004).
In a post hoc analysis of global safety, the rate of serious cardiovascular, gastrointestinal, and renal events was 28% higher with ibuprofen (HR, 0.78; P less than .001) and 15% higher with naproxen (HR, 0.87; P = .03) than with celecoxib.
Of note, the findings for the primary endpoint were similar regardless of whether patients were taking low-dose aspirin or not. “There was no interaction with aspirin use,” Dr. Nissen stated. “This was not about the interference of ibuprofen or naproxen with aspirin use.”
Analyses of pain relief using a visual analogue scale showed no clinically meaningful differences, suggesting that the drug doses used were equally analgesic, he said. Stopping of study drug because of lack of efficacy was slightly more common in the celecoxib group.
“We didn’t study the low-dose, intermittent use of these drugs that most of the public engages in, and it’s really important that we crisply communicate that to the public because somebody who takes occasionally ibuprofen or naproxen for a headache should not look at these comparative data in a way that should necessarily influence their behavior. We just don’t know the answer,” cautioned Dr. Nissen, who disclosed that he received grant support from Pfizer during the conduct of the trial.
But the findings are relevant for individuals who take over-the-counter NSAIDs at doses exceeding the label, a phenomenon known as dose creep. “We need to reemphasize to the public that the labeled over-the-counter dose is what you should take. You shouldn’t double up or triple up on the drugs because the issue of high-dose therapy, which is what we studied, suggests that there are really potentially important gastrointestinal, renal, and cardiovascular risks,” he said.
AT THE AHA SCIENTIFIC SESSIONS
Key clinical point:
Major finding: The rate of the primary composite outcome of cardiovascular death (including hemorrhagic death), nonfatal myocardial infarction, or nonfatal stroke was 2.3% with celecoxib, 2.5% with naproxen, and 2.7% with ibuprofen (P less than .001 for noninferiority).
Data source: A randomized, controlled trial among 24,081 patients who required NSAIDs for painful arthritis and were at increased cardiovascular risk (PRECISION trial).
Disclosures: Dr. Nissen disclosed that he received grant support from Pfizer during the conduct of the trial. The trial was funded by Pfizer.
Tocilizumab makes big impression in giant cell arteritis treatment
WASHINGTON – Tocilizumab treatment every week or every other week for 52 weeks with a 26-week prednisone taper was superior to a short and long course of tapered prednisone and also cut the rate of steroid use in half when compared with long-course prednisone in patients with giant cell arteritis in the largest-ever trial of patients with the disease.
The treatment represents a milestone in the treatment of giant cell arteritis (GCA), “a chronic, often devastating, difficult to manage disease,” John Stone, MD, said in his presentation of the results of the randomized, double-blind, placebo-controlled GiACTA trial at the annual meeting of the American College of Rheumatology.
Tocilizumab, an IL-6 receptor-alpha inhibitor, is approved by the Food and Drug Administration for the treatment of rheumatoid arthritis and juvenile idiopathic arthritis.
The difficulty in treating GCA is made evident by the fact that “at least 10% of patients with GCA lose their vision, and the long-term morbidity of glucocorticoid treatment – the only treatment thus far for this disease – is substantial,” he said. “For more than 65 years, no true steroid-sparing treatment has been proven effective.”
Remissions rise while flares and steroid use decline
GiACTA enrolled 251 GCA patients over 22 months from 14 countries and 76 sites (61 in Europe and 15 in North America). Median age was 69 years; 74% were female; and 97% were white.
“This trial was 2.5 times as large as any trial conducted in GCA,” Dr. Stone said.
Patients with GCA were eligible for the study if they met modified 1990 ACR classification criteria for GCA as follows: elevated C-reactive protein (CRP) with unequivocal cranial symptoms or unequivocal symptoms of polymyalgia rheumatica; and imaging evidence of large-vessel vasculitis (ultrasound was not permitted).
Patients were randomized to one of four treatment arms: Group 1, prednisone with 6-month taper until week 52 on no other therapy; Group 2, prednisone with 52 weeks of taper; Group 3, weekly tocilizumab injection plus the same steroid taper as Group 1; and Group 4, tocilizumab every other week with same steroid taper as Group 1.
Investigators were blinded to the prednisone taper regimen and the treatment.
Dr. Stone reported 52-week results for the primary endpoint of GiACTA (i.e., sustained remission from week 12 to 52 for tocilizumab versus prednisone 26-week taper). The study is continuing open-label for another year.
The rates of sustained remission at 52 weeks were significantly higher for both weekly tocilizumab (56% of 100 patients; P less than .0001) and every-other-week tocilizumab (53% of 49 patients; P = .0002) versus 14% for short-course prednisone (14% of 50 patients). The rate of sustained remission at 52 weeks was 18% of 51 patients for long-course prednisone.
“The inclusion of CRP did not affect the outcome. After removing CRP from the primary analysis, both endpoints were highly statistically significant for the tocilizumab groups,” Dr. Stone noted.
The same pattern was evident for time to first flare following clinical remission, with the best results in Group 3 and Group 4 – the two tocilizumab groups. The weekly tocilizumab group had a sustained response following the cessation of prednisone, but the every-other-week tocilizumab group had a drop-off after stopping prednisone. More flares were seen in Groups 1 and 2.
Flares were defined as recurrence of GCA signs or symptoms; increased erythrocyte sedimentation rate greater than 30 mm/h attributed to GCA; or two consecutive CRP elevations. Flares were treated by increase in prednisone dose. The cumulative dose of prednisone was cut in half in both tocilizumab arms, compared with the long-course prednisone treatment arm.
“The reduction in prednisone use in patients taking tocilizumab was clinically significant,” Dr. Stone said.
According to the Short-Form 36, a patient-reported outcomes measure, tocilizumab improved global quality of life while quality of life declined in both prednisone taper groups.
There were no new safety signals related to tocilizumab reported during the trial. No cases of vision loss and no deaths occurred. Two malignancies were reported in the prednisone groups.
“Adverse events were not disproportionate in the tocilizumab-treated groups,” Dr. Stone said.
Some of the investigators had financial relationships with Roche, which sponsored the study, or other pharmaceutical companies. Several investigators were employees of Roche or its wholly-owned subsidiary, Genentech.
AT THE ACR ANNUAL MEETING
Key clinical point:
Major finding: The rate of sustained remission at 52 weeks was 56% with tocilizumab versus 14% for short course prednisone and 18% for long-course prednisone.
Data source: Randomized, double-blind, placebo-controlled trial of 251 patients.
Disclosures: Some of the investigators had financial relationships with Roche, which sponsored the study, or other pharmaceutical companies. Several investigators were employees of Roche or its wholly-owned subsidiary, Genentech.
Readmissions after bariatric surgery more common among black patients
WASHINGTON – Readmissions after bariatric surgery are significantly higher among black patients than among whites.
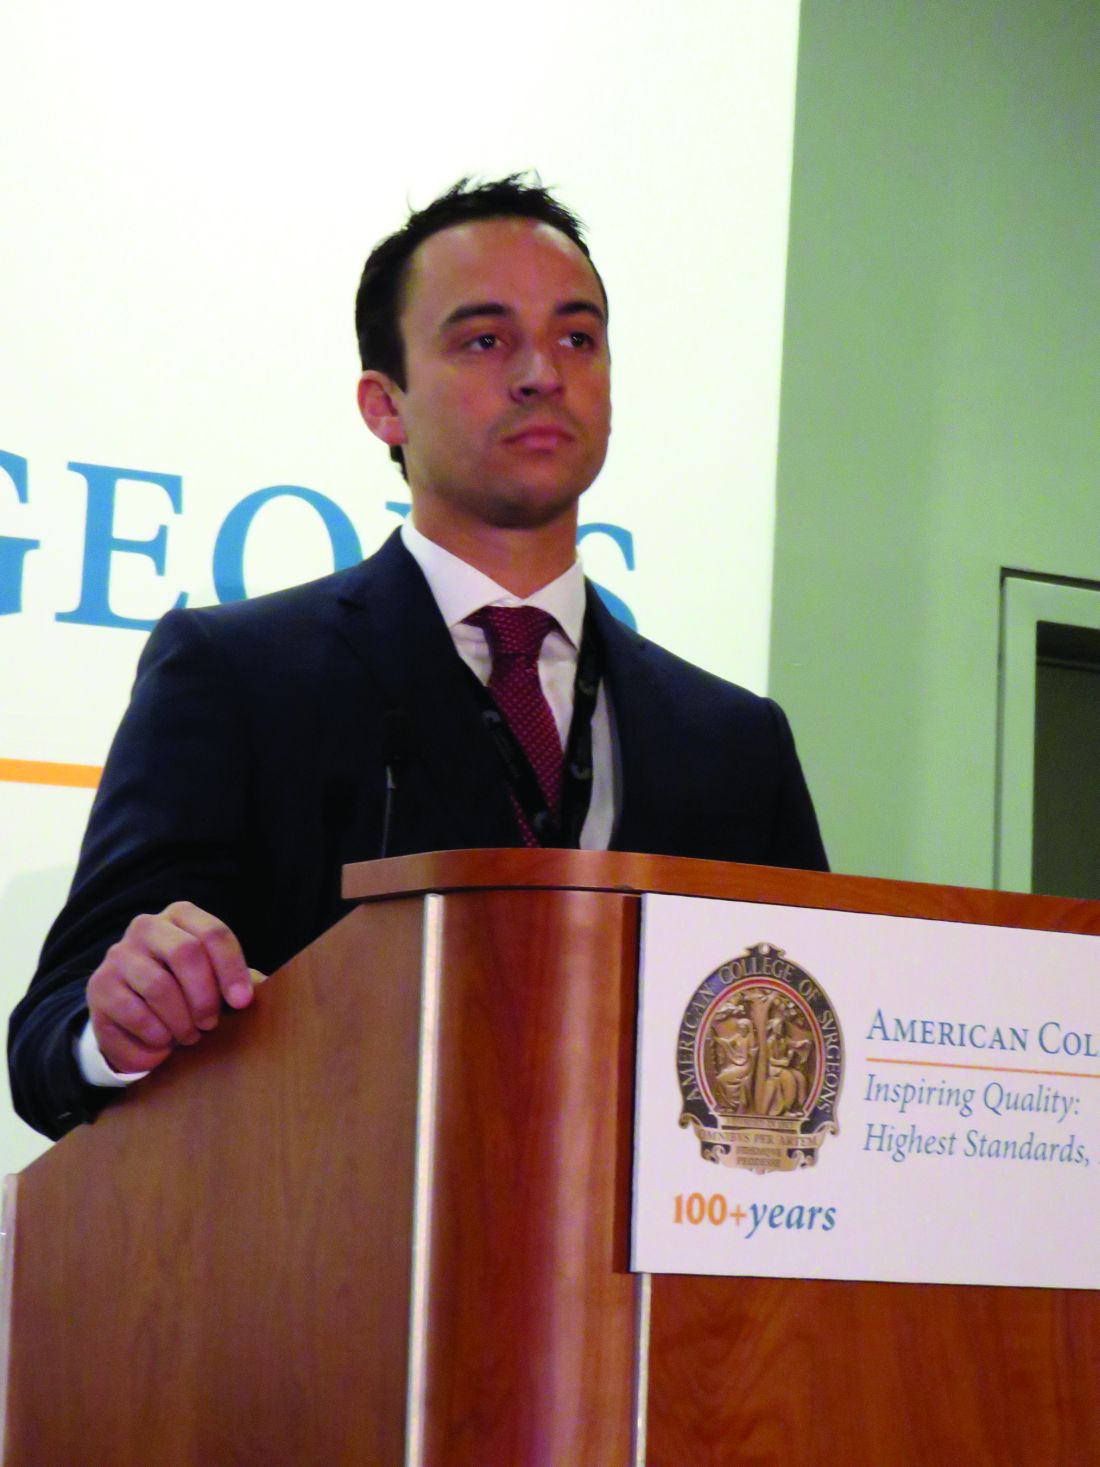
The reasons aren’t entirely clear, but since long-term morbidity and mortality are equivalent, they are probably more related to socioeconomics than clinical factors, Matthew Whealon, MD, said at the annual clinical congress of the American College of Surgeons.
“I think they are multifactorial,” said Dr. Whealon of the University of California, Irvine. “Some of it may be related to comorbidities, but other factors could be socioeconomic status, insurance status, access to primary care and follow-up care, even home support systems and patient expectations after surgery. I think it’s incumbent upon us to try and identify some of these risk factors and address them before surgery to reduce this disparity in readmissions.”
Black patients undergoing Roux-en-Y bypass were significantly younger (43 vs. 45 years), and more often women (86% vs. 78%). They also had significantly higher body mass index than did white patients (48 vs. 46 kg/m2). More black individuals had a BMI of 50 kg/m2 or higher.
There were no significant differences in the severity of comorbidities. About 70% of each group had severe comorbidities as classified by the American Anesthesiologists Society risk assessment profile.
However, those comorbidities were different. Among black patients, steroid use, heart failure, hypertension, and end-stage renal disease were significantly more common. Among white patients, chronic obstructive pulmonary disease and bleeding disorders were more common.
There were no differences in 30-day mortality (less than 1% of each group); serious morbidity (3%) or any morbidity (5%); length of stay (2.4 days); or reoperation (2.6%).
However, readmissions were significantly more likely among black patients (8% vs. 5.6%). This translated to a 29% increased risk of readmission (OR 1.29).
Compared to whites, blacks who had a laparoscopic vertical sleeve gastrectomy were also significantly younger (42 vs. 45 years); more often women (87% vs. 76%); and heavier (BMI 47 vs. 45 kg/m2). Again, they were more likely to have a BMI of more than 50 kg/m2 (28% vs. 21%).
Significantly more were in the ASA class 3 of severe comorbidities (70% vs.66%). There were also differences in the comorbidities, with blacks more likely to have heart failure, hypertension, and end-stage renal disease, and whites more likely to have diabetes, smoking, dyspnea, and chronic obstructive pulmonary disease.
Among these patients, 30-day mortality was not different (less than 1%). Serious morbidity was also similar (about 2%), as was any morbidity (about 3%). The reoperation rate was the same (1.2%).
Length of stay was longer among black patients but this was not clinically significant, Dr. Whealon said: It still hovered right around 2 days.
But readmissions were significantly more common among blacks (5% vs. 3%). This difference translated to a 35% increased risk of readmission (odds ratio 1.35).
The nature of the NSQIP data makes it impossible to tease out any other factors that might have contributed to this finding. However, Dr. Whealon said, the equivalent findings on morbidity and mortality are very encouraging and represent a big improvement.
“We have done very well in driving down morbidity and mortality among these patients. Mortality rates are one tenth of what we were seeing a decade ago.”
This change hasn’t been well documented yet because many of the large studies showing racial and ethnic mortality disparities include data drawn from open bariatric surgery, which has been almost completely abandoned in favor of the much safer laparoscopic approaches.
Dr. Whealon had no financial disclosures.
[email protected]
On Twitter @Alz_Gal
WASHINGTON – Readmissions after bariatric surgery are significantly higher among black patients than among whites.
The reasons aren’t entirely clear, but since long-term morbidity and mortality are equivalent, they are probably more related to socioeconomics than clinical factors, Matthew Whealon, MD, said at the annual clinical congress of the American College of Surgeons.
“I think they are multifactorial,” said Dr. Whealon of the University of California, Irvine. “Some of it may be related to comorbidities, but other factors could be socioeconomic status, insurance status, access to primary care and follow-up care, even home support systems and patient expectations after surgery. I think it’s incumbent upon us to try and identify some of these risk factors and address them before surgery to reduce this disparity in readmissions.”
Black patients undergoing Roux-en-Y bypass were significantly younger (43 vs. 45 years), and more often women (86% vs. 78%). They also had significantly higher body mass index than did white patients (48 vs. 46 kg/m2). More black individuals had a BMI of 50 kg/m2 or higher.
There were no significant differences in the severity of comorbidities. About 70% of each group had severe comorbidities as classified by the American Anesthesiologists Society risk assessment profile.
However, those comorbidities were different. Among black patients, steroid use, heart failure, hypertension, and end-stage renal disease were significantly more common. Among white patients, chronic obstructive pulmonary disease and bleeding disorders were more common.
There were no differences in 30-day mortality (less than 1% of each group); serious morbidity (3%) or any morbidity (5%); length of stay (2.4 days); or reoperation (2.6%).
However, readmissions were significantly more likely among black patients (8% vs. 5.6%). This translated to a 29% increased risk of readmission (OR 1.29).
Compared to whites, blacks who had a laparoscopic vertical sleeve gastrectomy were also significantly younger (42 vs. 45 years); more often women (87% vs. 76%); and heavier (BMI 47 vs. 45 kg/m2). Again, they were more likely to have a BMI of more than 50 kg/m2 (28% vs. 21%).
Significantly more were in the ASA class 3 of severe comorbidities (70% vs.66%). There were also differences in the comorbidities, with blacks more likely to have heart failure, hypertension, and end-stage renal disease, and whites more likely to have diabetes, smoking, dyspnea, and chronic obstructive pulmonary disease.
Among these patients, 30-day mortality was not different (less than 1%). Serious morbidity was also similar (about 2%), as was any morbidity (about 3%). The reoperation rate was the same (1.2%).
Length of stay was longer among black patients but this was not clinically significant, Dr. Whealon said: It still hovered right around 2 days.
But readmissions were significantly more common among blacks (5% vs. 3%). This difference translated to a 35% increased risk of readmission (odds ratio 1.35).
The nature of the NSQIP data makes it impossible to tease out any other factors that might have contributed to this finding. However, Dr. Whealon said, the equivalent findings on morbidity and mortality are very encouraging and represent a big improvement.
“We have done very well in driving down morbidity and mortality among these patients. Mortality rates are one tenth of what we were seeing a decade ago.”
This change hasn’t been well documented yet because many of the large studies showing racial and ethnic mortality disparities include data drawn from open bariatric surgery, which has been almost completely abandoned in favor of the much safer laparoscopic approaches.
Dr. Whealon had no financial disclosures.
[email protected]
On Twitter @Alz_Gal
AT THE ACS CLINICAL CONGRESS
Key clinical point:
Major finding: Black patients were 29% more likely to be readmitted after Roux-en-Y and 35% more likely to be readmitted after sleeve gastrectomy.
Data source: The NSQIP database review comprised about 62,000 surgeries.
Disclosures: Dr. Whealon had no financial disclosures.
VIDEO: Cardiac inflammation present in RA patients, but resolves with RA therapy
WASHINGTON – Chronic cardiac inflammation is present in rheumatoid arthritis patients and appears to resolve when they achieve a good clinical response to medical therapy.
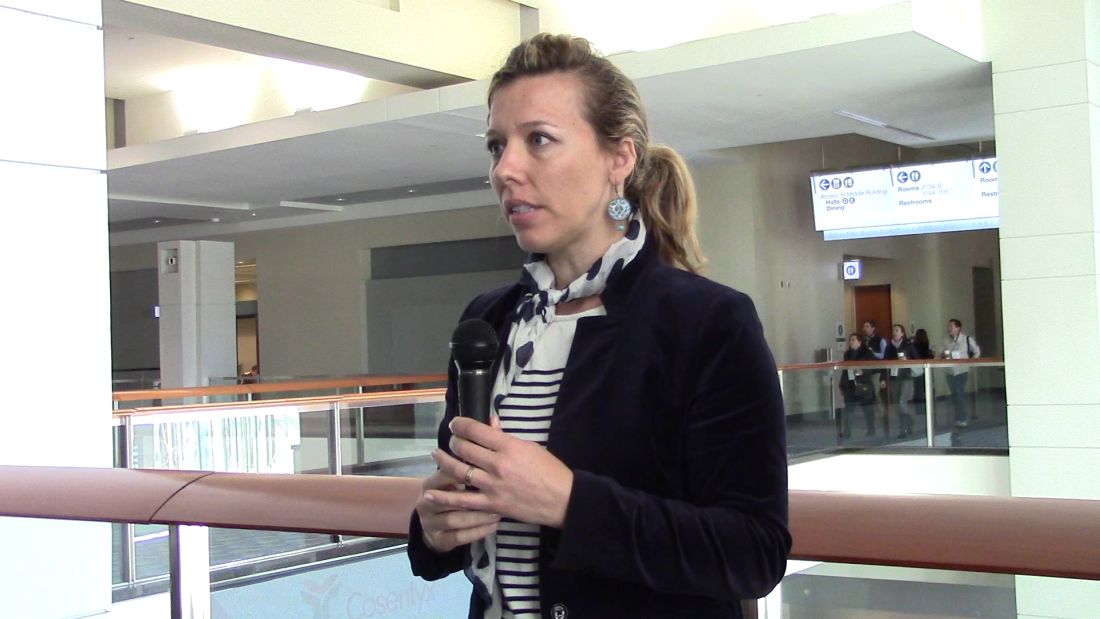
The findings of two cardiac imaging studies offer a tantalizing clue to the link between RA and heart failure, said Isabelle Amigues, MD, who reported the findings at the annual meeting of the American College of Rheumatology.
“We know that the inflammation of RA is not just restricted to joints,” said Dr. Amigues, a rheumatology fellow at Columbia University, New York. “We see it throughout the body, so of course it makes sense that we would see it in the heart as well. And now we see that we may be able to manage this with good disease management.
The study that found improvement of myocarditis with RA therapy was very small – just 8 patients and 12 controls – but the results were surprising and encouraging, Dr. Amigues said.
The video associated with this article is no longer available on this site. Please view all of our videos on the MDedge YouTube channel
The initial study examined chronic myocarditis in 119 patients with active RA; most (76%) were positive for anti-cyclic citrullinated peptides. They had a mean disease duration of 7 years. The mean Disease Activity Score was 3.8; 28% had low disease activity. About a third of the patients were taking a tumor necrosis factor inhibitor.
These patients were age- and gender-matched with 13 controls who did not have RA. All underwent cardiac FDG-PET scans as a marker of inflammation, as well as 3-D echocardiography to assess left ventricular mass and volume, and both systolic and diastolic function.
The maximum standard uptake value (SUVmax) in the scans was 12% higher in study patients than in the controls. This finding was associated with a higher body mass index and moderate to severe disease activity. After adjustment for BMI and RA treatment, the mean SUVmax was 30% higher for the patients with moderate to severe disease activity than in those who had low disease activity. Patients taking non-TNF biologics had 35% less cardiac inflammation than did those taking a TNF inhibitor or those not taking a biologic.
There were no significant associations with age, gender, race, diabetes, C-reactive protein or IL-6, coronary flow reserve, or coronary calcium. Inflammation was not related to any measure of cardiac structure or function on echocardiography.
“This finding makes sense, because we know that RA causes systemic inflammation, so it’s not surprising to see inflammation at the level of the heart,” Dr. Amigues said in an interview. “We do need longitudinal studies though to determine if structural or functional changes occur later on in the disease process.”
While the initial study didn’t look at cardiac changes in the disease process, Dr. Amigues’ subsequent study did find these associated with successful RA treatment. This follow-up study comprised eight patients who underwent PET scans and 3-D echocardiography at baseline and 6 months after initiation of a step-up treatment regimen. These were compared to 12 age- and gender-matched controls without RA, who had one baseline scan.
Most patients (87%) were women; their mean age was 62 years, and mean disease duration, 5 months. Most of the patients received TNF inhibitors with methotrexate as their step-up therapy; the rest were given triple therapy.
At the baseline scan, mean SUVmax was significantly higher in the patients than in controls (7.2 vs. 3.4 units). After 6 months of treatment, the mean DAS28 score among patients had decreased more than 1 point (4.57-3.51). Their mean SUVmax had also decreased to the level seen in controls. This was a significant improvement, Dr. Amigues said.
Again, there were no structural or functional differences between the two groups at baseline or follow-up, suggesting that cardiac inflammation is not inducing structural change – at least early in the RA disease process, Dr. Amigues said.
She reported having no relevant financial disclosures.
[email protected]
On Twitter @Alz_Gal
WASHINGTON – Chronic cardiac inflammation is present in rheumatoid arthritis patients and appears to resolve when they achieve a good clinical response to medical therapy.
The findings of two cardiac imaging studies offer a tantalizing clue to the link between RA and heart failure, said Isabelle Amigues, MD, who reported the findings at the annual meeting of the American College of Rheumatology.
“We know that the inflammation of RA is not just restricted to joints,” said Dr. Amigues, a rheumatology fellow at Columbia University, New York. “We see it throughout the body, so of course it makes sense that we would see it in the heart as well. And now we see that we may be able to manage this with good disease management.
The study that found improvement of myocarditis with RA therapy was very small – just 8 patients and 12 controls – but the results were surprising and encouraging, Dr. Amigues said.
The video associated with this article is no longer available on this site. Please view all of our videos on the MDedge YouTube channel
The initial study examined chronic myocarditis in 119 patients with active RA; most (76%) were positive for anti-cyclic citrullinated peptides. They had a mean disease duration of 7 years. The mean Disease Activity Score was 3.8; 28% had low disease activity. About a third of the patients were taking a tumor necrosis factor inhibitor.
These patients were age- and gender-matched with 13 controls who did not have RA. All underwent cardiac FDG-PET scans as a marker of inflammation, as well as 3-D echocardiography to assess left ventricular mass and volume, and both systolic and diastolic function.
The maximum standard uptake value (SUVmax) in the scans was 12% higher in study patients than in the controls. This finding was associated with a higher body mass index and moderate to severe disease activity. After adjustment for BMI and RA treatment, the mean SUVmax was 30% higher for the patients with moderate to severe disease activity than in those who had low disease activity. Patients taking non-TNF biologics had 35% less cardiac inflammation than did those taking a TNF inhibitor or those not taking a biologic.
There were no significant associations with age, gender, race, diabetes, C-reactive protein or IL-6, coronary flow reserve, or coronary calcium. Inflammation was not related to any measure of cardiac structure or function on echocardiography.
“This finding makes sense, because we know that RA causes systemic inflammation, so it’s not surprising to see inflammation at the level of the heart,” Dr. Amigues said in an interview. “We do need longitudinal studies though to determine if structural or functional changes occur later on in the disease process.”
While the initial study didn’t look at cardiac changes in the disease process, Dr. Amigues’ subsequent study did find these associated with successful RA treatment. This follow-up study comprised eight patients who underwent PET scans and 3-D echocardiography at baseline and 6 months after initiation of a step-up treatment regimen. These were compared to 12 age- and gender-matched controls without RA, who had one baseline scan.
Most patients (87%) were women; their mean age was 62 years, and mean disease duration, 5 months. Most of the patients received TNF inhibitors with methotrexate as their step-up therapy; the rest were given triple therapy.
At the baseline scan, mean SUVmax was significantly higher in the patients than in controls (7.2 vs. 3.4 units). After 6 months of treatment, the mean DAS28 score among patients had decreased more than 1 point (4.57-3.51). Their mean SUVmax had also decreased to the level seen in controls. This was a significant improvement, Dr. Amigues said.
Again, there were no structural or functional differences between the two groups at baseline or follow-up, suggesting that cardiac inflammation is not inducing structural change – at least early in the RA disease process, Dr. Amigues said.
She reported having no relevant financial disclosures.
[email protected]
On Twitter @Alz_Gal
AT THE ACR ANNUAL MEETING
Key clinical point:
Major finding: PET imaging showed 12% more inflammatory activity in the hearts of patients than in those of controls; this decreased significantly as disease activity remitted with treatment.
Data source: The myocarditis study comprised 119 patients; the therapeutic response study comprised 8 patients and 12 controls.
Disclosures: Dr. Amigues reported having no relevant financial disclosures.
Make the Diagnosis - November 2016
Cutaneous larva migrans
Cutaneous larva migrans (CLM) presents as a self-limited cutaneous eruption. It is also known as creeping eruption. Animal (dog and cat) hookworms such as Ancylostoma braziliense are responsible for most CLM infestations in the central and southeastern United States. The hookworms are often acquired while walking barefoot in contaminated sand. Carpenters, plumbers, and gardeners are also likely to be affected. Ova from the hookworms hatch into larvae that penetrate into skin.
On physical examination, lesions are erythematous, linear and serpiginous. Exposed sites, such as lower legs, hands, genitals, buttocks, and feet are most commonly involved. The migration begins about 4 days after onset. There is often intense pruritus and lesions advance 1-2 cm per day. Old lesions fade as the larvae migrate. They may have periods of rest, evidenced as papules. The differential diagnosis includes other parasites (uncinariasis, gnathostomiasis, strongyloidiasis, myiasis), dermatophytosis, phytophotodermatitis, erythema chronicum migrans, granuloma annulare, and bullous impetigo.
CLM is often a clinical diagnosis. Histopathology often reveals an inflammatory infiltrate or, if taken from an advancing lesion, part of the parasite. Serology may reveal an eosinophilia.
CLM is usually a limited infestation that typically resolves within 2-8 weeks, although longer timelines have been reported. Complications include cellulitis, abscess formation, and Loeffler syndrome (patchy lung infiltrate and eosinophilia). Antihistamines alone may be used to alleviate the accompanying pruritus, but curative treatment is often used. First-line curative therapies include oral albendazole and ivermectin but topical tiabendazole is also effective. Our patient responded well to oral ivermectin.
Case and photo courtesy of Mark Ash, MS; Brody School of Medicine,Greenville, North Carolina; and Donna Bilu Martin, MD; Premier Dermatology, MD, Aventura, Florida.
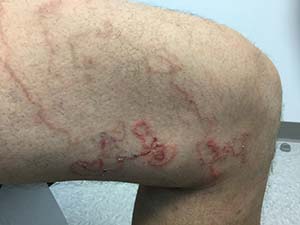
A 45 year old healthy male presented to the office with pruritic lesions on the leg for several weeks. He described a crawling sensation under the skin and states the lesions are slowly moving. On physical examination, erythematous, winding, linear tracts were present on his left thigh.
Robotic surgery instruments ‘virtually impossible’ to clean completely
Instruments used for robotic surgery are “virtually impossible” to clean completely, according to a report published in Infection Control & Hospital Epidemiology.
“A new standard for the cleaning of complex surgical instruments needs to be established, especially for those used in robotic surgery,” wrote Yuhei Saito of the surgical center at the University of Tokyo Hospital and associates.
They assessed the residual contamination of both robotic and regular surgical instruments at their medical center because “hospital staff in central sterile supply departments are troubled by the reprocessing of robotic instruments because they cannot be disassembled for cleaning like other endoscopic instruments. Their complex structure impairs brushing the inner surface of narrow lumens, resulting in failure to [completely] remove contaminants,” the researchers wrote.
In the first phase of the study, the researchers examined 41 instruments immediately after they were used in robotic surgery (7 radical prostatectomies and 2 anterior resections of the rectum) and 27 regular instruments immediately after they were used for open surgery (gastrectomy and colectomy). The robotic instruments were contaminated with 72.3 × 10³ mcg of protein each, compared with 5.5 × 10³ mcg of protein on the regular instruments, the investigators reported (Infect Control Hosp Epidemiol. 2016 Oct 31. doi: 10.1017/ice.2016.249).
In the second phase of the study, the researchers examined another 24 robotic instruments and 40 regular instruments after they were used in surgery and then cleaned according to the manufacturers’ instructions three successive times. For the robotic instruments, this involved manually brushing the outer surface while moving the instrument “wrists” through their full range of motion, followed by 15 minutes of ultrasonication with enzymatic detergent, flushing the lumen with a water gun through flush ports, and rinsing the entire instrument. For regular instruments, cleaning involved washer-disinfectors and included 5 minutes of ultrasonication, 10 minutes of spraying with an alkaline detergent, and 10 minutes of disinfection via heating.
The level of contamination declined with each successive cleaning but still remained comparatively high for the robotic instruments. The amount of protein contaminants released in the three cleanings was 650, 550, and 530 mcg per robotic instrument, compared with 16, 17, and 17 mcg per ordinary instrument.
The efficacy of cleaning was 97.6% for robotic instruments and 99.1% for regular instruments, the researchers reported.
This study was not designed to assess whether residual contamination is associated with adverse events such as infection in subsequent patients, and there are few data available on this topic.
“We have to recognize that there might be a considerable volume of insufficient cleaning or occult surgical site infections,” the investigators wrote.
New instrument washers equipped with a specific cleaning function for narrow lumens are becoming available, they noted, and “further study should be conducted using these washers with improved cleaning efficacy.”
The study was supported by the Japan Society for the Promotion of Science. The investigators reported having no relevant financial disclosures.
FROM INFECTION CONTROL AND HOSPITAL EPIDEMIOLOGY
Key clinical point:
Major finding: Immediately after surgery, robotic instruments were contaminated with 72.3 × 10³ mcg of protein each, compared with 5.5 × 10³ mcg of protein on regular instruments.
Data source: A single-center analysis of protein contamination before and after three successive cleanings on 65 instruments used for robotic surgery and 67 regular instruments used for open surgery.
Disclosures: This study was supported by the Japan Society for the Promotion of Science. The investigators reported having no relevant financial disclosures.
Long-term opioid use uncommon among trauma patients
WASHINGTON – Patients with traumatic injuries don’t appear to be at undue risk of sustained opioid use, a large database review has demonstrated.
More than half of the 13,000 patients in the study were discharged on opioids, but they were able to discontinue them fairly rapidly, Muhammad Chaudhary, MD, said at the annual clinical congress of the American College of Surgeons. Within 3 months, less than one-third were still using the drugs, and 1 year later, only 1% were still taking an opioid pain medication.

Dr. Chaudhary examined opioid use among 13,624 patients included in the Tricare military insurance database. The patients were treated for traumatic injuries they received during 2007-2013. Most of the patients were men (82%), and the largest age group was 18- to 24-year-olds (39%). Military rank was used as a proxy for socioeconomic status in this study: 15% of the cohort had an officer rank, while the rest were junior or senior enlisted personnel.
The group was very healthy, with a median Charlson Comorbidity Index score of 0. They were somewhat seriously injured, however. The median Injury Severity Score was 13, and the range was 9-17. Anxiety and depression were uncommon (9% and 7%, respectively).
More than half the patients (54%) were discharged on an opioid medication. That percentage dropped very rapidly. By 90 days after discharge, just 9% of patients were still taking the drugs. By 1 year, only 1% were using opioids.
Dr. Chaudhary conducted a multivariate analysis that controlled for a number of factors, including age, gender, marital status, rank, mental health status, injury severity, comorbidities, and treatment environment. Two factors – black race and younger age (18-24 years) – significantly increased the likelihood of early opioid discontinuation (8% and 11%, respectively). There were no significant interactions with anxiety or depression.
Junior enlisted personnel – the proxy group for lower socioeconomic status – and those with a prolonged length of stay were significantly less likely to get off the medications, Dr. Chaudhary said.
“While we strongly believe that these factors should not be used to determine who can get opioids, it might make sense to enhance perioperative surveillance and engage pain management services early on in patients with risk factors, to reduce the risk of sustained opioid use,” he concluded.
Dr. Chaudhary had no financial disclosures.
[email protected]
On Twitter @alz_gal
WASHINGTON – Patients with traumatic injuries don’t appear to be at undue risk of sustained opioid use, a large database review has demonstrated.
More than half of the 13,000 patients in the study were discharged on opioids, but they were able to discontinue them fairly rapidly, Muhammad Chaudhary, MD, said at the annual clinical congress of the American College of Surgeons. Within 3 months, less than one-third were still using the drugs, and 1 year later, only 1% were still taking an opioid pain medication.
Dr. Chaudhary examined opioid use among 13,624 patients included in the Tricare military insurance database. The patients were treated for traumatic injuries they received during 2007-2013. Most of the patients were men (82%), and the largest age group was 18- to 24-year-olds (39%). Military rank was used as a proxy for socioeconomic status in this study: 15% of the cohort had an officer rank, while the rest were junior or senior enlisted personnel.
The group was very healthy, with a median Charlson Comorbidity Index score of 0. They were somewhat seriously injured, however. The median Injury Severity Score was 13, and the range was 9-17. Anxiety and depression were uncommon (9% and 7%, respectively).
More than half the patients (54%) were discharged on an opioid medication. That percentage dropped very rapidly. By 90 days after discharge, just 9% of patients were still taking the drugs. By 1 year, only 1% were using opioids.
Dr. Chaudhary conducted a multivariate analysis that controlled for a number of factors, including age, gender, marital status, rank, mental health status, injury severity, comorbidities, and treatment environment. Two factors – black race and younger age (18-24 years) – significantly increased the likelihood of early opioid discontinuation (8% and 11%, respectively). There were no significant interactions with anxiety or depression.
Junior enlisted personnel – the proxy group for lower socioeconomic status – and those with a prolonged length of stay were significantly less likely to get off the medications, Dr. Chaudhary said.
“While we strongly believe that these factors should not be used to determine who can get opioids, it might make sense to enhance perioperative surveillance and engage pain management services early on in patients with risk factors, to reduce the risk of sustained opioid use,” he concluded.
Dr. Chaudhary had no financial disclosures.
[email protected]
On Twitter @alz_gal
AT THE ACS CLINICAL CONGRESS
Key clinical point:
Major finding: A year after discharge, only 1% of the patients were still using a prescription opioid pain medication.
Data source: A database review including 13,642 patients.
Disclosures: Dr. Chaudhary had no financial disclosures.
Loss of Independence after Surgery and Subsequent Outcomes in Older Patients
Clinical Question: What is the incidence of loss of independence (LOI) for older adults after surgery, and is there an association between LOI and readmission or death?

Background: LOI is being increasingly recognized as an important measure of patient-centered care and a potential opportunity for intervention to prevent disablement. This study is the first to examine links between LOI and rates of readmission or death following surgery.
Study Design: Retrospective cohort.
Setting: 26 U.S. hospitals participating in a national quality improvement project.
Synopsis: The authors examined data from 5,077 patients age 65 or older undergoing an inpatient surgical procedure. They examined ability to perform activities of daily living (ADLs), mobility, and living situation before and after surgery, and they defined LOI as a change in one or more of these factors at the time of discharge.
They found that LOI increased with age, with 49.9% of patients ages 65–74, 67.3% of patients ages 75–84, and 83.9% of patients age 85 or older experiencing LOI. The study also showed an association between LOI and negative outcomes, including readmission (odds ratio, 1.7) and death after discharge (odds ratio, 6.7).
Although this study was retrospective, the findings indicate that LOI is strongly correlated with negative short-term outcomes, especially in older populations. LOI related to surgery is a measure that deserves closer attention and greater future study as a potential target for clinical initiatives and intervention.
Bottom Line: LOI (functional ability, mobility, and living situation) after surgery increases with age and is associated with negative short-term outcomes including readmission and death.
Citation: Berian JR, Mohanty S, Ko CY, Rosenthal RA, Robinson TN. Association of loss of independence with readmission and death after discharge in older patients after surgical procedures. JAMA Surg. 2016;151(9):e161689.
Short Take
Transition to New Electronic Health Records Systems Does Not Increase Adverse Outcomes
An observational study comparing 17 hospitals implementing new electronic health records systems with 399 control hospitals showed no difference in the rate of adverse safety events or readmissions following implementation.
Citation: Barnett ML, Mehrotra A, Jena AB. Adverse inpatient outcomes during the transition to a new electronic health record system: observational study. BMJ. 2016;354:i3835.
Clinical Question: What is the incidence of loss of independence (LOI) for older adults after surgery, and is there an association between LOI and readmission or death?
Background: LOI is being increasingly recognized as an important measure of patient-centered care and a potential opportunity for intervention to prevent disablement. This study is the first to examine links between LOI and rates of readmission or death following surgery.
Study Design: Retrospective cohort.
Setting: 26 U.S. hospitals participating in a national quality improvement project.
Synopsis: The authors examined data from 5,077 patients age 65 or older undergoing an inpatient surgical procedure. They examined ability to perform activities of daily living (ADLs), mobility, and living situation before and after surgery, and they defined LOI as a change in one or more of these factors at the time of discharge.
They found that LOI increased with age, with 49.9% of patients ages 65–74, 67.3% of patients ages 75–84, and 83.9% of patients age 85 or older experiencing LOI. The study also showed an association between LOI and negative outcomes, including readmission (odds ratio, 1.7) and death after discharge (odds ratio, 6.7).
Although this study was retrospective, the findings indicate that LOI is strongly correlated with negative short-term outcomes, especially in older populations. LOI related to surgery is a measure that deserves closer attention and greater future study as a potential target for clinical initiatives and intervention.
Bottom Line: LOI (functional ability, mobility, and living situation) after surgery increases with age and is associated with negative short-term outcomes including readmission and death.
Citation: Berian JR, Mohanty S, Ko CY, Rosenthal RA, Robinson TN. Association of loss of independence with readmission and death after discharge in older patients after surgical procedures. JAMA Surg. 2016;151(9):e161689.
Short Take
Transition to New Electronic Health Records Systems Does Not Increase Adverse Outcomes
An observational study comparing 17 hospitals implementing new electronic health records systems with 399 control hospitals showed no difference in the rate of adverse safety events or readmissions following implementation.
Citation: Barnett ML, Mehrotra A, Jena AB. Adverse inpatient outcomes during the transition to a new electronic health record system: observational study. BMJ. 2016;354:i3835.

Euthanasia and Physician-Assisted Suicide Remain Rare and Primarily Involve Cancer Patients
Clinical Question: What data are available regarding the attitudes toward and the practice of euthanasia and physician-assisted suicide (PAS)?
Background: Although controversial, euthanasia and PAS are currently legal in the Netherlands, Belgium, Luxembourg, Colombia, and Canada, while PAS (but not euthanasia) is legal in Switzerland and five states (Oregon, Washington, Montana, Vermont, and California). Knowledge about current practices is limited as only a portion of these jurisdictions have reporting requirements.
Study Design: Literature review with a focus on original data.
Setting: Data from United States, Canada, and Europe.
Synopsis: Published data from 1947 to 2016 were reviewed. U.S. public opinion surveys show a recent decline in support of PAS, from a peak of 75% in 2005 to 64% in 2012. With the exception of the Netherlands and Belgium, physicians in the U.S., Europe, and Australia are less supportive than the general public.
In the U.S., <20% of physicians reported receiving a request for euthanasia or PAS, and <5% complied. Oncologists are most likely to receive a patient request. The typical patient is older, white, insured, well-educated, and enrolled in hospice. Seventy-five percent have cancer, while 15% have neurodegenerative conditions. Loss of autonomy and dignity are common motivators, while <33% of patients cite uncontrolled pain. PAS remains rare, accounting for <0.4% of all deaths. Existing data do not indicate abuse of these practices.
The authors emphasize that existing data are limited and recommend that all countries, not just those where euthanasia and/or PAS are legal, should formally collect information on end-of-life practices.
Bottom Line: Euthanasia and PAS remain relatively rare and primarily involve oncology patients despite increasing legalization.
Citation: Emanuel EJ, Onwuteaka-Philipsen BD, Urwin JW, Cohen J. Attitudes and practices of euthanasia and physician-assisted suicide in the United States, Canada, and Europe. JAMA. 2016;316(1):79-90.
Short Take
Peer Support for Physicians May Curb Burnout
This perspective piece outlines a program of one-to-one peer outreach for physicians as a way to mitigate stress especially when dealing with adverse events or litigation, but no data are provided.
Citation: Shapiro J, Galowitz P. Peer support for clinicians: a programmatic approach. Acad Med. 2016;91(9):1200-1204.
Mutations aid resistance, growth of malaria parasite

Plasmodium falciparum
Image from CDC/Mae Melvin
Some mutations that enable drug resistance in the malaria parasite Plasmodium falciparum may also help it grow, according to a study published in PLOS Pathogens.
Some strains of P falciparum have evolved to become resistant to antimalarial drugs, including chloroquine.
Often, chloroquine resistance mutations hinder P falciparum’s ability to infect the bloodstream and grow.
However, in a previous study, researchers discovered that a uniquely mutated version of the P falciparum gene pfcrt provides drug resistance while avoiding the detrimental impact of growth seen with other mutated pfcrt variants.
In the new study, the same group of researchers—Stanislaw Gabryszewski, of Columbia University Medical Center in New York, and his colleagues—investigated this version of the pfcrt gene, which is called Cam734 and has been found in certain regions in Southeast Asia.
Using zinc-finger nucleases, the team characterized the individual mutations unique to Cam734 in terms of their effects on drug resistance, metabolism, and growth rates in living parasites.
The researchers found that a mutation called A144F is required for the chloroquine resistance enabled by Cam734, and this mutation also contributes to resistance to the drugs amodiaquine and quinine.
The team identified additional mutations that contribute to resistance to chloroquine and impact the potency of other antimalarials as well.
When the researchers reversed these mutations in living parasites that had the Cam734 allele, growth slowed, indicating that these mutations also enhance infection.
Additional experiments revealed specific effects of Cam734 mutations on several metabolic pathways in P falciparum, including the digestion of human hemoglobin that parasites use to obtain amino acids for protein synthesis.
The researchers also found evidence suggesting that Cam734 helps to maintain an electrochemical gradient that allows the protein encoded by the pfcrt gene to thwart the cellular effects of chloroquine.
The team said these findings broaden our understanding of Cam734, the second most common variant of the pfcrt gene in Southeast Asia. The findings identify multiple intracellular processes and multidrug resistance phenotypes impacted by changes in pfcrt and can help inform future malaria treatment efforts. ![]()