User login
Longer metronidazole treatment is better than 1-day dose for women with trichomoniasis
"SHOULD THE LENGTH OF TREATMENT FOR TRICHOMONIASIS IN WOMEN BE RECONSIDERED?"
PATRICK DUFF, MD (MARCH 2017)
Longer metronidazole treatment is better than 1-day dose for women with trichomoniasis
From 37 years of experience as a Women's Healthcare Nurse Practitioner, I have found it is always better to prescribe metronidazole 500 mg bid for 7 days rather than 1-day treatment for women. I will prescribe 1-day treatment for men. I have been treating men and women using these regimens in a sexually transmitted diseases clinic for nearly 5 years. Colleagues have used the 1-time dose for women and it rarely works as well as the 7-day dose. However, I am always concerned about men taking the medication for 7 days, because often they are not symptomatic and they may stop taking their medication early if given the 1-week regimen, so I usually prescribe the 1-day dose for men. I wish more prescribers would offer treatment for the male partners, as they may not be symptomatic or may not want to spend the money to visit a provider. In my state, it is legal to prescribe for the partner without seeing him, and the Centers for Disease Control and Prevention suggests doing so. We encourage the men to come in but if the partner says he is unlikely to, we will treat without seeing him.
Carol Glascock, WHNP-BC
Columbia, Missouri
Dr. Duff responds
I appreciate Ms. Glascock's thoughtful comments. I am pleased that her years of clinical experience support the main conclusion reached by Howe and Kissinger that, in general, patients do better when they receive multidose therapy for trichomonas infection.1 I agree with Ms. Glascock's observation that single-dose therapy still has a role in situations in which patients may not be adherent with multidose therapy, such as the asymptomatic male partner of an infected woman. I also agree wholeheartedly that women will have less likelihood of recurrence when their partner receives adequate antibiotic treatment. I concur that, in states where this practice is legally permissible, we should be willing to offer antibiotic therapy to the partner of our female patient.
Share your thoughts! Send your Letter to the Editor to [email protected]. Please include your name and the city and state in which you practice.
- Howe K, Kissinger PJ. Single-dose compared with multidose metronidazole for the treatment of trichomoniasis in women: a meta-analysis. Sex Transm Dis. 2017;44(1):29-24.
"SHOULD THE LENGTH OF TREATMENT FOR TRICHOMONIASIS IN WOMEN BE RECONSIDERED?"
PATRICK DUFF, MD (MARCH 2017)
Longer metronidazole treatment is better than 1-day dose for women with trichomoniasis
From 37 years of experience as a Women's Healthcare Nurse Practitioner, I have found it is always better to prescribe metronidazole 500 mg bid for 7 days rather than 1-day treatment for women. I will prescribe 1-day treatment for men. I have been treating men and women using these regimens in a sexually transmitted diseases clinic for nearly 5 years. Colleagues have used the 1-time dose for women and it rarely works as well as the 7-day dose. However, I am always concerned about men taking the medication for 7 days, because often they are not symptomatic and they may stop taking their medication early if given the 1-week regimen, so I usually prescribe the 1-day dose for men. I wish more prescribers would offer treatment for the male partners, as they may not be symptomatic or may not want to spend the money to visit a provider. In my state, it is legal to prescribe for the partner without seeing him, and the Centers for Disease Control and Prevention suggests doing so. We encourage the men to come in but if the partner says he is unlikely to, we will treat without seeing him.
Carol Glascock, WHNP-BC
Columbia, Missouri
Dr. Duff responds
I appreciate Ms. Glascock's thoughtful comments. I am pleased that her years of clinical experience support the main conclusion reached by Howe and Kissinger that, in general, patients do better when they receive multidose therapy for trichomonas infection.1 I agree with Ms. Glascock's observation that single-dose therapy still has a role in situations in which patients may not be adherent with multidose therapy, such as the asymptomatic male partner of an infected woman. I also agree wholeheartedly that women will have less likelihood of recurrence when their partner receives adequate antibiotic treatment. I concur that, in states where this practice is legally permissible, we should be willing to offer antibiotic therapy to the partner of our female patient.
Share your thoughts! Send your Letter to the Editor to [email protected]. Please include your name and the city and state in which you practice.
- Howe K, Kissinger PJ. Single-dose compared with multidose metronidazole for the treatment of trichomoniasis in women: a meta-analysis. Sex Transm Dis. 2017;44(1):29-24.
- Howe K, Kissinger PJ. Single-dose compared with multidose metronidazole for the treatment of trichomoniasis in women: a meta-analysis. Sex Transm Dis. 2017;44(1):29-24.

Hydralazine-Associated Cutaneous Vasculitis Presenting With Aerodigestive Tract Involvement
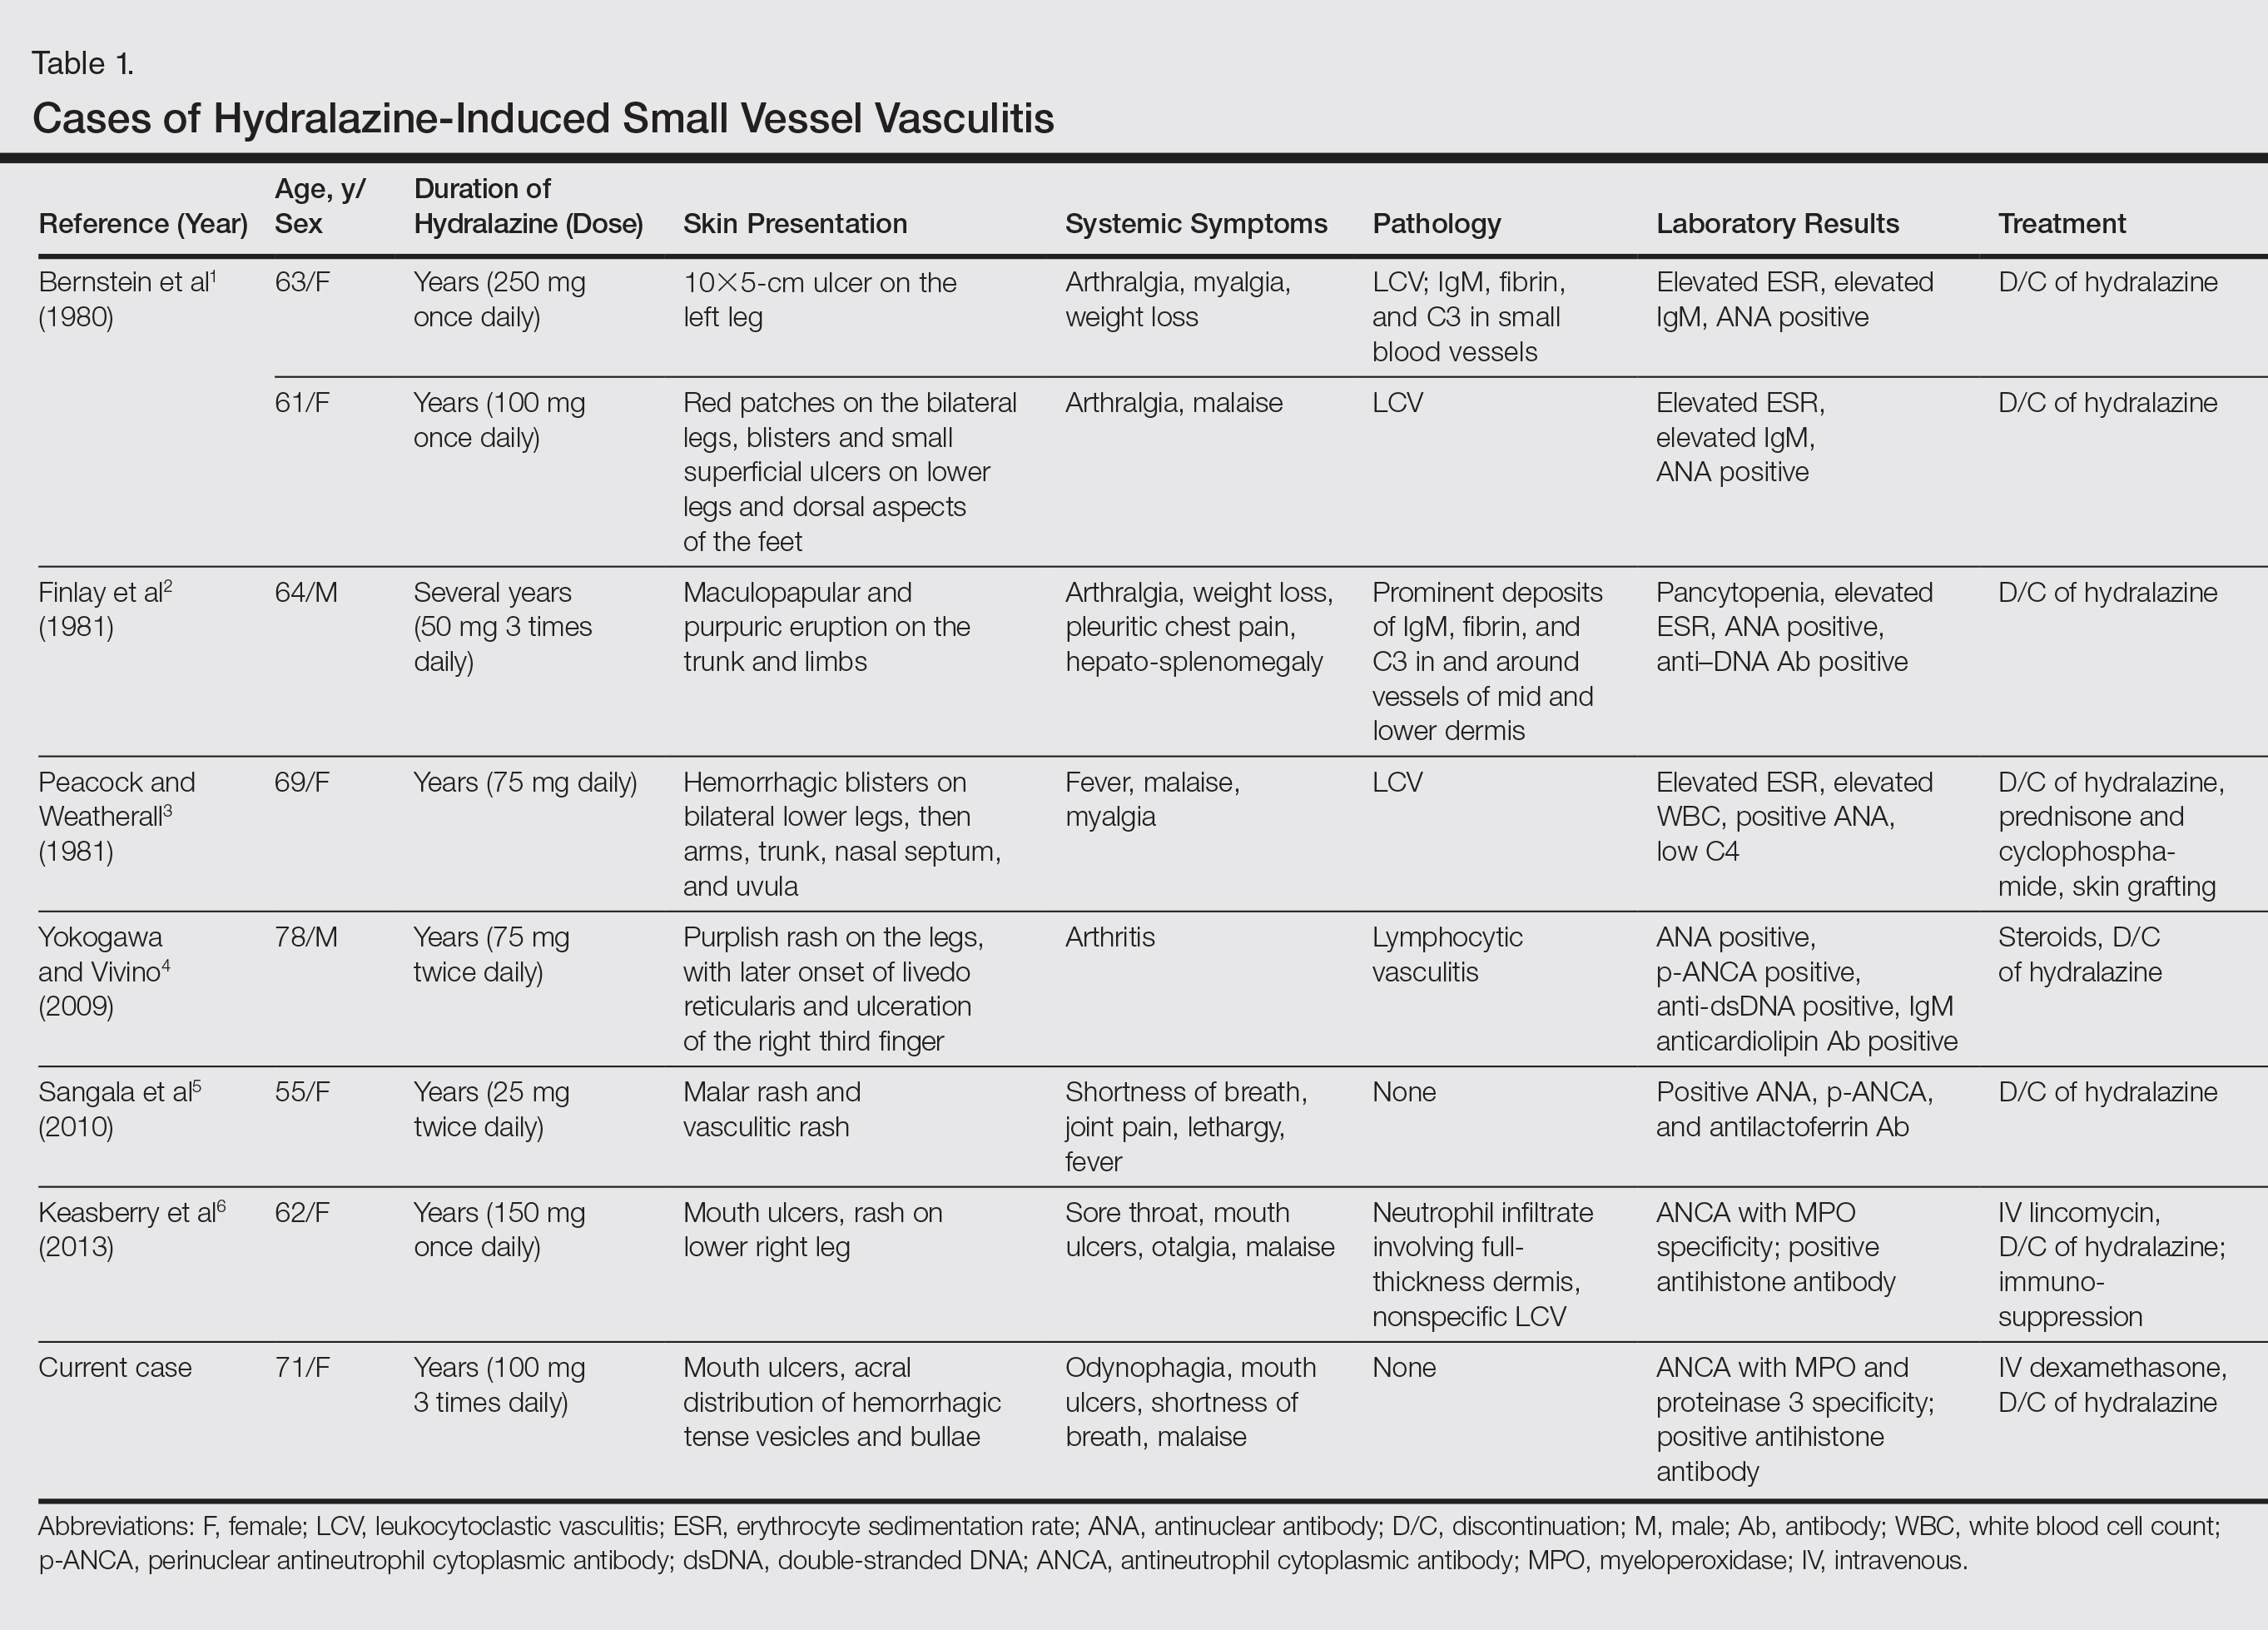
Hydralazine-induced antineutrophil cytoplasmic antibody (ANCA)–positive vasculitis is a complex entity characterized by a distinctive clinical presentation comprising acral hemorrhagic vesiculopustules and necrotic ulcerations, at times with severe mucosal involvement. Although it is an established entity, a PubMed search of articles indexed for MEDLINE using the terms hydralazine vasculitis, ANCA positive vasculitis, and hydralazine associated vasculitis revealed a limited number of cases reported in the dermatologic literature (Table 1).1-6 We report a rare case of hydralazine-induced vasculitis associated with airway compromise and severe gastrointestinal tract bleeding.
RELATED ARTICLE: Sweet Syndrome Associated With Hydralazine-Induced Lupus Erythematosus
Case Report
A 71-year-old woman with a history of end-stage renal disease treated with hemodialysis, as well as hypertension, diabetes mellitus, and ischemic cardiomyopathy, presented to our emergency department with odynophagia, muscle weakness, shortness of breath, and a distinctive mucocutaneous eruption on the left eyelid, lips, and tongue of 2 days’ duration. Physical examination revealed an ill-appearing, afebrile, dyspneic woman with swelling of the left upper eyelid, conjunctival injection, ulcerations on the lips and tongue, and tense hemorrhagic vesicles, as well as vesiculopustules on the elbows, palms, fingers, lower legs, and toes (Figure 1). Given her dyspnea, flexible laryngoscopy was performed and revealed ulceration and edema involving the epiglottis, aryepiglottic folds, and arytenoids. The patient was intubated for airway protection and started on intravenous dexamethasone.

An extensive diagnostic workup commenced. Bacterial, viral, and fungal cultures of blood, skin tissue, and respiratory secretions, as well as human immunodeficiency virus screening, were all negative. Specifically, a tissue culture was performed on skin from the left thigh, viral culture and direct fluorescent antibody were performed on a vesicle on the right knee for herpes simplex virus and herpes zoster, and a superficial wound culture was taken from the left arm, all showing no growth. The patient’s home medications were reviewed and revealed she was currently taking hydralazine (100 mg 3 times daily), which was started approximately 2 years prior. Laboratory results revealed a positive antinuclear antibody titer of 1:320 (diffuse pattern), positive antihistone antibody, and positive ANCA with cytoplasmic and perinuclear accentuation (Table 2). Enzyme-linked immunosorbent assays showed IgG antibodies to myeloperoxidase (MPO) and proteinase 3 (Table 2). Skin biopsies from the right lower leg and right upper arm were compatible with necrotizing leukocytoclastic vasculitis characterized by mural and luminal fibrin deposition involving capillaries and venules of the superficial and deep dermis (Figure 2). The vessel walls were infiltrated by neutrophils with concomitant leukocytoclasia. Vessels in the mid dermis were occluded by cellular fibrin thrombi. Foci of neutrophilic interface dermatitis with subepidermal bulla formation were observed. Infectious stains were negative. On direct immunofluorescence, striking homogeneous mantles of staining of IgG were present within the cutaneous vasculature.


Because the infectious workup was negative and there was no other known instigating factor of vasculitis, concern for a drug-induced process prompted thorough review of the patient’s home medications and discontinuation of hydralazine. A diagnosis of hydralazine-associated cutaneous vasculitis was made when laboratory workup confirmed no underlying infectious process or rheumatologic condition and the medication known to cause her symptoms was on her medication list. The dexamethasone dose was increased, leading to rapid improvement of her mucocutaneous findings; however, on initiation of a steroid taper, she developed substantial gastrointestinal tract bleeding. An esophageal biopsy revealed a neutrophil-rich necrotizing process that essentially mirrored the cutaneous biopsy consistent with vasculitic involvement of the gastrointestinal tract. Steroids were again increased with resolution in gastrointestinal tract bleeding.
Comment
Our case highlights a distinct clinical presentation of hydralazine-induced ANCA-positive cutaneous vasculitis associated with severe involvement of the aerodigestive tract with gastrointestinal tract bleeding and airway compromise requiring intubation. Although discontinuation of hydralazine and in certain cases the addition of immunosuppressive agents may be adequate for resolution of symptoms, some cases progress despite treatment, leading to skin grafting, amputation, and death.3,4 Therefore, early recognition of hydralazine-induced cutaneous vasculitis and discontinuation of hydralazine are of paramount importance.
Reporting hydralazine-induced vasculitis is valuable because of its unique cutaneous, extracutaneous, and serologic findings. In our case, the cutaneous vasculitis presented clinically with acral hemorrhagic vesiculopustules and necrotic ulcerations resembling septic emboli, as opposed to classic lesions of palpable purpura typical of drug-induced leukocytoclastic vasculitis. Similar cutaneous findings have been described in other cases of hydralazine-induced vasculitis, indicating that this pattern of acral pseudoembolic vesiculopustules with necrosis and ulceration is characteristic of this entity.1,3,6 In addition, involvement of the oral cavity, larynx, and gastrointestinal tract have been reported in cases of hydralazine-induced vasculitis, indicating mucosal involvement is an important feature of this disease.3,6 Although involvement of the oral mucosa, larynx, and acral sites appears to be characteristic, the exact basis for this site localization remains elusive. A precedent has been established for a similar pattern of intraoral and laryngeal involvement in other ANCA-positive vasculitic syndromes, most notably Wegener granulomatosis.7 Similarly, there are certain occlusive vasculitic syndromes that show acral localization including chronic septic vasculitis and vasculitis of collagen vascular disease.
Serologic trends can aid in diagnosing hydralazine-induced vasculitis. In theory, the nonspecific cutaneous findings, often in association with joint pain and positive antinuclear antibodies, may lead clinicians to the misdiagnosis of a connective tissue disease, such as systemic lupus erythematosus (SLE). However, unlike SLE, hydralazine-induced vasculitis is associated with positive ANCAs, while antibodies against double-stranded DNA, a highly specific antibody for SLE, are uncommon.8,9 Our patient had both positive perinuclear ANCA with cytoplasmic ANCA as well as a positive antihistone antibodies, a combination highly suggestive of a drug-induced process.
Despite the often acute presentation of hydralazine-induced ANCA-positive vasculitis, afflicted patients have characteristically been on the drug for a long period of time. Our patient is exemplary of most reported cases, as the time from initiation of hydralazine to onset of vasculitis was 2 years.4
The mechanism by which hydralazine causes this reaction is still a matter of debate. It seems clear that there are certain at-risk populations, such as slow acetylators and patients with an underlying hypercoagulable state. There are several theories by which hydralazine induces autoantibody formation. The first involves hydralazine metabolization by MPO released from activated neutrophils to form reactive intermediate metabolites. Such metabolites can be cytotoxic and may cause abnormal degradation of chromatin in susceptible individuals, leading to an autoimmune response against histone-DNA complexes. Alternatively, hydralazine may act as a hapten and bind to MPO, inducing an immune response against the hydralazine-MPO complex, with resultant formation of anti-MPO antibodies in susceptible individuals.10
Conclusion
Hydralazine-induced ANCA-positive vasculitis is a syndromic complex characterized by a distinctive clinical presentation comprising acral hemorrhagic vesiculopustules and necrotic ulcerations, at times with severe mucosal involvement along with a characteristic ANCA-positive serologic profile. Drug withdrawal is the cornerstone of therapy, and depending on the severity of symptoms, additional immunosuppressive treatment such as corticosteroids may be necessary. Older age of onset, female gender, and underlying autoimmune diatheses likely define important risk factors. With more recognition and reporting of this disease, further trends in both clinical and serological presentation will emerge.
- Bernstein RM, Egerton-Vernon J, Webster J. Hydrallazine-induced cutaneous vasculitis. Br Med J. 1980;280:156-157.
- Finlay AY, Statham B, Knight AG. Hydrallazine-induced necrotising vasculitis. Br Med J (Clin Res Ed). 1981;282:1703-1704.
- Peacock A, Weatherall D. Hydralazine-induced necrotising vasculitis. Br Med J (Clin Res Ed). 1981;282:1121-1122.
- Yokogawa N, Vivino FB. Hydralazine-induced autoimmune disease: comparison to idiopathic lupus and ANCA-positive vasculitis. Mod Rheumatol. 2009;19:338-347.
- Sangala N, Lee RW, Horsfield C, et al. Combined ANCA-associated vasculitis and lupus syndrome following prolonged use of hydralazine: a timely reminder of an old foe. Int Urol Nephrol. 2010;42:503-506.
- Keasberry J, Frazier J, Isbel NM, et al. Hydralazine-induced anti-neutrophil cytoplasmic antibody-positive renal vasculitis presenting with a vasculitic syndrome, acute nephritis and a puzzling skin rash: a case report. J Med Case Rep. 2013;7:20.
- Wojciechowska J, Krajewski W, Krajewski P, et al. Granulomatosis with polyangiitis in otolaryngologist practice: a review of current knowledge. Clin Exp Otorhinolaryngol. 2016;9:8-13.
- Short AK, Lockwood CM. Antigen specificity in hydralazine associated ANCA positive systemic vasculitis. QJM. 1995;88:775-783.
- Nässberger L, Hultquist R, Sturfelt G. Occurrence of anti-lactoferrin antibodies in patients with systemic lupus erythematosus, hydralazine-induced lupus, and rheumatoid arthritis. Scand J Rheumatol. 1994;23:206-210.
- Cambridge G, Wallace H, Bernstein RM, et al. Autoantibodies to myeloperoxidase in idiopathic and drug-induced systemic lupus erythematosus and vasculitis. Br J Rheumatol. 1994;33:109-114.
Hydralazine-induced antineutrophil cytoplasmic antibody (ANCA)–positive vasculitis is a complex entity characterized by a distinctive clinical presentation comprising acral hemorrhagic vesiculopustules and necrotic ulcerations, at times with severe mucosal involvement. Although it is an established entity, a PubMed search of articles indexed for MEDLINE using the terms hydralazine vasculitis, ANCA positive vasculitis, and hydralazine associated vasculitis revealed a limited number of cases reported in the dermatologic literature (Table 1).1-6 We report a rare case of hydralazine-induced vasculitis associated with airway compromise and severe gastrointestinal tract bleeding.
RELATED ARTICLE: Sweet Syndrome Associated With Hydralazine-Induced Lupus Erythematosus
Case Report
A 71-year-old woman with a history of end-stage renal disease treated with hemodialysis, as well as hypertension, diabetes mellitus, and ischemic cardiomyopathy, presented to our emergency department with odynophagia, muscle weakness, shortness of breath, and a distinctive mucocutaneous eruption on the left eyelid, lips, and tongue of 2 days’ duration. Physical examination revealed an ill-appearing, afebrile, dyspneic woman with swelling of the left upper eyelid, conjunctival injection, ulcerations on the lips and tongue, and tense hemorrhagic vesicles, as well as vesiculopustules on the elbows, palms, fingers, lower legs, and toes (Figure 1). Given her dyspnea, flexible laryngoscopy was performed and revealed ulceration and edema involving the epiglottis, aryepiglottic folds, and arytenoids. The patient was intubated for airway protection and started on intravenous dexamethasone.
An extensive diagnostic workup commenced. Bacterial, viral, and fungal cultures of blood, skin tissue, and respiratory secretions, as well as human immunodeficiency virus screening, were all negative. Specifically, a tissue culture was performed on skin from the left thigh, viral culture and direct fluorescent antibody were performed on a vesicle on the right knee for herpes simplex virus and herpes zoster, and a superficial wound culture was taken from the left arm, all showing no growth. The patient’s home medications were reviewed and revealed she was currently taking hydralazine (100 mg 3 times daily), which was started approximately 2 years prior. Laboratory results revealed a positive antinuclear antibody titer of 1:320 (diffuse pattern), positive antihistone antibody, and positive ANCA with cytoplasmic and perinuclear accentuation (Table 2). Enzyme-linked immunosorbent assays showed IgG antibodies to myeloperoxidase (MPO) and proteinase 3 (Table 2). Skin biopsies from the right lower leg and right upper arm were compatible with necrotizing leukocytoclastic vasculitis characterized by mural and luminal fibrin deposition involving capillaries and venules of the superficial and deep dermis (Figure 2). The vessel walls were infiltrated by neutrophils with concomitant leukocytoclasia. Vessels in the mid dermis were occluded by cellular fibrin thrombi. Foci of neutrophilic interface dermatitis with subepidermal bulla formation were observed. Infectious stains were negative. On direct immunofluorescence, striking homogeneous mantles of staining of IgG were present within the cutaneous vasculature.
Because the infectious workup was negative and there was no other known instigating factor of vasculitis, concern for a drug-induced process prompted thorough review of the patient’s home medications and discontinuation of hydralazine. A diagnosis of hydralazine-associated cutaneous vasculitis was made when laboratory workup confirmed no underlying infectious process or rheumatologic condition and the medication known to cause her symptoms was on her medication list. The dexamethasone dose was increased, leading to rapid improvement of her mucocutaneous findings; however, on initiation of a steroid taper, she developed substantial gastrointestinal tract bleeding. An esophageal biopsy revealed a neutrophil-rich necrotizing process that essentially mirrored the cutaneous biopsy consistent with vasculitic involvement of the gastrointestinal tract. Steroids were again increased with resolution in gastrointestinal tract bleeding.
Comment
Our case highlights a distinct clinical presentation of hydralazine-induced ANCA-positive cutaneous vasculitis associated with severe involvement of the aerodigestive tract with gastrointestinal tract bleeding and airway compromise requiring intubation. Although discontinuation of hydralazine and in certain cases the addition of immunosuppressive agents may be adequate for resolution of symptoms, some cases progress despite treatment, leading to skin grafting, amputation, and death.3,4 Therefore, early recognition of hydralazine-induced cutaneous vasculitis and discontinuation of hydralazine are of paramount importance.
Reporting hydralazine-induced vasculitis is valuable because of its unique cutaneous, extracutaneous, and serologic findings. In our case, the cutaneous vasculitis presented clinically with acral hemorrhagic vesiculopustules and necrotic ulcerations resembling septic emboli, as opposed to classic lesions of palpable purpura typical of drug-induced leukocytoclastic vasculitis. Similar cutaneous findings have been described in other cases of hydralazine-induced vasculitis, indicating that this pattern of acral pseudoembolic vesiculopustules with necrosis and ulceration is characteristic of this entity.1,3,6 In addition, involvement of the oral cavity, larynx, and gastrointestinal tract have been reported in cases of hydralazine-induced vasculitis, indicating mucosal involvement is an important feature of this disease.3,6 Although involvement of the oral mucosa, larynx, and acral sites appears to be characteristic, the exact basis for this site localization remains elusive. A precedent has been established for a similar pattern of intraoral and laryngeal involvement in other ANCA-positive vasculitic syndromes, most notably Wegener granulomatosis.7 Similarly, there are certain occlusive vasculitic syndromes that show acral localization including chronic septic vasculitis and vasculitis of collagen vascular disease.
Serologic trends can aid in diagnosing hydralazine-induced vasculitis. In theory, the nonspecific cutaneous findings, often in association with joint pain and positive antinuclear antibodies, may lead clinicians to the misdiagnosis of a connective tissue disease, such as systemic lupus erythematosus (SLE). However, unlike SLE, hydralazine-induced vasculitis is associated with positive ANCAs, while antibodies against double-stranded DNA, a highly specific antibody for SLE, are uncommon.8,9 Our patient had both positive perinuclear ANCA with cytoplasmic ANCA as well as a positive antihistone antibodies, a combination highly suggestive of a drug-induced process.
Despite the often acute presentation of hydralazine-induced ANCA-positive vasculitis, afflicted patients have characteristically been on the drug for a long period of time. Our patient is exemplary of most reported cases, as the time from initiation of hydralazine to onset of vasculitis was 2 years.4
The mechanism by which hydralazine causes this reaction is still a matter of debate. It seems clear that there are certain at-risk populations, such as slow acetylators and patients with an underlying hypercoagulable state. There are several theories by which hydralazine induces autoantibody formation. The first involves hydralazine metabolization by MPO released from activated neutrophils to form reactive intermediate metabolites. Such metabolites can be cytotoxic and may cause abnormal degradation of chromatin in susceptible individuals, leading to an autoimmune response against histone-DNA complexes. Alternatively, hydralazine may act as a hapten and bind to MPO, inducing an immune response against the hydralazine-MPO complex, with resultant formation of anti-MPO antibodies in susceptible individuals.10
Conclusion
Hydralazine-induced ANCA-positive vasculitis is a syndromic complex characterized by a distinctive clinical presentation comprising acral hemorrhagic vesiculopustules and necrotic ulcerations, at times with severe mucosal involvement along with a characteristic ANCA-positive serologic profile. Drug withdrawal is the cornerstone of therapy, and depending on the severity of symptoms, additional immunosuppressive treatment such as corticosteroids may be necessary. Older age of onset, female gender, and underlying autoimmune diatheses likely define important risk factors. With more recognition and reporting of this disease, further trends in both clinical and serological presentation will emerge.
- Bernstein RM, Egerton-Vernon J, Webster J. Hydrallazine-induced cutaneous vasculitis. Br Med J. 1980;280:156-157.
- Finlay AY, Statham B, Knight AG. Hydrallazine-induced necrotising vasculitis. Br Med J (Clin Res Ed). 1981;282:1703-1704.
- Peacock A, Weatherall D. Hydralazine-induced necrotising vasculitis. Br Med J (Clin Res Ed). 1981;282:1121-1122.
- Yokogawa N, Vivino FB. Hydralazine-induced autoimmune disease: comparison to idiopathic lupus and ANCA-positive vasculitis. Mod Rheumatol. 2009;19:338-347.
- Sangala N, Lee RW, Horsfield C, et al. Combined ANCA-associated vasculitis and lupus syndrome following prolonged use of hydralazine: a timely reminder of an old foe. Int Urol Nephrol. 2010;42:503-506.
- Keasberry J, Frazier J, Isbel NM, et al. Hydralazine-induced anti-neutrophil cytoplasmic antibody-positive renal vasculitis presenting with a vasculitic syndrome, acute nephritis and a puzzling skin rash: a case report. J Med Case Rep. 2013;7:20.
- Wojciechowska J, Krajewski W, Krajewski P, et al. Granulomatosis with polyangiitis in otolaryngologist practice: a review of current knowledge. Clin Exp Otorhinolaryngol. 2016;9:8-13.
- Short AK, Lockwood CM. Antigen specificity in hydralazine associated ANCA positive systemic vasculitis. QJM. 1995;88:775-783.
- Nässberger L, Hultquist R, Sturfelt G. Occurrence of anti-lactoferrin antibodies in patients with systemic lupus erythematosus, hydralazine-induced lupus, and rheumatoid arthritis. Scand J Rheumatol. 1994;23:206-210.
- Cambridge G, Wallace H, Bernstein RM, et al. Autoantibodies to myeloperoxidase in idiopathic and drug-induced systemic lupus erythematosus and vasculitis. Br J Rheumatol. 1994;33:109-114.
Practice Points
- Hydralazine-induced small vessel vasculitis has a characteristic pattern of acral pseudoembolic vesiculopustules with necrosis and ulceration, along with involvement of the aerodigestive tract.
- Unlike systemic lupus erythematosus (SLE), hydralazine-induced vasculitis is associated with positive antineutrophil cytoplasmic antibodies, while antibodies against double-stranded DNA, a highly specific antibody for SLE, are uncommon.
- Increased recognition of the clinical and serological features of hydralazine-induced small vessel vasculitis may lead to earlier recognition of this disease and decreased time to discontinuation of hydralazine when appropriate.

Modern estrogen ‘microdoses’ in contraceptives did not increase risk of melanoma
PORTLAND, ORE. – Long-term exposure to commonly used estrogen-based contraceptives was not associated with malignant melanoma in a single-center retrospective study of more than 77,000 women.
This null result belied decades-old studies performed when contraceptives contained much higher doses of estrogen, Kelly A. Mueller of Northwestern University, Chicago, said in a poster presented at the annual meeting of the Society for Investigative Dermatology. Current microdosing of ethinyl estradiol (EE) “is not associated with subsequent diagnosis of melanoma in our population, and is not inconsistent with the full prescribing information for commonly prescribed contraceptives containing EE,” she said. The study also shows how large retrospective analyses of long-term follow-up data can inform pharmacovigilance for rare, serious medical events.
To help clarify whether current microdosing (10-40 mcg/day) of EE can increase melanoma risk, the researchers compared 2,425 women prescribed oral, vaginal ring, or skin patch EE contraceptives for at least 12 months with 74,868 unexposed women. For both groups, initial clinical encounters occurred between 2001 and 2011, women were followed for at least 5 years, and none had a baseline history of melanoma or exogenous estrogen exposure. The data source was the Northwestern Medicine Enterprise Data Warehouse, which integrates electronic medical records from more than 4 million patients in the urban Midwest.
When first seen, patients tended to be in their late 20s and ranged in age between 18 and 40 years. Excluding cutaneous malignant melanomas diagnosed within 12 months of initial contraceptive prescription left three cases in the exposed group and 194 cases in the unexposed group, which translated to statistically similar rates of melanoma (0.1% and 0.3%, respectively; P = 0.3). The three cases in the exposed group were diagnosed between 37 and 92 months after initial prescription of EE contraceptives, but “the limited sample size for the outcome of interest did not allow for further analyses,” she reported. Nevertheless, the findings suggest no link between long-term microdosing of EE exposure and cutaneous melanoma, Ms. Mueller added.
The National Institutes of Health helps support the Northwestern Enterprise Data Warehouse. Ms. Mueller and her associates had no relevant financial conflicts of interest.
AT SID 2017
Key clinical point: Long-term exposure to modern “microdoses” of ethinyl estradiol in contraceptives was not associated with malignant melanoma.
Major finding: Rates were 0.1% in the exposed group and 0.3% in the unexposed group (P = .3).
Data source: A retrospective cohort study of 77,293 women.
Disclosures: The National Institutes of Health helps support the Northwestern Medicine Enterprise Data Warehouse. Ms. Mueller and her associates had no relevant financial conflicts of interest.
Tweaking CBT may boost outcomes in hoarding disorder
SAN FRANCISCO – Cognitive-behavioral therapy for hoarding disorder leaves substantial room for improvement in efficacy, and additional therapeutic attention to maladaptive beliefs regarding perfectionism just might be the answer, Hannah C. Levy, PhD, said at the annual conference of the Anxiety and Depression Association of America.
She presented a secondary analysis of the relationship between cognitive-behavioral therapy (CBT) outcomes and baseline maladaptive beliefs in a wait list–controlled study of 36 patients with hoarding disorder (HD) who were not on psychiatric medication. Her purpose was to identify which cognitive domains predicted treatment outcome. This, in turn, could point the way to new treatment targets.

In contrast, the baseline strength of Saving Cognitions Inventory maladaptive beliefs about saving, such as emotional attachment to hoarded objects or a belief that keeping those objects is the only way to be able to remember an important event, proved unrelated to CBT outcomes. And this finding may help explain CBT’s limited effectiveness in HD.
“I think traditionally our CBT interventions are more focused on the maladaptive saving beliefs. We’re currently not doing a whole lot about the perfectionism ideas that people may be bringing in,” said Dr. Levy of the anxiety disorders center at the Institute of Living in Hartford, Conn.
A strong unmet need exists for novel targets for CBT in hoarding disorder to improve current less-than-stellar outcomes, she said. A recent meta-analysis demonstrated that while CBT did provide a statistically significant benefit for this common and often disabling disease, outcomes were far from optimal. Indeed, after completing their course of CBT, patients still scored an average of 3 standard deviations above mean normal for scores on the SI-R (Depress Anxiety. 2015 Mar;32[3]:158-66).
Other investigators have recognized the limitations of current CBT for HD and tried tweaking the therapy to boost efficacy. These efforts have included formal studies incorporating home visits, adding cognitive remediation to reduce the neuropsychological deficits often present in patients with HD, and/or extending the treatment duration to 26 weekly sessions from the current standard of 15 or 16.
Unfortunately, none of these innovations has really panned out when tested, Dr. Levy said. For example, in the 36-patient study analyzed by Dr. Levy, clinically significant improvement was seen in only 41% of subjects following 26 weeks of CBT (Depress Anxiety. 2010 May;27[5]:476-84). In contrast, published response rates for CBT in patients with obsessive-compulsive disorder – a related condition – are in the 85% range.
She described the perfectionism that often figures prominently in HD as a maladaptive belief that if something can’t be done perfectly, it’s not worth doing at all.
“People will say to me, ‘I can’t start discarding until I’ve got my organizational system down.’ They’re completely stymied. They can’t make any progress because their system isn’t fully coordinated yet,” the psychologist explained.
One way to potentially target this perfectionism more explicitly might be to incorporate cognitive restructuring or behavioral experiments that enable patients to test out and perhaps discard those beliefs, according to Dr. Levy.
She reported no financial conflicts regarding her analysis, which was based upon data collected in an earlier study sponsored by the National Institute of Mental Health.
SAN FRANCISCO – Cognitive-behavioral therapy for hoarding disorder leaves substantial room for improvement in efficacy, and additional therapeutic attention to maladaptive beliefs regarding perfectionism just might be the answer, Hannah C. Levy, PhD, said at the annual conference of the Anxiety and Depression Association of America.
She presented a secondary analysis of the relationship between cognitive-behavioral therapy (CBT) outcomes and baseline maladaptive beliefs in a wait list–controlled study of 36 patients with hoarding disorder (HD) who were not on psychiatric medication. Her purpose was to identify which cognitive domains predicted treatment outcome. This, in turn, could point the way to new treatment targets.
In contrast, the baseline strength of Saving Cognitions Inventory maladaptive beliefs about saving, such as emotional attachment to hoarded objects or a belief that keeping those objects is the only way to be able to remember an important event, proved unrelated to CBT outcomes. And this finding may help explain CBT’s limited effectiveness in HD.
“I think traditionally our CBT interventions are more focused on the maladaptive saving beliefs. We’re currently not doing a whole lot about the perfectionism ideas that people may be bringing in,” said Dr. Levy of the anxiety disorders center at the Institute of Living in Hartford, Conn.
A strong unmet need exists for novel targets for CBT in hoarding disorder to improve current less-than-stellar outcomes, she said. A recent meta-analysis demonstrated that while CBT did provide a statistically significant benefit for this common and often disabling disease, outcomes were far from optimal. Indeed, after completing their course of CBT, patients still scored an average of 3 standard deviations above mean normal for scores on the SI-R (Depress Anxiety. 2015 Mar;32[3]:158-66).
Other investigators have recognized the limitations of current CBT for HD and tried tweaking the therapy to boost efficacy. These efforts have included formal studies incorporating home visits, adding cognitive remediation to reduce the neuropsychological deficits often present in patients with HD, and/or extending the treatment duration to 26 weekly sessions from the current standard of 15 or 16.
Unfortunately, none of these innovations has really panned out when tested, Dr. Levy said. For example, in the 36-patient study analyzed by Dr. Levy, clinically significant improvement was seen in only 41% of subjects following 26 weeks of CBT (Depress Anxiety. 2010 May;27[5]:476-84). In contrast, published response rates for CBT in patients with obsessive-compulsive disorder – a related condition – are in the 85% range.
She described the perfectionism that often figures prominently in HD as a maladaptive belief that if something can’t be done perfectly, it’s not worth doing at all.
“People will say to me, ‘I can’t start discarding until I’ve got my organizational system down.’ They’re completely stymied. They can’t make any progress because their system isn’t fully coordinated yet,” the psychologist explained.
One way to potentially target this perfectionism more explicitly might be to incorporate cognitive restructuring or behavioral experiments that enable patients to test out and perhaps discard those beliefs, according to Dr. Levy.
She reported no financial conflicts regarding her analysis, which was based upon data collected in an earlier study sponsored by the National Institute of Mental Health.
AT ANXIETY AND DEPRESSION CONFERENCE 2017
Key clinical point:
Major finding: High baseline levels of perfectionism and rigidity of thinking were associated with lack of response to 26 weeks of CBT for hoarding disorder.
Data source: A secondary analysis of data from a prospective study of 36 patients with primary hoarding disorder.
Disclosures: The presenter reported no financial conflicts regarding her analysis, which was based upon data collected in an earlier study sponsored by the National Institute of Mental Health.
Practice management skills more relevant than ever
LAS VEGAS – Babatunde Akinsete, MD, took a new job about 18 months ago as a lead hospitalist within Adventist Health System of Florida. The role has the expected leadership responsibilities, but those folks he’s now partly supervising are the same ones who used to be his peers.
The same people he spent time “in the trenches” with, complaining about the problems they saw – issues that are now partly his job to help fix.
“It’s tough,” Dr. Akinsete said at the annual meeting of the Society of Hospital Medicine. “How do you motivate people?”
Welcome to managing a practice, circa 2017. The day-to-day doings of an HM group – recruiting, retention, compensation, scheduling and more – are the backbone of the specialty. And SHM’s annual meeting makes the topics a principal point, from a dedicated precourse to dozens of presentations to networking opportunities introducing experienced leaders to nascent ones.
The subject is more relevant than ever these days as the maturing specialty now has three generations of hospitalists practicing side by side, including those who founded the society and laid the groundwork for the specialty some 20 years ago and those who will now infuse it with new blood for the next 20 years, said Jerome Siy, MD, SFHM, an HM17 faculty member and chair of SHM’s Practice Management Committee.
“We’re heading into a cycle of a lot of change,” he said. “Being able to manage change is going to be pretty key.”
The first step in building or bettering a “healthy practice” is building a “culture of ownership,” Dr. Siy said.
“You must have the right culture first if you’re going to tackle any of these issues, whether it’s things like schedules to finances to negotiations,” he added. “Second is this openness and innovation to think outside the box and to allow yourself to hear things that might not work for you. Be open to it because whether you hear something that doesn’t work or not, it may inspire you to figure out … what is the key element you were missing before.”
That’s what Liza Rodriguez Jimenez, MD, is taking away from the meeting. She is moving into a codirector position for her medical group at St. Luke’s in Boise, Idaho. A crash course in alternative-payment models, full-time equivalents (FTEs), relative value units (RVUs) and scheduling was an eye-opener for her.
But to Dr. Siy’s point, it wasn’t the specific examples of how other people do what they do that intrigued Dr. Rodriguez Jimenez. It was more so that people just did it differently.
“It’s just helpful to know that there are other choices,” Dr. Rodriguez Jimenez said. “In other words, why do we do 7 on, 7 off? I don’t know. We just do. If you don’t know that you don’t know, then how do you know to change it? You get exposed to so much stuff here now that you can theoretically go back and say, ‘why do we do 7 on, 7 off? … And then let the group say we want 5 on, 10 off, 4 on, 3 off. Whatever people decide.”
Nasim Afsar, MD, SFHM, chief quality officer of the department of medicine at UCLA Health in Los Angeles, said that idea of just framing the question differently is a big deal, and a leadership skill in and of itself. For example, say a hospital medicine group’s leaders are trying to discuss whether the practice should continue its comanagement focus.
“If you frame a decision as, ‘We are going to lose this comanagement,’ there’s just something, like a gut feeling, you don’t want to lose stuff,” she said. “As opposed to, if you say, ‘Gosh, think about the gains. That we will have all this free time that we now have where we can develop other aspects of our hospital medicine group.’ So when you frame the same exact thing in terms of loss, it becomes so much more difficult for us to actually let go of that.”
Leadership is more than just framing, of course. Dr. Afsar and former SHM president Eric Howell, MD, MHM, said that leadership traits include using standardized processes to make decisions, as well as getting group members involved in those decisions when necessary and using feedback and motivation properly.
But, at day’s end, practice management is managing the needs of your practice.
For Abdul-Hady Kheder, MD, of Hamilton Hospitalists LLC in Central New Jersey, the meeting opened his eyes to techniques he could use to deal with lower reimbursement figures and less patients.
“What can help my situation will be increasing the volume of the practice,” he said. “Right now, we admit 30%-40% of the patients admitted into the hospital. National average is 60%-90% of total hospital admissions. I think that most probably will balance my financial dilemma.”
For Rodney Hollis, practice administrator for Eskenazi Health of Indianapolis, the meeting was a way to glean tips on improving his practice. One nugget he’s excited about: pairing an experienced hospitalist with a new hire for a year. As a nonclinical administrator, Hollis said he views his role as helping clinicians work on the things they are best at, while he handle the rest.
“The more clinical time that the clinical directors can spend, that’s more advantageous to the group,” Hollis said. “Allowing the nonclinical activities to be done by an administrator helps. We want more responsibility and if there’s something that our clinical is doing that I can do, why not have me do it?”
For Dr. Rodriguez Jimenez, open-ended questions like that one are among the most “insightful” takeaways from the meeting.
“There is no right or wrong way, so maybe we’ve been doing it this way ‘just because,’ ” she said. “Now we need to look at it and say, ‘Can we do it a different way? Can we adapt it? Can we change it?’”
She’s starting to sound like a practice manager already.
Statins: No benefit as primary prevention in elderly
Statin therapy given as primary prevention to adults aged 65 years and older produced no benefit in any primary or secondary outcomes, according to post-hoc analysis of the ALLHAT trial published online May 22 in JAMA Internal Medicine.
Many older Americans take statins for primary cardiovascular prevention even though the evidence supporting such use is both sparse and conflicting, particularly for patients aged 75 years and older, said Benjamin H. Han, MD, of the division of geriatric medicine and palliative care, New York University, and his associates.
The primary outcome, all-cause mortality, was slightly higher in the statin group. For patients aged 65-74 years, there were 141 deaths with pravastatin vs. 130 with usual care, for a hazard ratio of 1.08, and for those aged 75 and older, there were 92 deaths with pravastatin vs. 65 with usual care, for an HR of 1.34. This represents a nonsignificant trend toward increased mortality with statin therapy. The results were similar, with pravastatin providing no significant benefit, regarding coronary heart disease, stroke, heart failure, and cancer events.
These findings indicate that “statins may be producing untoward effects in the function or health of older adults that could offset any possible cardiovascular benefit,” Dr. Han and his associates said (JAMA Intern Med. 2017 May 22. doi: 10.1001/jamainternmed.2017.1442).
One important limitation of this secondary analysis is that patients were allowed to cross over to the other study group during follow-up, at their own or their physicians’ discretion. By the end of the study, 29% of the control group were taking lipid-lowering drugs while 22% of the active-treatment group had discontinued pravastatin. “This level of crossover should be considered when interpreting our findings,” the investigators noted.
Statins are commonly prescribed for primary prevention to older patients, particularly those older than age 75 years. And the prevalence of use in this patient population is increasing.
But statins are associated with a variety of musculoskeletal disorders – including myopathy, myalgias, muscle weakness, back conditions, injuries, and arthropathies – which may be particularly harmful in older people and contribute to their physical deconditioning and frailty. The drugs also have been linked to cognitive dysfunction, which can further raise the risk of falls and disability.
Physicians should take into consideration these multiple risks, in addition to the ALLHAT data showing no mortality benefit in this age group, before prescribing or continuing statin therapy in such patients.
Gregory Curfman, MD, is at Harvard Medical School, Boston, and is also the health care policy and law editor for JAMA Internal Medicine. Dr. Curfman reported having no relevant financial disclosures. He made these remarks in an Editor’s Note accompanying Dr. Han’s report.
Statin therapy given as primary prevention to adults aged 65 years and older produced no benefit in any primary or secondary outcomes, according to post-hoc analysis of the ALLHAT trial published online May 22 in JAMA Internal Medicine.
Many older Americans take statins for primary cardiovascular prevention even though the evidence supporting such use is both sparse and conflicting, particularly for patients aged 75 years and older, said Benjamin H. Han, MD, of the division of geriatric medicine and palliative care, New York University, and his associates.
The primary outcome, all-cause mortality, was slightly higher in the statin group. For patients aged 65-74 years, there were 141 deaths with pravastatin vs. 130 with usual care, for a hazard ratio of 1.08, and for those aged 75 and older, there were 92 deaths with pravastatin vs. 65 with usual care, for an HR of 1.34. This represents a nonsignificant trend toward increased mortality with statin therapy. The results were similar, with pravastatin providing no significant benefit, regarding coronary heart disease, stroke, heart failure, and cancer events.
These findings indicate that “statins may be producing untoward effects in the function or health of older adults that could offset any possible cardiovascular benefit,” Dr. Han and his associates said (JAMA Intern Med. 2017 May 22. doi: 10.1001/jamainternmed.2017.1442).
One important limitation of this secondary analysis is that patients were allowed to cross over to the other study group during follow-up, at their own or their physicians’ discretion. By the end of the study, 29% of the control group were taking lipid-lowering drugs while 22% of the active-treatment group had discontinued pravastatin. “This level of crossover should be considered when interpreting our findings,” the investigators noted.
FROM JAMA INTERNAL MEDICINE
Key clinical point: Statin therapy given as primary prevention to adults aged 65 years and older produced no benefit in any primary or secondary outcomes.
Major finding: For patients aged 65-74 years, there were 141 deaths with pravastatin vs. 130 with usual care (HR, 1.08), and for those aged 75 years and older, there were 92 deaths with pravastatin vs. 65 with usual care (HR, 1.34).
Data source: A secondary analysis of data in the randomized, open-label ALLHAT trial, focusing on 2,867 elderly participants followed for 6 years.
Disclosures: This work was supported by the National Institutes of Health. Pfizer, AstraZeneca, and Bristol-Myers Squibb provided study medications free of charge. Dr. Han and his associates reported having no relevant financial disclosures.
VA Nurses Advocate for Best Care
The Nurses Organization of Veterans Affairs (NOVA) is a national nonprofit professional organization whose members are VA nurses working at VHA facilities throughout the country and caring for America’s heroes. For more than 35 years, NOVA has been the voice of VA nurses. Speaking strongly on behalf of its more than 3,000 members, NOVA leaders recently met in Washington, DC, for the annual Capitol Hill meetings and Legislative Roundtable.
With the elections over and new members taking their seats in the 115th Congress, NOVA leadership spoke candidly about ongoing VA transformation, choice, recruitment and retention, and access to care with respect to the new advanced practice registered nurse (APRN) regulation being implemented across VHA facilities. The APRN regulation allowing APRNs to practice to their full authority within the VA cleared in December. It grants 3 of the 4 APRN roles (nurse practitioners, certified nurse-midwives, and clinical nurse specialists) the ability to practice to the full extent of their education and training.
Armed with copies of the organization’s 2017 Legislative Priority Goals, NOVA leadership met with congressional members and staff of the House and Senate VA committees. Among NOVA’s priorities for the 115th Congress are the following:
- Effects of the federal hiring freeze
- VA transformation
- CHOICE/community-integrated health care
- Information technology
- Retention/recruitment and staffing
For a complete list of the 2017 Legislative Priority Goals, visit vanurse.org
Committee members were eager to hear the opinions of NOVA experts on the Choice Act and on the status of hiring initiatives at their facilities. A key staffing provision of the Veterans Access, Choice, and Accountability Act included an increase in hiring authority and a more generous loan repayment for those looking to work at the VA. In addition, Congress authorized $5 million in funding to hire more medical professionals. A VA internal audit found that the need for additional doctors, nurses, and specialty care was the highest barrier or challenge to providing access to care. NOVA testified on this issue before the 114th Congress.
Staff of House and Senate VA Committees shared other legislative priorities, including the reauthorization of the Choice Act and continued oversight of many areas within the VA, to include a sharp look at access and coordination of care and accountability.
The meeting concluded with the NOVA Legislative Roundtable discussion. Held at the Washington, DC, offices of the Disabled American Veterans service organization, the roundtable was attended by more than 25 organizations that have a stake in veterans’ health care. Leaders from various professional nursing organizations, veterans service organizations, VA Office of Nursing Services, the American Federation of Government Employees, and staff from both the House and Senate VA committees were in attendance.
A lively discussion was held regarding the future of VA health care, APRN implementation, workforce/ retention and recruitment issues, as well as telehealth and the opioid epidemic as it relates to VA patients. The release of the President’s proposed budget also was discussed. As is often the case with a new administration, a “skinny” or outline of a budget proposal is released in advance of an actual detailed budget, which included a substantial 10% increase in VA’s anticipated budget for overall discretionary items (over FY 2017) and an 8.3% increase for medical care (over FY 2017).
For more information about NOVA or to become a member, visit vanurse.org.
Patients with thrombocytosis should be tested for cancers, team says

Researchers have found evidence to suggest that thrombocytosis is a strong predictor of cancer, particularly lung and colorectal cancer.
The team therefore believes patients with thrombocytosis should be evaluated for an underlying malignancy, as such investigation could speed up cancer diagnosis and save lives.
“We know that early diagnosis is absolutely key in whether people survive cancer,” said Sarah Bailey, PhD, of the University of Exeter Medical School in the UK.
“Our research suggests that substantial numbers of people could have their cancer diagnosed up to 3 months earlier if thrombocytosis prompted investigation for cancer. This time could make a vital difference in achieving earlier diagnosis.”
Dr Bailey and her colleagues described their research in the British Journal of General Practice.
The team conducted a prospective cohort study using Clinical Practice Research Datalink data spanning the period from 2000 to 2013.
They compared the 1-year cancer incidence in 40,000 patients (age 40 and older) with thrombocytosis (platelet count >400 × 109/L) and 10,000 matched controls with normal platelet counts.
Patients with thrombocytosis had a higher incidence of cancer than individuals with normal platelet counts.
The cancer incidence was 6.2% (1355/21,826) in women with thrombocytosis and 2.2% (119/5370) in women with normal platelet counts.
The cancer incidence was 11.6% (1098/9435) in men with thrombocytosis and 4.1% (106/2599) in men with normal platelet counts.
If patients in the thrombocytosis group had a second raised platelet count recorded within 6 months of their index date, the risk of cancer increased to 18.1% for men and 10.1% for women.
Lung and colorectal cancer were more common among patients with thrombocytosis than among individuals with normal platelet counts.
And about one-third of patients with thrombocytosis and lung/colorectal cancer had no other symptoms that would indicate they had cancer.
In addition, the researchers found that “substantial proportions” of lung/colorectal cancer diagnoses could be expedited if thrombocytosis were routinely investigated.
The team calculated that if 5% of patients with cancer have thrombocytosis before a cancer diagnosis, one-third of them have the potential to have their diagnosis expedited by at least 3 months if their doctor investigates the possibility of cancer based on the presence of thrombocytosis. This equates to 5500 earlier diagnoses annually.
“The UK lags well behind other developed countries on early cancer diagnosis,” said study author Willie Hamilton, MD, of the University of Exeter Medical School.
“In 2014, 163,000 people died of cancer in this country. Our findings on thrombocytosis show a strong association with cancer, particularly in men—far stronger than that of a breast lump for breast cancer in women. It is now crucial that we roll out cancer investigation of thrombocytosis. It could save hundreds of lives each year.” ![]()
PK-guided prophylaxis reduces dosing, still prevents bleeds

Personalized prophylaxis with a recombinant factor VIII product allowed for reduced dosing while still providing protection from bleeds in a small study of patients with severe hemophilia A.
Researchers tested pharmacokinetic (PK)-guided prophylaxis with simoctocog alfa in previously treated patients with severe hemophilia A.
The approach reduced the dose administered and increased the dosing interval compared to standard prophylaxis, without compromising protection from bleeds.
Researchers reported these results in the journal Haemophilia. The research was sponsored by Octapharma AG, the company marketing simoctocog alfa as Nuwiq.
Simoctocog alfa is a fourth-generation recombinant human factor VIII product produced in a human cell line.
In this phase 3b study, researchers tested PK-guided prophylaxis with simoctocog alfa in 66 previously treated adults with severe hemophilia A.
The patients’ mean age at baseline was 33.6. Most (62%) had received on-demand treatment in the 6 months prior to starting the study. Prophylaxis was largely irregular in the 38% of patients who received prophylaxis.
At baseline, the mean annualized bleeding rates (ABRs) were 38.9 in the entire cohort, 45.6 in the on-demand cohort, and 27.8 in the prophylaxis cohort.
Study design
The study had 3 phases. The first was the 72-hour PK phase. Patients received a single dose of simoctocog alfa (60 ± 5 IU kg–1) and had blood samples taken at various time points. This helped the researchers determine the patients’ personalized prophylaxis regimen.
The second phase of the study was the standard prophylaxis phase, which lasted 1 to 3 months. In this phase, patients received simoctocog alfa at a dose of 30 to 40 IU kg–1 every other day or 3 times a week until they began personalized prophylaxis.
The third phase was the 6-month personalized prophylaxis phase. A patient’s personalized prophylaxis regimen was based on individual PK modeling for each patient according to whether their PK profile most closely fit a 1- or 2-compartment model. In cases of uncertainty, the researchers used a non-compartment model.
A 2-compartment PK model was used for 36 patients, a 1-compartment model was used for 23 patients, and a non-compartment model was used for 7 patients.
Dosing
In total, the patients received 6612 infusions of simoctocog alfa.
During standard prophylaxis, the mean treatment duration was 2.7 months. Patients received a mean of 34.0 infusions and a total dose of 1157.6 IU kg–1.
During the personalized prophylaxis phase, the mean treatment duration was 6.2 months. Patients received a mean of 58.8 infusions and a total dose of 2574.4 IU kg–1.
The median dosing interval was 3.5 days during personalized prophylaxis, 3.5 days in the 1- and 2-compartment model groups, and 2.3 days in the non-compartment group. Fifty-seven percent of patients had twice-weekly dosing or less.
In the standard prophylaxis period, patients were dosed every other day or 3 times a week.
The median weekly dose was 100.0 IU kg–1 during standard prophylaxis and 95.0 IU kg–1 during personalized prophylaxis. It was 97.5 IU kg–1 during months 1 to 4 of personalized prophylaxis and 92.8 IU kg–1 during months 5 and 6 of personalized prophylaxis.
Bleeding and safety
Similar percentages of patients were bleed-free during the roughly 3-month standard prophylaxis period and the roughly 6-month personalized prophylaxis period—76.9% and 73.8%, respectively.
However, the mean ABR was 3.16 for the standard prophylaxis period and 1.45 for the personalized prophylaxis period. The median ABR was 0 for both periods.
In all, there were 95 breakthrough bleeds—46 during standard prophylaxis and 49 during personalized prophylaxis—in 23 of the patients. All of these bleeds were treated with at least 1 dose of simoctocog alfa.
There were no serious adverse events associated with treatment, and none of the patients developed factor VIII inhibitors.
One patient experienced malaise and dizziness after a single infusion during the standard prophylaxis period. These events were considered treatment-related, but both events resolved. ![]()
FDA approves new formulation of deferasirox

The US Food and Drug Administration (FDA) has approved a new formulation of deferasirox known as Jadenu Sprinkle granules.
The granules are approved for use in the same population as Jadenu film-coated tablets.
Both formulations of Jadenu have accelerated approval from the FDA for the treatment of chronic iron overload due to blood transfusions in patients age 2 and older.
The formulations also have accelerated FDA approval for the treatment of chronic iron overload in patients age 10 and older with non-transfusion-dependent-thalassemia and a liver iron concentration of at least 5 mg Fe per gram of dry weight and a serum ferritin greater than 300 mcg/L.
Continued FDA approval for Jadenu in these indications may be contingent upon verification and description of clinical benefit in confirmatory trials.
Jadenu Sprinkle granules are intended for patients who have difficulty swallowing whole tablets. The granules can be sprinkled over soft foods (eg, yogurt or applesauce) prior to consumption.
Like Jadenu film-coated tablets, Jadenu Sprinkle granules are available in 3 strengths—90 mg, 180 mg, and 360 mg.
Both formulations of Jadenu are products of Novartis. For more details on Jadenu, see the prescribing information. ![]()