User login
Fever and bilateral ankle pain
A 35-year-old man presents with bilateral ankle pain and swelling. He has had fevers over the past 5 days. Physical examination: temperature, 38° C; pulse, 90; blood pressure, 140/70 mm Hg. Ext: Edema bilateral ankles, ankle joints tender. No other joints are involved. Lab: WBC, 6,000; polys, 4.8; mono, 0.5; lymph, 0.7.
What is the most useful diagnostic test?
A. CRP.
B. ESR.
C. Uric acid.
D. Chest x-ray.
E. Rheumatoid factor.
This patient has acute onset of fevers and bilateral ankle pain and swelling. The acute onset and presence of a fever makes rheumatoid arthritis unlikely. Bilateral ankle arthritis is a very unusual presentation for gout, and would be very unlikely in such a young patient unless there were other risk factors for gout. Inflammatory markers (C-reactive protein and erythrocyte sedimentation rate) will not help make a specific diagnosis.
This patient has Lofgren’s syndrome (acute presentation of sarcoidosis). A chest x-ray would be diagnostic, as the presence of bilateral hilar adenopathy along with the other symptoms would be diagnostic of Lofgren’s syndrome. The patient also has a low peripheral lymphocyte count, which is common with active sarcoidosis.
The combination of bilateral ankle swelling and inflammation is a clue to think about sarcoidosis. Juan Mañá, MD, and his colleagues reviewed the charts of 330 sarcoid patients who presented over a 20-year period.1 A total of 33 patients presented with periarticular ankle inflammation. Interestingly, the majority of these patients presented in the spring (54%). The average age of the patients was 33 years, and about 80% had stage 1 sarcoid on chest radiography (bilateral hilar adenopathy). All 24 patients who were followed up were in remission a year later.
In another study, the same investigators reported on the clinical features and course of Lofgren’s syndrome in 186 patients. Almost all the patients (93%) had erythema nodosum or periarticular ankle inflammation at presentation.2 Half of the patients presented in the spring, and the vast majority (87%) had no respiratory symptoms at the time of presentation. Most of the 133 patients (86%) who were available for follow-up (mean follow-up, 5 years) were in complete remission from sarcoid.
Johan Grunewald, MD, and Anders Eklund, MD, reported on 150 patients with Lofgren’s syndrome.3 In that study, 87 patients had erythema nodosum, and 63 had no erythema nodosum but did have symmetric ankle inflammation. There was an increase in patients presenting in the spring, about 80% had stage 1 sarcoid on chest x-ray, and the majority of the patients who presented with bilateral ankle inflammation and no erythema nodosum were men. They also found that there was a strong association with the presence of HLA-DRB1*0301/DQB1*0201 in patients who developed Lofgren’s syndrome. Resolution of disease was very common (85%) without recurrences.
There are several pearls to emphasize. Think of Lofgren’s syndrome in patients with symmetrical ankle inflammation or erythema nodosum. Order a chest x-ray to make the diagnosis; these patients usually will have no pulmonary symptoms to lead you in that direction. The prognosis is very good for these patients, with the great majority of them having full clinical resolution without recurrences.
Key pearl: Think of Lofgren’s syndrome in patients presenting with bilateral ankle inflammation.

References
1. J Rheumatol. 1996 May;23(5):874-7.
2. Am J Med. 1999 Sep;107(3):240-5.
3. Am J Respir Crit Care Med. 2007 Jan 1;175(1):40-4.
A 35-year-old man presents with bilateral ankle pain and swelling. He has had fevers over the past 5 days. Physical examination: temperature, 38° C; pulse, 90; blood pressure, 140/70 mm Hg. Ext: Edema bilateral ankles, ankle joints tender. No other joints are involved. Lab: WBC, 6,000; polys, 4.8; mono, 0.5; lymph, 0.7.
What is the most useful diagnostic test?
A. CRP.
B. ESR.
C. Uric acid.
D. Chest x-ray.
E. Rheumatoid factor.
This patient has acute onset of fevers and bilateral ankle pain and swelling. The acute onset and presence of a fever makes rheumatoid arthritis unlikely. Bilateral ankle arthritis is a very unusual presentation for gout, and would be very unlikely in such a young patient unless there were other risk factors for gout. Inflammatory markers (C-reactive protein and erythrocyte sedimentation rate) will not help make a specific diagnosis.
This patient has Lofgren’s syndrome (acute presentation of sarcoidosis). A chest x-ray would be diagnostic, as the presence of bilateral hilar adenopathy along with the other symptoms would be diagnostic of Lofgren’s syndrome. The patient also has a low peripheral lymphocyte count, which is common with active sarcoidosis.
The combination of bilateral ankle swelling and inflammation is a clue to think about sarcoidosis. Juan Mañá, MD, and his colleagues reviewed the charts of 330 sarcoid patients who presented over a 20-year period.1 A total of 33 patients presented with periarticular ankle inflammation. Interestingly, the majority of these patients presented in the spring (54%). The average age of the patients was 33 years, and about 80% had stage 1 sarcoid on chest radiography (bilateral hilar adenopathy). All 24 patients who were followed up were in remission a year later.
In another study, the same investigators reported on the clinical features and course of Lofgren’s syndrome in 186 patients. Almost all the patients (93%) had erythema nodosum or periarticular ankle inflammation at presentation.2 Half of the patients presented in the spring, and the vast majority (87%) had no respiratory symptoms at the time of presentation. Most of the 133 patients (86%) who were available for follow-up (mean follow-up, 5 years) were in complete remission from sarcoid.
Johan Grunewald, MD, and Anders Eklund, MD, reported on 150 patients with Lofgren’s syndrome.3 In that study, 87 patients had erythema nodosum, and 63 had no erythema nodosum but did have symmetric ankle inflammation. There was an increase in patients presenting in the spring, about 80% had stage 1 sarcoid on chest x-ray, and the majority of the patients who presented with bilateral ankle inflammation and no erythema nodosum were men. They also found that there was a strong association with the presence of HLA-DRB1*0301/DQB1*0201 in patients who developed Lofgren’s syndrome. Resolution of disease was very common (85%) without recurrences.
There are several pearls to emphasize. Think of Lofgren’s syndrome in patients with symmetrical ankle inflammation or erythema nodosum. Order a chest x-ray to make the diagnosis; these patients usually will have no pulmonary symptoms to lead you in that direction. The prognosis is very good for these patients, with the great majority of them having full clinical resolution without recurrences.
Key pearl: Think of Lofgren’s syndrome in patients presenting with bilateral ankle inflammation.
References
1. J Rheumatol. 1996 May;23(5):874-7.
2. Am J Med. 1999 Sep;107(3):240-5.
3. Am J Respir Crit Care Med. 2007 Jan 1;175(1):40-4.
Rectal temps in the nursery
It seems to me that the closer one could get to the center of the child’s body, the more likely you would get a true reading – and the less likely you would fall victim to operator error. However, a study reported on the Pediatric News website suggests that our intuition is wrong again (“Axillary thermometry is the best choice for newborns,” by M. Alexander Otto, Aug. 24, 2017). In the study of 205 newborns at the University of North Carolina at Chapel Hill Medical Center, multiple temperatures were recorded using three methods over a 15-minute period. Rectal temperatures were accurate but less reliable than axillary readings, while temporal artery measurements tended to “overestimate temperatures by an average of about a quarter of a degree.”
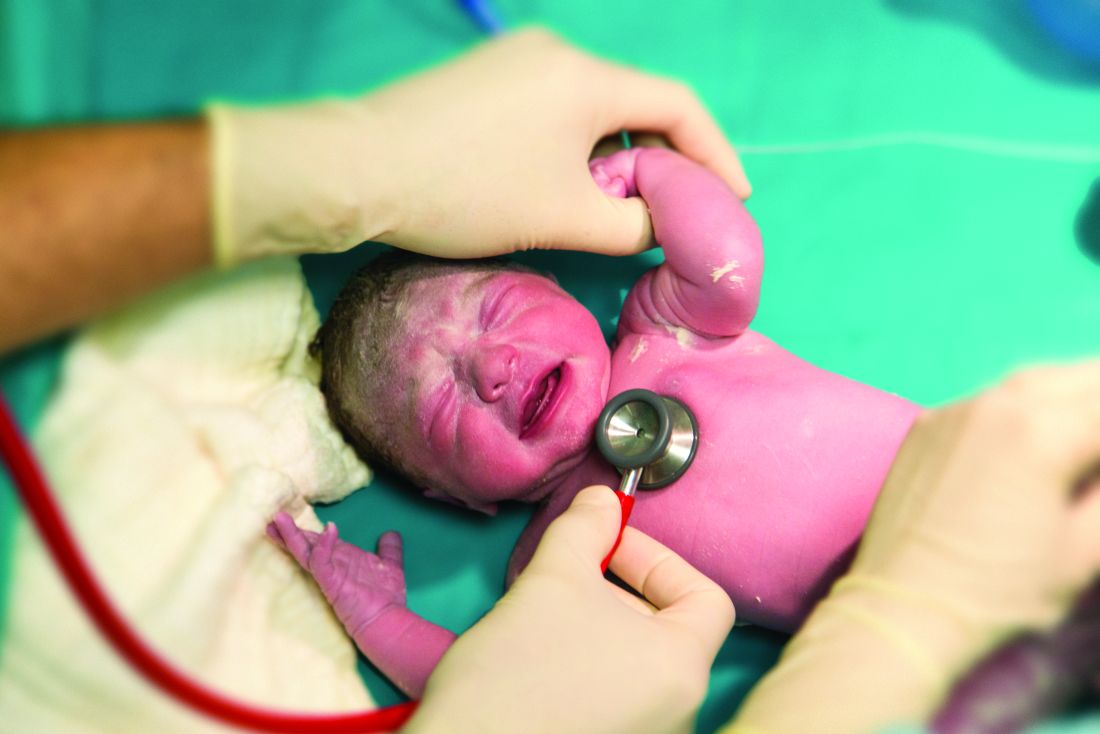
However, before we jump on the no-rectal-temps in the nursery bandwagon, let’s look at the rectal probe not just as a way to assess a newborn’s temperature, but as a tool for examining the baby’s rectum. For a variety of reasons, the newborn perineum often seems to escape the careful examination it deserves, particularly if the initial exam is performed with the parents watching.
Of course, parents are interested in their baby’s hair and eye color, and whether it has the requisite number of fingers and toes. They will wait anxiously until you have lifted your stethoscope off the baby’s chest and given them a nod and smile. However, doing a thorough exam of the infant’s genitalia may appear a bit invasive and improper to some parents. Whether it is because we sense some unspoken parental discomfort or because we are trying to save time, the nether regions of little girls are inadequately examined.

But back to rectal temperatures. It seems to me that it would be prudent to adopt a guideline that says that a newborn’s first temperature be taken rectally. Not because it is any more accurate than an axillary temperature – which this study suggests that it is not. But because the process of taking the temperature would make it more likely (I hesitate to say guarantee) that someone will be taking a careful look at the newborn’s rectum. That initial rectal temperature is not going to detect every genital anomaly, but it may help find some in a more timely fashion. If nothing else, it will get that meconium moving.
Dr. Wilkoff practiced primary care pediatrics in Brunswick, Maine, for nearly 40 years. He has authored several books on behavioral pediatrics, including “How to Say No to Your Toddler.”
It seems to me that the closer one could get to the center of the child’s body, the more likely you would get a true reading – and the less likely you would fall victim to operator error. However, a study reported on the Pediatric News website suggests that our intuition is wrong again (“Axillary thermometry is the best choice for newborns,” by M. Alexander Otto, Aug. 24, 2017). In the study of 205 newborns at the University of North Carolina at Chapel Hill Medical Center, multiple temperatures were recorded using three methods over a 15-minute period. Rectal temperatures were accurate but less reliable than axillary readings, while temporal artery measurements tended to “overestimate temperatures by an average of about a quarter of a degree.”
However, before we jump on the no-rectal-temps in the nursery bandwagon, let’s look at the rectal probe not just as a way to assess a newborn’s temperature, but as a tool for examining the baby’s rectum. For a variety of reasons, the newborn perineum often seems to escape the careful examination it deserves, particularly if the initial exam is performed with the parents watching.
Of course, parents are interested in their baby’s hair and eye color, and whether it has the requisite number of fingers and toes. They will wait anxiously until you have lifted your stethoscope off the baby’s chest and given them a nod and smile. However, doing a thorough exam of the infant’s genitalia may appear a bit invasive and improper to some parents. Whether it is because we sense some unspoken parental discomfort or because we are trying to save time, the nether regions of little girls are inadequately examined.
But back to rectal temperatures. It seems to me that it would be prudent to adopt a guideline that says that a newborn’s first temperature be taken rectally. Not because it is any more accurate than an axillary temperature – which this study suggests that it is not. But because the process of taking the temperature would make it more likely (I hesitate to say guarantee) that someone will be taking a careful look at the newborn’s rectum. That initial rectal temperature is not going to detect every genital anomaly, but it may help find some in a more timely fashion. If nothing else, it will get that meconium moving.
Dr. Wilkoff practiced primary care pediatrics in Brunswick, Maine, for nearly 40 years. He has authored several books on behavioral pediatrics, including “How to Say No to Your Toddler.”
High percentage of nursing home residents found to harbor MDROs
SAN DIEGO – Nearly half of nursing home residents harbored multi-drug resistant organisms on their skin, results from a large multi-center surveillance study showed.
“Residents in skilled nursing homes are the most vulnerable patients in the health care system,” lead study author James A. McKinnell, MD, said in an interview in advance of an annual scientific meeting on infectious diseases. “Many residents depend on help from health care workers for routine needs like eating or bathing. Skilled nursing facilities have an obligation to optimize the personal hygiene and environmental cleanliness in skilled nursing facilities.”

The researchers obtained 2,797 body swabs from 1,400 residents in all. Swabs were processed for methicillin-resistant Staphylococcus aureus (MRSA), vancomycin-resistant Enterococcus spp. (VRE), extended spectrum beta-lactamase producers (ESBLs), and carbapenem-resistant Enterobacteriaceae (CRE). “MRSA is a relatively well known bacteria, but CRE is the new pathogen that the CDC has defined as an urgent public health threat,” Dr. McKinnell said.
The researchers also conducted environmental surveillance of commonly touched items in skilled nursing facilities. The five surfaces tested in resident rooms were the bedside table, TV remote, door knobs, light switch, and bathrooms. The five surfaces tested in common areas were the nursing station counter, tables, chairs, hallway hand rails, and drinking fountains.
Overall, 49% of residents harbored MDROs. MRSA was found in 37% of residents, followed by ESBL in 16%, VRE in 7%, and CRE in 1%. Resident MDRO status was known for 11% of MRSA carriers, compared with 18% of ESBL, 4% of VRE, and none of the CRE carriers. Rates of colonization did not differ whether residents had long stays at the facility or postacute stays (49% vs. 48%, respectively), but bed-bound residents were more likely to be MDRO colonized, compared with ambulatory residents (59% vs. 46%; P less than .001). In the analysis of environmental swabs, 93% of common areas and 74% of resident rooms had an MDRO-positive object, with an average of 2.5 and 1.9 objects, respectively, found to be contaminated.
“The fact that about half of patients were carrying a bacteria that could cause infection on their skin was very high,” said Dr. McKinnell, who is a member of the Infectious Disease Clinical Outcome Research Unit at the Los Angeles Biomedical Research Institute at Harbor-UCLA. “Studies conducted in other care settings, we would typically see less than a quarter of patients carry these types of bacteria. I was also surprised to see that 1% of patients were carrying the CRE bacteria on their skin.”
He acknowledged certain limitations of the study, including the fact that the data were taken from a select group of nursing homes that are participating in an interventional study to improve personal hygiene for skilled nursing facility residents. “They may not be representative of all skilled nursing facilities,” he said.
The Agency for Healthcare Research and Quality funded the study. Dr. McKinnell disclosed that he is conducting studies in health care facilities with products supplied from 3M, Clorox, Sage, and Xttrium Laboratories. Many of his coauthors disclosed numerous financial ties to the pharmaceutical industry. The event was the combined annual meetings of the Infectious Diseases Society of America, the Society for Healthcare Epidemiology of America, the HIV Medicine Association, and the Pediatric Infectious Diseases Society.
SAN DIEGO – Nearly half of nursing home residents harbored multi-drug resistant organisms on their skin, results from a large multi-center surveillance study showed.
“Residents in skilled nursing homes are the most vulnerable patients in the health care system,” lead study author James A. McKinnell, MD, said in an interview in advance of an annual scientific meeting on infectious diseases. “Many residents depend on help from health care workers for routine needs like eating or bathing. Skilled nursing facilities have an obligation to optimize the personal hygiene and environmental cleanliness in skilled nursing facilities.”
The researchers obtained 2,797 body swabs from 1,400 residents in all. Swabs were processed for methicillin-resistant Staphylococcus aureus (MRSA), vancomycin-resistant Enterococcus spp. (VRE), extended spectrum beta-lactamase producers (ESBLs), and carbapenem-resistant Enterobacteriaceae (CRE). “MRSA is a relatively well known bacteria, but CRE is the new pathogen that the CDC has defined as an urgent public health threat,” Dr. McKinnell said.
The researchers also conducted environmental surveillance of commonly touched items in skilled nursing facilities. The five surfaces tested in resident rooms were the bedside table, TV remote, door knobs, light switch, and bathrooms. The five surfaces tested in common areas were the nursing station counter, tables, chairs, hallway hand rails, and drinking fountains.
Overall, 49% of residents harbored MDROs. MRSA was found in 37% of residents, followed by ESBL in 16%, VRE in 7%, and CRE in 1%. Resident MDRO status was known for 11% of MRSA carriers, compared with 18% of ESBL, 4% of VRE, and none of the CRE carriers. Rates of colonization did not differ whether residents had long stays at the facility or postacute stays (49% vs. 48%, respectively), but bed-bound residents were more likely to be MDRO colonized, compared with ambulatory residents (59% vs. 46%; P less than .001). In the analysis of environmental swabs, 93% of common areas and 74% of resident rooms had an MDRO-positive object, with an average of 2.5 and 1.9 objects, respectively, found to be contaminated.
“The fact that about half of patients were carrying a bacteria that could cause infection on their skin was very high,” said Dr. McKinnell, who is a member of the Infectious Disease Clinical Outcome Research Unit at the Los Angeles Biomedical Research Institute at Harbor-UCLA. “Studies conducted in other care settings, we would typically see less than a quarter of patients carry these types of bacteria. I was also surprised to see that 1% of patients were carrying the CRE bacteria on their skin.”
He acknowledged certain limitations of the study, including the fact that the data were taken from a select group of nursing homes that are participating in an interventional study to improve personal hygiene for skilled nursing facility residents. “They may not be representative of all skilled nursing facilities,” he said.
The Agency for Healthcare Research and Quality funded the study. Dr. McKinnell disclosed that he is conducting studies in health care facilities with products supplied from 3M, Clorox, Sage, and Xttrium Laboratories. Many of his coauthors disclosed numerous financial ties to the pharmaceutical industry. The event was the combined annual meetings of the Infectious Diseases Society of America, the Society for Healthcare Epidemiology of America, the HIV Medicine Association, and the Pediatric Infectious Diseases Society.
AT ID WEEK 2017
Key clinical point: About one of every two nursing home residents is colonized with multidrug resistant organisms.
Major finding:
Study details: A surveillance study of 1,400 residents at 28 skilled nursing facilities in Southern California.
Disclosures: The Agency for Healthcare Research and Quality funded the study. Dr. McKinnell disclosed that he is conducting studies in health care facilities with products supplied from 3M, Clorox, Sage, and Xttrium Laboratories. Many of his coauthors disclosed numerous financial ties to the pharmaceutical industry.
House, Senate committees clear CHIP reauthorization
Committees in the House and Senate passed bills to reauthorize funding for the Children’s Health Insurance Program for 5 years, but their efforts took very different paths.
Funding for CHIP expired on Sept. 30, adding a level of urgency for Congress to act.
The Senate Finance Committee needed only a voice vote during an Oct. 4 executive session, with support from both Republicans and Democrats, to move the Keeping Kids Insurance Dependable and Secure (KIDS) Act (S. 1827) to the Senate floor. The Senate version is a straight-forward bill that also extended a few childhood health demonstration projects.
Offsets in the Helping Ensure Access for Little Ones, Toddlers, and Hopeful Young by Keeping Insurance Delivery Stable (HEALTHY KIDS) Act (H.R. 3921) include means testing for Medicare Part B and D premiums by having those earning $500,000 or more on the hook for their entire Medicare Parts B and D premiums, inclusion of lottery and other lump sum awards in making Medicaid determinations, and help for states seeking to get payments from insurers.
In addition to general arguments against the use of offsets for this bill and not other measures that were also marked up during the Oct. 4 session and complaints about the inadequacy of funding for Puerto Rico’s Medicaid program in light of the recent hurricane, Energy and Commerce Committee Democrats also voiced strong objection to the use of means testing for Medicare.
“The way they are put together today will likely mean more delay and possibly no action in Congress until the end of the year as part of an omnibus appropriations bill,” Energy & Commerce Ranking Member Frank Pallone (D-N.J.) said.
SHM suggests tweaks to CMS QPP proposal
The Society of Hospital Medicine approves of the direction the Centers for Medicare & Medicaid Services is heading when it comes to measuring pay-for-performance for hospitalists in its Quality Payment Program (QPP) but is suggesting some tweaks to make it a better system.
The proposed CMS 2018 update to the QPP, the value-based payment scheme developed by the Medicare Access and CHIP Reauthorization Act (MACRA), included an option that would allow all physicians who primarily practice in a hospital setting to report as a unified group under the hospital umbrella – as an alternative to reporting as an individual in the Merit-Based Incentive Payment System (MIPS) track.

He said there is lot to like in that option, although there are things that need to be changed as well.
One key area SHM would like to see changed is how time spent in a hospital is measured. In the CMS proposal, codes related to site of service capture only those in the emergency room and those admitted for in-patient services. Doctors who are seeing patients on an observation basis before they are admitted are not captured and could not be included in the facility payment.
“Observation services are virtually indistinguishable from inpatient care and frequently occur on the same wards of the hospital,” SHM said in Aug. 21, 2017, comments to CMS on the proposed QPP update, noting that observational care is built around the two-midnight rule.
“We disagree with this interpretation,” the SHM letter continues. “While it is true observation is generally time limited for a given patient, practice structures and provider scheduling have a profound [impact] on the proportion of observation care an individual clinician provides.” The letter noted that hospitalists who are on observation service could have a high proportion of observation (outpatient) billing, which could in turn exclude them from qualifying for a facility-based reporting option “despite the fact they are truly hospital-based inpatient providers.”
Dr. Greeno noted that some hospitals have hospitalists that exclusively provide observational care.
The proposal designates physicians who meet a 75% threshold of providing care in an emergency room or in-patient setting as eligible to opt into facility-based reporting.
SHM suggests that if observation services cannot be included in the 75% threshold, those services should be included and “couple the calculation with a cross-check to ensure most other billing is also hospital-based. As a further check, CMS could look at specialty codes – is the provider also enrolled in Medicare as a hospitalist?” SHM also recommends lowering the threshold “to 70% or, ideally, 60%. Due to the wide variation in hospitalist practice, we are uncomfortable with the use of thresholds in general, but lowering this threshold would at least provide a kind of safety net for hospitalists who are caring for high numbers of patients on observation.”
Another key area that needs to be addressed is the quality metrics that are used for scoring, which Dr. Greeno acknowledged is “surprisingly hard to do.”
For the 2018 reporting year, CMS is proposing that the required number of measures for the MIPS program be six, that same is it currently is for 2017. While SHM agrees with this level, “we remind CMS that even six measures may be a challenge for some providers, including hospitalists, to meet. Concerted efforts should be made to ensure that those providers who have fewer than six measures available for reporting are not disadvantaged in any way.”
Two of the six hospitalist-specific quality metrics relate to heart attacks, Dr. Seymann noted.
“Most hospitalists do take care of these patients, but they can only be reported via registry or via an electronic health record, and I don’t know that all hospitalist groups have access to reporting those ways,” Dr. Seymann said. “Most folks are reporting when they submit their billing claims. That takes two measures away from them. That may significantly decrease your score, even if you are trying your best.”
While Dr. Seymann applauded CMS for the slow rollout of the MIPS program in general, “we haven’t seen great progress as far as the growth of available relevant measures for hospitalists, and I am not confident that 2 years down the line we are going to have 12 measures to choose from.”
He did suggest that hospitalists would like a greater variety of measures and want to be measured on the quality of care they provide.
“We truly believe that the majority of hospitalist groups are really heavily invested in improving the quality of care that is provided at their hospitals – that is a big part of the culture of hospital medicine in general,” Dr. Seymann said. “We want to make our ability to succeed and participate in this program as effective as we can. We want to try to minimize barriers to hospitalists hitting this one out of the park.”
SHM also noted that certain measures rarely meet the volume threshold, which could ultimately put hospitalists at a disadvantage when it comes to receiving bonus payments.
“This is not an acceptable outcome, and we strongly urge CMS to develop a solution for providers with low-volume measures, such as removing low-volume measures from the Quality category score,” SHM wrote.
Ultimately, Dr. Greeno believes the facility reporting opt-in will survive when the rule is finalized.
“We fully expect there to be a facility-based option for hospital-based doctors, including hospitalists,” he said. “So rather than reporting on physician metrics, especially metrics through MIPS, they can get rewarded or penalized based on the hospital value-based purchasing metrics for their hospital.”
The Society of Hospital Medicine approves of the direction the Centers for Medicare & Medicaid Services is heading when it comes to measuring pay-for-performance for hospitalists in its Quality Payment Program (QPP) but is suggesting some tweaks to make it a better system.
The proposed CMS 2018 update to the QPP, the value-based payment scheme developed by the Medicare Access and CHIP Reauthorization Act (MACRA), included an option that would allow all physicians who primarily practice in a hospital setting to report as a unified group under the hospital umbrella – as an alternative to reporting as an individual in the Merit-Based Incentive Payment System (MIPS) track.
He said there is lot to like in that option, although there are things that need to be changed as well.
One key area SHM would like to see changed is how time spent in a hospital is measured. In the CMS proposal, codes related to site of service capture only those in the emergency room and those admitted for in-patient services. Doctors who are seeing patients on an observation basis before they are admitted are not captured and could not be included in the facility payment.
“Observation services are virtually indistinguishable from inpatient care and frequently occur on the same wards of the hospital,” SHM said in Aug. 21, 2017, comments to CMS on the proposed QPP update, noting that observational care is built around the two-midnight rule.
“We disagree with this interpretation,” the SHM letter continues. “While it is true observation is generally time limited for a given patient, practice structures and provider scheduling have a profound [impact] on the proportion of observation care an individual clinician provides.” The letter noted that hospitalists who are on observation service could have a high proportion of observation (outpatient) billing, which could in turn exclude them from qualifying for a facility-based reporting option “despite the fact they are truly hospital-based inpatient providers.”
Dr. Greeno noted that some hospitals have hospitalists that exclusively provide observational care.
The proposal designates physicians who meet a 75% threshold of providing care in an emergency room or in-patient setting as eligible to opt into facility-based reporting.
SHM suggests that if observation services cannot be included in the 75% threshold, those services should be included and “couple the calculation with a cross-check to ensure most other billing is also hospital-based. As a further check, CMS could look at specialty codes – is the provider also enrolled in Medicare as a hospitalist?” SHM also recommends lowering the threshold “to 70% or, ideally, 60%. Due to the wide variation in hospitalist practice, we are uncomfortable with the use of thresholds in general, but lowering this threshold would at least provide a kind of safety net for hospitalists who are caring for high numbers of patients on observation.”
Another key area that needs to be addressed is the quality metrics that are used for scoring, which Dr. Greeno acknowledged is “surprisingly hard to do.”
For the 2018 reporting year, CMS is proposing that the required number of measures for the MIPS program be six, that same is it currently is for 2017. While SHM agrees with this level, “we remind CMS that even six measures may be a challenge for some providers, including hospitalists, to meet. Concerted efforts should be made to ensure that those providers who have fewer than six measures available for reporting are not disadvantaged in any way.”
Two of the six hospitalist-specific quality metrics relate to heart attacks, Dr. Seymann noted.
“Most hospitalists do take care of these patients, but they can only be reported via registry or via an electronic health record, and I don’t know that all hospitalist groups have access to reporting those ways,” Dr. Seymann said. “Most folks are reporting when they submit their billing claims. That takes two measures away from them. That may significantly decrease your score, even if you are trying your best.”
While Dr. Seymann applauded CMS for the slow rollout of the MIPS program in general, “we haven’t seen great progress as far as the growth of available relevant measures for hospitalists, and I am not confident that 2 years down the line we are going to have 12 measures to choose from.”
He did suggest that hospitalists would like a greater variety of measures and want to be measured on the quality of care they provide.
“We truly believe that the majority of hospitalist groups are really heavily invested in improving the quality of care that is provided at their hospitals – that is a big part of the culture of hospital medicine in general,” Dr. Seymann said. “We want to make our ability to succeed and participate in this program as effective as we can. We want to try to minimize barriers to hospitalists hitting this one out of the park.”
SHM also noted that certain measures rarely meet the volume threshold, which could ultimately put hospitalists at a disadvantage when it comes to receiving bonus payments.
“This is not an acceptable outcome, and we strongly urge CMS to develop a solution for providers with low-volume measures, such as removing low-volume measures from the Quality category score,” SHM wrote.
Ultimately, Dr. Greeno believes the facility reporting opt-in will survive when the rule is finalized.
“We fully expect there to be a facility-based option for hospital-based doctors, including hospitalists,” he said. “So rather than reporting on physician metrics, especially metrics through MIPS, they can get rewarded or penalized based on the hospital value-based purchasing metrics for their hospital.”
Lifesaving future seen for electronic cigarettes
A switch from cigarettes to e-cigarettes has the potential to prevent almost 90,000 premature deaths in the United States in the year 2026, according to a study examining e-cigarette substitution scenarios.
The investigators’ “optimistic scenario” – in which new smokers use e-cigarettes instead of cigarettes, smoking prevalence falls to 5% over a 10-year period, and e-cigarettes have a 5% excess risk over regular cigarettes – projects 380,832 premature deaths from smoking in the year 2026. Under a “status quo scenario,” which projected current cigarette initiation and cessation rates and did not include e-cigarettes or other tobacco products, there would be 470,743 deaths, reported David T. Levy, PhD, and his associates (Tob Control. 2017 Oct 2. doi: 10.1136/tobaccocontrol-2017-053759).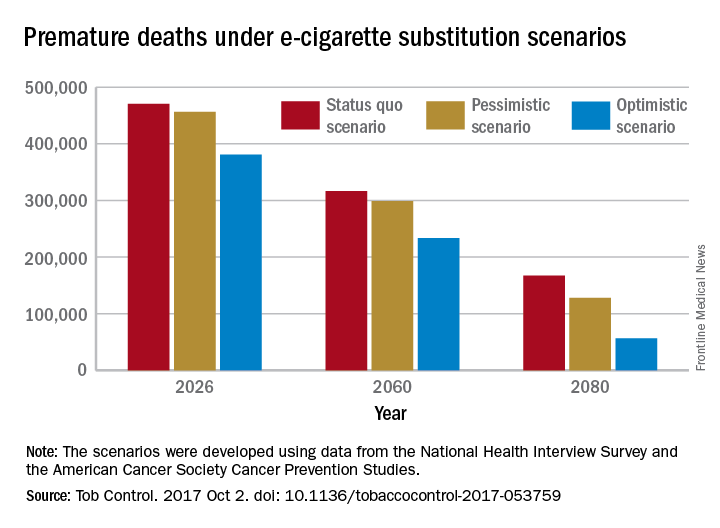
Further projections suggest that the optimistic scenario could result in almost 6.6 million fewer premature deaths and 86.7 million years of life gained by the year 2100, compared with the status quo scenario, while the pessimistic scenario would prevent 1.6 million deaths and add an extra 20.8 million years of life, they noted.
Since “a strategy of replacing cigarette by e-cigarette use can yield substantial gains, even with conservative assumptions about related risks … an endgame scenario for cigarettes might well be within reach, if new technologies for delivering nicotine with substantially less harm, but sufficient satisfaction, are harnessed with sufficient passion and political will to aggressively phase out tobacco cigarettes,” Dr. Levy and his associates wrote.
The study was funded by grants from the National Institute on Drug Abuse and the National Cancer Institute. One investigator received a research grant from Pfizer and served as an advisory board member to Johnson & Johnson, which manufactures smoking cessation medications. No other conflicts of interest were declared.
FROM TOBACCO CONTROL
Maternal antepartum depression creates bevy of long-term risks in offspring
PARIS – Maternal depression during pregnancy is a common occurrence that can have far-reaching effects in the offspring, according to Tiina Taka-Eilola, MD, of the University of Oulu (Finland).
Indeed, maternal antepartum depression may best be thought of as an adverse environmental factor that exacerbates the impact of any underlying genetic vulnerability to severe mental disorder that may be present in the offspring, she said at the annual congress of the European College of Neuropsychopharmacology.

At midgestation, back in the mid-1960s, 13.9% of the mothers of the Northern Finland Birth Cohort acknowledged feeling “depressed” or “very depressed,” rates consistent with those reported in other studies using standardized depression assessment instruments. Their offspring, by age 43 years, were 1.6-fold more likely to have a history of a current or past nonpsychotic mood disorder and 2-fold more likely to have had a psychotic mood disorder than did the offspring of mothers free of antepartum depression.
These risks were greatly amplified if either parent experienced a hospital-treated severe mental disorder before, during, or up to 18 years after the pregnancy. Offspring who had both a mother who experienced antepartum depression and a parent with a severe, hospital-treated mental disorder were at 3.9-fold increased risk for being diagnosed with nonpsychotic depression by age 43 years in an analysis adjusted for sex, perinatal complications, and other potential confounders. They also were at 5.6-fold increased risk for psychotic depression and a whopping 7.8-fold greater risk of bipolar disorder than offspring with neither risk factor.
Moreover, in an earlier study, among men in the Northern Finland cohort who were assessed at age 33 years, investigators found that maternal depression during pregnancy was associated with an adjusted 1.4-fold increased likelihood of having a criminal record for a nonviolent offense, a 1.6-fold increased risk of violent crime, and a 1.7-fold increase in violent recidivism. In contrast, women whose mothers were depressed during pregnancy didn’t have a significantly higher rate of criminality, compared with those whose mothers weren’t depressed (J Affect Disord. 2003 May;74[3]:273-8).
In another earlier analysis, Dr. Taka-Eilola’s senior coinvestigators demonstrated that the risk of schizophrenia in the Northern Finland offspring was 2.6-fold greater if there was parental psychosis but no maternal antepartum depression than if neither was present, while the risk was 9.4-fold higher when both risk factors were present (Am J Psychiatry. 2010 Jan;167[1]:70-7).
Dr. Taka-Eilola, a primary care physician, said that postpartum depression garners news headlines and is far more extensively researched than is antepartum depression, but as the Finnish data show, antepartum depression is at least as common and deserves to be taken seriously. It’s important to screen for it and to treat it in an effort to prevent adverse effects in the offspring, as well as out of concern for the mother’s well-being, she emphasized. She believes this is now more likely to happen as a consequence of a recent World Psychiatric Association report calling for greater clinician attention to perinatal mental health.
Dr. Taka-Eilola reported having no financial conflicts of interest regarding the Northern Finland Birth Cohort Study, which is supported by the Academy of Finland, the Finnish Cultural Foundation Lapland Regional Fund, and grants from various nonprofit foundations.
PARIS – Maternal depression during pregnancy is a common occurrence that can have far-reaching effects in the offspring, according to Tiina Taka-Eilola, MD, of the University of Oulu (Finland).
Indeed, maternal antepartum depression may best be thought of as an adverse environmental factor that exacerbates the impact of any underlying genetic vulnerability to severe mental disorder that may be present in the offspring, she said at the annual congress of the European College of Neuropsychopharmacology.
At midgestation, back in the mid-1960s, 13.9% of the mothers of the Northern Finland Birth Cohort acknowledged feeling “depressed” or “very depressed,” rates consistent with those reported in other studies using standardized depression assessment instruments. Their offspring, by age 43 years, were 1.6-fold more likely to have a history of a current or past nonpsychotic mood disorder and 2-fold more likely to have had a psychotic mood disorder than did the offspring of mothers free of antepartum depression.
These risks were greatly amplified if either parent experienced a hospital-treated severe mental disorder before, during, or up to 18 years after the pregnancy. Offspring who had both a mother who experienced antepartum depression and a parent with a severe, hospital-treated mental disorder were at 3.9-fold increased risk for being diagnosed with nonpsychotic depression by age 43 years in an analysis adjusted for sex, perinatal complications, and other potential confounders. They also were at 5.6-fold increased risk for psychotic depression and a whopping 7.8-fold greater risk of bipolar disorder than offspring with neither risk factor.
Moreover, in an earlier study, among men in the Northern Finland cohort who were assessed at age 33 years, investigators found that maternal depression during pregnancy was associated with an adjusted 1.4-fold increased likelihood of having a criminal record for a nonviolent offense, a 1.6-fold increased risk of violent crime, and a 1.7-fold increase in violent recidivism. In contrast, women whose mothers were depressed during pregnancy didn’t have a significantly higher rate of criminality, compared with those whose mothers weren’t depressed (J Affect Disord. 2003 May;74[3]:273-8).
In another earlier analysis, Dr. Taka-Eilola’s senior coinvestigators demonstrated that the risk of schizophrenia in the Northern Finland offspring was 2.6-fold greater if there was parental psychosis but no maternal antepartum depression than if neither was present, while the risk was 9.4-fold higher when both risk factors were present (Am J Psychiatry. 2010 Jan;167[1]:70-7).
Dr. Taka-Eilola, a primary care physician, said that postpartum depression garners news headlines and is far more extensively researched than is antepartum depression, but as the Finnish data show, antepartum depression is at least as common and deserves to be taken seriously. It’s important to screen for it and to treat it in an effort to prevent adverse effects in the offspring, as well as out of concern for the mother’s well-being, she emphasized. She believes this is now more likely to happen as a consequence of a recent World Psychiatric Association report calling for greater clinician attention to perinatal mental health.
Dr. Taka-Eilola reported having no financial conflicts of interest regarding the Northern Finland Birth Cohort Study, which is supported by the Academy of Finland, the Finnish Cultural Foundation Lapland Regional Fund, and grants from various nonprofit foundations.
AT THE ECNP CONGRESS
Key clinical point:
Major finding: By midlife, offspring of an mother who had antepartum depression and a parent with a severe, hospital-treated mental disorder were at an adjusted 5.6-fold increased risk for psychotic depression and 7.8-fold greater risk of bipolar disorder than the offspring with neither risk factor.
Data source: The Northern Finland Birth Cohort 1966 is an ongoing, observational, prospective, general population-based study of the 12,058 individuals born in the two northernmost provinces of Finland during 1966.
Disclosures: The presenter reported having no financial conflicts of interest regarding the study, which is supported by the Academy of Finland, the Finnish Cultural Foundation Lapland Regional Fund, and grants from various nonprofit foundations.
Evenamide impresses for schizophrenia
PARIS – The oral selective glutamate inhibitor evenamide is moving on to advanced clinical trials on the strength of positive results in a phase 2 study, Ravi Anand, MD, reported at the annual congress of the European College of Neuropsychopharmacology.
Evenamide is a highly selective inhibitor of voltage-gated sodium channels that also attenuates glutamate release by hyperexcited neurons, explained Dr. Anand, chief medical officer at Newron Pharmaceuticals, a company based in Bresso, Italy, that is developing this novel antipsychotic agent.
The 4-week, randomized, double-blind, placebo-controlled, multicenter study included 89 patients with schizophrenia of a mean 18 years’ duration. All participants showed baseline evidence of breakthrough psychosis despite being on stable therapeutic doses of previously effective risperidone or aripiprazole. They were randomized either to add-on oral evenamide at a starting dose of 15 mg twice daily titrated to 20 or 25 mg twice daily or to placebo.
As a phase 2 study, the primary focus was on safety and tolerability. Evenamide showed no dose-limiting toxicities. Nor did those in the evenamide group experience any of the common dopaminergic side effects seen with currently available antipsychotics, such as sedation, weight gain, sexual dysfunction, cardiac abnormalities, or extrapyramidal symptoms.
The only adverse events more common in the evenamide-treated group than in placebo-treated controls were insomnia and headache, which occurred in 5 and 3 of the 50 patients on evenamide, respectively.
In terms of efficacy, 75% of the evenamide group showed improvement over baseline in terms of the Positive and Negative Syndrome Scale, compared with 44% of controls. From a mean baseline total PANSS score of 62.7, the evenamide group experienced a 5.1-point reduction at day 28, compared with a 3.7-point improvement in controls. The difference between the two study arms was already significant at the first assessment, which took place on day 8.
Furthermore, 55% of patients in the evenamide group showed significant improvement on the Clinical Global Impression Severity score, compared with 36% of controls.
Because evenamide’s efficacy was greater in younger patients, the next round of larger, longer clinical trials will focus on younger patients with more severe symptoms, Dr. Anand said.
AT THE ECNP CONGRESS
Key clinical point:
Major finding: Three-quarters of schizophrenia patients on the oral glutamate modulator evenamide showed improvement over baseline in terms of the Positive and Negative Syndrome Scale, compared with 44% of controls.
Data source: This 4-week, randomized, double-blind, placebo-controlled, multicenter study included 89 patients with schizophrenia.
Disclosures: The study presenter is the chief medical officer at Newron Pharmaceuticals, which is developing the novel antipsychotic.
MIPS: It’s time to get started
David O. Barbe, MD, is urging physicians to participate in the Medicare Quality Payment Program, even if the business case isn’t quite there.
QPP is the value-based payment system created by the Medicare Access and CHIP Reauthorization Act (MACRA). It promotes high-value care through Medicare payment increases. But for some practices, the investment in personnel and technology needed to earn those increases may be more than the increases themselves, leading doctors to do just enough to avoid being penalized.
“I think that many physicians don’t feel they are ever going to get a bonus but sure would like to avoid a penalty,” Dr. Barbe, president of the American Medical Association, said in an exclusive interview. “I am afraid many will simply perform at the lowest level that keeps them out of the penalty. Because many of them find that making the investment it takes to perform highly, there is not a business case for that.”
Full participation in QPP’s Merit-based Incentive Payment System (MIPS) could run small practices an additional $10,000 to $30,000 a year, he said. “If you’ve got $200,000 in Medicare receipts, if you get adjusted even the maximum of 4%, that is $8,000. You can’t cover $20,000 with $8,000. The math doesn’t work. There is not a business case there for it.”
That said, Dr. Barbe still spoke in favor of QPP and noted that the AMA is working with the Centers for Medicare & Medicaid Services as well as Congress to make the program more valuable and meaningful for physicians.
“We understand where we need to go as a profession, as an industry,” he said. “How we get there is the key, it’s the challenge and it requires flexibility. ... CMS has been accommodating but there are limits to how long they can go.”
The AMA is urging doctors who have missed the 90-day window for full participation – which effectively closed for most on Oct. 2 – to consider the Pick Your Pace option offered by the CMS.
The video associated with this article is no longer available on this site. Please view all of our videos on the MDedge YouTube channel
Pick Your Pace allows physicians and practices to submit data on one measure for one patient to avoid a reduction in Medicare pay, even though they would not be eligible for a bonus.
“AMA has put out a lot of tools to help physicians assess their readiness, assess the gap between what they are able to do in their practice now and what they need to do to be successful under [the MIPS] primarily down to and including a video that would walk a physician step-by-step through the one patient, one measure, no penalty,” Dr. Barbe said.
He also encouraged doctors to pick a measure that is meaningful to their practice if only to get the ball rolling and get their feet wet in the QPP pool.
“What I tell physicians is pick something that is relevant for your practice,” he said.”If I see a lot of diabetes patients in my practice but I don’t see many people on anticoagulants, it doesn’t make sense for me to pick an anticoagulant measure.”
And if all a practice can do this year is one patient, one measure, Dr. Barbe urged physicians to look toward the next reporting year with an eye to do more, as that will ultimately lead to better quality of care delivered.
“Report on one patient and one measure this year ... but look at next year to say ‘that’s going to be a 90-day project for me,’ and get in on that. There is a pretty long laundry list of conditions and metrics that you can report on.”
And if practices start capturing relevant data, it opens the door to improving their practice if they also take the time to analyze what they are collecting.
“That is the purpose,” Dr. Barbe said. “As you measure yourself along the way, if the threshold for performance is here, and you find yourself working at this [lower] level for the first 30 days or whatever, then you stop and take stock of that” and react accordingly, whether its providing patients with a little more information about their condition or perhaps being more diligent in terms of monitoring high risk patients.

ANA 2017 offers career development sessions at all levels
Professional developments courses that will take place each morning during the annual meeting of the American Neurological Association in San Diego offer special opportunities to learn about the rewards and challenges of different career options for neurologists and researchers in academic neurology from those who have gone down a variety of careers paths themselves. Three courses each morning are geared specifically for students, residents, post-docs, and fellows, as well as for professionals at early-, mid-, and university-chair career levels.
For students, residents, post-docs, and fellows
On Oct. 15, young neurology scholars will begin the course with a discussion on the transition from neurology resident to fellow, and then career pathways as a basic scientist, a clinical scientist/researcher, and clinician-administrator. Last year’s recipients of the Derek Denny-Brown Young Neurological Scholar Award also will provide insights on successful early careers in academic neurology.
Global Health has many opportunities for individuals who are looking at potential career paths in neurology to conduct research, clinical care, or educate others in low- to middle-income countries. Speakers on Oct. 16 will share their experiences and discuss emerging trends in global health in neurology and ways in which individuals might pursue careers or opportunities that complement pursuits in academic neurology.
A workshop on Oct. 17 will focus on the essential skills needed for a successful job-seeking experience in academic neurology. There will be opportunities to practice interviewing and negotiating skills, as well as to learn how to market your research and abilities when the opportunity strikes and time is limited.
For early- to mid-career levels
Finding a niche and a successful career trajectory takes a good deal of planning and taking opportunities when the time is right. On Oct. 15, several mid-career level academic neurologists will share their career trajectories and alternative methods they have used for obtaining support and funding for their clinical research, educational enterprises, and curricular development.
The Oct. 16 career development course will outline methods for setting milestones for career development and finding the resources and mentoring individuals you will need for career advancement.
To learn skills and discover tools that will help to write successful grant proposals, particularly for the National Institutes of Health, come to the session on Oct. 17. You can learn how to develop your grant application, respond to critiques of your application, and hear about a variety of sources of funding.
For university chairs of neurology
At a time in which funding for salaries is hampered by many factors, salary disparities are changing across subspecialties as well as in different faculty positions, with some disparities widening and others shrinking. Come to the career development course on Oct. 15 to learn about novel revenue sources and ways in which you can best subsidize the salaries of faculties in your department as well as offer nonmonetary compensation.
Given the current uncertainties of the fates of Affordable Care Act, Medicare, and other major systems supporting health care, it is important to know the best approach to take in advocating for academic neurology and your department’s needs. At the course on Oct. 16, come learn about current health policy issues and the political climate and determine how and when to be politically active.
To understand the impact that the Medicare Access and CHIP Reauthorization Act of 2015 (MACRA) requirements will have on academic neurology, come to the session on Oct. 17. You’ll learn how population health measures and value-based care can be brought into an academic neurology practice, how to report on quality measures in the Merit-based Incentive Payment System, and how to participate in Advanced Alternative Payment Models.