User login
FDA approves IV formulation of drug for CINV

The US Food and Drug Administration (FDA) has approved an intravenous (IV) formulation of rolapitant (VARUBI®) for the same indication as the oral formulation.
This means IV rolapitant is now FDA-approved for use in combination with other antiemetic agents to prevent delayed nausea and vomiting associated with initial and repeat courses of emetogenic chemotherapy in adults with cancer.
TESARO Inc., makers of rolapitant, said the US commercial launch of IV rolapitant is planned for November.
Rolapitant is a selective and competitive antagonist of human substance P/neurokinin 1 receptors, which play an important role in the delayed phase of chemotherapy-induced nausea and vomiting (CINV).
IV rolapitant features a ready-to-use, single-dose vial for administration. It does not require refrigerated storage or mixing.
The recommended dose of IV rolapitant is 166.5 mg, administered over 30 minutes. The drug is to be administered up to 2 hours before chemotherapy administration in combination with a 5-HT3 receptor antagonist and dexamethasone.
The full prescribing information for IV rolapitant is available at www.varubirx.com.
Bioequivalence trial
Results from a bioequivalence trial suggest the IV and oral formulations of rolapitant are comparable.
The study was conducted in healthy volunteers. Subjects were randomized to receive a single dose of IV rolapitant at 166.5 mg administered over 30 minutes (n=61) or oral rolapitant at 180 mg (n=62).
The primary endpoint was bioequivalence, and the 166.5 mg IV infusion of rolapitant met bioequivalence criteria.
Researchers said the safety profile of IV rolapitant was largely consistent with that of oral rolapitant, although infusion-site reactions were observed with the IV formulation. These included the sensation of warmth, abdominal pain, dizziness, and paresthesia.
These results were recently published in The Journal of Clinical Pharmacology.
Oral rolapitant trials
Two phase 3 trials showed that oral rolapitant, in combination with a 5-HT3 receptor antagonist and dexamethasone, was well tolerated and more effective than active control in preventing CINV after highly emetogenic chemotherapy.
Results from these trials (NCT01499849 and NCT01500213) were published in a single article in The Lancet Oncology.
A third phase 3 trial showed that oral rolapitant, in combination with a 5-HT3 receptor antagonist and dexamethasone, was well tolerated and more effective than active control in preventing CINV after moderately emetogenic chemotherapy.
Results from this trial (NCT01500226) were also published in The Lancet Oncology. ![]()
Overcoming resistance to proteasome inhibitors
Preclinical research has revealed a potential method of overcoming resistance to proteasome inhibitors.
By studying a rare genetic disease known as NGLY1 deficiency, researchers have gained new understanding of resistance to proteasome inhibitors.
The team found that treatment with a NGLY1 inhibitor can enhance the activity of the proteasome inhibitor carfilzomib against multiple myeloma (MM) and T-cell acute lymphoblastic leukemia (T-ALL).
Carolyn Bertozzi, PhD, of Stanford University in California, and her colleagues reported these findings in ACS Central Science.
Previous studies have suggested that proteasome inhibitor resistance could be linked to a protein called Nrf1. When proteasome inhibitors swing into action, Nrf1 is spurred into overdrive to restore cancer cells’ normal activities and keep them alive.
Researchers theorized that, if they could block Nrf1, they might be able to overcome proteasome inhibitor resistance.
Through studying NGLY1 deficiency, Dr Bertozzi and her colleagues may have hit upon an approach to do just that.
The researchers were investigating how lacking NGLY1 causes a host of debilitating symptoms, and they found that NGLY1 is responsible for activating Nrf1.
Further testing revealed that inhibiting NGLY1 eliminated interference from Nrf1 and enhanced the cytotoxicity of carfilzomib in MM and T-ALL cell lines.
The researchers treated the MM cell lines U266 and H929 with the NGLY1 inhibitor, known as WRR139, and carfilzomib and observed a significant decrease in cell survival when compared to treatment with carfilzomib alone. The team observed the same results when testing the T-ALL Jurkat cell line.
The addition of WRR139 resulted in a 2.6-fold reduction in carfilzomib’s LD50 for U266, a 2.0-fold reduction for H929, and a 1.5-fold reduction for Jurkat cells.
The researchers said these findings hold promise for the development of combination therapies for hematologic malignancies. ![]()
Hemophilia B therapy approved in Saudi Arabia

The Saudi Food and Drug Authority has approved eftrenonacog alfa (Alprolix®) for the treatment of hemophilia B in the Kingdom of Saudi Arabia.
Eftrenonacog alfa is a recombinant factor IX Fc fusion protein indicated for on-demand treatment and prophylaxis in hemophilia B patients of all ages.
Eftrenonacog alfa is engineered by fusing factor IX to the Fc portion of immunoglobulin G subclass 1. This enables eftrenonacog alfa to use a naturally occurring pathway to prolong the time the therapy remains in the body.
Eftrenonacog alfa is approved to treat hemophilia B in the European Union, Iceland, Liechtenstein, Kuwait, Norway, and Switzerland (where it is marketed by Sobi). The product is also approved in the US, Canada, Japan, Australia, New Zealand, and other countries (where it is marketed by Bioverativ).
The approvals of eftrenonacog alfa are based on results from a pair of phase 3 trials—the B-LONG study and the Kids B-LONG study.
B-LONG study
The B-LONG study included 123 males with severe hemophilia B who were 12 years of age or older. They had no current or previous factor IX inhibitors and a history of 100 or more documented prior exposure days to factor IX products.
Patients received eftrenonacog alfa in 1 of 4 treatment arms:
- Weekly prophylaxis starting at 50 IU/kg, with pharmacokinetic (PK)-driven dose adjustments (n=63)
- Individualized interval prophylaxis starting at 100 IU/kg every 10 days, with PK-driven interval adjustments (n=29)
- On-demand treatment at 20 IU/kg to 100 IU/kg (n=27)
- Perioperative management (n=12, including 8 from arms 1-3).
Researchers assessed control of bleeding in all patients who experienced a bleeding episode while on study. In total, 90.4% of bleeding episodes were controlled by a single injection of eftrenonacog alfa.
The overall median annualized bleeding rates (ABRs)—including spontaneous and traumatic bleeds—were 2.95 in the weekly prophylaxis arm, 1.38 in the individualized interval prophylaxis arm, and 17.69 in the episodic treatment arm.
The perioperative management arm consisted of 12 patients undergoing 14 major surgical procedures. The treating physicians rated the hemostatic efficacy of eftrenonacog alfa as “excellent” or “good” in all surgeries.
Eftrenonacog alfa was considered generally well-tolerated. None of the patients developed inhibitors, and none reported anaphylaxis.
The most common adverse events—with an incidence of 5% or greater—occurring outside of the perioperative management arm were nasopharyngitis, influenza, arthralgia, upper respiratory infection, hypertension, and headache.
One serious adverse event may have been drug-related. The patient experienced obstructive uropathy in the setting of hematuria. However, he continued to receive eftrenonacog alfa, and the event resolved with medical management.
Kids B-LONG
In Kids B-LONG, researchers tested eftrenonacog alfa in 30 previously treated males younger than 12 who had severe hemophilia B. Patients had at least 50 prior exposure days to factor IX therapies.
Children who received eftrenonacog alfa prophylactically had an overall median ABR of 1.97. The median ABR for spontaneous joint bleeds was 0.
Approximately 33% of patients did not experience any bleeding episodes. About 92% of bleeding episodes were controlled by 1 or 2 injections of eftrenonacog alfa.
None of the patients developed inhibitors. There were no treatment-related serious adverse events and no cases of serious allergic reactions or vascular thrombotic events.
None of the patients discontinued the study due to an adverse event. One adverse event—decreased appetite occurring in 1 patient—was considered related to eftrenonacog alfa.
The pattern of treatment-emergent adverse events in this study was generally consistent with results seen in adolescents and adults in the B-LONG study. ![]()
VIDEO: Liver transplant center competition tied to delisting patients
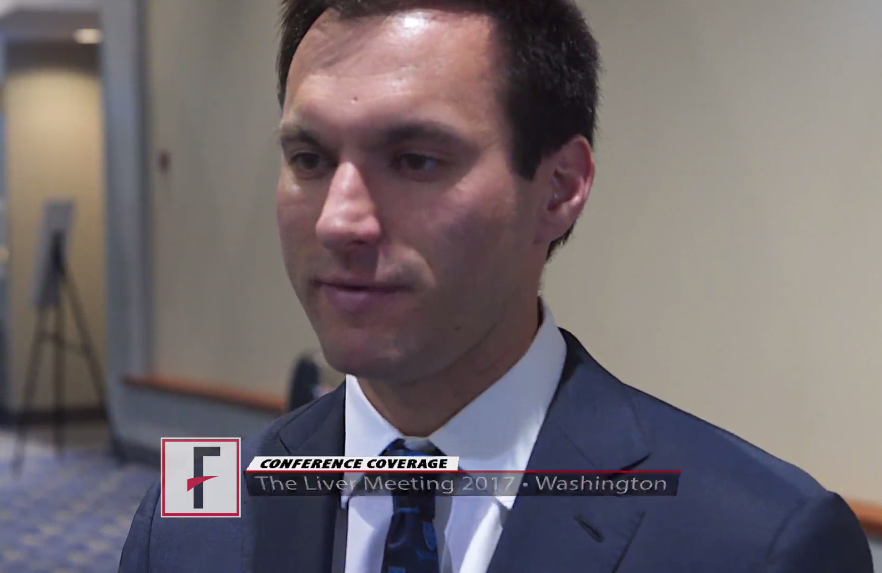
WASHINGTON – Low market competition among liver transplant centers may affect which patients are considered too sick to transplant, according to a study presented at the annual meeting of the American Association for the Study of Liver Diseases.
With 20% of patients dying while on the transplant wait list, including those who were delisted, understanding the distribution of organs among donor service areas (DSAs) is crucial to lowering mortality during the current organ shortage, according to presenter Yanik Babekov, MD, of Massachusetts General Hospital, Boston.
Investigators studied 3,131 patients who were delisted after being classified as “too sick” from 116 centers in 51 DSAs, between 2002 and 2012.
Researchers used the Herfindahl-Hirschman Index (HHI), which analyzes the market share of each participant to determine the overall level of competition. Measurements on the HHI range between 0 and 1, with 0 being the most competitive and 1 being the least.
Mean delisting Model for End-Stage Liver Disease (MELD) scores considered to be “too sick to transplant” were 26.1, and average HHI among DSAs was 0.46, according to investigators. They found that, for every 1% increase in HHI, the delisting MELD score increased by 0.06, according to a risk-adjustment analysis.
“In other words, more competitive DSAs delist patients for [being] ‘too sick’ at lower MELD scores,” Dr. Babekov explained in a video interview. “Interestingly, race, education, citizenship, and other DSA factors also impacted delisting MELD for ‘too sick.’ ”
While market competition may not be the only factor to explain the phenomenon of patients delisted for being ‘too sick,’ it is important to identify how having more transplant centers in DSAs can help more patients be added to, and stay on, these wait lists, according to investigators.
Dr. Babekov had no relevant financial disclosures.
The video associated with this article is no longer available on this site. Please view all of our videos on the MDedge YouTube channel
[email protected]
On Twitter @eaztweets
AT THE LIVER MEETING 2017
‘Year of AML’ just the beginning, expert says
SAN FRANCISCO – After years of stagnation in the field of acute myeloid leukemia – with most standard therapies developed in the 1970s – times are changing, Bruno Medeiros, MD, said at the annual congress on hematologic malignancies held by the National Comprehensive Cancer Network.
“2017 is the year of AML,” he said. Four new therapies have been approved by the FDA since April. They include midostaurin for newly diagnosed, FLT-3–mutated patients; enasidenib, for relapsed/refractory IDH2-mutated patients; CPX-351, for high-risk AML patients; and gemtuzumab ozogamicin for newly diagnosed, CD-33–positive patients.
“Development of novel therapies in order to improve the outcomes of these patients is crucial,” said Dr. Medeiros, director of the inpatient hematology service at Stanford (Calif.) Cancer Institute. “I think all of us in the community hope that this is just the tip of the iceberg – this is just the beginning.”
The field is still struggling to negotiate the newly broadened landscape of AML treatment, he said. For instance, it’s not known exactly which patients are likely to respond to isocitrate dehydrogenase (IDH) inhibitors, he said.
He did offer some guidance on the use of CPX-351, a new formulation of the chemotherapeutic agents cytarabine and daunorubicin that is active in chemotherapy-resistant patients and could be a useful tool leading up to transplant.
“It appears that this drug is able to actually get patients into remission more effectively, leads to fewer toxicities and then allows patients to get to transplant in better shape with better disease response, translating into better overall outcomes,” Dr. Medeiros said.
Many more drugs are in development, with results likely to be revealed soon. Approval for a novel IDH1 inhibitor – only the IDH2 inhibitor is currently approved – is expected early next year. Also under investigation are the hypomethylating agents guadecitabine, a formulation that protects decitabine from degradation, and oral azacitidine, which might be beneficial particularly to patients not eligible for allogeneic stem cell transplant; the B-cell lymphoma 2–inhibitor venetoclax; and an E-selectin antagonist that targets an adhesion molecule in AML cells.
Chimeric antigen receptor T-cell therapy – so promising in other areas of hematologic treatment – is complicated in AML, he said, because of the lack of a target that doesn’t bring on unwanted effects.
“The expression of any antigen in leukemic stem cells is also shared by the expression in hematopoietic stem cells and therefore the use of agents that will target these particular antigens consequently leads to an ‘on-target, off-leukemia’ side effect associated with myeloid cell aplasia.”
Dr. Medeiros reports financial relationships with Celgene, Jazz, Novartis, Pfizer, and other companies.
EXPERT ANALYSIS FROM THE NCCN HEMATOLOGIC MALIGNANCIES CONGRESS
Aspirin responsiveness improved in some with OSA
Obstructive sleep apnea patients with endothelial dysfunction gained aspirin responsiveness after using continuous positive airway pressure (CPAP) therapy, according to the findings from a small study scheduled to be presented at CHEST 2017.
“Endothelial dysfunction is an important phenomenon implicated in cardiovascular morbidity in obstructive sleep apnea (OSA) patients. While it has been demonstrated that CPAP improves endothelial function, our understanding of the pathophysiologic links between CPAP therapy and cardiovascular outcomes remain limited,” researchers wrote in the study’s abstract.
The researchers examined 18 patients’ endothelial function before and after using CPAP therapy for a median of 37 days, along with the relationship between endothelial function and aspirin responsiveness in these same patients. All study participants had been recently diagnosed with moderate to severe OSA and underwent modified peripheral artery tonometry and platelet aggregometry before and after beginning CPAP therapy. Most of the patients (14) demonstrated aspirin resistance at baseline.
Endothelial dysfunction was defined as having a reactive hyperemia index (RHI) of less than or equal to 1.67, while aspirin resistance was defined as having a reading of at least 550 aspirin reaction units (ARU).
At baseline, the average RHI of patients was 1.79 (standard deviation = 0.3), with 8 of the patients having had endothelial dysfunction. Following CPAP use, patients’ mean RHI increased to 1.94 (SD = 0.36), and endothelial dysfunction was present in just 5 of the study participants.*
After using CPAP, those patients with endothelial dysfunction at baseline were responsive to aspirin, with their average ARU reading at 520 following therapy. In contrast, those patients with normal endothelial function at baseline remained resistant to aspirin following CPAP use, based on mean ARU values before and after therapy.
Lirim Krveshi, DO, of Danbury (Conn.) Hospital, is scheduled to present this study, “A Prospective Cohort Study of Endothelial Function and its Relationship to Aspirin Responsiveness in OSA Patients,” on Sunday, Oct. 29, at 1:45 p.m. in Convention Center, room 601A. This presentation is part of the Obstructive Sleep Apnea: Insights & Management session, running from 1:30 p.m. to 3:00 p.m.
The study’s authors reported no conflicts of interest.
*This article was updated Oct. 27, 2017.
FROM CHEST 2017
Key clinical point:
Major finding: The average aspirin reaction units reading for patients who had endothelial dysfunction at baseline was 520 following therapy.
Data source: A prospective cohort study of 18 patients with newly diagnosed moderate to severe OSA.
Disclosures: The study’s authors reported no conflicts of interest.
Surgeons paid a price for presidential procedures
SAN DIEGO – A surgical team was forced to perform a delicate oral procedure on a rocking yacht while making sure to preserve presidential whiskers. A domineering doctor ignored fellow physicians while a president spent months dying in agony. And, after helping to save the leader of the free world, the leader of the American College of Surgeons found himself viciously attacked by his own colleagues.
When a quartet of ill U.S. presidents developed major medical problems, an audience at the annual clinical congress of the American College of Surgeons learned, their treating physicians ended up with major headaches of their own.
President Grover Cleveland, for example, required his surgical team to remove an oral tumor in total secrecy in 1893, robbing him of a big chunk of his upper palate. “The president had a mustache, and the mustache had to be left alone, and there could be no scars,” said the Hospital for Special Surgery’s J. Patrick O’Leary, MD, FACS, who spoke in a session focused on the history of presidential medicine.
The only light came from a single incandescent bulb, and the procedure was performed at sea, on a yacht anchored off Long Island, N.Y.
“If you were presented with these parameters as a surgeon today, my guess is that you would have demurred on taking on this project,” Dr. O’Leary said. “It was a prescription for a disaster.”
President Cleveland survived for another 15 years. James Garfield, a fellow Civil War veteran, wasn’t so fortunate. In 1881, he was astonishingly unlucky, the unwitting victim of a fumbling physician who dominated his care after an assassin shot him in the chest.
That physician, Willard Bliss, MD, dismissed other doctors who knew the president well and isolated this gregarious man from friends and family. He also ignored emerging knowledge about germ control. And he fed Garfield a heavy diet that the digestively sensitive president probably couldn’t have tolerated in the best of times. The result: endless vomiting, the loss of almost 80 pounds, and an unsuccessful rectal feeding regimen.
Toward the end of the president’s gruesome summer-long decline, Dr. Bliss told all but two doctors to stay away, John B. Hanks, MD, of the University of Virginia, Charlottesville, said in his presentation. Then the president died of a wound that Dr. Hanks said would have been survivable with proper care even in the 1880s.
History has been unkind to Dr. Bliss, in part because his patient died. But another presidential physician faced bizarre post surgery scorn from his ACS colleagues, even though his patient lived, according to Justin Barr, MD, PhD, of Duke University, Durham, N.C.
In 1956, surgeon Isidor Ravdin, MD, of the University of Pennsylvania, Philadelphia, was called in when President Dwight D. Eisenhower needed surgery to eliminate a bowel obstruction.
A team of physicians agreed that the president needed surgery. “They felt they were dealing with an elderly, sick patient who’d been in shock during his illness and had recently suffered a myocardial infarction,” Dr. Barr said. “They unanimously decided to proceed with a bypass over resection.”
It’s clear today that the physicians made the correct choice, Dr. Barr said. But his colleagues attacked Dr. Ravdin, who later complained that criticisms multiplied in direct ratio to distance from the operating room.
At the time, Dr. Ravdin was chair of the ACS Board of Regents. The entire board accused him of violating college policies regarding “ghost surgery” (performing procedures without the patient’s knowledge) and “itinerant surgery” (traveling to perform a procedure and then leaving).
Dr. Ravdin acknowledged that he had performed itinerant surgery to some extent, but he denied the ghost surgery charge. In fact, he and the president became friends.
His colleagues also attacked him over his decision to not perform a resection procedure. “They were accusing him of not only being an unethical surgeon, but also an incompetent one,” said Dr. Barr, who calls the letters about the allegations “truly bewildering.”
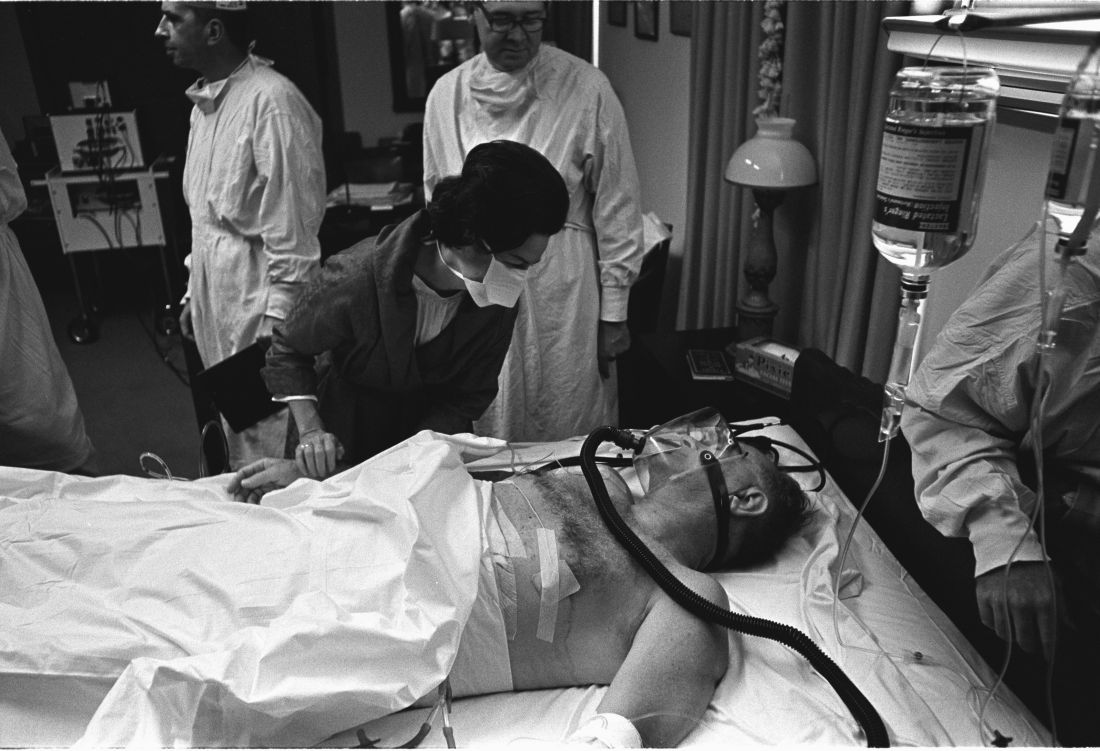
Also bewildering: Lyndon B. Johnson’s choice to display his gallbladder surgery scar to the press in 1965, spawning one of the most infamous photos of his presidency.
Few surgeons see their handiwork so prominently displayed. Fortunately for them, the operating theater was in a naval hospital, not on a boat. And, as far as we know, no one fretted over the fate of a single facial hair.
SAN DIEGO – A surgical team was forced to perform a delicate oral procedure on a rocking yacht while making sure to preserve presidential whiskers. A domineering doctor ignored fellow physicians while a president spent months dying in agony. And, after helping to save the leader of the free world, the leader of the American College of Surgeons found himself viciously attacked by his own colleagues.
When a quartet of ill U.S. presidents developed major medical problems, an audience at the annual clinical congress of the American College of Surgeons learned, their treating physicians ended up with major headaches of their own.
President Grover Cleveland, for example, required his surgical team to remove an oral tumor in total secrecy in 1893, robbing him of a big chunk of his upper palate. “The president had a mustache, and the mustache had to be left alone, and there could be no scars,” said the Hospital for Special Surgery’s J. Patrick O’Leary, MD, FACS, who spoke in a session focused on the history of presidential medicine.
The only light came from a single incandescent bulb, and the procedure was performed at sea, on a yacht anchored off Long Island, N.Y.
“If you were presented with these parameters as a surgeon today, my guess is that you would have demurred on taking on this project,” Dr. O’Leary said. “It was a prescription for a disaster.”
President Cleveland survived for another 15 years. James Garfield, a fellow Civil War veteran, wasn’t so fortunate. In 1881, he was astonishingly unlucky, the unwitting victim of a fumbling physician who dominated his care after an assassin shot him in the chest.
That physician, Willard Bliss, MD, dismissed other doctors who knew the president well and isolated this gregarious man from friends and family. He also ignored emerging knowledge about germ control. And he fed Garfield a heavy diet that the digestively sensitive president probably couldn’t have tolerated in the best of times. The result: endless vomiting, the loss of almost 80 pounds, and an unsuccessful rectal feeding regimen.
Toward the end of the president’s gruesome summer-long decline, Dr. Bliss told all but two doctors to stay away, John B. Hanks, MD, of the University of Virginia, Charlottesville, said in his presentation. Then the president died of a wound that Dr. Hanks said would have been survivable with proper care even in the 1880s.
History has been unkind to Dr. Bliss, in part because his patient died. But another presidential physician faced bizarre post surgery scorn from his ACS colleagues, even though his patient lived, according to Justin Barr, MD, PhD, of Duke University, Durham, N.C.
In 1956, surgeon Isidor Ravdin, MD, of the University of Pennsylvania, Philadelphia, was called in when President Dwight D. Eisenhower needed surgery to eliminate a bowel obstruction.
A team of physicians agreed that the president needed surgery. “They felt they were dealing with an elderly, sick patient who’d been in shock during his illness and had recently suffered a myocardial infarction,” Dr. Barr said. “They unanimously decided to proceed with a bypass over resection.”
It’s clear today that the physicians made the correct choice, Dr. Barr said. But his colleagues attacked Dr. Ravdin, who later complained that criticisms multiplied in direct ratio to distance from the operating room.
At the time, Dr. Ravdin was chair of the ACS Board of Regents. The entire board accused him of violating college policies regarding “ghost surgery” (performing procedures without the patient’s knowledge) and “itinerant surgery” (traveling to perform a procedure and then leaving).
Dr. Ravdin acknowledged that he had performed itinerant surgery to some extent, but he denied the ghost surgery charge. In fact, he and the president became friends.
His colleagues also attacked him over his decision to not perform a resection procedure. “They were accusing him of not only being an unethical surgeon, but also an incompetent one,” said Dr. Barr, who calls the letters about the allegations “truly bewildering.”
Also bewildering: Lyndon B. Johnson’s choice to display his gallbladder surgery scar to the press in 1965, spawning one of the most infamous photos of his presidency.
Few surgeons see their handiwork so prominently displayed. Fortunately for them, the operating theater was in a naval hospital, not on a boat. And, as far as we know, no one fretted over the fate of a single facial hair.
AT THE ACS CLINICAL CONGRESS
Genomic Profiling May Improve Pediatric Brain Tumor Treatment
Genomic profiling of 282 pediatric gliomas detected genetic alterations in 96% of the cases, according to research published online ahead of print September 14 in the Oncologist. Information about genetic alterations may inform prognosis and help identify effective treatments, the researchers said.
Shakti Ramkissoon, MD, PhD, Associate Medical Director at Foundation Medicine in Morrisville, North Carolina, and colleagues studied 125 low-grade gliomas and 157 high-grade gliomas taken from children at medical centers in the US. Foundation Medicine, a genomic profiling company based in Cambridge, Massachusetts, supported the study, which is the largest to date of pediatric gliomas profiled by next-generation sequencing.
The investigators sequenced 315 cancer-related genes and 28 genes commonly rearranged in cancer. Patients’ median age was 11, and 50% were male.
The most frequently altered genes differed between low- and high-grade gliomas. In low-grade gliomas, BRAF was altered in 48% of cases. In addition, FGFR1 missense (17.6%), NF1 loss of function (8.8%), and TP53 (5.6%) mutations also were detected. Among high-grade gliomas, the genes most frequently mutated were TP53 (49%), H3F3A (37.6%), ATRX (24.2%), NF1 (22.2%), and PDGFRA (21.7%).
Studies indicate that low-grade gliomas with BRAF fusions, compared with BRAF mutations, have better outcomes, Dr. Ramkissoon said. “Therefore, determining the BRAF status for all pediatric low-grade gliomas is important for clinical management,” he said.
In addition, genetic mutations may highlight potential therapeutic targets. “Although surgical resection remains the most effective treatment option for pediatric low-grade gliomas, tumors located in eloquent areas not amenable to surgical resection (eg, motor cortex) require alternative therapeutic strategies,” the researchers said. “We report a multiply recurrent NF1-mutated pilocytic astrocytoma previously treated with surgery alone that now shows a remarkable response to dual inhibitor therapy (everolimus and trametinib) following three months of treatment.”
The study demonstrates that genomic profiling can be integrated into routine clinical practice, Dr. Ramkissoon said. “Comprehensive genomic profiling of pediatric gliomas provides objective data that promote diagnostic accuracy and enhance clinical decision-making,” the researchers concluded.
—Jake Remaly
Suggested Reading
Johnson A, Severson E, Gay L, et al. Comprehensive genomic profiling of 282 pediatric low- and high-grade gliomas reveals genomic drivers, tumor mutational burden, and hypermutation signatures. Oncologist. 2017 Sep 14 [Epub ahead of print].
Weller M, Weber RG, Willscher E, et al. Molecular classification of diffuse cerebral WHO grade II/III gliomas using genome- and transcriptome-wide profiling improves stratification of prognostically distinct patient groups. Acta Neuropathol. 2015;129(5):679-693.
Which Factors Predict Conversion From CIS to MS?
Age at onset, exposure to disease-modifying drugs (DMDs), disability at onset, MRI criteria, and oligoclonal bands affect the likelihood of conversion from clinically isolated syndrome (CIS) to multiple sclerosis (MS), according to research published in the September issue of Multiple Sclerosis Journal. The study results corroborate and augment previous research into factors that predict clinical conversion, said the authors.
In addition, the researchers developed and validated a nomogram intended to predict individualized risk of relapse after CIS. The nomogram’s estimated probabilities of conversion to MS had high concordance with observed rates of conversion.
An Analysis of Prospective Data
Tim Spelman, MBBS
Dr. Spelman and colleagues used Cox proportional hazards regression to examine the correlation between previously identified predictors and time to first relapse after CIS. They used their baseline-adjusted data modeling to create a nomogram to predict conversion to clinically definite MS.
Drug Exposure Reduced Risk
Approximately 43% of participants initiated intramuscular interferon β-1a, 34% initiated subcutaneous interferon β-1a, 18% initiated interferon β-1b, and 14% initiated glatiramer acetate. In all, 1,953 patients (59%) had a relapse during a median follow-up of 1.92 years.
Older age at CIS was associated with a 10% reduction in the risk of clinical conversion. Every one-point increase in baseline EDSS score was associated with 1.16 times the rate of subsequent conversion. Compared with the optic pathway, first symptom location in the brainstem was associated with 1.17 times the rate of second attack, and first symptom location in the supratentorial region was associated with 1.29 times the rate of second attack. Any exposure to DMD during follow-up was associated with a 42% rate reduction in time to first relapse, compared with nonexposure.
CSF-restricted oligoclonal bands were associated with 1.52 times the rate of relapse, compared with the absence of oligoclonal bands. Having at least one T1 gadolinium-enhancing lesion was associated with 1.24 times the rate of relapse. Having three or more periventricular lesions was associated with 1.68 times the rate of relapse, compared with no lesions. Having at least one infratentorial and at least one juxtacortical lesion on brain MRI were associated with 1.21 times and 1.21 times the rate of first post-CIS relapse, respectively, compared with no lesions.
“This multinational, prospective study represents the largest post-CIS cohort reported to date,” said Dr. Spelman. “Identification of patient, disease, and examination factors associated with higher probability of second attack in clinical practice may enable clinicians to flag patients that could benefit from more intensive follow-up and consideration of early DMD treatment intervention, [thus] facilitating more favorable patient outcomes.”
—Erik Greb
Suggested Reading
Spelman T, Meyniel C, Rojas JI, et al. Quantifying risk of early relapse in patients with first demyelinating events: Prediction in clinical practice. Mult Scler. 2017;23(10):1346-1357.
AF patients without oral anticoagulation face higher dementia risk
BARCELONA – The risk of developing dementia was reduced by 48% in patients with atrial fibrillation who were adherent to oral anticoagulation compared with those who were not, according to a Swedish propensity-matched registry study involving nearly 162,000 patients with the arrhythmia.
The study also addressed whether patients with atrial fibrillation (AF) are better off in terms of reducing their dementia risk if they’re on warfarin versus one of the novel oral anticoagulants. The answer is that it makes absolutely no difference, Leif Friberg, MD, reported at the annual congress of the European Society of Cardiology.
“We found no difference whatsoever in any of the subgroups. It appears that it is more important that you have some kind of oral treatment than exactly what kind to have,” said Dr. Friberg, a cardiologist at the Karolinska Institute in Stockholm.
It’s well established that AF is associated with increased risk of dementia, presumably because the arrhythmia kicks out microemboli that get distributed throughout the brain. But it has been unclear whether oral anticoagulation (OAC) prescribed for stroke prevention has the side benefit of reducing the elevated dementia risk.
“A randomized, controlled trial would be ideal to look at this, but it would be impractical and unethical. Second best [would be] a registry study with propensity matching,” according to Dr. Friberg.
And that’s just what he and his coinvestigators carried out. The study included 80,948 AF patients with no baseline diagnosis of dementia who were prescribed an OAC and an equal number of propensity-matched, dementia-free AF patients not on OAC therapy. During up to 8 years of follow-up, the unadjusted risk of a new diagnosis of dementia was 29% lower in the group on an OAC at baseline.
But the Swedish registries also enabled investigators to zero in on the impact of OAC in patients who were actually medication adherent over time. Dr. Friberg and his coworkers identified a subgroup of 50,406 AF patients who regularly filled their OAC prescriptions and took the medication at least 80% of the time, as well as 48,947 propensity-matched controls who never used OACs. In this on-treatment analysis, the OAC users had a robust 48% relative risk reduction in new diagnosis of dementia. The dementia curves diverged almost immediately and the gap between the two curves continued to widen throughout follow-up. All examined subgroups benefited, regardless of age, gender, AF duration, CHA2DS2-VASc score, or the presence or absence of diabetes, renal failure, or frequent falling.
“This is an important issue,” Dr. Friberg declared. “You may say, ‘What do we care about these findings? These patients are all supposed to be on an oral anticoagulant anyway.’ But you know, patients stop taking their oral anticoagulant. We’re pretty good at initiating treatment when we meet patients for the first time, if they have stroke risk factors, but annually, 10%-15% of patients drop out of treatment. And if patients aren’t concerned enough about their risk of stroke, they might be more concerned about the risk of becoming demented. So these data provide an additional argument for the need to persevere with oral anticoagulation therapy.”
Session cochair Gabriel Tatu-Chitoiu, MD, was skeptical.
“I’ve been working in the atrial fibrillation field for 40 years, and I have to say I haven’t seen a strong dementia possibility in my patients,” said Dr. Tatu-Chitoiu, a cardiologist in Bucharest, Romania, and immediate past president of the Romanian Cardiology Society.
Dr. Friberg replied that AF patients are elderly, and many of them may stop going to their cardiologist when they develop dementia.
“I don’t think you can make extensions from personal experience on this. You have to trust in statistical evidence,” he observed.
Dr. Friberg reported receiving research funding from Bayer, Bristol-Myers Squibb, Pfizer, and Sanofi. However, the registry study was carried out without commercial support.
AT THE ESC CONGRESS 2017
Key clinical point:
Major finding: The risk of new diagnosis of dementia during up to 8 years of follow-up was 48% lower in AF patients on an oral anticoagulant at least 80% of the time, compared with those not on the medication.
Data source: This was a Swedish registry study including nearly 162,000 propensity-matched patients with atrial fibrillation free of baseline dementia.
Disclosures: The study was conducted without commercial support.