User login
Transitioning GI patients from pediatric to adult care
As pediatric patients with chronic gastrointestinal (GI) disorders mature into adulthood, they require a seamless transition of care into an adult practice. Health care transition is more than a simple transfer of care to an adult provider; it is a purposeful, planned movement of young adults with chronic medical conditions from a child-centered health care system to adult-oriented one.1 Many adolescents with chronic GI disorders are at increased risk of developmental and psychosocial delays and depressive disorders.2-6 A successful transition program can mitigate some of the psychosocial impacts of chronic disorders by improving self-efficacy and autonomy.7

Timing of transition
Unlike other nations where legislation often mandates the age of transition to adult care, the United States leaves decisions about the appropriate time to transition to the discretion of individual patients and pediatricians. While the actual transfer of care may not happen until later, it is prudent to start planning when the patient is in early adolescence. The pediatric gastroenterologist should initiate the discussion with patients and caregivers when the child is 13-15 years of age.12,13 Since health care transition is a complex and lengthy process, it should be approached within a framework that is appropriate for the developmental stage of the patient and at a time when their disease is in remission.14
During the initial discussions, the idea of transition should be introduced to the patient and his or her family by emphasizing the benefits of improved self-management skills, adherence to therapy, and normalization of development. The pediatrician should encourage a greater sense of independence and self-reliance by seeing the patient alone for at least a portion of the clinic visit and encourage future independent visits.
Developing a transition plan

Once the concept of transition of care has been introduced, it is prudent to devise a transition plan tailored to the specific needs and goals of the patient and family.24 Each plan should include who the adult provider will be, the tasks the adolescent must master before entering adult care, and how the care will be financed (because insurance coverage and options may change).25 A well-planned transition should enhance self-efficacy and self-management skills, increase knowledge of medical states, ensure adherence to therapy, and encourage independent decision making.12
Assessing transition readiness
Once the process of transitioning has been initiated, it is helpful to assess transition readiness at regular intervals. This will identify gaps in knowledge and inform appropriate interventions for individual patients. There are several questionnaires that can be administered at regular intervals and be made an integral part of routine clinic visits for adolescent patients. These assessments are now billable under CPT Code 99420 (administration and interpretation of health risk assessment). A standardized instrument should be used and the results recorded in the clinical encounter to ensure billing compliance.
The Transition Readiness Assessment Questionnaire (available online at www.GotTransition.org) is a validated tool that assesses an individual’s awareness of his or her medical needs, treatment plan, and ability to communicate effectively with his or her health care provider.26-28 While not specific to GI disorders, it has been validated in IBD patients and shown to correlate well with the IBD Self-Efficacy Scale for Adolescents.29,30 The University of North Carolina’s TRxANSITION Index, as well as the Social-Ecological Model of Adolescent and Young Adult Readiness for Transition, can be used for patients with various chronic diseases.31,32 Instruments specifically developed to assess transition readiness among patients with IBD include the “IBD-Yourself” questionnaire and MyHealth Passport for IBD.33,34 Additionally, Hait et al. provide a checklist of age-appropriate tasks for patients and their providers.14 The North American Society for Pediatric Gastroenterology, Hepatology and Nutrition has created the “Healthcare Provider Transition Checklist,” which is applicable to all chronic GI disorders.35
Transfer of care
The actual transfer of care is the culmination of the transition process. While the onus of initiating and monitoring a patient’s progress is driven by his or her pediatric provider, a responsive adult provider is integral, so it is vital to identify an adult gastroenterologist ahead of time. This can be especially difficult because most adult gastroenterologists feel uncomfortable about addressing adolescent developmental and mental health issues.36
Local chapters of societies such as the Crohn’s and Colitis Foundation, the American Liver Foundation, and statewide GI societies affiliated with the American College of Gastroenterology, as well as local or regional teaching institutions, are all good resources to identify adult providers interested in a coordinated transition of young adults into their practices. Depending on the availability of a local adult gastroenterologist, one approach to minimize the “growing pains” of transition can be to establish joint clinic visits with pediatric and adult providers; this strategy can help foster trust in the new physician and is generally well-received by patients.37,38 Other institutions may offer alternating visits with adult and pediatric providers during the first year of transition.
Regardless of the manner of the actual transfer of care, it is imperative the adult gastroenterologist be well versed with the natural history and disease complications of the pediatric onset of the specific GI disorder and also appreciate nutrition and concerns regarding growth and radiation. Moreover, they must recognize the convergence and divergence of traditional pediatric and adult care models, as well as the move from a family-centered to an individual-focused environment.39
At the time of the patient’s initial visit, the adult gastroenterologist needs a detailed history of the patient’s disease, a list of past and present medications, the details of any disease- or treatment-related complications or surgeries, and so on. The transfer of relevant medical records is an often overlooked, yet easily remediable, aspect of transfer of care.36 The overall process is best completed by eliciting posttransfer feedback from patients and families after they have established care with the adult provider.
Developing a transition model
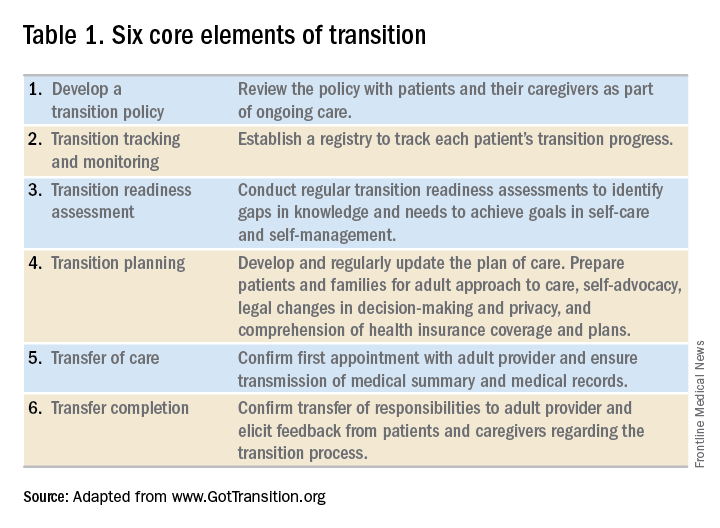
In the absence of standard, disease-specific models of transition, most institutions adapt available resources to develop their own protocols. In 2011, a joint task force of the American Academy of Pediatrics, the American Academy of Family Physicians, and the American College of Physicians published a clinical report on transition. Based on recommendations put forth by the Center for Health Care Transition Improvement – a joint endeavor of the Maternal and Child Health Bureau and the National Alliance to Advance Adolescent Health – the aforementioned task force developed a “Got Transition” model that incorporates six core elements of health care transition (Table 1).
Within the realm of chronic GI disorders, IBD has the most reported data on various models of transition. These include joint adult and pediatric visits, coordinator-initiated transitions, and patient preparation using the assessment tools detailed above. There are no data comparing the efficacy and success of these models and, in the absence of a universally established model for transition in IBD, each institution needs to adopt an approach that best suits the needs of patients and utilizes available resources.
As is the case for patients with IBD, patients with celiac disease need to assume exclusive responsibility for their care as young adults. An important aspect of transition planning for patients with celiac disease is the need to incorporate dietician-led didactic sessions during the transition process. Since patients with celiac disease do not require medications to manage their disease, they are often lost to follow-up as young adults.40 In addition to dietary compliance, it is important to educate young adults about the long-term complications related to celiac disease and the need for regular clinical assessment and monitoring.
Transition of care for patients with EoE is relatively understudied. As EoE was first described only in the 1990s, the diagnosis is still relatively new, and transition programs are limited.41 The natural history and progression of EoE had led to disparate management strategies in adults and children. While the latter are managed with dietary modifications and steroids, adults with EoE often require frequent esophageal dilations because of the increased incidence of fibrosis. In a study of pediatric patients with EoE, most scored lower on transition readiness assessments than did patients with other chronic health conditions.42 Since a majority of patients with EoE require lifelong treatment, they need to be better prepared for transition to adult care.43
In summary, regardless of disease state, transition of care requires planning on the part of the pediatric provider and also close collaboration with patient coordinators, nurses, social workers, and adult providers. While transition is often a complex and lengthy process, it fosters self-reliance and independence among patients while improving their quality of life. Effective communication between pediatric and adult providers as well as patients and families is key to successful transition of care.
Dr. Kaur is the medical director at the Inflammatory Bowel Disease Center and an assistant professor in the section of gastroenterology and hepatology in the department of medicine at Baylor College of Medicine, Houston; Dr. Wyatt is an assistant professor in the section of gastroenterology, hepatology, and nutrition in the department of pediatrics at Baylor.
References
1. Blum RW et al. J Adolesc Health. 1993 Nov;14(7):570-6.
2. Greenley RN et al. J Pediatr Psychol. 2010 Sep;35(8):857-69.
3. Simsek S et al. J Pediatr Gastroenterol Nutr. 2015 Sep;61(3):303-6.
4. Kanof ME et al. Gastroenterology. 1988 Dec;95(6):1523-7.
5. Mackner LM et al. Inflamm Bowel Dis. 2006 Mar;12(3):239-44.
6. Hummel TZ et al. J Pediatr Gastroenterol Nutr. 2013 Aug;57(2):219-24.
7. Rosen DS et al. J Adolesc Health. 2003 Oct;33(4):309-11.
8. Bollegala N et al. J Crohns Colitis. 2013 Mar;7(2):e55-60.
9. Reed-Knight B et al. J Pediatr Psychol. 2011 Apr;36(3):308-17.
10. Holmes-Walker DJ et al. Diabet Med. 2007 Jul;24(7):764-9.
11. Dabadie A et al. Gastroenterol Clin Biol. 2008 May;32(5 Pt 1):451-9.
12. A consensus statement on health care transitions for young adults with special health care needs. Pediatrics. 2002 Dec;110(6 Pt 2):1304-6.
13. Baldassano R et al. J Pediatr Gastroenterol Nutr. 2002 Mar;34(3):245-8.
14. Hait E et al. Inflamm Bowel Dis. 2006 Jan;12(1):70-3.
15. Gray WN et al. Inflamm Bowel Dis. 2015 May;21(5):1125-31.
16. Whitfield EP et al. J Pediatr Gastroenterol Nutr. 2015 Jan;60(1):36-41.
17. Rosen D et al. Inflamm Bowel Dis. 2016 Mar;22(3):702-8.
18. Fishman LN et al. J Pediatr Gastroenterol Nutr. 2014 Aug;59(2):221-4.
19. Huang JS et al. Clin Gastroenterol Hepatol. 2012 Jun;10(6):626-32.
20. Habibi H et al. Clin Nurse Spec. 2017 Nov;31(6):329-34.
21. Yerushalmy-Feler A et al. Eur J Gastroenterol Hepatol. 2017 Jul;29(7):831-7.
22. Shanske S et al. Soc Work Health Care. 2012;51(4):279-95.
23. Fredericks EM et al. J Clin Psychol Med Settings. 2015 Sep;22(2-3):150-9.
24. Hardin AP et al. Pediatrics. 2017. doi: 10.1542/peds.2017-2151.
25. Leung Y et al. Inflamm Bowel Dis. 2011 Oct;17(10):2169-73.
26. Wood DL et al. Acad Pediatr. 2014 Jul-Aug;14(4):415-22.
27. Sample Transition Readiness Assessment for Youth. Got Transition/Center for Health Care Transition Improvement, Jan 2014. Accessed Jan 4, 2017, at http://www.gottransition.org/resourceGet.cfm?id=224.
28. Sawicki GS et al. J Pediatr Psychol. 2011 Mar;36(2):160-71.
29. Izaguirre MR et al. J Pediatr Gastroenterol Nutr. 2017 Nov;65(5):546-50.
30. Carlsen K et al. Inflamm Bowel Dis. 2017 Mar;23(3):341-6.
31. Ferris ME et al. Ren Fail. 2012;34(6):744-53.
32. Schwartz LA et al. Child Care Health Dev. 2011 Nov;37(6):883-95.
33. Zijlstra M et al. J Crohns Colitis. 2013 Oct;7(9):e375-85.
34. Benchimol EI et al. Inflamm Bowel Dis. 2011 May;17(5):1131-7.
35. Heath Care Provider Transitioning Checklist. NASPGHAN. Accessed Jan 4, 2018, at https://www.naspghan.org/files/documents/pdfs/medical-resources/ibd/Checklist_PatientandHealthcareProdiver_TransitionfromPedtoAdult.pdf.
36. Hait EJ et al. J Pediatr Gastroenterol Nutr. 2009 Jan;48(1):61-5.
37. Escher JC. Dig Dis. 2009;27(3):382-6.
38. Crowley R et al. Arch Dis Child. 2011 Jun;96(6):548-53.
39. Trivedi I et al. Gastroenterol Res Pract. 2015;2015:260807.
40. O’Leary C et al. Am J Gastroenterol. 2004 Dec;99(12):2437-41.
41. de Silva PSA et al. Pediatr Clin North Am. 2017 Jun;64(3):707-20.
42. Eluri S et al. J Pediatr Gastroenterol Nutr. 2017 Jul;65(1):53-7.
43. Dellon ES et al. Dis Esophagus. 2013 Jan;26(1):7-13.
As pediatric patients with chronic gastrointestinal (GI) disorders mature into adulthood, they require a seamless transition of care into an adult practice. Health care transition is more than a simple transfer of care to an adult provider; it is a purposeful, planned movement of young adults with chronic medical conditions from a child-centered health care system to adult-oriented one.1 Many adolescents with chronic GI disorders are at increased risk of developmental and psychosocial delays and depressive disorders.2-6 A successful transition program can mitigate some of the psychosocial impacts of chronic disorders by improving self-efficacy and autonomy.7
Timing of transition
Unlike other nations where legislation often mandates the age of transition to adult care, the United States leaves decisions about the appropriate time to transition to the discretion of individual patients and pediatricians. While the actual transfer of care may not happen until later, it is prudent to start planning when the patient is in early adolescence. The pediatric gastroenterologist should initiate the discussion with patients and caregivers when the child is 13-15 years of age.12,13 Since health care transition is a complex and lengthy process, it should be approached within a framework that is appropriate for the developmental stage of the patient and at a time when their disease is in remission.14
During the initial discussions, the idea of transition should be introduced to the patient and his or her family by emphasizing the benefits of improved self-management skills, adherence to therapy, and normalization of development. The pediatrician should encourage a greater sense of independence and self-reliance by seeing the patient alone for at least a portion of the clinic visit and encourage future independent visits.
Developing a transition plan
Once the concept of transition of care has been introduced, it is prudent to devise a transition plan tailored to the specific needs and goals of the patient and family.24 Each plan should include who the adult provider will be, the tasks the adolescent must master before entering adult care, and how the care will be financed (because insurance coverage and options may change).25 A well-planned transition should enhance self-efficacy and self-management skills, increase knowledge of medical states, ensure adherence to therapy, and encourage independent decision making.12
Assessing transition readiness
Once the process of transitioning has been initiated, it is helpful to assess transition readiness at regular intervals. This will identify gaps in knowledge and inform appropriate interventions for individual patients. There are several questionnaires that can be administered at regular intervals and be made an integral part of routine clinic visits for adolescent patients. These assessments are now billable under CPT Code 99420 (administration and interpretation of health risk assessment). A standardized instrument should be used and the results recorded in the clinical encounter to ensure billing compliance.
The Transition Readiness Assessment Questionnaire (available online at www.GotTransition.org) is a validated tool that assesses an individual’s awareness of his or her medical needs, treatment plan, and ability to communicate effectively with his or her health care provider.26-28 While not specific to GI disorders, it has been validated in IBD patients and shown to correlate well with the IBD Self-Efficacy Scale for Adolescents.29,30 The University of North Carolina’s TRxANSITION Index, as well as the Social-Ecological Model of Adolescent and Young Adult Readiness for Transition, can be used for patients with various chronic diseases.31,32 Instruments specifically developed to assess transition readiness among patients with IBD include the “IBD-Yourself” questionnaire and MyHealth Passport for IBD.33,34 Additionally, Hait et al. provide a checklist of age-appropriate tasks for patients and their providers.14 The North American Society for Pediatric Gastroenterology, Hepatology and Nutrition has created the “Healthcare Provider Transition Checklist,” which is applicable to all chronic GI disorders.35
Transfer of care
The actual transfer of care is the culmination of the transition process. While the onus of initiating and monitoring a patient’s progress is driven by his or her pediatric provider, a responsive adult provider is integral, so it is vital to identify an adult gastroenterologist ahead of time. This can be especially difficult because most adult gastroenterologists feel uncomfortable about addressing adolescent developmental and mental health issues.36
Local chapters of societies such as the Crohn’s and Colitis Foundation, the American Liver Foundation, and statewide GI societies affiliated with the American College of Gastroenterology, as well as local or regional teaching institutions, are all good resources to identify adult providers interested in a coordinated transition of young adults into their practices. Depending on the availability of a local adult gastroenterologist, one approach to minimize the “growing pains” of transition can be to establish joint clinic visits with pediatric and adult providers; this strategy can help foster trust in the new physician and is generally well-received by patients.37,38 Other institutions may offer alternating visits with adult and pediatric providers during the first year of transition.
Regardless of the manner of the actual transfer of care, it is imperative the adult gastroenterologist be well versed with the natural history and disease complications of the pediatric onset of the specific GI disorder and also appreciate nutrition and concerns regarding growth and radiation. Moreover, they must recognize the convergence and divergence of traditional pediatric and adult care models, as well as the move from a family-centered to an individual-focused environment.39
At the time of the patient’s initial visit, the adult gastroenterologist needs a detailed history of the patient’s disease, a list of past and present medications, the details of any disease- or treatment-related complications or surgeries, and so on. The transfer of relevant medical records is an often overlooked, yet easily remediable, aspect of transfer of care.36 The overall process is best completed by eliciting posttransfer feedback from patients and families after they have established care with the adult provider.
Developing a transition model
In the absence of standard, disease-specific models of transition, most institutions adapt available resources to develop their own protocols. In 2011, a joint task force of the American Academy of Pediatrics, the American Academy of Family Physicians, and the American College of Physicians published a clinical report on transition. Based on recommendations put forth by the Center for Health Care Transition Improvement – a joint endeavor of the Maternal and Child Health Bureau and the National Alliance to Advance Adolescent Health – the aforementioned task force developed a “Got Transition” model that incorporates six core elements of health care transition (Table 1).
Within the realm of chronic GI disorders, IBD has the most reported data on various models of transition. These include joint adult and pediatric visits, coordinator-initiated transitions, and patient preparation using the assessment tools detailed above. There are no data comparing the efficacy and success of these models and, in the absence of a universally established model for transition in IBD, each institution needs to adopt an approach that best suits the needs of patients and utilizes available resources.
As is the case for patients with IBD, patients with celiac disease need to assume exclusive responsibility for their care as young adults. An important aspect of transition planning for patients with celiac disease is the need to incorporate dietician-led didactic sessions during the transition process. Since patients with celiac disease do not require medications to manage their disease, they are often lost to follow-up as young adults.40 In addition to dietary compliance, it is important to educate young adults about the long-term complications related to celiac disease and the need for regular clinical assessment and monitoring.
Transition of care for patients with EoE is relatively understudied. As EoE was first described only in the 1990s, the diagnosis is still relatively new, and transition programs are limited.41 The natural history and progression of EoE had led to disparate management strategies in adults and children. While the latter are managed with dietary modifications and steroids, adults with EoE often require frequent esophageal dilations because of the increased incidence of fibrosis. In a study of pediatric patients with EoE, most scored lower on transition readiness assessments than did patients with other chronic health conditions.42 Since a majority of patients with EoE require lifelong treatment, they need to be better prepared for transition to adult care.43
In summary, regardless of disease state, transition of care requires planning on the part of the pediatric provider and also close collaboration with patient coordinators, nurses, social workers, and adult providers. While transition is often a complex and lengthy process, it fosters self-reliance and independence among patients while improving their quality of life. Effective communication between pediatric and adult providers as well as patients and families is key to successful transition of care.
Dr. Kaur is the medical director at the Inflammatory Bowel Disease Center and an assistant professor in the section of gastroenterology and hepatology in the department of medicine at Baylor College of Medicine, Houston; Dr. Wyatt is an assistant professor in the section of gastroenterology, hepatology, and nutrition in the department of pediatrics at Baylor.
References
1. Blum RW et al. J Adolesc Health. 1993 Nov;14(7):570-6.
2. Greenley RN et al. J Pediatr Psychol. 2010 Sep;35(8):857-69.
3. Simsek S et al. J Pediatr Gastroenterol Nutr. 2015 Sep;61(3):303-6.
4. Kanof ME et al. Gastroenterology. 1988 Dec;95(6):1523-7.
5. Mackner LM et al. Inflamm Bowel Dis. 2006 Mar;12(3):239-44.
6. Hummel TZ et al. J Pediatr Gastroenterol Nutr. 2013 Aug;57(2):219-24.
7. Rosen DS et al. J Adolesc Health. 2003 Oct;33(4):309-11.
8. Bollegala N et al. J Crohns Colitis. 2013 Mar;7(2):e55-60.
9. Reed-Knight B et al. J Pediatr Psychol. 2011 Apr;36(3):308-17.
10. Holmes-Walker DJ et al. Diabet Med. 2007 Jul;24(7):764-9.
11. Dabadie A et al. Gastroenterol Clin Biol. 2008 May;32(5 Pt 1):451-9.
12. A consensus statement on health care transitions for young adults with special health care needs. Pediatrics. 2002 Dec;110(6 Pt 2):1304-6.
13. Baldassano R et al. J Pediatr Gastroenterol Nutr. 2002 Mar;34(3):245-8.
14. Hait E et al. Inflamm Bowel Dis. 2006 Jan;12(1):70-3.
15. Gray WN et al. Inflamm Bowel Dis. 2015 May;21(5):1125-31.
16. Whitfield EP et al. J Pediatr Gastroenterol Nutr. 2015 Jan;60(1):36-41.
17. Rosen D et al. Inflamm Bowel Dis. 2016 Mar;22(3):702-8.
18. Fishman LN et al. J Pediatr Gastroenterol Nutr. 2014 Aug;59(2):221-4.
19. Huang JS et al. Clin Gastroenterol Hepatol. 2012 Jun;10(6):626-32.
20. Habibi H et al. Clin Nurse Spec. 2017 Nov;31(6):329-34.
21. Yerushalmy-Feler A et al. Eur J Gastroenterol Hepatol. 2017 Jul;29(7):831-7.
22. Shanske S et al. Soc Work Health Care. 2012;51(4):279-95.
23. Fredericks EM et al. J Clin Psychol Med Settings. 2015 Sep;22(2-3):150-9.
24. Hardin AP et al. Pediatrics. 2017. doi: 10.1542/peds.2017-2151.
25. Leung Y et al. Inflamm Bowel Dis. 2011 Oct;17(10):2169-73.
26. Wood DL et al. Acad Pediatr. 2014 Jul-Aug;14(4):415-22.
27. Sample Transition Readiness Assessment for Youth. Got Transition/Center for Health Care Transition Improvement, Jan 2014. Accessed Jan 4, 2017, at http://www.gottransition.org/resourceGet.cfm?id=224.
28. Sawicki GS et al. J Pediatr Psychol. 2011 Mar;36(2):160-71.
29. Izaguirre MR et al. J Pediatr Gastroenterol Nutr. 2017 Nov;65(5):546-50.
30. Carlsen K et al. Inflamm Bowel Dis. 2017 Mar;23(3):341-6.
31. Ferris ME et al. Ren Fail. 2012;34(6):744-53.
32. Schwartz LA et al. Child Care Health Dev. 2011 Nov;37(6):883-95.
33. Zijlstra M et al. J Crohns Colitis. 2013 Oct;7(9):e375-85.
34. Benchimol EI et al. Inflamm Bowel Dis. 2011 May;17(5):1131-7.
35. Heath Care Provider Transitioning Checklist. NASPGHAN. Accessed Jan 4, 2018, at https://www.naspghan.org/files/documents/pdfs/medical-resources/ibd/Checklist_PatientandHealthcareProdiver_TransitionfromPedtoAdult.pdf.
36. Hait EJ et al. J Pediatr Gastroenterol Nutr. 2009 Jan;48(1):61-5.
37. Escher JC. Dig Dis. 2009;27(3):382-6.
38. Crowley R et al. Arch Dis Child. 2011 Jun;96(6):548-53.
39. Trivedi I et al. Gastroenterol Res Pract. 2015;2015:260807.
40. O’Leary C et al. Am J Gastroenterol. 2004 Dec;99(12):2437-41.
41. de Silva PSA et al. Pediatr Clin North Am. 2017 Jun;64(3):707-20.
42. Eluri S et al. J Pediatr Gastroenterol Nutr. 2017 Jul;65(1):53-7.
43. Dellon ES et al. Dis Esophagus. 2013 Jan;26(1):7-13.
Choosing a career in health care administration
Dr. Shah is chief medical officer, Mount Sinai Queens, director of quality and patient safety education, Mount Sinai Health System, associate professor of medicine/GI and geriatrics/palliative medicine, Icahn School of Medicine at Mount Sinai, New York, N.Y.
How did your career pathway lead you into hospital administration?
My career pathway into hospital administration was not by design. Since college, I have always enjoyed building and managing programs. As chief resident, I was exposed to operational and managerial aspects of running an internal medicine residency program as well as an outpatient clinic. This program first exposed me to quality improvement and patient-safety functions within a hospital. I continued to build on this during my GI fellowship and in my first few years as faculty in our division. Patient safety and quality improvement involve the critical thinking and quantitative aspects of research applied to problems in the workplace. This interest and skill, along with my growing experience in management, led me to explore opportunities in hospital administration.
What are your responsibilities in a typical week?
As a chief medical officer at a smaller hospital, my scope of responsibilities includes overseeing health care quality and patient safety, building our outpatient practice and new clinical service lines, building a cohesive medical staff, handling disciplinary and professionalism issues, and overseeing six support departments. I work closely with our chief operating officer, chief nursing officer, executive director, and site chiefs.
What do you enjoy most about working in hospital administration?
I enjoy the work I do related to making care safer for our patients and for those who work in our hospital. I take each patient-safety event personally. The teamwork necessary to understand these events and develop creative solutions is extremely rewarding. I enjoy mentoring our faculty and hospital managers to achieve their own goals. Lastly, I have enjoyed working with professionals with backgrounds that differ from my own. I have learned an incredible amount about hospital operations, leadership, financing, as well as legal and labor-relations issues from our staff in other departments.
What do you find most challenging about working in hospital administration?
The scope of work in my role at my current hospital is very broad. It can be a challenge to focus on long-term goals given the number of “fires” that creep up during the week. I always try to keep patients and staff at the center of my decision making. However, a hospital is a complex organism and decisions also have a financial and operational impact. One challenge is to know and understand this impact and then work with other leaders to develop a solution that works for all.
The other challenge is managing conflict in a way that leads to creative solutions satisfying the needs of multiple stakeholders. We are constantly challenged by limited resources (including time). These challenges are inherent to any leadership position. I am fortunate to work within a leadership team that is collaborative; they are an invaluable resource when these issues arise.
What are the different hospital administration positions that are available to GIs?
More than ever, the options for administrative work in health care have expanded. There are hospital-based roles within a department (e.g., director of endoscopy, clinical chief, director of quality improvement/patient safety for GI) and larger roles in the hospital-at-large (e.g., chief operating officer, chief medical officer, chief quality officer). These roles require certain technical skills and knowledge as well as experience within patient care. Other opportunities include the medical board, credentials committee, or serving as a member of a hospital committee (e.g., pharmacy, perioperative, infection control, process improvement). Since hospitals and health systems have expanded into the outpatient setting, additional positions include medical director for a practice, director of population health, or a leadership role in clinical operations.
Physicians from many different specialties have entered these roles based on their local hospital needs. In addition to clinical experience, leadership and interpersonal skills are critical for success.
How would a fellow or early-career GI who is interested in hospital medicine pursue this career pathway?
My first suggestion is to get involved in local efforts based on your interest. For example, if you are interested in quality improvement, seek to be a member of your department or hospital quality improvement committee. In GI and hepatology, natural places to get involved are around the development of care pathways, readmission committees, and initiatives to increase screening and treatment of hepatitis C or colon cancer. If you are interested in operations, look to see if there is an endoscopy or clinic operations committee you can get involved in. Get to know your medical board and medical staff structure. I gained exposure to this world by observing some of these meetings and then being asked to join them. These are valuable groups that help to create policy, raise important issues, and work with administration in the management of the hospital.
I am also a big fan of informational interviewing. If there are leaders who do the type of work you are interested in, consider reaching out with a call or email and asking to meet with them to talk about their role and career path.
As a fellow, there is an Accreditation Council for Graduate Medical Education requirement to incorporate residents and fellows onto hospital committees. This requirement has been a great way to have fellows incorporated into hospital work. You will find that those in hospital administration are eager to have interested and collegial partners in the work that is being done.
Are there any advanced training options available for those interested in hospital administration?
Depending on the position, there are numerous certificate and master’s programs that can provide formal education. CEOs and COOs may seek an MBA or master’s in Health Care Administration. There are programs that focus on Health Care Leadership or Quality and Patient Safety that are applicable to many leadership positions. These are offered in in-person and online formats. However, many physicians in these positions have a combination of informal and experiential learning programs that developed their skill set.
Some hospital systems offer an internal physician leadership training program to develop early and midcareer physician executives. There are professional organizations that offer courses for leadership development (e.g., American College of Physician Executives). Some business schools offer shorter-format programs that are geared toward health care leaders and focus on finance, operations, or quality.
I received some of my training through the Clinical Quality Fellowship Program, which is a 14-month experiential learning program in quality and patient safety that is run locally in New York City. In addition, I had some leadership training through the Association of American Medical Colleges and through the AGA Future Leaders Program (http://www.gastro.org/about/initiatives/aga-future-leaders-program).
Hospitals, outpatient practices, and health systems offer career paths including patient safety, quality improvement, or hospital management. I have enjoyed stretching my existing skill set in these roles while learning about how health facilities work, gaining knowledge of health care financing, and making care safer while ensuring high quality. These roles require teamwork across professions and specialties. As a gastroenterologist or hepatologist, we bring our own clinical and professional experience, which can be invaluable to the overall health care management team.
Gastroenterology debuts editorial fellowship program
The readership of Gastroenterology includes a broad distribution of stakeholders in digestive health, including those with vested interests in clinical practice, education, policy, clinical investigation, and basic research. One of our most critical constituencies, however, is trainees and early-career GIs. In an effort to support such individuals, our editorial team has developed a freshly minted 1-year editorial fellowship for Gastroenterology. The overarching purpose of this fellowship is to mentor an outstanding trainee for future editorial leadership roles in scientific publishing, as a means to promote the interests of trainee and early-career GI constituencies within the AGA and Gastroenterology. This fellowship is available to exceptional second- or third-year fellows through an application process. The intent of this training is to allow the selected applicant to become intimately involved with Gastroenterology’s entire editorial process, including peer review, editorial oversight, manuscript selection for publication, production, and postpublication activities. Our first fellow, Eric Shah, MD, MBA, was selected from a highly competitive pool of exceptional applicants, and began his fellowship on July 1, 2017.


This year, we have been delighted to work with Dr. Shah as our inaugural Gastroenterology fellow. Dr. Shah has a unique background, having pursued a joint MD and MBA (earning both concurrently), while also following venture-oriented interests in developing GI technology from academia. Dr. Shah began his research career under the mentorship of Mark Pimentel, MD, and Gil Melmed, MD, at Cedars-Sinai as part of a Research Honors Program. Since that time, he has focused on evaluating the comparative efficacy, durability, and harm associated with pharmacotherapy in functional bowel disorders. Dr. Shah was accepted into the GI fellowship training program at the University of Michigan and received a slot on the T32 training grant to study cost-effectiveness and qualitative research techniques to address gaps in the care of functional bowel disorders. His work under the mentorship of William Chey, MD, Ryan Stidham, MD, and Philip S. Schoenfeld, MD, has flourished and culminated in an oral presentation and several posters for DDW 2017, as well as several first-author manuscripts that have been submitted. Dr. Shah has fully embraced the Gastroenterology fellowship and has far surpassed our high expectations for this position.
The video associated with this article is no longer available on this site. Please view all of our videos on the MDedge YouTube channel
VIDEO SOURCE: AMERICAN GASTROENTEROLOGICAL ASSOCIATION
In addition to creating an editorial fellowship, our team has also developed other components within the journal that specifically target trainees and early-career GIs. The Mentoring, Education and Training section – initiated in 2011 through the vision and insight of Bishr Omary MD, PhD, and John Del Valle, MD, at the University of Michigan – has been extremely effective in highlighting critical issues relevant to trainees, young faculty, and early-career GIs. Topics have included mentoring advice not only for individuals in academic or private practice careers but also industry careers and midlevel providers. Other topics have included Accreditation Council for Graduate Medical Education milestones, career advancement for clinician-educators, sex and ethnic diversity, and maintenance of certification, as well as guidance regarding nontraditional funding mechanisms such as philanthropy. Potential future topics will include information about major new public and private funding initiatives, comments and input from National Institutes of Health officials, and reports of funding trends relevant to both physician scientists and clinicians. We are fortunate to have Prateek Sharma, MD, lead this section, and his depth of experience as an exceptional mentor has provided the requisite expertise.
Additionally, we offer a reduction in page charges to junior investigators (within 7 years of fellowship) who are the corresponding authors of exceedingly important original Gastroenterology manuscripts. These manuscripts from junior investigators will be highlighted in both print and online versions of Gastroenterology. We are using the journal to expand electronic access to educational offerings for new technologies, training, self-assessment, and practice improvement to establish the AGA as the ultimate resource for junior academicians and practicing physicians. We are also currently integrating Gastroenterology more closely into other AGA educational efforts that target young physicians, such as the AGA Education and Training Committee.
At Gastroenterology, we are acutely aware of the needs and obstacles facing trainees, young faculty, and early-career GIs. We have boldly adopted a multidimensional approach to provide guidance and opportunities to overcome these challenges, including the creation of the nascent Editorial Fellowship. We welcome applications for the next fellowship, which will be announced by the AGA in the spring of 2018!
Dr. Peek is the Mina Wallace Professor of Medicine, Cancer Biology, and Pathology, Microbiology, and Immunology, and director, division of gastroenterology, hepatology and nutrition, Vanderbilt University Medical Center, Nashville, Tenn. He has no conflicts of interest.
The readership of Gastroenterology includes a broad distribution of stakeholders in digestive health, including those with vested interests in clinical practice, education, policy, clinical investigation, and basic research. One of our most critical constituencies, however, is trainees and early-career GIs. In an effort to support such individuals, our editorial team has developed a freshly minted 1-year editorial fellowship for Gastroenterology. The overarching purpose of this fellowship is to mentor an outstanding trainee for future editorial leadership roles in scientific publishing, as a means to promote the interests of trainee and early-career GI constituencies within the AGA and Gastroenterology. This fellowship is available to exceptional second- or third-year fellows through an application process. The intent of this training is to allow the selected applicant to become intimately involved with Gastroenterology’s entire editorial process, including peer review, editorial oversight, manuscript selection for publication, production, and postpublication activities. Our first fellow, Eric Shah, MD, MBA, was selected from a highly competitive pool of exceptional applicants, and began his fellowship on July 1, 2017.
This year, we have been delighted to work with Dr. Shah as our inaugural Gastroenterology fellow. Dr. Shah has a unique background, having pursued a joint MD and MBA (earning both concurrently), while also following venture-oriented interests in developing GI technology from academia. Dr. Shah began his research career under the mentorship of Mark Pimentel, MD, and Gil Melmed, MD, at Cedars-Sinai as part of a Research Honors Program. Since that time, he has focused on evaluating the comparative efficacy, durability, and harm associated with pharmacotherapy in functional bowel disorders. Dr. Shah was accepted into the GI fellowship training program at the University of Michigan and received a slot on the T32 training grant to study cost-effectiveness and qualitative research techniques to address gaps in the care of functional bowel disorders. His work under the mentorship of William Chey, MD, Ryan Stidham, MD, and Philip S. Schoenfeld, MD, has flourished and culminated in an oral presentation and several posters for DDW 2017, as well as several first-author manuscripts that have been submitted. Dr. Shah has fully embraced the Gastroenterology fellowship and has far surpassed our high expectations for this position.
The video associated with this article is no longer available on this site. Please view all of our videos on the MDedge YouTube channel
VIDEO SOURCE: AMERICAN GASTROENTEROLOGICAL ASSOCIATION
In addition to creating an editorial fellowship, our team has also developed other components within the journal that specifically target trainees and early-career GIs. The Mentoring, Education and Training section – initiated in 2011 through the vision and insight of Bishr Omary MD, PhD, and John Del Valle, MD, at the University of Michigan – has been extremely effective in highlighting critical issues relevant to trainees, young faculty, and early-career GIs. Topics have included mentoring advice not only for individuals in academic or private practice careers but also industry careers and midlevel providers. Other topics have included Accreditation Council for Graduate Medical Education milestones, career advancement for clinician-educators, sex and ethnic diversity, and maintenance of certification, as well as guidance regarding nontraditional funding mechanisms such as philanthropy. Potential future topics will include information about major new public and private funding initiatives, comments and input from National Institutes of Health officials, and reports of funding trends relevant to both physician scientists and clinicians. We are fortunate to have Prateek Sharma, MD, lead this section, and his depth of experience as an exceptional mentor has provided the requisite expertise.
Additionally, we offer a reduction in page charges to junior investigators (within 7 years of fellowship) who are the corresponding authors of exceedingly important original Gastroenterology manuscripts. These manuscripts from junior investigators will be highlighted in both print and online versions of Gastroenterology. We are using the journal to expand electronic access to educational offerings for new technologies, training, self-assessment, and practice improvement to establish the AGA as the ultimate resource for junior academicians and practicing physicians. We are also currently integrating Gastroenterology more closely into other AGA educational efforts that target young physicians, such as the AGA Education and Training Committee.
At Gastroenterology, we are acutely aware of the needs and obstacles facing trainees, young faculty, and early-career GIs. We have boldly adopted a multidimensional approach to provide guidance and opportunities to overcome these challenges, including the creation of the nascent Editorial Fellowship. We welcome applications for the next fellowship, which will be announced by the AGA in the spring of 2018!
Dr. Peek is the Mina Wallace Professor of Medicine, Cancer Biology, and Pathology, Microbiology, and Immunology, and director, division of gastroenterology, hepatology and nutrition, Vanderbilt University Medical Center, Nashville, Tenn. He has no conflicts of interest.
Adacel Tdap effective throughout third trimester vaccination window
, according to a prospective cohort study published in Obstetrics and Gynecology.
Timing does make a difference with the other Tdap option in pregnancy, Boostrix; pertussis protection is stronger if women receive it early in the third trimester. The investigators wanted to see if that were true as well with Adacel.
They compared pertussis antibody concentrations in maternal venous serum and umbilical cord arterial serum at the time of delivery in 52 women vaccinated from 27 to 30 6/7 weeks of gestation, and compared the results with 36 women vaccinated from 31 to 35 6/7 weeks.
Pertussis antibody concentrations did not vary by gestational age. Maternal serum pertussis toxin IgG concentrations were the same in both groups (48.6 enzyme-linked immunoassay [ELISA] units/mL), and there were no statistically significant differences in cord serum pertussis toxin IgG concentrations (92.1 ELISA units/mL in the early group, compared with 90.7 in the later group; P = .95) or cord serum pertactin IgG concentrations (798 international units/mL in the early group, versus 730 in the later group; P = .73).
Overall, cord serum pertussis toxin IgG concentrations were approximately twice maternal serum pertussis toxin IgG concentrations (91.6 vs. 48.6 ELISA units/mL; P less than .01). Cord serum pertussis toxin IgG concentrations were in the protective range (greater than 10 ELISA units/mL) in 87% of the women vaccinated from 27 to 30 6/7 weeks, and in 97% vaccinated from 31 to 35 6/7 weeks (P = .13).
Maternal vaccination in the third trimester against pertussis “was associated with a high percentage of newborns with antibody concentrations conferring protection,” said investigators led by Cynthia Abraham, MD, an ob.gyn. at Mount Sinai Hospital, New York. “We found no significant difference across the period of 27-36 weeks of gestation with respect to immunogenicity with Adacel use.”
Maternal Tdap vaccination is done to protect infants in their first 2 months of life, before they start their DTaP series. The Centers for Disease Control and Prevention recommends vaccination between 27 and 36 weeks of gestation.
It’s unclear why it doesn’t matter when within that window women receive Adacel, but protection with Boostrix if Boostrix is administered early on in the trimester.
Boostrix differs from Adacel in antigen composition and in the method of pertussis toxin detoxification. Boostrix is detoxified with formaldehyde and glutaraldehyde. Adacel is detoxified only with formaldehyde.
“Double detoxification may cause differences in immunogenicity as antigenic epitopes are further modified, perhaps providing an explanation for the difference in results between the vaccines,” the investigators said.
Women in the early group received Adacel at a mean gestational age of 29.1 weeks, versus 32.9 weeks in the later group. The women were a mean age of about 29 years; 56% were Hispanic, 23% white, and the rest were about equally split between black and Asian women.
No funding source was reported. The authors did not have any conflicts of interest.
SOURCE: Abraham C et al. Obstet Gynecol. 2018 Feb;131(2):364-9.
FROM OBSTETRICS AND GYNECOLOGY
Key clinical point: Unlike Boostrix, pertussis protection is the same whether pregnant women receive Adacel Tdap vaccine early in the third trimester or in the middle.
Major finding: There were no statistically significant differences in cord serum pertussis toxin IgG concentrations (92.1 ELISA units/mL in the early group, versus 90.7 in the later group, P = .95).
Study details: A prospective cohort study involving 88 women.
Disclosures: No study sponsor was reported. The authors had no disclosures.
Source: Abraham C et al. Obstet Gynecol. 2018 Feb;131(2):364-9.
Atrial fibrosis weighed as key arrhythmia, stroke trigger
ORLANDO – , particularly strokes, and has also become the target for ablative strategies by some operators for more effective rhythm control in patients with atrial fibrillation.
“A strong and graded association exists between the severity of left atrial fibrosis severity and major cardiovascular adverse events, primarily due to stroke, transient ischemic attack, and heart failure, Nassir F. Marrouche, MD, said at the annual International AF Symposium.

Atrial fibrosis is quantified noninvasively by Dr. Marrouche and his associates with late gadolinium enhancement MRI. They published results of a retrospective study in 2017 showing that, during follow-up of 1,228 patients from their center with atrial fibrillation, the 5% of patients who had the highest level of left atrial fibrosis – 30% or more of left atrial tissue – had a significantly increased rate of cardiovascular events during follow-up, compared with the 35% of studied patients with fibrosis constituting less than 10% of their left atrium. The remaining 60% of studied patients had fibrotic tissue that formed 10%-29% of their total left atrial area.
This relationship was strongest when the analysis focused exclusively on the incidence of strokes or transient ischemic attacks. These events occurred nearly fourfold more often among patients with the highest amount of fibrosis, compared with those with the least (J Amer Coll Cardiol. 2017 Sep;70[11]:311-21).
Given that the finding came from a retrospective, single-center study, the clinical implication of fibrosis remains too uncertain to apply to current routine practice. But Dr. Marrouche strongly suspects that fibrotic tissue in the left atrium serves as a potent trigger of thrombosis.
“We think that even patients with a CHA2DS2-VASc score of zero who have a high level of fibrosis may need treatment with an anticoagulant, but we need a prospective study” to validate this, Dr. Marrouche said.
Another area for further research is to explore agents that may be able to prevent or reverse fibrosis in the left atrium. One candidate class of drugs are the angiotensin-converting enzyme inhibitors, he said in an interview.
Atrial fibrosis can have a variety of causes, including hypertension, inflammation, genetics, frequent high-intensity exercise, or other histories that produce regular intervals of extreme atrial stretch, he noted.
Dr. Marrouche is leading a multicenter trial that will test the efficacy of an ablation method for patients with atrial fibrillation tailored to isolating heavily fibrotic regions of the atria. The Efficacy of Delayed Enhancement MRI-Guided Ablation vs. Conventional Catheter Ablation of Atrial Fibrillation (DECAAFII) trial is comparing ablation aimed at fibrotic regions against conventional ablation in about 900 patients. Results are expected in another 2-3 years.
Although the usefulness of ablation aimed at isolating areas of fibrosis in the atrium remains unproven, this approach has already been embraced by some operators, including Hans Kottkamp, MD, a professor and electrophysiologist at Hirslanden Hospital in Zurich.

“Fibrosis is the fundamental histologic finding and the key pathophysiologic player in atrial fibrillation,” Dr. Kottkamp said in a separate talk at the meeting. “We suggest doing ablation based on the substrate, and not based on whether the atrial fibrillation is paroxysmal or persistent.” His group uses voltage mapping instead of MRI as their tool for quantifying the amount of fibrosis and pinpointing its location.
“The fibrosis is usually regionalized; it’s not everywhere” in the left atrium, Dr. Kottkamp noted, and the location is very individualized. “You need to look for it in each patient.”
In his experience, about 20% of patients with paroxysmal AF have enough atrial fibrosis to warrant using BIFA along with pulmonary vein isolation. “Among patients with persistent AF, the percentage with significant fibrosis rises to about two-thirds,” Dr. Kottkamp said in an interview. Combining BIFA with pulmonary vein isolation in these patients with higher fibrosis substantially boosts procedural success.
In a recent report, Dr. Kottkamp and his associates presented their experience using BIFA on 92 patients with AF and fibrotic atrial cardiomyopathy. The outcomes showed a relatively high level of success in resolving the AF after an average follow-up of 16 months, with a 69% success rate after a single procedure and an 83% success rate when selected patients received a second BIFA.
Overall, each patient in the series received an average of 1.2 BIFA ablations (J Cardiovasc Electrophysiol. 2017 Sep;28[9]:971-83).
Currently, a limited number of other groups uses BIFA or a similar fibrosis-based ablation approach, and these strategies have not yet undergone prospective assessment in a multicenter study. Despite that, Dr. Kottkamp said he was “confident it will become standard of care.”
Dr. Marrouche has been a consultant to Abbott, Biosense Webster, Biotronik, Boston Scientific, Cardiac Design, Marreck, Medtronic, Preventice, VytronUS, and Wavelet Health, and he has received research support from Abbott, Biosense Webster, Biotronik, Boston Scientific, GE Sciences, and VytronUS. Dr. Kottkamp has been a consultant to Biosense Webster and has been a consultant to and has an equity interest in Kardium.
ORLANDO – , particularly strokes, and has also become the target for ablative strategies by some operators for more effective rhythm control in patients with atrial fibrillation.
“A strong and graded association exists between the severity of left atrial fibrosis severity and major cardiovascular adverse events, primarily due to stroke, transient ischemic attack, and heart failure, Nassir F. Marrouche, MD, said at the annual International AF Symposium.
Atrial fibrosis is quantified noninvasively by Dr. Marrouche and his associates with late gadolinium enhancement MRI. They published results of a retrospective study in 2017 showing that, during follow-up of 1,228 patients from their center with atrial fibrillation, the 5% of patients who had the highest level of left atrial fibrosis – 30% or more of left atrial tissue – had a significantly increased rate of cardiovascular events during follow-up, compared with the 35% of studied patients with fibrosis constituting less than 10% of their left atrium. The remaining 60% of studied patients had fibrotic tissue that formed 10%-29% of their total left atrial area.
This relationship was strongest when the analysis focused exclusively on the incidence of strokes or transient ischemic attacks. These events occurred nearly fourfold more often among patients with the highest amount of fibrosis, compared with those with the least (J Amer Coll Cardiol. 2017 Sep;70[11]:311-21).
Given that the finding came from a retrospective, single-center study, the clinical implication of fibrosis remains too uncertain to apply to current routine practice. But Dr. Marrouche strongly suspects that fibrotic tissue in the left atrium serves as a potent trigger of thrombosis.
“We think that even patients with a CHA2DS2-VASc score of zero who have a high level of fibrosis may need treatment with an anticoagulant, but we need a prospective study” to validate this, Dr. Marrouche said.
Another area for further research is to explore agents that may be able to prevent or reverse fibrosis in the left atrium. One candidate class of drugs are the angiotensin-converting enzyme inhibitors, he said in an interview.
Atrial fibrosis can have a variety of causes, including hypertension, inflammation, genetics, frequent high-intensity exercise, or other histories that produce regular intervals of extreme atrial stretch, he noted.
Dr. Marrouche is leading a multicenter trial that will test the efficacy of an ablation method for patients with atrial fibrillation tailored to isolating heavily fibrotic regions of the atria. The Efficacy of Delayed Enhancement MRI-Guided Ablation vs. Conventional Catheter Ablation of Atrial Fibrillation (DECAAFII) trial is comparing ablation aimed at fibrotic regions against conventional ablation in about 900 patients. Results are expected in another 2-3 years.
Although the usefulness of ablation aimed at isolating areas of fibrosis in the atrium remains unproven, this approach has already been embraced by some operators, including Hans Kottkamp, MD, a professor and electrophysiologist at Hirslanden Hospital in Zurich.
“Fibrosis is the fundamental histologic finding and the key pathophysiologic player in atrial fibrillation,” Dr. Kottkamp said in a separate talk at the meeting. “We suggest doing ablation based on the substrate, and not based on whether the atrial fibrillation is paroxysmal or persistent.” His group uses voltage mapping instead of MRI as their tool for quantifying the amount of fibrosis and pinpointing its location.
“The fibrosis is usually regionalized; it’s not everywhere” in the left atrium, Dr. Kottkamp noted, and the location is very individualized. “You need to look for it in each patient.”
In his experience, about 20% of patients with paroxysmal AF have enough atrial fibrosis to warrant using BIFA along with pulmonary vein isolation. “Among patients with persistent AF, the percentage with significant fibrosis rises to about two-thirds,” Dr. Kottkamp said in an interview. Combining BIFA with pulmonary vein isolation in these patients with higher fibrosis substantially boosts procedural success.
In a recent report, Dr. Kottkamp and his associates presented their experience using BIFA on 92 patients with AF and fibrotic atrial cardiomyopathy. The outcomes showed a relatively high level of success in resolving the AF after an average follow-up of 16 months, with a 69% success rate after a single procedure and an 83% success rate when selected patients received a second BIFA.
Overall, each patient in the series received an average of 1.2 BIFA ablations (J Cardiovasc Electrophysiol. 2017 Sep;28[9]:971-83).
Currently, a limited number of other groups uses BIFA or a similar fibrosis-based ablation approach, and these strategies have not yet undergone prospective assessment in a multicenter study. Despite that, Dr. Kottkamp said he was “confident it will become standard of care.”
Dr. Marrouche has been a consultant to Abbott, Biosense Webster, Biotronik, Boston Scientific, Cardiac Design, Marreck, Medtronic, Preventice, VytronUS, and Wavelet Health, and he has received research support from Abbott, Biosense Webster, Biotronik, Boston Scientific, GE Sciences, and VytronUS. Dr. Kottkamp has been a consultant to Biosense Webster and has been a consultant to and has an equity interest in Kardium.
EXPERT ANALYSIS FROM AF SYMPOSIUM 2018
Characterize duration when seeking etiology of tantrums in children
NEW YORK – Although explosive outbursts or tantrums accompany nearly every psychiatric illness that affects children, the specific features may help identify an etiology, according to Gabrielle A. Carlson, MD.
“There are two components of irritability,” explained Dr. Carlson, professor of psychiatry and pediatrics, Stony Brook (N.Y.) University Medical Center. “One is how often the child loses his or her temper, and the other is what they do when they lose their temper.”
To be useful in identifying the source, the characterization of explosive outbursts must be undertaken in the context of the patient’s history and the duration and types of tantrum-related behaviors, particularly aggressive behavior toward others, according to Dr. Carlson.
Presenting a diagnostic algorithm relevant to children with frequent explosive outbursts, Dr. Carlson suggested that pathways differ for young children and adolescents. Yet, the first step – which is evaluating whether or not irritability is a feature of the patient’s disposition when not in the midst of a tantrum – is common to both groups.
In young children with new onset of explosive outbursts, stressors in school, such as bullying, or family, such as abuse, represent an appropriate initial focus. In adolescents, initial attention should be paid to the potential role of mood disorders, particularly depression, mania, or anxiety, according to Dr. Carlson.
For most patients and most etiologies, tantrums follow a trigger and then resolve quickly. When tantrums do not resolve quickly in patients who remain generally irritable even when they are not having a tantrum, there is an increased likelihood of disruptive mood dysregulation disorder (DMDD).
Relative to tantrums associated with attention deficit hyperactive disorder (ADHD), oppositional defiant disorder (ODD), or affective disorders, explosive outbursts associated with DMDD are also more likely to include aggression toward others.
Physical restraint to safeguard the patient or others during a tantrum is uncommon in most conditions associated with tantrums, with the exception of DMDD. Greater aggression tracks with greater DMDD severity. According to data presented by Dr. Carlson, 92% of a clinical sample of DMDD patients exhibited physical aggression, compared with none of those in a community sample.
Tantrums lasting more than 30 minutes were observed in 60% of the clinic sample, versus only 12.5% of the community sample.
Explosive outbursts “are not an uncommon or trivial problem,” according to Dr. Carlson, who cited data suggesting that 70% of children between the ages of 5 and 12 years hospitalized for a psychiatric diseases are referred for an explosive outburst.
She believes that a systematic approach toward characterizing the tantrum will be helpful in understanding the underlying etiology and appropriate treatment. Using such tools as the Irritability and Rages Inventory or the Affective Reactivity Index Child Form, clinicians should seek to evaluate the frequency of tantrums, the duration, and the patient’s symptom burden between tantrums.
If explosive outbursts are rare, they are unlikely to be due to DMDD or affective disorders, such as bipolar disease. If frequent in a patient with chronic psychopathology, those who are generally “fine until frustrated” are the ones more likely to have ADHD or even oppositional defiant disorder (ODD).
The less common profile, which is rage that does not completely resolve, suggests DMDD, a condition that Dr. Carlson described with the mnemonic OI VEY to convey key features. The letters stand for Outbursts that are frequent, Irritable mood in the absence of an outburst, Very chronic (more than 1 per year), Explained by other co-existing conditions, such as mania, and Young (starts between ages 6 and 10 years).
Although tantrums are the way in which children with a broad array of psychiatric conditions express frustration, Dr. Carlson said it is not clear if the mechanisms for irritability and explosive outbursts are shared across conditions. Despite the guidance she offered for linking specific tantrum features with DMDD, she also reiterated that tantrums cannot be considered a symptom specific to any single etiology. The difference between etiologies for irritable children having a tantrum “is not how they feel, the difference is what they do,” Dr. Carlson suggested.
Dr. Carlson reported no relevant financial relationships.
REPORTING FROM THE PSYCHOPHARMACOLOGY UPDATE INSTITUTE
Want to expand aesthetic dermatology business? Appeal to men
MIAMI – Bringing more men into an aesthetic dermatology practice can expand the patient population, increase business revenue, and pay long-term dividends in terms of patient loyalty and repeat business.
But men aren’t like women when it comes to aesthetic concerns, so the strategies used to market your aesthetic offerings to female patients might miss the mark with men, cautioned Terrence Keaney, MD.

“I spend more time explaining therapies and what might be best for them,” he noted. “I explain the scientific rationale and treatment mechanisms so they will be more comfortable.” Making sure they understand is important, because “men often nod and don’t ask questions.”
The extra effort up front can pay off.
“The beauty of men is when they get a great result and are happy with you, men are very physician loyal. Once they get a great result, they’re yours forever,” said Dr. Keaney, an assistant clinical professor of dermatology at George Washington University, Washington, and a private practice dermatologist in Arlington, Va.
Cost is the leading deterrent for men to embrace aesthetic procedures, a factor that also ranks first among women. Men are also concerned that results will not look natural and want information about safety and side effects, Dr. Keaney said. “These deterrents can be overcome with proper education and counseling.”
Marketing to men is different
Although growing a male anesthetic patient base is more difficult, Dr. Keaney recommends it, especially for dermatology practices in a competitive market.
This tactic of targeting untapped markets to grow a business, rather than competing on the same level as everyone else, is outlined in a book he recommends, “Blue Ocean Strategy,” by W. Chan Kim and Renée Mauborgne. “It’s about unlocking new demand, and I will argue that, in aesthetic medicine, it’s those male patients.”
“The male aesthetic market is truly untapped and shows tremendous growth potential,” Dr. Keaney said. “Particularly as millennials age, the demand for cosmetic procedures in men will only increase.”
A first step is to make male aesthetic patients feel welcome and comfortable. “Think about a reluctant male patient walking into your office; it can be intimidating if the staff and everyone in the waiting room is female,” Dr. Keaney said. “But you don’t need to put a keg in the corner, either.” He added more wood and changed the colors of his office, for example.
Don’t go overboard
Marketing aesthetic services to men is also different, a lesson Dr. Keaney learned from the outset.
“When I first started a practice, I wanted to attract more male cosmetic patients, and I decided to throw a male cosmetics seminar,” he recalled. “I thought it would be a great opportunity to educate them.”
He partnered with a plastic surgeon, rented a ballroom, sent out an e-blast, and mailed flyers. “We had zero RSVPs. We canceled it.”
He added, “Men are not sitting at the computer thinking, ‘I wish someone would throw a seminar on aesthetics.’”
A better strategy came the following year as a men’s health event with a broader scope. A urologist, internist, dermatologist, and plastic surgeon talked about a variety of health issues. “They were blown away by the options from the dermatologist and the plastic surgeon.”
A growing market
An American Society for Dermatologic Surgery annual survey reveals dermatologic surgeons performed nearly 10.5 million medically necessary and cosmetic procedures in 2016, the latest year for which results are available. The rate is up 5% from the year before, and up by more than 30%, compared with 2012.
“Within the growth of procedures performed, the male and millennial demographics’ interest in cosmetic treatments also continues to rise,” the survey authors noted. “In the last 5 years, men receiving wrinkle relaxers has increased 9%, and men using soft-tissue fillers grew from 2% to 9%.” The survey also reveals that patients younger than 30 years are seeking more cosmetic treatments. In fact, millennials’ use of wrinkle relaxers increased 20% from 2015, and 50% since 2012.
Address the top male aesthetic concerns
Men are interested in looking healthy, young, and staying fit, Dr. Keaney said, but there is often a disconnect in the male market. “I would argue the real rate limiter is education,” he explained, “and that both the industry and physicians are at fault.”
Most messages about aesthetic procedures have not been targeted toward men. For example, only 39% of 600 aesthetically inclined men knew about dermal fillers in a study Dr. Keaney co-authored (Dermatol Surg. 2016 Oct;42[10]:1155-63).
“I talk to men in my practice about dermal fillers, and most think they’re only for injection in the lips,” he said. The results of the online survey came from men “cosmetically on the cusp,” as he described them – men familiar with neuromodulators for facial rejuvenation, but who had never tried such a therapy.
Tear troughs, double chin, crow’s feet, and forehead lines were the most common concerns, in order, reported by study participants. Dr. Keaney said. “You’ll notice what is missing here: the cheeks, the nasolabial folds, and the lips. And what are those? The FDA-approved indications for dermal fillers.”
Even though it doesn’t top the list of men’s concerns in this study, overall, “if you’re looking to grow your male aesthetic patient population, the number one cosmetic concern among men remains hair loss,” noted Dr. Keaney. “You cannot ignore hair loss. It has a large psychosocial impact.”
During a full-body exam, Dr. Keaney recommends using a scalp exam as an opportunity to ask about any hair-loss concerns.
Encouraging signs from other industries
Other industries are showing a rise in the appearance-conscious male consumer, Dr. Keaney said. Men’s skin care, grooming, and luxury fashion industries are all growing, for example.
Worldwide, the personal care market for men is forecast to grow to $166 billion globally by 2022, according to a report from Allied Market Research. The compound average growth rate is expected to grow more than 5% each year between now and then.
“Men are spending money on their hair and skin,” Dr. Keaney said. “The question is, Why aren’t they spending money on their face? It’s how we interact with the world.”
Dr. Keaney has served on the advisory board of, consulted for, and was a speaker for Allergan. He was also a speaker for Eclipse, Sciton, and Syneron Candela, and served on the advisory boards for Aclaris and Merz.
MIAMI – Bringing more men into an aesthetic dermatology practice can expand the patient population, increase business revenue, and pay long-term dividends in terms of patient loyalty and repeat business.
But men aren’t like women when it comes to aesthetic concerns, so the strategies used to market your aesthetic offerings to female patients might miss the mark with men, cautioned Terrence Keaney, MD.
“I spend more time explaining therapies and what might be best for them,” he noted. “I explain the scientific rationale and treatment mechanisms so they will be more comfortable.” Making sure they understand is important, because “men often nod and don’t ask questions.”
The extra effort up front can pay off.
“The beauty of men is when they get a great result and are happy with you, men are very physician loyal. Once they get a great result, they’re yours forever,” said Dr. Keaney, an assistant clinical professor of dermatology at George Washington University, Washington, and a private practice dermatologist in Arlington, Va.
Cost is the leading deterrent for men to embrace aesthetic procedures, a factor that also ranks first among women. Men are also concerned that results will not look natural and want information about safety and side effects, Dr. Keaney said. “These deterrents can be overcome with proper education and counseling.”
Marketing to men is different
Although growing a male anesthetic patient base is more difficult, Dr. Keaney recommends it, especially for dermatology practices in a competitive market.
This tactic of targeting untapped markets to grow a business, rather than competing on the same level as everyone else, is outlined in a book he recommends, “Blue Ocean Strategy,” by W. Chan Kim and Renée Mauborgne. “It’s about unlocking new demand, and I will argue that, in aesthetic medicine, it’s those male patients.”
“The male aesthetic market is truly untapped and shows tremendous growth potential,” Dr. Keaney said. “Particularly as millennials age, the demand for cosmetic procedures in men will only increase.”
A first step is to make male aesthetic patients feel welcome and comfortable. “Think about a reluctant male patient walking into your office; it can be intimidating if the staff and everyone in the waiting room is female,” Dr. Keaney said. “But you don’t need to put a keg in the corner, either.” He added more wood and changed the colors of his office, for example.
Don’t go overboard
Marketing aesthetic services to men is also different, a lesson Dr. Keaney learned from the outset.
“When I first started a practice, I wanted to attract more male cosmetic patients, and I decided to throw a male cosmetics seminar,” he recalled. “I thought it would be a great opportunity to educate them.”
He partnered with a plastic surgeon, rented a ballroom, sent out an e-blast, and mailed flyers. “We had zero RSVPs. We canceled it.”
He added, “Men are not sitting at the computer thinking, ‘I wish someone would throw a seminar on aesthetics.’”
A better strategy came the following year as a men’s health event with a broader scope. A urologist, internist, dermatologist, and plastic surgeon talked about a variety of health issues. “They were blown away by the options from the dermatologist and the plastic surgeon.”
A growing market
An American Society for Dermatologic Surgery annual survey reveals dermatologic surgeons performed nearly 10.5 million medically necessary and cosmetic procedures in 2016, the latest year for which results are available. The rate is up 5% from the year before, and up by more than 30%, compared with 2012.
“Within the growth of procedures performed, the male and millennial demographics’ interest in cosmetic treatments also continues to rise,” the survey authors noted. “In the last 5 years, men receiving wrinkle relaxers has increased 9%, and men using soft-tissue fillers grew from 2% to 9%.” The survey also reveals that patients younger than 30 years are seeking more cosmetic treatments. In fact, millennials’ use of wrinkle relaxers increased 20% from 2015, and 50% since 2012.
Address the top male aesthetic concerns
Men are interested in looking healthy, young, and staying fit, Dr. Keaney said, but there is often a disconnect in the male market. “I would argue the real rate limiter is education,” he explained, “and that both the industry and physicians are at fault.”
Most messages about aesthetic procedures have not been targeted toward men. For example, only 39% of 600 aesthetically inclined men knew about dermal fillers in a study Dr. Keaney co-authored (Dermatol Surg. 2016 Oct;42[10]:1155-63).
“I talk to men in my practice about dermal fillers, and most think they’re only for injection in the lips,” he said. The results of the online survey came from men “cosmetically on the cusp,” as he described them – men familiar with neuromodulators for facial rejuvenation, but who had never tried such a therapy.
Tear troughs, double chin, crow’s feet, and forehead lines were the most common concerns, in order, reported by study participants. Dr. Keaney said. “You’ll notice what is missing here: the cheeks, the nasolabial folds, and the lips. And what are those? The FDA-approved indications for dermal fillers.”
Even though it doesn’t top the list of men’s concerns in this study, overall, “if you’re looking to grow your male aesthetic patient population, the number one cosmetic concern among men remains hair loss,” noted Dr. Keaney. “You cannot ignore hair loss. It has a large psychosocial impact.”
During a full-body exam, Dr. Keaney recommends using a scalp exam as an opportunity to ask about any hair-loss concerns.
Encouraging signs from other industries
Other industries are showing a rise in the appearance-conscious male consumer, Dr. Keaney said. Men’s skin care, grooming, and luxury fashion industries are all growing, for example.
Worldwide, the personal care market for men is forecast to grow to $166 billion globally by 2022, according to a report from Allied Market Research. The compound average growth rate is expected to grow more than 5% each year between now and then.
“Men are spending money on their hair and skin,” Dr. Keaney said. “The question is, Why aren’t they spending money on their face? It’s how we interact with the world.”
Dr. Keaney has served on the advisory board of, consulted for, and was a speaker for Allergan. He was also a speaker for Eclipse, Sciton, and Syneron Candela, and served on the advisory boards for Aclaris and Merz.
REPORTING FROM ODAC 2018
Learn ‘four Ds’ approach to heart failure in diabetes
LOS ANGELES – , such as lung cancer, because diabetes makes the pathophysiology of heart failure worse, according to Mark Kearney, MD.
“Diabetes amplifies the neurohormonal response to heart failure, so it drives progressive heart failure and increases the risk for sudden death,” Dr. Kearney said at the World Congress on Insulin Resistance, Diabetes & Cardiovascular Disease. “As left ventricular function goes down, patients with diabetes have heightened activation of the renin angiotensin system. They have increased left ventricular hypertrophy, and they have increased sympathetic nervous system activation.”
Dr. Kearney, a cardiologist who directs the Leeds Institute of Cardiovascular & Metabolic Medicine at Leeds (England) University, offered a “four Ds” framework that clinicians can use to improve prognosis in these patients.

1. Use a loop diuretic to control symptoms. “If the patient has fluid retention, it’s important to get them out of congestive cardiac syndrome as quickly as possible,” he said.
2. Disease modification with beta-blockers and ACE inhibitors, to the maximal dose tolerated. “These are still the mainstays of treatment for patients with heart failure, and they’re even more important in patients with diabetes and heart failure,” he said.
3. Consider device therapy, including defibrillators and resynchronization therapy.4. Optimize diabetes management.
“If you keep these things in your mind as you see a patient with heart failure and diabetes, it will give you a guide to approaching these patients,” said Dr. Kearney, who is also research lead for heart failure services at the University of Leeds. “When I see patients, I’ll check for edema right away. If they have it, I’ll increase the diuretic, and I’ll think about the different steps in the treatment pathway.”
He described heart failure due to systolic dysfunction as a reduction in cardiac output that doesn’t meet the demands of the body, the endpoint of a whole range of insults to the left ventricle.
“The most common cause today is ischemic heart disease; it used to be hypertension,” he said. “People over 40 have a one in five chance of developing heart failure, so it’s really important for all of us to improve outcomes in this terrible syndrome.”
According to a study of nearly 2,000 unselected patients conducted by Dr. Kearney and his associates, those with diabetes and heart failure are more likely to have ischemia, compared with those who have heart failure and no diabetes (75% vs. 58%, respectively), lower hemoglobin (13 g/dL vs. 13.7 g/dL), and worse renal function (eGFR of 51 mL/min per 1.732 m2 vs 57 mL/min per 1.732 m2) (Diab Vasc Dis Res. 2013 Jul;10[4]:330-6).
He added that type 2 diabetes is a sudden death risk equivalent to patients with ischemic heart disease and left ventricular systolic dysfunction (Heart 2016 May 15;102[10]:735-40).
“So, if you have diabetes and the U.K. National Institute for Health and Care Excellence guidelines indication for a defibrillator, your risk of sudden death in 5 years is probably 50%,” Dr. Kearney said. “The best treatment in this case is a prophylactic defibrillator.”
ACE inhibitors are used to protect these patients against cardiac myocyte cell death and vasoconstriction, while beta-blockers are used to protect against the activation of the sympathetic nervous system.
“Often, patients don’t like taking beta-blockers because they say they make them feel tired – when in fact they don’t realize it’s their heart failure that’s making them feel tired,” Dr. Kearney said.
He and his associates examined the effect of different drugs doses on all-cause mortality at 5 years. They found that, among patients with heart failure, reduced ejection fraction, and no diabetes, ramipril conferred a 3% improvement in mortality per milligram. At the same time, the mortality among patients with diabetes and heart failure who did not receive a beta-blocker was about 7%.
However, the absolute gain from beta-blocker use in patients with diabetes and heart failure was three times that of patients without diabetes.
“So, every milligram you increase the dose by, there’s an associated improvement in risk,” Dr. Kearney said. “Over 5 years, comparing the lowest beta-blocker dose to the highest beta-blocker dose, it was 1 year of life gained. So, when I see my patients and they ask about side effects of beta-blockers, I now say to them, ‘The side effects actually make you live longer.’”
He concluded his remarks by noting that while he is not a diabetes expert, it’s clear that diabetes is intimately linked to the pathophysiology of heart failure.
“If you’re insulin resistant, you have hypertension, hyperglycemia, you have inflammation and bone marrow dysfunction – all of which can exacerbate left ventricle dysfunction,” he said. “You have a syndrome in which you have cardiac dysfunction and metabolic dysfunction that conspire to lead to worsening of left ventricular dysfunction.”
Dr. Kearney disclosed that he has been a speaker for Merck.
LOS ANGELES – , such as lung cancer, because diabetes makes the pathophysiology of heart failure worse, according to Mark Kearney, MD.
“Diabetes amplifies the neurohormonal response to heart failure, so it drives progressive heart failure and increases the risk for sudden death,” Dr. Kearney said at the World Congress on Insulin Resistance, Diabetes & Cardiovascular Disease. “As left ventricular function goes down, patients with diabetes have heightened activation of the renin angiotensin system. They have increased left ventricular hypertrophy, and they have increased sympathetic nervous system activation.”
Dr. Kearney, a cardiologist who directs the Leeds Institute of Cardiovascular & Metabolic Medicine at Leeds (England) University, offered a “four Ds” framework that clinicians can use to improve prognosis in these patients.
1. Use a loop diuretic to control symptoms. “If the patient has fluid retention, it’s important to get them out of congestive cardiac syndrome as quickly as possible,” he said.
2. Disease modification with beta-blockers and ACE inhibitors, to the maximal dose tolerated. “These are still the mainstays of treatment for patients with heart failure, and they’re even more important in patients with diabetes and heart failure,” he said.
3. Consider device therapy, including defibrillators and resynchronization therapy.4. Optimize diabetes management.
“If you keep these things in your mind as you see a patient with heart failure and diabetes, it will give you a guide to approaching these patients,” said Dr. Kearney, who is also research lead for heart failure services at the University of Leeds. “When I see patients, I’ll check for edema right away. If they have it, I’ll increase the diuretic, and I’ll think about the different steps in the treatment pathway.”
He described heart failure due to systolic dysfunction as a reduction in cardiac output that doesn’t meet the demands of the body, the endpoint of a whole range of insults to the left ventricle.
“The most common cause today is ischemic heart disease; it used to be hypertension,” he said. “People over 40 have a one in five chance of developing heart failure, so it’s really important for all of us to improve outcomes in this terrible syndrome.”
According to a study of nearly 2,000 unselected patients conducted by Dr. Kearney and his associates, those with diabetes and heart failure are more likely to have ischemia, compared with those who have heart failure and no diabetes (75% vs. 58%, respectively), lower hemoglobin (13 g/dL vs. 13.7 g/dL), and worse renal function (eGFR of 51 mL/min per 1.732 m2 vs 57 mL/min per 1.732 m2) (Diab Vasc Dis Res. 2013 Jul;10[4]:330-6).
He added that type 2 diabetes is a sudden death risk equivalent to patients with ischemic heart disease and left ventricular systolic dysfunction (Heart 2016 May 15;102[10]:735-40).
“So, if you have diabetes and the U.K. National Institute for Health and Care Excellence guidelines indication for a defibrillator, your risk of sudden death in 5 years is probably 50%,” Dr. Kearney said. “The best treatment in this case is a prophylactic defibrillator.”
ACE inhibitors are used to protect these patients against cardiac myocyte cell death and vasoconstriction, while beta-blockers are used to protect against the activation of the sympathetic nervous system.
“Often, patients don’t like taking beta-blockers because they say they make them feel tired – when in fact they don’t realize it’s their heart failure that’s making them feel tired,” Dr. Kearney said.
He and his associates examined the effect of different drugs doses on all-cause mortality at 5 years. They found that, among patients with heart failure, reduced ejection fraction, and no diabetes, ramipril conferred a 3% improvement in mortality per milligram. At the same time, the mortality among patients with diabetes and heart failure who did not receive a beta-blocker was about 7%.
However, the absolute gain from beta-blocker use in patients with diabetes and heart failure was three times that of patients without diabetes.
“So, every milligram you increase the dose by, there’s an associated improvement in risk,” Dr. Kearney said. “Over 5 years, comparing the lowest beta-blocker dose to the highest beta-blocker dose, it was 1 year of life gained. So, when I see my patients and they ask about side effects of beta-blockers, I now say to them, ‘The side effects actually make you live longer.’”
He concluded his remarks by noting that while he is not a diabetes expert, it’s clear that diabetes is intimately linked to the pathophysiology of heart failure.
“If you’re insulin resistant, you have hypertension, hyperglycemia, you have inflammation and bone marrow dysfunction – all of which can exacerbate left ventricle dysfunction,” he said. “You have a syndrome in which you have cardiac dysfunction and metabolic dysfunction that conspire to lead to worsening of left ventricular dysfunction.”
Dr. Kearney disclosed that he has been a speaker for Merck.
EXPERT ANALYSIS FROM WCIRDC 2017
Whatever the substance, adolescents’ abuse shares common links
SAN DIEGO – Among adolescent daily cigarette smokers, the individual and concomitant use of alcohol, marijuana, and tobacco have unique and common associations with reinforcement sensitivity, with negative affect, and with electrophysiological signatures of reward function, results from a novel study demonstrated.
“The co-use of alcohol, marijuana, and tobacco in youth are associated bidirectionally with higher rates of substance use, higher levels of addiction severity, and with poorer treatment outcomes for youth who present for treatment,” lead study author Christopher J. Hammond, MD, said at the annual meeting and scientific symposium of the American Academy of Addiction Psychiatry.
Currently, the effects of combined alcohol, marijuana, and tobacco use on brain function are poorly understood, noted Dr. Hammond of the division of child and adolescent psychiatry at Johns Hopkins Bayview Medical Center, Baltimore.
Published studies to date suggest that alcohol, marijuana, and tobacco use disorders are linked separately to dysfunction in the neural substrates of reward and punishment processing, but none has examined co-use or comorbid disorders in adolescents.
In a cross-sectional, single-visit study, Dr. Hammond and his associates examined a population of 36 adolescent non-deprived daily cigarette smokers and 29 healthy controls from the greater New Haven, Conn., area, matched for age, gender, and grade level. The subjects ranged in age from 14 to 20 years and were administered self-report measures characterizing tobacco, marijuana, and alcohol use. The researchers also collected urine and breathalyzer measures to characterize tobacco and cannabis use.
All subjects completed a number of self-report questionnaires characterizing their substance use patterns, their addiction severity, impulsivity, sensitivity to reward and punishment, and depression. They also underwent a 45-minute EEG, during which they completed a resting EEG test and completed a reward task.
The adolescent daily cigarette smoker group had blunted or decreased sensitivity to punishment and increased impulsivity, compared with the healthy controls, Dr. Hammond reported.
Co-occurring drug use was high in the adolescent daily smoker group, with 80% reporting heavy marijuana use (defined as using it over 100 times during adolescence), and 67% reporting heavy episodic binge drinking (defined as consuming greater than four alcoholic beverages for females during one sitting and greater than five for males at least two or more times a month).
One out of two of the daily cigarette smokers were also daily marijuana smokers, and about 75% of the adolescent smokers had a positive urine drug screen for marijuana. They smoked an average of eight cigarettes per day, used cannabis about 17 days out of the month, and they had about 1.5 binge drinking episodes per month.
Next, the researchers used linear regression analyses to examine which of the psychological variables were associated with alcohol, marijuana, and tobacco use severity within the smoker group, after co-varying for age, gender, race/ethnicity, and full-scale IQ.
“For alcohol use, we found that depression, sensitivity to reward, and impulsivity were significantly associated with alcohol problem severity scores, even after controlling for sociodemographics and other drug use (P less than .05),” Dr. Hammond said.
“For marijuana use, we found that sensitivity to reward and impulsivity were significantly associated with cannabis problem severity, even after controlling for demographics and alcohol and other drug use (P less than .01),” he continued. “For tobacco use, we found that anxiety sensitivity was significantly associated with nicotine dependence scores, even after controlling for demographics and alcohol and marijuana use (P less than .001).”
On EEG analyses, the researchers found no main effects for group or group by condition for the feedback-related negativity (FRN) signal or for the event-related Theta oscillation between the adolescent non-deprived smokers and the healthy controls.
However, examination of the smoker subgroups revealed a unique and shared association between alcohol, marijuana, and tobacco and the EEG signals.
“With regard to substance use associations with the FRN smokers, regression analyses showed that cannabis use problem severity was associated with an increased FRN amplitude during the reward condition only,” Dr. Hammond said. “This finding remained significant after co-varying for demographics, for other drug use, for nicotine dependence and alcohol severity as well.
“We also found an association between alcohol problem severity and mean FRN amplitude, but with no differences across conditions,” he added. There was an association also “ between nicotine dependence and decreased FRN latency, but only during the reward and draw conditions, suggesting a nicotine severity association with speed of processing salient reward and stimuli.”
While the findings need to be better studied and replicated, “these associations may be leveraged to better personalize our interventions for these different substances of abuse,” Dr. Hammond observed. “The study also provides preliminary evidence for a dual-process model of substance use, specifically for cannabis. Cannabis severity in adolescent smokers is associated with increased bottom-up reward signaling and impaired top-down cognitive control over a salient or rewarding stimulus.”
The study was supported by the American Academy of Child and Adolescent Psychiatry and the National Institute on Drug Abuse. Dr. Hammond disclosed that he receives research funding from both organizations.
SOURCE: Hammond et al. AAAP 2017. Paper session A3.
REPORTING FROM AAAP
Key clinical point:
Major finding: Among adolescents who smoked cigarettes daily, 80% reported co-occurring heavy marijuana use, and 67% reported heavy episodic binge drinking.
Study details: A cross-sectional, single visit study of 36 adolescent nondeprived daily cigarette smokers and 29 healthy, age-matched controls.
Disclosures: The study was supported by the American Academy of Child and Adolescent Psychiatry and the National Institute on Drug Abuse. Dr. Hammond disclosed that he receives research funding from both organizations.
Source: Hammond et al. AAAP 2017. Paper session A3.
FDA clears assay for myeloma patients

The US Food and Drug Administration (FDA) has granted 510(k) clearance for Sebia’s Hydrashift 2/4 daratumumab immunofixation assay.
This in vitro diagnostic test allows for assessment of response in patients with multiple myeloma by mitigating potential interference caused by the anti-CD38 antibody daratumumab (Darzalex®).
Daratumumab can interfere with the visualization of M-proteins in immunofixation electrophoresis.
The Hydrashift 2/4 daratumumab assay is intended to be used with Sebia’s Hydragel IF kit to provide qualitative detection of monoclonal proteins in human serum by immunofixation electrophoresis.
The assay is performed on Sebia’s Hydrasys 2 agarose gel platform.
The Hydrashift 2/4 daratumumab assay is the result of a collaboration between Sebia and Janssen Biotech, Inc. Sebia received development rights from Janssen and is the worldwide supplier of this assay.
The Hydrashift 2/4 daratumumab assay received the CE mark in November 2016. ![]()