User login
Dermatologists continue to prefer urban areas
, according to data from a longitudinal study published online Sept. 5 in JAMA Dermatology.
Data from previous studies suggest that the demand for dermatologists continues to outpace the supply, thus dermatologists have their choice of locations and prefer urban areas because of greater professional opportunities, desire to live near family, and lack of financial incentives to relocate to underserved areas, wrote Hao Feng, MD, of the department of dermatology, New York University, and his colleagues.
To evaluate the latest longitudinal trends in dermatology and factors affecting geographic distribution, the researchers used the Area Health Resources File from 1995 to 2013 to examine the geographic densities of dermatologists and other physicians, as well as the age distribution of dermatologists. The counties were classified as rural, nonmetropolitan, and metropolitan.
Although the percentage changes in dermatologist density at the county level showed a greater increase during the study period in rural counties (30%) and nonmetropolitan counties (25%), compared with metropolitan counties (18%), the differences in actual density of dermatologists per 100,000 people were highest in urban areas.
Overall, dermatologist density in metropolitan areas increased from 3.47 to 4.11 per 100,000 people between 1995 and 2013. Dermatologist density in nonmetropolitan areas during this time increased from 0.84 in 1995 to 1.05 per 100,000 people in 2013, and from 0.065 to 0.085 per 100,000 people in rural areas during that time.
The researchers also evaluated dermatologist trends by age, and found that the number of dermatologists younger than 55 years increased by 21% in metropolitan areas and by 7% in nonmetropolitan and rural areas combined between 1995 and 2013.
The study findings were strengthened by the long time period, but limited by factors including inability to differentiate among full-time and part-time dermatologists, and among medical or cosmetic dermatologists and dermatologic surgeons, the researchers said. However, the results suggest that geographic disparities for dermatologists in the United States continue to increase, and strategies to correct it are important to maintain patient care, they wrote. “Careful workforce planning will be needed to consider alternative health care delivery models, dermatologist recruitment strategies, and the role of nonphysician practitioners and telemedicine, especially in nonmetropolitan or rural areas,” they noted.
The researchers had no financial conflicts to disclose.
SOURCE: Feng H et al. JAMA Dermatol. 2018 Sep 5. doi: 10.1001/jamadermatol.2018.3022.
A stagnation of dermatology training programs in the 1980s and 1990s led to a limited supply of dermatologists, most of whom chose to work in urban areas, and this geographic distribution gap has persisted and worsened, Martina L. Porter, MD, and Alexa B. Kimball, MD, wrote in an editorial. The trend of more dermatologists opting for academic, group, or multispecialty practices instead of solo practices has continued, which adds to the maldistribution of dermatologists by geography, they said. “This demographic pattern poses an additional threat because almost half of rural dermatology practices were solo practices as of 2014,” they noted.
In addition, women make up approximately half of the current and future dermatology workforce, and they have historically been less likely to move to rural areas, even when offered forgiveness on student loans. Even so, the authors encouraged the use of exposure to rural medicine to establish a connection to an area, along with financial incentives and loan repayment.
“In parallel, because there appears to be increasing willingness to fund telemedicine, doubling down on training rural physicians and APPs in some areas of dermatology and engaging technology to support them seems prudent and responsible,” they wrote. “We may not be able to modify the overall dermatology workforce imbalance, but ensuring timely access to our expertise for those patients who need us most can still be achieved if prioritized correctly” (JAMA Dermatol. 2018 Sep 5. doi: 10.1001/jamadermatol.2018.2925).
Dr. Porter and Dr. Kimball are affiliated with Harvard Medical School in Boston. They had no financial conflicts to disclose.
, according to data from a longitudinal study published online Sept. 5 in JAMA Dermatology.
Data from previous studies suggest that the demand for dermatologists continues to outpace the supply, thus dermatologists have their choice of locations and prefer urban areas because of greater professional opportunities, desire to live near family, and lack of financial incentives to relocate to underserved areas, wrote Hao Feng, MD, of the department of dermatology, New York University, and his colleagues.
To evaluate the latest longitudinal trends in dermatology and factors affecting geographic distribution, the researchers used the Area Health Resources File from 1995 to 2013 to examine the geographic densities of dermatologists and other physicians, as well as the age distribution of dermatologists. The counties were classified as rural, nonmetropolitan, and metropolitan.
Although the percentage changes in dermatologist density at the county level showed a greater increase during the study period in rural counties (30%) and nonmetropolitan counties (25%), compared with metropolitan counties (18%), the differences in actual density of dermatologists per 100,000 people were highest in urban areas.
Overall, dermatologist density in metropolitan areas increased from 3.47 to 4.11 per 100,000 people between 1995 and 2013. Dermatologist density in nonmetropolitan areas during this time increased from 0.84 in 1995 to 1.05 per 100,000 people in 2013, and from 0.065 to 0.085 per 100,000 people in rural areas during that time.
The researchers also evaluated dermatologist trends by age, and found that the number of dermatologists younger than 55 years increased by 21% in metropolitan areas and by 7% in nonmetropolitan and rural areas combined between 1995 and 2013.
The study findings were strengthened by the long time period, but limited by factors including inability to differentiate among full-time and part-time dermatologists, and among medical or cosmetic dermatologists and dermatologic surgeons, the researchers said. However, the results suggest that geographic disparities for dermatologists in the United States continue to increase, and strategies to correct it are important to maintain patient care, they wrote. “Careful workforce planning will be needed to consider alternative health care delivery models, dermatologist recruitment strategies, and the role of nonphysician practitioners and telemedicine, especially in nonmetropolitan or rural areas,” they noted.
The researchers had no financial conflicts to disclose.
SOURCE: Feng H et al. JAMA Dermatol. 2018 Sep 5. doi: 10.1001/jamadermatol.2018.3022.
FROM JAMA DERMATOLOGY
Key clinical point: Geographic disparity for dermatologists in the United States has increased over time.
Major finding: The density of dermatologists increased by 21% from 1995 to 2013, but gaps persist between urban and rural areas.
Study details: A review of county-level data for 1995-2013 from the Area Health Resources File.
Disclosures: The researchers had no financial conflicts to disclose.
Source: Feng H et al. JAMA Dermatol. 2018 Sep 5. doi: 10.1001/jamadermatol.2018.3022.
Infliximab biosimilar only moderately less expensive in Medicare Part D
The infliximab-dyyb biosimilar was only moderately less expensive than the originator infliximab product Remicade in the United States in 2017 under Medicare Part D, an analysis shows.

Infliximab-dyyb (Inflectra) cost 18% less than infliximab, with an annual cost exceeding $14,000 in an analysis published online Sept. 4 in JAMA by Jinoos Yazdany, MD, of the division of rheumatology at the University of California, San Francisco, and her coauthors.
However, “without biosimilar gap discounts in 2017, beneficiaries would have paid more than $5,100 for infliximab-dyyb, or nearly $1,700 more in projected out-of-pocket costs than infliximab,” Dr. Yazdany and her coauthors wrote.
Biologics represent only 2% of U.S. prescriptions but made up 38% of drug spending in 2015 and accounted for 70% of growth in drug spending from 2010 to 2015, according to Dr. Yazdany and her colleagues.
Biologics for rheumatoid arthritis (RA) cost more than $14,000 per year, and in 2015, 3 were among the top 15 drugs in terms of Medicare expenditures, they added.
While biosimilars are supposed to increase competition and lower prices, it’s an open question whether they actually reduce out-of-pocket expenditures for the 43 million individuals with drug benefits under Medicare Part D.
That uncertainty is due in part to the complex cost-sharing design of Part D, which includes an initial deductible, a coverage phase, a coverage gap, and catastrophic coverage.
In 2017, the plan included an initial $400 deductible, followed by the coverage phase, in which the patient paid 25% of drug costs. In the coverage gap, which started at $3,700 in total drug costs, the patient’s share of drug costs increased to 40% for biologics, and 51% for biosimilars. In the catastrophic coverage phase, triggered when out-of-pocket costs exceeded $4,950, the patient was responsible for 5% of drug costs.
“Currently, beneficiaries receive a 50% manufacturer discount during the gap for brand-name drugs and biologics, but not for biosimilars,” Dr. Yazdany and her coauthors said in the report.
To evaluate cost-sharing for infliximab-dyyb, which in 2016 became the first available RA biosimilar, the authors analyzed data for all Part D plans in the June 2017 Medicare Prescription Drug Plan Formulary, Pharmacy Network, and Pricing Information Files.
Out of 2,547 plans, only 10% covered the biosimilar, while 96% covered infliximab, the authors found.
The mean total cost of infliximab-dyyb was “modestly lower,” they reported. Eight-week prescription costs were $2,185 for infliximab-dyyb versus $2,667 for infliximab, while annual costs were $14,202 for the biosimilar and $17,335 for infliximab.
However, all plans required coinsurance cost-sharing for the biosimilar, they said. The mean coinsurance rate was 26.6% of the total drug cost for the biosimilar and 28.4% for infliximab.
For beneficiaries, projected annual out-of-pocket costs without the gap discount were $5,118 for infliximab-dyyb and $3,432 for infliximab, the researchers said.
Biosimilar gap discounts are set to start in 2019, according to the authors. However, they said those discounts may not substantially reduce out-of-pocket costs for Part D beneficiaries because of the high price of infliximab-dyyb and a coinsurance cost-sharing rate similar to that of infliximab.
“Further policies are needed to address affordability and access to specialty drugs,” Dr. Yazdany and her coauthors concluded.
The study was funded in part by grants from the Agency for Healthcare Research and Quality, the Robert L. Kroc Endowed Chair in Rheumatic and Connective Tissue Diseases, and other sources. Dr. Yazdany reported receiving an independent investigator award from Pfizer. Her coauthors reported no conflict of interest disclosures.
The infliximab-dyyb biosimilar was only moderately less expensive than the originator infliximab product Remicade in the United States in 2017 under Medicare Part D, an analysis shows.
Infliximab-dyyb (Inflectra) cost 18% less than infliximab, with an annual cost exceeding $14,000 in an analysis published online Sept. 4 in JAMA by Jinoos Yazdany, MD, of the division of rheumatology at the University of California, San Francisco, and her coauthors.
However, “without biosimilar gap discounts in 2017, beneficiaries would have paid more than $5,100 for infliximab-dyyb, or nearly $1,700 more in projected out-of-pocket costs than infliximab,” Dr. Yazdany and her coauthors wrote.
Biologics represent only 2% of U.S. prescriptions but made up 38% of drug spending in 2015 and accounted for 70% of growth in drug spending from 2010 to 2015, according to Dr. Yazdany and her colleagues.
Biologics for rheumatoid arthritis (RA) cost more than $14,000 per year, and in 2015, 3 were among the top 15 drugs in terms of Medicare expenditures, they added.
While biosimilars are supposed to increase competition and lower prices, it’s an open question whether they actually reduce out-of-pocket expenditures for the 43 million individuals with drug benefits under Medicare Part D.
That uncertainty is due in part to the complex cost-sharing design of Part D, which includes an initial deductible, a coverage phase, a coverage gap, and catastrophic coverage.
In 2017, the plan included an initial $400 deductible, followed by the coverage phase, in which the patient paid 25% of drug costs. In the coverage gap, which started at $3,700 in total drug costs, the patient’s share of drug costs increased to 40% for biologics, and 51% for biosimilars. In the catastrophic coverage phase, triggered when out-of-pocket costs exceeded $4,950, the patient was responsible for 5% of drug costs.
“Currently, beneficiaries receive a 50% manufacturer discount during the gap for brand-name drugs and biologics, but not for biosimilars,” Dr. Yazdany and her coauthors said in the report.
To evaluate cost-sharing for infliximab-dyyb, which in 2016 became the first available RA biosimilar, the authors analyzed data for all Part D plans in the June 2017 Medicare Prescription Drug Plan Formulary, Pharmacy Network, and Pricing Information Files.
Out of 2,547 plans, only 10% covered the biosimilar, while 96% covered infliximab, the authors found.
The mean total cost of infliximab-dyyb was “modestly lower,” they reported. Eight-week prescription costs were $2,185 for infliximab-dyyb versus $2,667 for infliximab, while annual costs were $14,202 for the biosimilar and $17,335 for infliximab.
However, all plans required coinsurance cost-sharing for the biosimilar, they said. The mean coinsurance rate was 26.6% of the total drug cost for the biosimilar and 28.4% for infliximab.
For beneficiaries, projected annual out-of-pocket costs without the gap discount were $5,118 for infliximab-dyyb and $3,432 for infliximab, the researchers said.
Biosimilar gap discounts are set to start in 2019, according to the authors. However, they said those discounts may not substantially reduce out-of-pocket costs for Part D beneficiaries because of the high price of infliximab-dyyb and a coinsurance cost-sharing rate similar to that of infliximab.
“Further policies are needed to address affordability and access to specialty drugs,” Dr. Yazdany and her coauthors concluded.
The study was funded in part by grants from the Agency for Healthcare Research and Quality, the Robert L. Kroc Endowed Chair in Rheumatic and Connective Tissue Diseases, and other sources. Dr. Yazdany reported receiving an independent investigator award from Pfizer. Her coauthors reported no conflict of interest disclosures.
FROM JAMA
Key clinical point:
Major finding: Infliximab-dyyb was 18% less costly than infliximab, with an annual cost exceeding $14,000.
Study details: Analysis of data for 2,547 Part D plans in the June 2017 Medicare Prescription Drug Plan Formulary, Pharmacy Network, and Pricing Information Files.
Disclosures: The study was funded in part by grants from the Agency for Healthcare Research and Quality, the Robert L. Kroc Endowed Chair in Rheumatic and Connective Tissue Diseases, and other sources. One author reported receiving an independent investigator award from Pfizer.
Source: Yazdany J et al. JAMA. 2018;320(9):931-3.
Acute biliary pancreatitis linked to poor outcomes in elderly
Mortality was almost three times as high in elderly patients after stringent matching for confounding variables, wrote researcher Kishan Patel, MD, of the Ohio State University, Columbus, and coauthors.
These findings represent a “current health care concern,” since the elderly population in the United States is expected to double within the next several decades and the prevalence of acute pancreatitis is on the rise, Dr. Patel and colleagues wrote in a report on the analysis in the Journal of Clinical Gastroenterology.
The analysis is the first, to the investigators’ knowledge, that addresses national-level outcomes associated with acute biliary pancreatitis in elderly patients.
To evaluate clinical outcomes of elderly patients with acute biliary pancreatitis, Dr. Patel and colleagues queried the Nationwide Readmissions Database, which is the largest inpatient readmission database in the United States.
The investigators looked at outcomes associated with index hospitalizations, defined as a patient’s first hospitalization in a calendar year, and found 184,763 adult patients who received a diagnosis of acute biliary pancreatitis between 2011 and 2014. Of those, 41% were elderly.
The mortality rate associated with the index admission was 1.96% (n = 356) for the elderly patients, compared with just 0.32% (n = 1,473) for nonelderly patients (P less than .001), according to the report.
Mortality was increased in the elderly versus nonelderly patients, with an odds ratio of 2.8 (95% CI, 2.2-3.5), according to results of a propensity score matched analysis. Likewise, severe acute pancreatitis was increased in the elderly, with an OR of 1.2 (95% CI: 1.1-1.3) in that analysis.
By contrast, patient age did not impact 30-day readmission rates, according to results of a multivariate analysis that adjusted for confounding factors.
Mortality and severe acute pancreatitis both increased with age within the elderly cohort, further multivariate analysis showed. For example, the ORs for mortality were 1.39 for patients aged 75-84 years and 2.21 for patients aged 85 years and older, the results show.
The elderly population in the United States is expected to almost double by 2050, rising from 48 to 88 million, Dr. Patel and colleagues said. The number of those aged 85 years or older is expected to increase from 5.9 to 18 million by 2050, at which time they will make up nearly 5% of the total U.S. population.
“This specific demographic is more susceptible to common medical ailments, more troubling is acute pancreatitis is one of the most frequent causes of hospitalization in gastroenterology,” Dr. Patel and colleagues wrote.
Dr. Patel and coauthors reported no conflicts of interest related to the analysis.
SOURCE: Patel K et al. J Clin Gastroenterol. 2018 Aug 28. doi: 10.1097/MCG.0000000000001108.
FROM THE JOURNAL OF CLINICAL GASTROENTEROLOGY
Key clinical point: Compared with younger patients, elderly patients admitted for acute biliary pancreatitis have increased rates of adverse outcomes.
Major finding: Elderly patients had increased mortality (odds ratio, 2.8; 95% confidence interval, 2.2-3.5) and severe acute pancreatitis (OR, 1.2; 95% CI: 1.1-1.3).
Study details: A propensity score matched analysis of a large, nationally representative database including nearly 185,000 adults with acute biliary pancreatitis.
Disclosures: The study authors reported no conflicts of interest related to the study.
Source: Patel K et al. J Clin Gastroenterol. 2018 Aug 28. doi: 10.1097/MCG.0000000000001108.
Huddling for High-Performing Teams
In short team huddles, trainees and PACT teamlets meet to coordinate care and identify ways to improve team processes under the guidance of faculty members who reinforce collaborative practice and continuous improvement.
In 2011, 5 US Department of Veteran Affairs (VA) medical centers were selected by the VA Office of Academic Affiliations (OAA) to establish Centers of Excellence in Primary Care Education (CoEPCE). Part of the VA New Models of Care initiative, the 5 CoEPCEs (Boise, Cleveland, San Francisco, Seattle and West Haven) are utilizing VA primary care settings to develop and test innovative approaches to prepare physician residents, nurse practitioner (NP) students and residents (postgraduate), and other health professions trainees, such as pharmacy, social work, psychology, physician assistants (PAs), dieticians, etc for primary care practice.
The CoEPCEs are interprofessional academic patient aligned care teams (PACTs) defined by VA as a PACT that has at least 2 professions of trainees on the team engaged in learning. 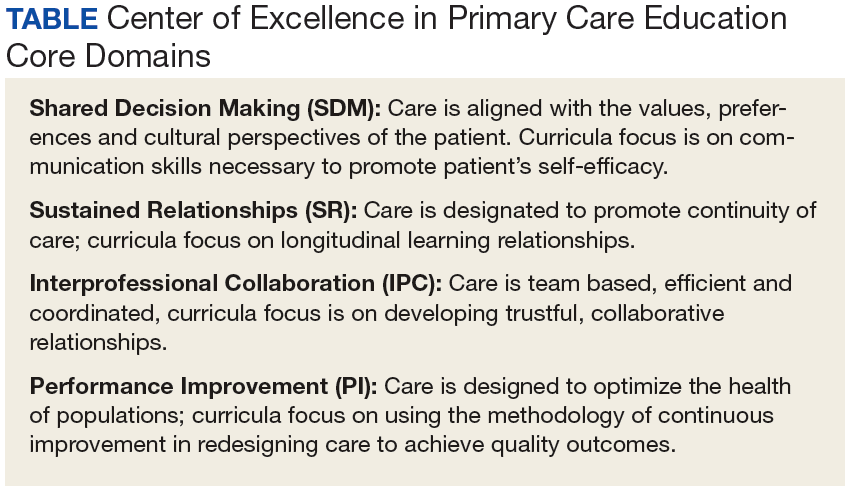
The San Francisco VA Health Care System (SFVAHCS) Education in PACT (EdPACT)/CoEPCE developed and implemented a workplace learning model that embeds trainees into PACT teamlets and clinic workflow.1 Trainees are organized in practice partner triads with 2 second- or third-year internal medicine residents (R2s and R3s) and 1 NP student or resident. Physician residents rotate every 2 months between inpatient and outpatient settings and NP trainees are present continuously for 12 months. In this model, each trainee in the triad has his/her own patient panel and serves as a partner who delivers care to his/her partners’ patients when they are unavailable. Didactic sessions on clinical content and on topics related to the core domains occur 3-times weekly during pre- and postclinic conferences.2
Methods
In 2015, evaluators from the OAA reviewed background documents and conducted open-ended interviews with 9 CoEPCE staff, participating trainees, VA faculty, VA facility leadership, and affiliate faculty. Informants described their involvement, challenges encountered, and benefits of the huddle to participants, veterans, and the VA.
The Huddle
With the emphasis on patient-centered medical homes and team-based care in the Affordable Care Act, there is an urgent need to develop new training models that provide future health professionals with skills that support interprofessional communication and collaborative practice.2,3 A key aim of the CoEPCE is to expand workplace learning strategies and clinical opportunities for interprofessional trainees to work together as a team to anticipate and address the health care needs of veterans. Research suggests that patient care improves when team members develop a shared understanding of each other’s skill sets, care procedures, and values.4 In 2010, the SFVAHCS began phasing in VA-mandated PACTs. Each patient-aligned care teamlet serves about 1,200 patients and is composed of physician or NP primary care provider(s) (PCPs) and a registered nurse (RN) care manager, a licensed vocational nurse (LVN), and a medical support assistant (MSA). About every 3 teamlets also work with a profession-specific team member from the Social Work and Pharmacy departments. The implementation of PACT created an opportunity for the CoEPCE to add trainees of various professions to 13 preexisting PACTs in 3 SFVAHCS primary care clinics. This arrangement benefits both trainees and teamlets: trainees learn how to collaborate with clinic staff while the clinic PACT teamlets benefit from coaching by faculty skilled in team-based care.
As part of routine clinical activities, huddles provide opportunities for workplace learning related to coordination of care, building relationships, and developing a sense of camaraderie that is essential for team-based, patient-centered care. In their ideal state, huddles are “…the hub of interprofessional, team-based care”; they provide a venue where trainees can learn communication skills, team member roles, systems issues and resources, and clinical knowledge expected of full-time providers and staff.5 Embedding faculty in huddles as huddle coaches help ensure trainees are learning and applying these skills.
Planning and Implementation
After OAA funded the CoEPCE in 2011, faculty had 6 months to develop the EdPACT curriculum, which included a team building retreat, interactive didactic sessions, and workplace learning activities (ie, huddles). In July 2011, 10 trainee triads (each consisting of 2 physician residents and either a student NP or resident NP) were added to preexisting PACTs at the San Francisco VA Medical Center primary care clinic and 2 community-based outpatient clinics.
These trainee triads partnered with their PACT teamlets and huddled for 15 minutes at the beginning of each clinic day to plan for the day’s patients and future scheduled patients and to coordinate care needs for their panel of patients. CoEPCE staff built on this basic huddle model and made the following lasting modifications:
- Developed and implemented a huddle coach model and a huddle checklist to provide structure and feedback to the huddle (Online Resources);
- Scheduled huddles in NP student/resident’s exam room to reduce the hierarchy in the trainee triad;
- Incorporated trainees from other professions and levels into the huddle (psychology fellows, pharmacy residents, social work); and
- Linked the PACT teamlet (staff) to quality improvement projects that are discussed periodically in huddles and didactics.
Curriculum. The huddle allows for practical application of the 4 core domains: interprofessional collaboration (IPC), performance improvement (PI), sustained relationships (SR), and shared decision making (SDM) that shape the CoE curriculum. 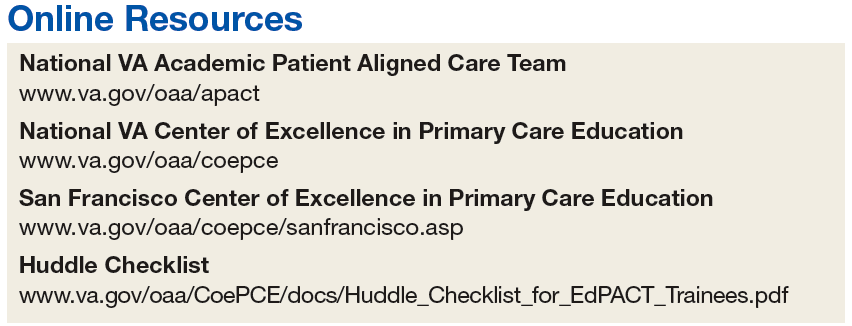
Interprofessional collaboration (IPC) is the primary domain reinforced in the huddle. Trainees learn key content in half-day team retreats held at the beginning of the academic year and in interactive didactic sessions. These sessions, which draw on concepts from the Agency for Healthcare Research and Quality’s TeamSTEPPS, an evidence-based teamwork training program for health care workers, teach skills like closed-loop communication, check-backs, negotiation, and conflict resolution.
The CoE trainee triads also lead quality improvement (QI) projects, and the huddle is a venue for getting input, which reinforces the CoE’s performance improvement (PI) curriculum. For example, PACT teamlet staff members provide trainees with feedback on proposed QI interventions, such as increasing the use of telephone visits. The huddle supports SR among team members that enhance patient care while improving the quality of the clinic experience for team members. Strengthened communications and increased understanding of team member roles and system resources supports a patient-centered approach to care and lays the foundation for SDM between patients and team members.
Faculty Roles and Development. The CoEPCE physician and NP faculty members who precept and function as huddle coaches participate in monthly 2-hour faculty development sessions to address topics related to IPE. At least 1 session each year covers review of the items on the huddle checklist, tips on how to coach a huddle, discussions of the role of huddle coaches, and feedback and mentoring skills. Many huddle coach activities are inherent to clinical precepting, such as identifying appropriate clinical resources and answering clinical questions, but the core function of the huddle coach is to facilitate effective communication among team members.
Initially, a coach may guide the huddle by rounding up team members or directing the agenda of the huddle (ie, prompting the LVN to present the day’s patients and suggesting the group identify and discuss high-risk patients). As the year progresses, coaches often take a backseat, and the huddle may be facilitated by the trainees, the RN, LVN, or a combination of all members. During the huddle, coaches also may reinforce specific communication skills, such as a “check back” or ISBAR ( Identify who you are, describe the Situation, provide Background information, offer an Assessment of the situation/needs, make a Recommendation or Request)—skills that are taught during CoE didactic sessions.
The coach may call attention to particular feedback points, such as clarification of the order as an excellent example of a check-back. Each preceptor coaches 1 huddle per precepting session. After the teams huddle, preceptors do a smaller, shorter huddle in the precepting room to share successes, such as interprofessional trainees demonstrating backup behavior (eg, “in today’s huddle, I saw a great example of backup behavior when the medicine resident offered to show the NP student how to consent someone”) and discuss challenges (eg, getting all team members to the huddle).
Resources. The CoE staff schedule at least 20 huddles per week and coordinate preceptor and room schedules. The other required resources are clinic staff (RNs, LVNs, and MSAs) and exam rooms large enough to accommodate 8 or more people. Sufficient staffing coverage and staggered huddles also are important to allow cross-coverage for other clinical duties while team members and faculty are huddling.
Monitoring and Assessment. The CoE staff administer the Team Development Measure (TDM) twice yearly and a modified version of the TEAM 360 feedback survey once per year.6-9 The TDM member gages perceptions of team functioning (cohesiveness, communication, role clarity, and clarity of goals and means). Teams meet with a facilitator to debrief their TDM results and discuss ways to improve their team processes. Three-quarters of the way through the academic year, team members also complete the modified TEAM 360 survey on trainees. Each trainee receives a report describing his/her self-ratings and aggregate team member ratings on leadership, communication, interpersonal skills, and feedback.
Partnerships
In addition to CoEPCE staff and faculty support and engagement, huddles at SFVAHCS have benefited from partnerships with VA primary care leadership and with academic affiliates. In particular, support from the VA clinic directors and nurse managers was key to instituting changes to the clinics’ structure to include interprofessional trainees in huddles.
The affiliates—the University of California, San Francisco (UCSF) School of Medicine and School of Nursing—are integral partners and assist with NP student and medicine resident recruitment. These affiliates also participate in planning and refinement of CoEPCE curricular activities. The UCSF School of Nursing, School of Medicine, and Center for Faculty Educators were involved in the planning stages of the huddle model.
Challenges and Solutions
Having a staffing ratio that supports trainee participation in and learning through huddles is critical. Preceptor coverage must be in sufficient numbers to allow preceptors to coach the huddles, and clinical staff must be adequate to create cohesive and consistent teams for trainee providers. Clinic staff turnover and changes in teamlet staff can be very disruptive. Over time, teamlet staff often know key details and helpful contextual information about particular patients and clinic processes. This knowledge may be lost with turnover among teamlet staff. If team members miss huddles due to staffing shortages and clinical duties, there may be delays and errors in patient care. For example, if information discussed in the huddle is not relayed to the absent team member in a timely or accurate manner, care may be impacted. However, potential disruptions can be mitigated by a high-functioning team with strong communication skills and situational awareness who readily assist and distribute the workload.
Consistent huddling, huddle coaches, and checklists all help stabilize the group. Integration of trainees in the PACT team initially requires extra work because trainees are part-time and have panels significantly smaller than 1,200 (which means the teamlet staff are assigned to multiple trainee and provider huddles). However, teamlet staff find working with trainee teams personally rewarding, and developing highly functioning teams helps prevent burnout. Integration of pharmacy, psychology, and social work trainees takes time and thoughtful planning of activities and contributions that enhance team functioning while not overburdening trainees with additional responsibilities. If these other professions of health trainees are joining several teams’ huddles, their role may be to weigh in as needed vs preparing for and reviewing several PCPs’ schedules and patients in advance.
Factors for Success
The VA facility and primary care clinic leadership’s commitment to supporting staff participation in huddles was critical for integrating trainees into PACTs. Additionally, VA facility commitment to implementation of PACT was a key facilitating factor. Implementation of PACT, including huddles, has not been consistent at all VA facilities.10 The CoE’s approach to integrating trainees into the huddle was an opportunity to strengthen the huddle and to teach new staff members how to participate with team members in huddles. CoEPCE leadership, which has embraced change, meets regularly with facility leadership as well as an advisory board of UCSF leaders to update them on CoE activities. A critical factor for success was CoE expertise in interprofessional education and its ability to integrate concepts from the 4 core domains into an effective workplace learning experience, including attention to the physical space, scheduling, and the development and implementation of the huddle coach role and checklist.
Accomplishments and Benefits
There is evidence that SFVAHCS team huddles are achieving their goals and CoE trainees are being trained to provide team-based, patient-centered care to veterans. Key outcomes of the CoE’s approach to huddles include components in the next sections.
Interprofessional Educational Capacity. The CoEPCE faculty and staff consider the huddle to be one of the best ways to teach interprofessional communication and collaboration, team functioning, and clinical performance. Unlike a traditional didactic, classroom-based session on interprofessional collaboration, the huddle is an opportunity for health care professionals to work together to provide care in a clinic setting. It also is an activity in which the CoE has continued innovative activities, such as adding a preceptor huddle, incorporating additional professions, and encouraging panel management activities during huddles. The CoE has received significant interest and visibility and has been invited to share the model in numerous presentations.
Participants’ Knowledge, Attitudes, Skills, and Competencies. An aim of the CoE approach to huddles was to provide trainees with general skills in the core domain interprofessional collaboration, including teamwork and communication that transfer to other settings, such as inpatient teams and specialty clinics. Learning about other professions and their scopes of practice and areas of expertise can be helpful beyond huddles and primary care. Trainees also learn concepts and practices from the other core domains:
- Performance Improvement: The huddle is a venue for utilizing clinic metrics as well as focusing on QI projects that benefit from a team approach to solving problems;
- Sustained Relationships: The huddles support and teach the importance of relationships among the team. Trainees learn about the roles of clinic staff members, and clinic staff have more opportunities to interact with trainees and become comfortable with them, supporting coordinated care; and
- Shared Decision Making: The huddle is a venue for discussing options for providing patient decision-making support, such as discussing the pros and cons of colon cancer screening with a patient, improving patient-centered care.
Additionally, huddles can address differences in trainee clinical expertise. For example, new physician interns with less experience in the clinic receive more coaching on system resources and patient histories than they might otherwise. Nurse practitioner residents often participate in more than 1 huddle team and transition to a coaching role. 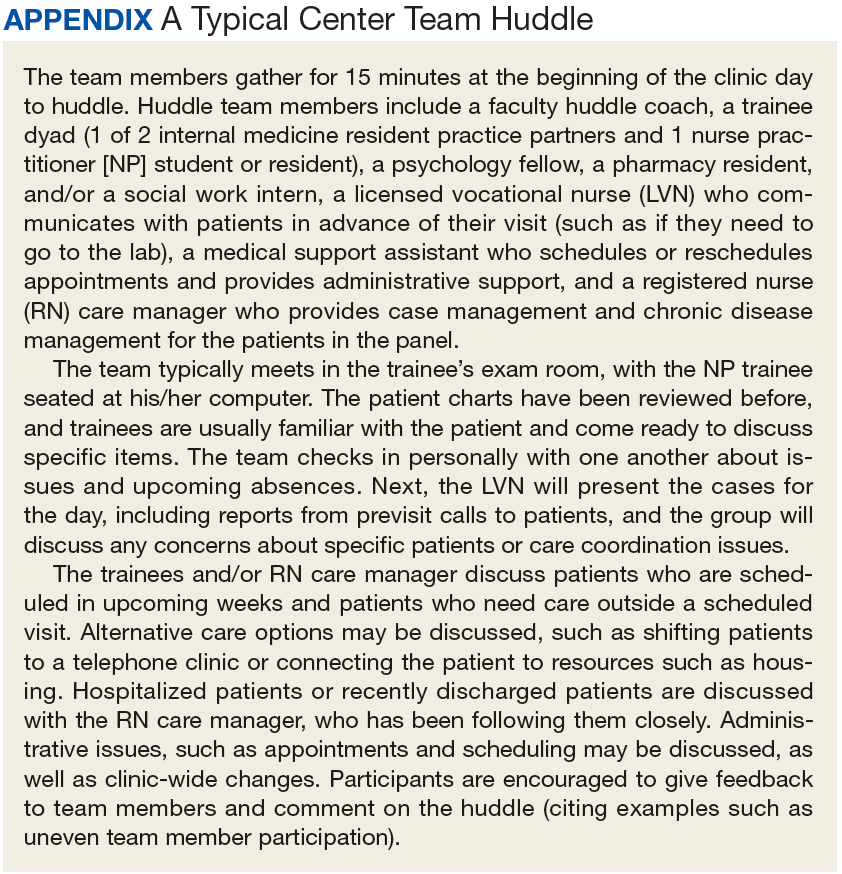
Sustained Relationships, Role Clarity, and Collaboration. The huddles are structured to facilitate SRs among trainees from different professions and among the PACT teamlet in detail as a team. The huddle increases team efficiency by educating trainees and staff about team member roles. For example, trainees learn how the LVNs and MSAs prepare for patient visits. Moreover, an opportunity exists to learn how provider and clinic staff expertise may overlap. Registered nurse care managers, who have their own hypertension clinics, can help manage a patient’s medication titration. Similarly, pharmacy trainees can suggest a referral for a complicated patient with diabetes to pharmacy clinic, where clinical pharmacists can adjust medications and provide patient education for hypertension, hyperlipidemia, and hyperglycemia. In this way, role clarity is improved and trainees learn how team members work within their scope of practice and are better able to “share the care.”
There is evidence that huddles have resulted in expanded participant interprofessional collaboration. The CoE administers the TDM twice a year and the huddle teams rate themselves on several dimensions—cohesiveness, communications, role clarity, and goals.6,7 The 2011/2012 findings showed that nearly all teams showed improvement, with the mean scores for all teams combined increasing from 59.4 in the fall to 64.6 in the spring (max score is 100).5 These scores increased again from 62.2 to 70.3 in 2012/2013, from 66.6 to 70.2 in 2013/2014, and from 64.6 to 69.9 in 2014/2015.
Expanding Clinical Knowledge. At the individual level, the huddle is an opportunity for a trainees to expand their clinical expertise in real time. The huddle provides exposure to a variety of patients and corresponding patient care needs. Trainees are encouraged to complete patient prerounds before the huddle in order to focus the huddle discussion on patients with chronic conditions, complex needs, recent hospitalizations, and upcoming appointments. The CoEPCE trainees tap into the expertise and experience of their team members and coach.
The clinic staff can get information from trainees about their plan of care while trainees get a more complete picture of a patient’s situation—for example, medical or social history or communication preferences. Additionally, trainees learn team skills, such as communication techniques and warm handoffs, which can be used in other clinical settings outside primary care and beyond the VA. As trainees advance, the huddle helps them learn to delegate appropriately, practice conflict negotiation, and develop leadership skills.
Participants’ Satisfaction With Interventions. There is qualitative evidence that clinic RNs and LVNs like huddles and appreciate having the opportunity to communicate in person with providers as well as to teach trainees how to work interprofessionally. Faculty members who are huddle coaches report that they develop a richer understanding of the skill set of trainees, information that can inform CoE curriculum design. Trainees appreciate the opportunity to develop relationships with team members. In end-of-year interviews, they describe their teams as their families, making them feel more connected to the clinic. They also enjoyed starting their day with familiar faces.
Primary Care Delivery System. The huddle is an important component of a system-wide transformation to provide team-based, patient-centered care to veterans. The efforts to strengthen and standardize the huddle have the potential to hasten this transformation while improving relationships and quality of care. Additionally, the CoE approach to integrating trainees into huddles has broader applicability and is being considered for adoption by other VA centers of excellence in primary care education.Primary Care Services. The huddle may contribute to efficiencies in a busy clinic setting. For example, the RN care manager can have upward of 1,200 patients on his/her panel and, between staff and trainees, as many as 12 health care providers with whom to communicate. The huddle strengthens the communications with providers and is an opportunity to touch base on the patients, coordinate care, and keep track of high-risk patients who might fall off the radar otherwise. The huddle is flexible and can occur with various clinic staff and providers. A 2-person huddle can occur between an RN and the primary provider. The QI projects that have been developed as a result of a huddle have improved clinic primary care services, such as completing opiate consents and urine toxicology or improving continuity through increased telephone clinic usage.Patient Outcomes. The huddle results in a more robust plan of care than might be developed by an individual provider who might not have time to consider options outside the individual’s scope of practice or expertise. While there are few clinical outcomes that are directly influenced by huddles alone, huddles may help indirectly improve patient outcomes on many fronts, including:
- Increased continuity of care because the patient now has a team focusing on care. At times throughout the day when team members cannot talk face to face with one another or with the patient, they know about the patient’s situation and are better able to establish a rapport when the patient calls or comes in for the visit. Trainees also become familiar with their practice partners’ patients, which allows them to ensure continuity when the patient’s primary trainee provider is out of clinic;
- Panel management and identifying and tracking sicker patients;
- Increased access, such as identifying patients who could receive care by a telephone visit, decreasing the number of no shows by making extra efforts to remind patients about appointments and improving follow up; and
- Improved population health outcomes from process improvements, such as the development of a process for having patients on opioids sign new contracts or identifying diabetics who might benefit from a group approach to care.
The Future
The huddle coach concept and checklist have been shared broadly and have applicability in other teaching settings where providers and clinic staff are learning how to implement huddles. A video and resources on “How to Huddle” are available at suzannecgordon.com/how-to-huddle/.
Under stage 2 of the CoEPCE program, the CoE will develop a huddle coaching program implementation kit composed of a huddle how-to guide and a coach training manual. The CoE team huddle is one of many VA huddles and an example of how the huddle continues to evolve. It is a versatile tool that can be used to focus on different topics and include different professions. Currently, it is being adapted to specialty care where there is large patient volume, such as cardiology and orthopedics.
1. Rugen KW, Watts SA, Janson SL, et al. Veteran Affairs Centers of Excellence in Primary Care Education: transforming nurse practitioner education. Nurs Outlook. 2014;62(2):78-88.
2. Chang A, Bowen JL, Buranosky RA, et al. Transforming primary care training--patient-centered medical home entrustable professional activities for internal medicine residents. J Gen Intern Med. 2013;28(6):801-809.
3. Zabar S, Adams J, Kurland S, et al. Charting a key competency domain: understanding resident physician interprofessional collaboration (IPC) skills. J Gen Intern Med. 2016;31(8):846-853.
4. Institute of Medicine. Measuring the Impact of Interprofessional Education (IPE) on Collaborative Practice and Patient Outcomes. Washington, DC: The National Academies Press; 2015.
5. Shunk R, Dulay M, Chou C, Janson S, O’Brien BC. Huddle-coaching: a dynamic intervention for trainees and staff to support team-based care. Acad Med. 2014;89(2):244-250.
6. Stock R, Mahoney E, Carney PA. Measuring team development in clinical care settings. Fam Med. 2013;45(10):691-700.
7. PeaceHealth. Team development measure. https://www.peacehealth.org/about-peacehealth/medical-professionals/eugene-springfield-cottage-grove/team-measure/Pages/measure. Accessed August 16, 2018.
8. American Board of Internal Medicine. Teamwork effectiveness assessment module. https://team.abim.org. Accessed August 16, 2018.
9. Chesluk BJ, Bernabeo E, Hess B, Lynn LA, Reddy S, Holmboe ES. A new tool to give hospitalists feedback to improve interprofessional teamwork and advance patient care. Health Aff (Millwood). 2012;31(11):2485-2492.
10. Rodriguez HP, Meredith LS, Hamilton AB, Yano EM, Rubenstein LV. Huddle up!: the adoption and use of structured team communication for VA medical home implementation. Health Care Manage Rev. 2015;40(4):286-299.
In short team huddles, trainees and PACT teamlets meet to coordinate care and identify ways to improve team processes under the guidance of faculty members who reinforce collaborative practice and continuous improvement.
In short team huddles, trainees and PACT teamlets meet to coordinate care and identify ways to improve team processes under the guidance of faculty members who reinforce collaborative practice and continuous improvement.
In 2011, 5 US Department of Veteran Affairs (VA) medical centers were selected by the VA Office of Academic Affiliations (OAA) to establish Centers of Excellence in Primary Care Education (CoEPCE). Part of the VA New Models of Care initiative, the 5 CoEPCEs (Boise, Cleveland, San Francisco, Seattle and West Haven) are utilizing VA primary care settings to develop and test innovative approaches to prepare physician residents, nurse practitioner (NP) students and residents (postgraduate), and other health professions trainees, such as pharmacy, social work, psychology, physician assistants (PAs), dieticians, etc for primary care practice.
The CoEPCEs are interprofessional academic patient aligned care teams (PACTs) defined by VA as a PACT that has at least 2 professions of trainees on the team engaged in learning.
The San Francisco VA Health Care System (SFVAHCS) Education in PACT (EdPACT)/CoEPCE developed and implemented a workplace learning model that embeds trainees into PACT teamlets and clinic workflow.1 Trainees are organized in practice partner triads with 2 second- or third-year internal medicine residents (R2s and R3s) and 1 NP student or resident. Physician residents rotate every 2 months between inpatient and outpatient settings and NP trainees are present continuously for 12 months. In this model, each trainee in the triad has his/her own patient panel and serves as a partner who delivers care to his/her partners’ patients when they are unavailable. Didactic sessions on clinical content and on topics related to the core domains occur 3-times weekly during pre- and postclinic conferences.2
Methods
In 2015, evaluators from the OAA reviewed background documents and conducted open-ended interviews with 9 CoEPCE staff, participating trainees, VA faculty, VA facility leadership, and affiliate faculty. Informants described their involvement, challenges encountered, and benefits of the huddle to participants, veterans, and the VA.
The Huddle
With the emphasis on patient-centered medical homes and team-based care in the Affordable Care Act, there is an urgent need to develop new training models that provide future health professionals with skills that support interprofessional communication and collaborative practice.2,3 A key aim of the CoEPCE is to expand workplace learning strategies and clinical opportunities for interprofessional trainees to work together as a team to anticipate and address the health care needs of veterans. Research suggests that patient care improves when team members develop a shared understanding of each other’s skill sets, care procedures, and values.4 In 2010, the SFVAHCS began phasing in VA-mandated PACTs. Each patient-aligned care teamlet serves about 1,200 patients and is composed of physician or NP primary care provider(s) (PCPs) and a registered nurse (RN) care manager, a licensed vocational nurse (LVN), and a medical support assistant (MSA). About every 3 teamlets also work with a profession-specific team member from the Social Work and Pharmacy departments. The implementation of PACT created an opportunity for the CoEPCE to add trainees of various professions to 13 preexisting PACTs in 3 SFVAHCS primary care clinics. This arrangement benefits both trainees and teamlets: trainees learn how to collaborate with clinic staff while the clinic PACT teamlets benefit from coaching by faculty skilled in team-based care.
As part of routine clinical activities, huddles provide opportunities for workplace learning related to coordination of care, building relationships, and developing a sense of camaraderie that is essential for team-based, patient-centered care. In their ideal state, huddles are “…the hub of interprofessional, team-based care”; they provide a venue where trainees can learn communication skills, team member roles, systems issues and resources, and clinical knowledge expected of full-time providers and staff.5 Embedding faculty in huddles as huddle coaches help ensure trainees are learning and applying these skills.
Planning and Implementation
After OAA funded the CoEPCE in 2011, faculty had 6 months to develop the EdPACT curriculum, which included a team building retreat, interactive didactic sessions, and workplace learning activities (ie, huddles). In July 2011, 10 trainee triads (each consisting of 2 physician residents and either a student NP or resident NP) were added to preexisting PACTs at the San Francisco VA Medical Center primary care clinic and 2 community-based outpatient clinics.
These trainee triads partnered with their PACT teamlets and huddled for 15 minutes at the beginning of each clinic day to plan for the day’s patients and future scheduled patients and to coordinate care needs for their panel of patients. CoEPCE staff built on this basic huddle model and made the following lasting modifications:
- Developed and implemented a huddle coach model and a huddle checklist to provide structure and feedback to the huddle (Online Resources);
- Scheduled huddles in NP student/resident’s exam room to reduce the hierarchy in the trainee triad;
- Incorporated trainees from other professions and levels into the huddle (psychology fellows, pharmacy residents, social work); and
- Linked the PACT teamlet (staff) to quality improvement projects that are discussed periodically in huddles and didactics.
Curriculum. The huddle allows for practical application of the 4 core domains: interprofessional collaboration (IPC), performance improvement (PI), sustained relationships (SR), and shared decision making (SDM) that shape the CoE curriculum.
Interprofessional collaboration (IPC) is the primary domain reinforced in the huddle. Trainees learn key content in half-day team retreats held at the beginning of the academic year and in interactive didactic sessions. These sessions, which draw on concepts from the Agency for Healthcare Research and Quality’s TeamSTEPPS, an evidence-based teamwork training program for health care workers, teach skills like closed-loop communication, check-backs, negotiation, and conflict resolution.
The CoE trainee triads also lead quality improvement (QI) projects, and the huddle is a venue for getting input, which reinforces the CoE’s performance improvement (PI) curriculum. For example, PACT teamlet staff members provide trainees with feedback on proposed QI interventions, such as increasing the use of telephone visits. The huddle supports SR among team members that enhance patient care while improving the quality of the clinic experience for team members. Strengthened communications and increased understanding of team member roles and system resources supports a patient-centered approach to care and lays the foundation for SDM between patients and team members.
Faculty Roles and Development. The CoEPCE physician and NP faculty members who precept and function as huddle coaches participate in monthly 2-hour faculty development sessions to address topics related to IPE. At least 1 session each year covers review of the items on the huddle checklist, tips on how to coach a huddle, discussions of the role of huddle coaches, and feedback and mentoring skills. Many huddle coach activities are inherent to clinical precepting, such as identifying appropriate clinical resources and answering clinical questions, but the core function of the huddle coach is to facilitate effective communication among team members.
Initially, a coach may guide the huddle by rounding up team members or directing the agenda of the huddle (ie, prompting the LVN to present the day’s patients and suggesting the group identify and discuss high-risk patients). As the year progresses, coaches often take a backseat, and the huddle may be facilitated by the trainees, the RN, LVN, or a combination of all members. During the huddle, coaches also may reinforce specific communication skills, such as a “check back” or ISBAR ( Identify who you are, describe the Situation, provide Background information, offer an Assessment of the situation/needs, make a Recommendation or Request)—skills that are taught during CoE didactic sessions.
The coach may call attention to particular feedback points, such as clarification of the order as an excellent example of a check-back. Each preceptor coaches 1 huddle per precepting session. After the teams huddle, preceptors do a smaller, shorter huddle in the precepting room to share successes, such as interprofessional trainees demonstrating backup behavior (eg, “in today’s huddle, I saw a great example of backup behavior when the medicine resident offered to show the NP student how to consent someone”) and discuss challenges (eg, getting all team members to the huddle).
Resources. The CoE staff schedule at least 20 huddles per week and coordinate preceptor and room schedules. The other required resources are clinic staff (RNs, LVNs, and MSAs) and exam rooms large enough to accommodate 8 or more people. Sufficient staffing coverage and staggered huddles also are important to allow cross-coverage for other clinical duties while team members and faculty are huddling.
Monitoring and Assessment. The CoE staff administer the Team Development Measure (TDM) twice yearly and a modified version of the TEAM 360 feedback survey once per year.6-9 The TDM member gages perceptions of team functioning (cohesiveness, communication, role clarity, and clarity of goals and means). Teams meet with a facilitator to debrief their TDM results and discuss ways to improve their team processes. Three-quarters of the way through the academic year, team members also complete the modified TEAM 360 survey on trainees. Each trainee receives a report describing his/her self-ratings and aggregate team member ratings on leadership, communication, interpersonal skills, and feedback.
Partnerships
In addition to CoEPCE staff and faculty support and engagement, huddles at SFVAHCS have benefited from partnerships with VA primary care leadership and with academic affiliates. In particular, support from the VA clinic directors and nurse managers was key to instituting changes to the clinics’ structure to include interprofessional trainees in huddles.
The affiliates—the University of California, San Francisco (UCSF) School of Medicine and School of Nursing—are integral partners and assist with NP student and medicine resident recruitment. These affiliates also participate in planning and refinement of CoEPCE curricular activities. The UCSF School of Nursing, School of Medicine, and Center for Faculty Educators were involved in the planning stages of the huddle model.
Challenges and Solutions
Having a staffing ratio that supports trainee participation in and learning through huddles is critical. Preceptor coverage must be in sufficient numbers to allow preceptors to coach the huddles, and clinical staff must be adequate to create cohesive and consistent teams for trainee providers. Clinic staff turnover and changes in teamlet staff can be very disruptive. Over time, teamlet staff often know key details and helpful contextual information about particular patients and clinic processes. This knowledge may be lost with turnover among teamlet staff. If team members miss huddles due to staffing shortages and clinical duties, there may be delays and errors in patient care. For example, if information discussed in the huddle is not relayed to the absent team member in a timely or accurate manner, care may be impacted. However, potential disruptions can be mitigated by a high-functioning team with strong communication skills and situational awareness who readily assist and distribute the workload.
Consistent huddling, huddle coaches, and checklists all help stabilize the group. Integration of trainees in the PACT team initially requires extra work because trainees are part-time and have panels significantly smaller than 1,200 (which means the teamlet staff are assigned to multiple trainee and provider huddles). However, teamlet staff find working with trainee teams personally rewarding, and developing highly functioning teams helps prevent burnout. Integration of pharmacy, psychology, and social work trainees takes time and thoughtful planning of activities and contributions that enhance team functioning while not overburdening trainees with additional responsibilities. If these other professions of health trainees are joining several teams’ huddles, their role may be to weigh in as needed vs preparing for and reviewing several PCPs’ schedules and patients in advance.
Factors for Success
The VA facility and primary care clinic leadership’s commitment to supporting staff participation in huddles was critical for integrating trainees into PACTs. Additionally, VA facility commitment to implementation of PACT was a key facilitating factor. Implementation of PACT, including huddles, has not been consistent at all VA facilities.10 The CoE’s approach to integrating trainees into the huddle was an opportunity to strengthen the huddle and to teach new staff members how to participate with team members in huddles. CoEPCE leadership, which has embraced change, meets regularly with facility leadership as well as an advisory board of UCSF leaders to update them on CoE activities. A critical factor for success was CoE expertise in interprofessional education and its ability to integrate concepts from the 4 core domains into an effective workplace learning experience, including attention to the physical space, scheduling, and the development and implementation of the huddle coach role and checklist.
Accomplishments and Benefits
There is evidence that SFVAHCS team huddles are achieving their goals and CoE trainees are being trained to provide team-based, patient-centered care to veterans. Key outcomes of the CoE’s approach to huddles include components in the next sections.
Interprofessional Educational Capacity. The CoEPCE faculty and staff consider the huddle to be one of the best ways to teach interprofessional communication and collaboration, team functioning, and clinical performance. Unlike a traditional didactic, classroom-based session on interprofessional collaboration, the huddle is an opportunity for health care professionals to work together to provide care in a clinic setting. It also is an activity in which the CoE has continued innovative activities, such as adding a preceptor huddle, incorporating additional professions, and encouraging panel management activities during huddles. The CoE has received significant interest and visibility and has been invited to share the model in numerous presentations.
Participants’ Knowledge, Attitudes, Skills, and Competencies. An aim of the CoE approach to huddles was to provide trainees with general skills in the core domain interprofessional collaboration, including teamwork and communication that transfer to other settings, such as inpatient teams and specialty clinics. Learning about other professions and their scopes of practice and areas of expertise can be helpful beyond huddles and primary care. Trainees also learn concepts and practices from the other core domains:
- Performance Improvement: The huddle is a venue for utilizing clinic metrics as well as focusing on QI projects that benefit from a team approach to solving problems;
- Sustained Relationships: The huddles support and teach the importance of relationships among the team. Trainees learn about the roles of clinic staff members, and clinic staff have more opportunities to interact with trainees and become comfortable with them, supporting coordinated care; and
- Shared Decision Making: The huddle is a venue for discussing options for providing patient decision-making support, such as discussing the pros and cons of colon cancer screening with a patient, improving patient-centered care.
Additionally, huddles can address differences in trainee clinical expertise. For example, new physician interns with less experience in the clinic receive more coaching on system resources and patient histories than they might otherwise. Nurse practitioner residents often participate in more than 1 huddle team and transition to a coaching role.
Sustained Relationships, Role Clarity, and Collaboration. The huddles are structured to facilitate SRs among trainees from different professions and among the PACT teamlet in detail as a team. The huddle increases team efficiency by educating trainees and staff about team member roles. For example, trainees learn how the LVNs and MSAs prepare for patient visits. Moreover, an opportunity exists to learn how provider and clinic staff expertise may overlap. Registered nurse care managers, who have their own hypertension clinics, can help manage a patient’s medication titration. Similarly, pharmacy trainees can suggest a referral for a complicated patient with diabetes to pharmacy clinic, where clinical pharmacists can adjust medications and provide patient education for hypertension, hyperlipidemia, and hyperglycemia. In this way, role clarity is improved and trainees learn how team members work within their scope of practice and are better able to “share the care.”
There is evidence that huddles have resulted in expanded participant interprofessional collaboration. The CoE administers the TDM twice a year and the huddle teams rate themselves on several dimensions—cohesiveness, communications, role clarity, and goals.6,7 The 2011/2012 findings showed that nearly all teams showed improvement, with the mean scores for all teams combined increasing from 59.4 in the fall to 64.6 in the spring (max score is 100).5 These scores increased again from 62.2 to 70.3 in 2012/2013, from 66.6 to 70.2 in 2013/2014, and from 64.6 to 69.9 in 2014/2015.
Expanding Clinical Knowledge. At the individual level, the huddle is an opportunity for a trainees to expand their clinical expertise in real time. The huddle provides exposure to a variety of patients and corresponding patient care needs. Trainees are encouraged to complete patient prerounds before the huddle in order to focus the huddle discussion on patients with chronic conditions, complex needs, recent hospitalizations, and upcoming appointments. The CoEPCE trainees tap into the expertise and experience of their team members and coach.
The clinic staff can get information from trainees about their plan of care while trainees get a more complete picture of a patient’s situation—for example, medical or social history or communication preferences. Additionally, trainees learn team skills, such as communication techniques and warm handoffs, which can be used in other clinical settings outside primary care and beyond the VA. As trainees advance, the huddle helps them learn to delegate appropriately, practice conflict negotiation, and develop leadership skills.
Participants’ Satisfaction With Interventions. There is qualitative evidence that clinic RNs and LVNs like huddles and appreciate having the opportunity to communicate in person with providers as well as to teach trainees how to work interprofessionally. Faculty members who are huddle coaches report that they develop a richer understanding of the skill set of trainees, information that can inform CoE curriculum design. Trainees appreciate the opportunity to develop relationships with team members. In end-of-year interviews, they describe their teams as their families, making them feel more connected to the clinic. They also enjoyed starting their day with familiar faces.
Primary Care Delivery System. The huddle is an important component of a system-wide transformation to provide team-based, patient-centered care to veterans. The efforts to strengthen and standardize the huddle have the potential to hasten this transformation while improving relationships and quality of care. Additionally, the CoE approach to integrating trainees into huddles has broader applicability and is being considered for adoption by other VA centers of excellence in primary care education.Primary Care Services. The huddle may contribute to efficiencies in a busy clinic setting. For example, the RN care manager can have upward of 1,200 patients on his/her panel and, between staff and trainees, as many as 12 health care providers with whom to communicate. The huddle strengthens the communications with providers and is an opportunity to touch base on the patients, coordinate care, and keep track of high-risk patients who might fall off the radar otherwise. The huddle is flexible and can occur with various clinic staff and providers. A 2-person huddle can occur between an RN and the primary provider. The QI projects that have been developed as a result of a huddle have improved clinic primary care services, such as completing opiate consents and urine toxicology or improving continuity through increased telephone clinic usage.Patient Outcomes. The huddle results in a more robust plan of care than might be developed by an individual provider who might not have time to consider options outside the individual’s scope of practice or expertise. While there are few clinical outcomes that are directly influenced by huddles alone, huddles may help indirectly improve patient outcomes on many fronts, including:
- Increased continuity of care because the patient now has a team focusing on care. At times throughout the day when team members cannot talk face to face with one another or with the patient, they know about the patient’s situation and are better able to establish a rapport when the patient calls or comes in for the visit. Trainees also become familiar with their practice partners’ patients, which allows them to ensure continuity when the patient’s primary trainee provider is out of clinic;
- Panel management and identifying and tracking sicker patients;
- Increased access, such as identifying patients who could receive care by a telephone visit, decreasing the number of no shows by making extra efforts to remind patients about appointments and improving follow up; and
- Improved population health outcomes from process improvements, such as the development of a process for having patients on opioids sign new contracts or identifying diabetics who might benefit from a group approach to care.
The Future
The huddle coach concept and checklist have been shared broadly and have applicability in other teaching settings where providers and clinic staff are learning how to implement huddles. A video and resources on “How to Huddle” are available at suzannecgordon.com/how-to-huddle/.
Under stage 2 of the CoEPCE program, the CoE will develop a huddle coaching program implementation kit composed of a huddle how-to guide and a coach training manual. The CoE team huddle is one of many VA huddles and an example of how the huddle continues to evolve. It is a versatile tool that can be used to focus on different topics and include different professions. Currently, it is being adapted to specialty care where there is large patient volume, such as cardiology and orthopedics.
1. Rugen KW, Watts SA, Janson SL, et al. Veteran Affairs Centers of Excellence in Primary Care Education: transforming nurse practitioner education. Nurs Outlook. 2014;62(2):78-88.
2. Chang A, Bowen JL, Buranosky RA, et al. Transforming primary care training--patient-centered medical home entrustable professional activities for internal medicine residents. J Gen Intern Med. 2013;28(6):801-809.
3. Zabar S, Adams J, Kurland S, et al. Charting a key competency domain: understanding resident physician interprofessional collaboration (IPC) skills. J Gen Intern Med. 2016;31(8):846-853.
4. Institute of Medicine. Measuring the Impact of Interprofessional Education (IPE) on Collaborative Practice and Patient Outcomes. Washington, DC: The National Academies Press; 2015.
5. Shunk R, Dulay M, Chou C, Janson S, O’Brien BC. Huddle-coaching: a dynamic intervention for trainees and staff to support team-based care. Acad Med. 2014;89(2):244-250.
6. Stock R, Mahoney E, Carney PA. Measuring team development in clinical care settings. Fam Med. 2013;45(10):691-700.
7. PeaceHealth. Team development measure. https://www.peacehealth.org/about-peacehealth/medical-professionals/eugene-springfield-cottage-grove/team-measure/Pages/measure. Accessed August 16, 2018.
8. American Board of Internal Medicine. Teamwork effectiveness assessment module. https://team.abim.org. Accessed August 16, 2018.
9. Chesluk BJ, Bernabeo E, Hess B, Lynn LA, Reddy S, Holmboe ES. A new tool to give hospitalists feedback to improve interprofessional teamwork and advance patient care. Health Aff (Millwood). 2012;31(11):2485-2492.
10. Rodriguez HP, Meredith LS, Hamilton AB, Yano EM, Rubenstein LV. Huddle up!: the adoption and use of structured team communication for VA medical home implementation. Health Care Manage Rev. 2015;40(4):286-299.
Escalating MTX appears superior for T-ALL
Escalating methotrexate (MTX) may produce better outcomes than high-dose MTX in children and young adults with T-cell acute lymphoblastic leukemia (T-ALL), according to research published in the Journal of Clinical Oncology.
Researchers compared escalating and high-dose MTX given with the augmented Berlin-Frankfurt-Munster regimen in patients with T-ALL.
Disease-free survival (DFS) and overall survival (OS) rates were significantly higher among patients who received escalating MTX.
The improved survival outcomes in this trial, AALL0434, are the “opposite effect” of what was observed in a parallel trial, AALL0232. In that trial, high-dose MTX was superior to the escalating strategy in patients with B-cell acute lymphoblastic leukemia (B-ALL).
The parallel trial design was used because of the known differences between T-ALL and B-ALL in sensitivity to MTX and pegaspargase, according to investigator Stuart S. Winter, MD, of Children’s Minnesota Minneapolis Hospital, and his coauthors.
The AALL0434 study included 1,031 T-ALL patients between 1 and 31 years of age without CNS3 disease or testicular leukemia. They were randomized to post-induction therapy that included either escalating intravenous MTX or high-dose MTX.
The escalating regimen was superior to high-dose MTX, according to investigators.
The 5-year DFS rate was 91.5% with escalating MTX and 85.3% with high-dose MTX (P=0.005). The 5-year OS rate was 93.7% and 89.4%, respectively (P=0.036).
In contrast, the parallel AALL0232 study of B-ALL patients showed that high-dose MTX produced superior 5-year event-free survival and OS. This led Dr. Winter and his colleagues to speculate on how the findings could be reconciled.
Neither trial was a strict comparison of two different MTX schedules, due to differences in doses of pegaspargase, mercaptopurine, and vincristine between arms, as well as differences in the timing of cranial radiation therapy.
Of note, patients randomized to escalated MTX had two additional doses of pegaspargase. Enhanced asparagine depletion in that arm may have prevented relapse events, the investigators said.
They also said differences in adherence could have played a role, as the cost and time burden of the escalating MTX approach are “substantially less” than the high-dose approach.
The AALL0434 trial also included a second randomization to an addition of five, 6-day cycles of nelarabine versus no nelarabine. Results of that randomization, reported earlier this year, showed that nelarabine improved DFS.
AALL0434 was supported by grants from the National Institutes of Health and by St. Baldrick’s Foundation. Dr. Winter reported relationships with Amgen and Jazz Pharmaceuticals. His coauthors reported relationships with Novo Nordisk, Tandem, Pfizer, Novartis, and TypeZero Technologies, among others.
CAR T-cell therapy will soon be available in England, NHS says
The National Health Service (NHS) of England has announced that tisagenlecleucel (Kymriah®), a chimeric antigen receptor (CAR) T-cell therapy, will soon be available for certain leukemia patients.
Tisagenlecleucel will be made available through the Cancer Drugs Fund, and patients could potentially begin receiving the treatment within weeks.
NHS England struck a deal with Novartis to lower the price of tisagenlecleucel, which costs around £282,000 per patient at its full list price. The discount offered to the NHS is confidential.
Tisagenlecleucel was recently approved by the European Commission (EC) to treat patients up to 25 years of age who have B-cell acute lymphoblastic leukemia (ALL) that is refractory, in relapse post-transplant, or in second or later relapse.
The EC also approved tisagenlecleucel to treat adults with relapsed or refractory diffuse large B-cell lymphoma (DLBCL) who have received two or more lines of systemic therapy.
However, tisagenlecleucel will only be available for ALL patients in England, at least initially. A decision has not been made regarding funding for tisagenlecleucel in DLBCL, and Novartis previously decided to launch tisagenlecleucel in ALL first.
“It’s fantastic news for children and young people with this form of leukemia that CAR T-cell therapy will be made available on the NHS, making them the first in Europe to have routine access to this exciting new type of immunotherapy,” said Charles Swanton, Cancer Research UK’s chief clinician.
The first three NHS hospitals to go through the international accreditation process for the provision of tisagenlecleucel are in London, Manchester, and Newcastle. Subject to passing accreditation requirements, the first treatments could begin in a matter of weeks.
Another CAR T-cell therapy, axicabtagene ciloleucel (Yescarta®), has not fared as well as tisagenlecleucel. The National Institute for Health and Care Excellence (NICE) recently issued a draft guidance recommending against the use of axicabtagene ciloleucel in England.
Axicabtagene ciloleucel was approved by the EC to treat patients with relapsed/refractory DLBCL or primary mediastinal B-cell lymphoma who have received two or more lines of systemic therapy.
However, NICE said it isn’t clear how much of a benefit axicabtagene ciloleucel may provide over salvage chemotherapy. NICE also said the price of axicabtagene ciloleucel is too high for the therapy to be considered a cost-effective use of NHS resources, and axicabtagene ciloleucel does not meet the criteria for inclusion in the Cancer Drugs Fund.
Humans may have more HSCs than we thought

Humans may have ten times more hematopoietic stem cells (HSCs) than previously thought, according to research published in Nature.
Researchers developed a new approach for studying HSCs and found evidence suggesting that HSC numbers increase rapidly through childhood, reach a plateau by adolescence, and remain relatively constant throughout adulthood.
“We discovered that healthy adults have between 50,000 and 200,000 blood stem cells, which is about ten times more than previously thought,” said study author Peter Campbell, PhD, of the Wellcome Trust Sanger Institute in Hinxton, UK.
“Whereas previous estimates of blood stem cell numbers were extrapolated from studies in mice, cats, or monkeys, this is the first time stem cell numbers have been directly quantified in humans. This new approach opens up avenues into studying stem cells in other human organs and how they change between health and disease, and as we age.”
For this study, Dr Campbell and his colleagues conducted whole-genome sequencing on hematopoietic stem and progenitor colonies from a healthy 59 year-old man. The team adapted a capture-recapture* method to “tag” stem cells and compare them to the population of blood cells.
Specifically, in the “capture” phase, the researchers isolated individual hematopoietic stem and progenitor cells from a bone marrow aspirate and peripheral blood draw from the male subject. The cells were expanded, and the researchers performed whole-genome sequencing on 198 colonies to identify somatic mutations.
In the “recapture” phase, the researchers isolated bulk populations of mature peripheral blood cells from the subject—granulocytes at three time points and B and T lymphocytes at one time point. The team then performed deep, targeted sequencing on these bulk populations.
“The mutations act like barcodes, each of which uniquely tags a stem cell and its descendants,” said study author Henry Lee-Six, of the Wellcome Trust Sanger Institute.
“We then looked for these mutations in the rest of the blood to see what fraction of blood cells carry the same barcodes, and, from this, we could estimate how many stem cells there were in total.”
The researchers’ results suggested the number of HSCs actively contributing to circulating granulocytes at any one time was in the range of 44,000 to 215,000.
The team also estimated that the time between successive self-renewal HSC divisions is likely in the range of 2 to 20 months.
Finally, the researchers observed signs of “rapid” HSC population expansion during early life, which reaches a relatively stable plateau by late childhood or early adolescence that continues into adulthood.
The team said this stability suggests that symmetric self-renewal divisions (when one HSC divides into two) are balanced by HSC death, senescence, and symmetric divisions into committed progenitors.
*Capture-recapture is commonly used in ecology to estimate a species’ population size. A portion of the population is captured, tagged, and released. Later, another portion is captured, and the number of tagged individuals within the sample is counted. Since the number of marked individuals within the second sample should be proportional to the number of marked individuals in the whole population, an estimate of the total population size can be obtained by dividing the number of marked individuals by the proportion of marked individuals in the second sample.
Growing spot on face

The FP suspected melanoma and recommended immediate biopsy. The patient consented, and the physician performed a broad shave biopsy that included most of the pigmented lesion. Pathology revealed a lentigo maligna melanoma with a Breslow depth of 0.3 mm.
Lentigo maligna melanoma occurs in 4% to 15% of cutaneous melanomas. It’s similar to the superficial spreading type and appears as a flat (or mildly elevated) mottled tan, brown, or dark-brown discoloration. This type of melanoma is found most often in the elderly and arises on chronically sun-exposed, damaged skin on the face, ears, arms, and upper trunk. The average age of onset is 65 years and it grows slowly over 5 to 20 years.
When melanoma is suspected, it’s best to provide a specimen with adequate depth and breadth. Unfortunately, choosing the darkest and most raised area does not guarantee the correct diagnosis in a partial biopsy.
In cases of suspected lentigo maligna melanoma on the face, a broad shave provides a better sample than a punch biopsy. The broad shave biopsy (also known as saucerization) is best performed with a razor blade. (See the Watch & Learn video on “Shave biopsy.”)
In this case, the relatively small size of the lesion and the high risk for melanoma would make an elliptical excisional biopsy a good alternative. The saucerization has the advantage of being quick and easy to perform so that it can be done on the day that the melanoma is suspected.
This patient was referred for Mohs surgery for complete excision and repair. A sentinel lymph node biopsy was not indicated, and the prognosis for this stage Ia melanoma was relatively good.
Photos and text for Photo Rounds Friday courtesy of Richard P. Usatine, MD. This case was adapted from: Mayeaux, EJ, Usatine, R. Lentigo maligna. In: Usatine R, Smith M, Mayeaux EJ, et al. Color Atlas of Family Medicine. 2nd ed. New York, NY: McGraw-Hill; 2013:981-984.
To learn more about the Color Atlas of Family Medicine, see: www.amazon.com/Color-Family-Medicine-Richard-Usatine/dp/0071769641/.
You can now get the second edition of the Color Atlas of Family Medicine as an app by clicking on this link: usatinemedia.com.

It takes guts to be mentally ill: Microbiota and psychopathology
What is the largest endocrine organ in the human body?
Here is a clue: It is also the largest immune organ in humans!
Still scratching your head? Here is another clue: This organ also contains a “second brain,” which is connected to big brain inside the head by the vagus nerve.
Okay, enough guessing: It’s the 30-foot long gastrointestinal (GI) tract, which is generally associated only with eating and digestion. But it is far more than a digestive tract. It is home to about 100 trillion diverse bacteria, including 1,000 known species, which together are known as “microbiota.” Its combined DNA is called the “microbiome” and is 10,000% larger than the human genome. Those trillions of bacteria in our guts are a symbiotic (commensal) organ that is vital for the normal functions of the human body.1
While this vast array of microorganisms is vital to sustaining a healthy human existence, it can also be involved in multiple psychiatric disorders, including depression, psychosis, anxiety, autism, and attention-deficit/hyperactivity disorder (ADHD). Humans acquire their unique sets of microbiota as they pass through the mother’s vagina at birth and while breastfeeding, as well as from exposure to various environmental sources in the first few months of life.2
The microbiota in the GI tract are an intimate neighbor of the “enteric brain,” comprised of 100 million neurons plus glia-like support cell structures. This “second brain” produces over 30 neurotransmitters, several of which (dopamine, serotonin, γ-aminobutyric acid [GABA], acetylcholine) have been implicated in major psychiatric disorders.3
The brain and gut have a dynamic bidirectional communication system, mediated by neural, hormonal, and immunological crosstalk and influences. The GI tract secretes dozens of peptides and other signaling molecules that influence the brain. The microbiota also interact with and are regulated by gut hormones such as oxytocin, ghrelin, neuropeptide Y, cholecystokinin, corticotrophin-releasing factor, and pancreatic polypeptide.4 The microbiota modulate brain development, functions, and behavior, and maintain the intestinal barrier, which, if disrupted, would result in the gut becoming “leaky” and triggering low-grade inflammation such as that associated with depression.5
Continue to: But don't overlook the importance of...
But don’t overlook the importance of diet. It is a major factor in shaping the composition of the microbiota. What we eat can have a preventative or reparative effect on neuroimmune or neuroinflammatory disease. An emerging body of evidence suggests that the diet and its effects on the gut microbiota can modify a person’s genes by epigenetic mechanisms (altering DNA methylation and histone effects). Probiotics can exert epigenetic effects by influencing cytokines, by producing short-chain fatty acids (SCFAs), by vitamin synthesis, and by producing several well-known neurotransmitters.6
The bidirectional trafficking across the microbiome-gut-brain axis includes reciprocal effects. The brain influences the microbiome composition by regulating satiety, the hypothalamic-pituitary axis, and with neuropeptides.7 In return, the microbiome conveys information to the brain about the intestinal status via infectious agents, intestinal neurotransmitters and modulators, cytokines, sensory vagal fibers, and various metabolites. Failure of these normal interactions can lead to a variety of pathological processes, including inflammatory, autoimmune, degenerative, metabolic, cognitive, mood, and behavioral adverse effects. Therapeutic interventions for these adverse consequences can be implemented through microbiome manipulations (such as fecal transplants), nutritional strategies, and reinforcement of the enteric and brain barriers.
Alterations in the microbiota, such as by the intake of antibiotics or by intestinal inflammation, can lead to psychiatric disorders.8 The following findings link gut microbiome disruptions with several psychiatric disorders:
Schizophrenia prodrome. Fecal bacteria show an increase in SCFAs, which can activate microglia (the initial step in triggering psychosis).9 These bacteria have been shown to lead to an increase in choline levels in the anterior cingulate, a known biomarker for membrane dysfunction, which is one of the biological models of schizophrenia.
Schizophrenia—first-episode. A recent study reported abnormalities in the gut microbiota of patients with first-episode psychosis, with a lower number of certain fecal bacteria (including bifidobacterium, E. coli, and lactobacillus) and high levels of Clostridium coccoides. After 6 months of risperidone treatment, the above changes were reversed.10
Continue to: Another study of fecal microbiota...
Another study of fecal microbiota in a first-episode psychosis cohort found significant differences in several bacterial strains compared with a healthy control group, and those with the strongest difference had more severe psychotic symptoms and poorer response after 12 months of antipsychotic treatment.11
Autism has been linked to increased microbiota diversity, and an excess of bacteroides has been associated with a higher diversity of autism. Fecal samples from autistic children were reported to have an increase in SCFAs. Interestingly, a certain strain of lactobacillus can modulate oxytocin or reverse some autistic symptoms.
Depression has been associated with increased diversity of microbiota alpha. Patients with depression have been reported to have low numbers of bifidobacterium
ADHD. Some studies suggest that ADHD may be linked to factors that can alter gut microbiota, including birthing mode, type of infant feeding, maternal health, and early stressors. In addition, dietary influences on gut microbiota can modify ADHD symptoms.14
Alzheimer’s disease. Metabolic dysregulation, such as obesity and diabetes, can inflame the gut microbiota, and are known risk factors for Alzheimer’s disease.15
Continue to: Irritable bowel sydrome...
Irritable bowel syndrome (IBS). Fecal microbiota transplantation has been shown to improve IBS by increasing the diversity of gut microbiota.16 It also improves patients’ mood, not just their IBS symptoms.
Alcohol use. Both alcohol consumption and alcohol withdrawal have been shown to cause immune dysregulation in the brain leading to neuroinflammation. This is attributed to the alteration in the composition of the microbiome (dysbiosis), which has a negative effect on the microbe-host homeostasis.17
The discovery of microbiome-gut-brain interactions and their bidirectional immune, endocrine, and neurotransmitter effects has been a momentous paradigm shift in health, neuroscience, and psychiatry.18 It has opened wide vistas of research for potential innovations in the prevention and treatment of various psychiatric disorders. Radical medical interventions that were previously inconceivable, such as fecal transplantation,19 are an example of the bold insights this new field of microbiome-gut-brain interaction is bringing to the landscape of medicine, including psychiatry. It has also highlighted the previously underappreciated importance of nutrition in health and disease.20
1. Nasrallah HA. Psychoneurogastroenterology: the abdominal brain, the microbiome, and psychiatry. Current Psychiatry. 2015;14(5):10-11.
2. Dinan TG, Borre YE, Cryan JF. Genomics of schizophrenia: time to consider the gut microbiome? Mol Psychiatry. 2014;19(12):1252-1257.
3. Alam R, Abdolmaleky HM, Zhou JR. Microbiome, inflammation, epigenetic alterations, and mental diseases. Am J Med Genet B Neuropsychiatr Genet. 2017;174(6):651-660.
4. Lach G, Schellekens H, Dinan TG, et al. Anxiety, depression, and the microbiome: a role for gut peptides. Neurotherapeutics. 2018;15(1):36-59.
5. Kelly JR, Kennedy PJ, Cryan JF, et al. Breaking down the barriers: the gut microbiome, intestinal permeability and stress-related psychiatric disorders. Front Cell Neurosci. 2015;9:392.
6. Rodrigues-Amorim D, Rivera-Baltanás T, Regueiro B, et al. The role of the gut microbiota in schizophrenia: current and future perspectives. World J Biol Psychiatry. 2018;21:1-15.
7. Petra AI, Panagiotidou S, Hatziagelaki E, et al. Gut-microbiota-brain axis and its effect on neuropsychiatric disorders with suspected immune dysregulation. Clin Ther. 2015;37(5):984-995.
8. Lurie I, Yang YX, Haynes K, et al. Antibiotic exposure and the risk for depression, anxiety, or psychosis: a nested case-control study. J Clin Psychiatry. 2015;76(11):1522-1528.
9. He Y, Kosciolek T, Tang J, et al. Gut microbiome and magnetic resonance spectroscopy study of subjects at ultra-high risk for psychosis may support the membrane hypothesis. Eur Psychiatry. 2018;53:37-45.
10. Yuan X, Zhang P, Wang Y, et al. Changes in metabolism and microbiota after 24-week risperidone treatment in drug naïve, normal weight patients with first episode schizophrenia. Schizophr Res. 2018;pii: S0920-9964(18)30274-3. [Epub ahead of print]. doi: 10.1016/j.schres.2018.05.017.
11. Dickerson F, Severance E, Yolken R. The microbiome, immunity, and schizophrenia and bipolar disorder. Brain Behav Immun. 2017;62:46-52.
12. Huang R, Wang K, Hu J. Effect of probiotics on depression: a systematic review and meta-analysis of randomized controlled trials. Nutrients. 2016;8(8):pii: E483. doi: 10.3390/nu8080483.
13. Carding S, Verbeke K, Vipond DT, et al. Dysbiosis of the gut microbiota in disease. Microb Ecol Health Dis. 2015;26:26191. doi: 10.3402/mehd.v26.26191.
14. Thapar A, Cooper M, Eyre O, et al. Practitioner review: what have we learnt about the causes of ADHD? J Child Psychol Psychiatry. 2013;54(1):3-16.
15. Jiang C, Li G, Huang P, et al. The gut microbiota and Alzheimer’s disease. J Alzheimers Dis. 2017;58(1):1-15.
16. Kurokawa S, Kishimoto T, Mizuno S, et al. The effect of fecal microbiota transplantation on psychiatric symptoms among patients with irritable bowel syndrome, functional diarrhea and functional constipation: an open-label observational study. J Affect Disord. 2018;235:506-512.
17. Hillemacher T, Bachmann O, Kahl KG, et al. Alcohol, microbiome, and their effect on psychiatric disorders. Prog Neuropsychopharmacol Biol Psychiatry. 2018;85:105-115.
18. Doré J, Multon MC, Béhier JM; participants of Giens XXXII, Round Table No. 2. The human gut microbiome as source of innovation for health: which physiological and therapeutic outcomes could we expect? Therapie. 2017;72(1):21-38.
19. Vemuri RC, Gundamaraju R, Shinde T, et al. Therapeutic interventions for gut dysbiosis and related disorders in the elderly: antibiotics, probiotics or faecal microbiota transplantation? Benef Microbes. 2017;8(2):179-192.
20. Lombardi VC, De Meirleir KL, Subramanian K, et al. Nutritional modulation of the intestinal microbiota; future opportunities for the prevention and treatment of neuroimmune and neuroinflammatory disease. J Nutr Biochem. 2018;61:1-16.
What is the largest endocrine organ in the human body?
Here is a clue: It is also the largest immune organ in humans!
Still scratching your head? Here is another clue: This organ also contains a “second brain,” which is connected to big brain inside the head by the vagus nerve.
Okay, enough guessing: It’s the 30-foot long gastrointestinal (GI) tract, which is generally associated only with eating and digestion. But it is far more than a digestive tract. It is home to about 100 trillion diverse bacteria, including 1,000 known species, which together are known as “microbiota.” Its combined DNA is called the “microbiome” and is 10,000% larger than the human genome. Those trillions of bacteria in our guts are a symbiotic (commensal) organ that is vital for the normal functions of the human body.1
While this vast array of microorganisms is vital to sustaining a healthy human existence, it can also be involved in multiple psychiatric disorders, including depression, psychosis, anxiety, autism, and attention-deficit/hyperactivity disorder (ADHD). Humans acquire their unique sets of microbiota as they pass through the mother’s vagina at birth and while breastfeeding, as well as from exposure to various environmental sources in the first few months of life.2
The microbiota in the GI tract are an intimate neighbor of the “enteric brain,” comprised of 100 million neurons plus glia-like support cell structures. This “second brain” produces over 30 neurotransmitters, several of which (dopamine, serotonin, γ-aminobutyric acid [GABA], acetylcholine) have been implicated in major psychiatric disorders.3
The brain and gut have a dynamic bidirectional communication system, mediated by neural, hormonal, and immunological crosstalk and influences. The GI tract secretes dozens of peptides and other signaling molecules that influence the brain. The microbiota also interact with and are regulated by gut hormones such as oxytocin, ghrelin, neuropeptide Y, cholecystokinin, corticotrophin-releasing factor, and pancreatic polypeptide.4 The microbiota modulate brain development, functions, and behavior, and maintain the intestinal barrier, which, if disrupted, would result in the gut becoming “leaky” and triggering low-grade inflammation such as that associated with depression.5
Continue to: But don't overlook the importance of...
But don’t overlook the importance of diet. It is a major factor in shaping the composition of the microbiota. What we eat can have a preventative or reparative effect on neuroimmune or neuroinflammatory disease. An emerging body of evidence suggests that the diet and its effects on the gut microbiota can modify a person’s genes by epigenetic mechanisms (altering DNA methylation and histone effects). Probiotics can exert epigenetic effects by influencing cytokines, by producing short-chain fatty acids (SCFAs), by vitamin synthesis, and by producing several well-known neurotransmitters.6
The bidirectional trafficking across the microbiome-gut-brain axis includes reciprocal effects. The brain influences the microbiome composition by regulating satiety, the hypothalamic-pituitary axis, and with neuropeptides.7 In return, the microbiome conveys information to the brain about the intestinal status via infectious agents, intestinal neurotransmitters and modulators, cytokines, sensory vagal fibers, and various metabolites. Failure of these normal interactions can lead to a variety of pathological processes, including inflammatory, autoimmune, degenerative, metabolic, cognitive, mood, and behavioral adverse effects. Therapeutic interventions for these adverse consequences can be implemented through microbiome manipulations (such as fecal transplants), nutritional strategies, and reinforcement of the enteric and brain barriers.
Alterations in the microbiota, such as by the intake of antibiotics or by intestinal inflammation, can lead to psychiatric disorders.8 The following findings link gut microbiome disruptions with several psychiatric disorders:
Schizophrenia prodrome. Fecal bacteria show an increase in SCFAs, which can activate microglia (the initial step in triggering psychosis).9 These bacteria have been shown to lead to an increase in choline levels in the anterior cingulate, a known biomarker for membrane dysfunction, which is one of the biological models of schizophrenia.
Schizophrenia—first-episode. A recent study reported abnormalities in the gut microbiota of patients with first-episode psychosis, with a lower number of certain fecal bacteria (including bifidobacterium, E. coli, and lactobacillus) and high levels of Clostridium coccoides. After 6 months of risperidone treatment, the above changes were reversed.10
Continue to: Another study of fecal microbiota...
Another study of fecal microbiota in a first-episode psychosis cohort found significant differences in several bacterial strains compared with a healthy control group, and those with the strongest difference had more severe psychotic symptoms and poorer response after 12 months of antipsychotic treatment.11
Autism has been linked to increased microbiota diversity, and an excess of bacteroides has been associated with a higher diversity of autism. Fecal samples from autistic children were reported to have an increase in SCFAs. Interestingly, a certain strain of lactobacillus can modulate oxytocin or reverse some autistic symptoms.
Depression has been associated with increased diversity of microbiota alpha. Patients with depression have been reported to have low numbers of bifidobacterium
ADHD. Some studies suggest that ADHD may be linked to factors that can alter gut microbiota, including birthing mode, type of infant feeding, maternal health, and early stressors. In addition, dietary influences on gut microbiota can modify ADHD symptoms.14
Alzheimer’s disease. Metabolic dysregulation, such as obesity and diabetes, can inflame the gut microbiota, and are known risk factors for Alzheimer’s disease.15
Continue to: Irritable bowel sydrome...
Irritable bowel syndrome (IBS). Fecal microbiota transplantation has been shown to improve IBS by increasing the diversity of gut microbiota.16 It also improves patients’ mood, not just their IBS symptoms.
Alcohol use. Both alcohol consumption and alcohol withdrawal have been shown to cause immune dysregulation in the brain leading to neuroinflammation. This is attributed to the alteration in the composition of the microbiome (dysbiosis), which has a negative effect on the microbe-host homeostasis.17
The discovery of microbiome-gut-brain interactions and their bidirectional immune, endocrine, and neurotransmitter effects has been a momentous paradigm shift in health, neuroscience, and psychiatry.18 It has opened wide vistas of research for potential innovations in the prevention and treatment of various psychiatric disorders. Radical medical interventions that were previously inconceivable, such as fecal transplantation,19 are an example of the bold insights this new field of microbiome-gut-brain interaction is bringing to the landscape of medicine, including psychiatry. It has also highlighted the previously underappreciated importance of nutrition in health and disease.20
1. Nasrallah HA. Psychoneurogastroenterology: the abdominal brain, the microbiome, and psychiatry. Current Psychiatry. 2015;14(5):10-11.
2. Dinan TG, Borre YE, Cryan JF. Genomics of schizophrenia: time to consider the gut microbiome? Mol Psychiatry. 2014;19(12):1252-1257.
3. Alam R, Abdolmaleky HM, Zhou JR. Microbiome, inflammation, epigenetic alterations, and mental diseases. Am J Med Genet B Neuropsychiatr Genet. 2017;174(6):651-660.
4. Lach G, Schellekens H, Dinan TG, et al. Anxiety, depression, and the microbiome: a role for gut peptides. Neurotherapeutics. 2018;15(1):36-59.
5. Kelly JR, Kennedy PJ, Cryan JF, et al. Breaking down the barriers: the gut microbiome, intestinal permeability and stress-related psychiatric disorders. Front Cell Neurosci. 2015;9:392.
6. Rodrigues-Amorim D, Rivera-Baltanás T, Regueiro B, et al. The role of the gut microbiota in schizophrenia: current and future perspectives. World J Biol Psychiatry. 2018;21:1-15.
7. Petra AI, Panagiotidou S, Hatziagelaki E, et al. Gut-microbiota-brain axis and its effect on neuropsychiatric disorders with suspected immune dysregulation. Clin Ther. 2015;37(5):984-995.
8. Lurie I, Yang YX, Haynes K, et al. Antibiotic exposure and the risk for depression, anxiety, or psychosis: a nested case-control study. J Clin Psychiatry. 2015;76(11):1522-1528.
9. He Y, Kosciolek T, Tang J, et al. Gut microbiome and magnetic resonance spectroscopy study of subjects at ultra-high risk for psychosis may support the membrane hypothesis. Eur Psychiatry. 2018;53:37-45.
10. Yuan X, Zhang P, Wang Y, et al. Changes in metabolism and microbiota after 24-week risperidone treatment in drug naïve, normal weight patients with first episode schizophrenia. Schizophr Res. 2018;pii: S0920-9964(18)30274-3. [Epub ahead of print]. doi: 10.1016/j.schres.2018.05.017.
11. Dickerson F, Severance E, Yolken R. The microbiome, immunity, and schizophrenia and bipolar disorder. Brain Behav Immun. 2017;62:46-52.
12. Huang R, Wang K, Hu J. Effect of probiotics on depression: a systematic review and meta-analysis of randomized controlled trials. Nutrients. 2016;8(8):pii: E483. doi: 10.3390/nu8080483.
13. Carding S, Verbeke K, Vipond DT, et al. Dysbiosis of the gut microbiota in disease. Microb Ecol Health Dis. 2015;26:26191. doi: 10.3402/mehd.v26.26191.
14. Thapar A, Cooper M, Eyre O, et al. Practitioner review: what have we learnt about the causes of ADHD? J Child Psychol Psychiatry. 2013;54(1):3-16.
15. Jiang C, Li G, Huang P, et al. The gut microbiota and Alzheimer’s disease. J Alzheimers Dis. 2017;58(1):1-15.
16. Kurokawa S, Kishimoto T, Mizuno S, et al. The effect of fecal microbiota transplantation on psychiatric symptoms among patients with irritable bowel syndrome, functional diarrhea and functional constipation: an open-label observational study. J Affect Disord. 2018;235:506-512.
17. Hillemacher T, Bachmann O, Kahl KG, et al. Alcohol, microbiome, and their effect on psychiatric disorders. Prog Neuropsychopharmacol Biol Psychiatry. 2018;85:105-115.
18. Doré J, Multon MC, Béhier JM; participants of Giens XXXII, Round Table No. 2. The human gut microbiome as source of innovation for health: which physiological and therapeutic outcomes could we expect? Therapie. 2017;72(1):21-38.
19. Vemuri RC, Gundamaraju R, Shinde T, et al. Therapeutic interventions for gut dysbiosis and related disorders in the elderly: antibiotics, probiotics or faecal microbiota transplantation? Benef Microbes. 2017;8(2):179-192.
20. Lombardi VC, De Meirleir KL, Subramanian K, et al. Nutritional modulation of the intestinal microbiota; future opportunities for the prevention and treatment of neuroimmune and neuroinflammatory disease. J Nutr Biochem. 2018;61:1-16.

Statins aren’t preventive in elderly unless they have diabetes
Any benefit of statins for primary prevention in older adult populations may depend on whether or not type 2 diabetes is present, results of a retrospective cohort study suggest.
Statins had no protective effect overall in the study, which included adults older than 74 years who had no clinically recognized atherosclerotic cardiovascular disease (ASCVD).
In older patients with diabetes, statins were associated with reductions in CVD incidence and all-cause mortality. However, this benefit was substantially reduced in patients 85 years and older, and completely absent in those over 90, study authors said in the BMJ.
“These results do not support the widespread use of statins in old and very old populations, but they do support treatment in those with type 2 diabetes younger than 85 years,” said Rafael Ramos, MD, of the University of Girona, Spain, and his coauthors.
While meta-analyses support statins as primary prevention of CVD in individuals 65 years or older, evidence is lacking on those older than 74 years, according to the investigators.
Accordingly, they conducted the present retrospective cohort study based on data from a Spanish primary care database that included patient records for more than 6 million people. They looked specifically for individuals aged 75 years or older with no history of ASCVD who had at least one visit between July 2006 and December 2007.
They found 46,864 people meeting those criteria, of whom 7,502 (16.0%) had started statin treatment and 7,880 (16.8%) had type 2 diabetes.
With a median follow-up of 7.7 years, statin use had no benefit in reducing ASCVD incidence or all-cause mortality for the entire study population, statistical analyses showed.
In participants with diabetes, however, statins did appear protective, at least in the patients aged 75-84 years, with hazard ratios of 0.76 (95% confidence interval, 0.65-0.89) for CVD and 0.84 (95% CI, 0.75-0.94) for all-cause mortality, Dr. Ramos and his colleagues reported.
The 1-year number needed to treat in this 75-84 age group was 164 for atherosclerotic CVD, and 306 for all-cause mortality, they added.
By contrast, the hazard ratios for patients 85 years and older were 0.82 (95% CI, 0.53-1.26) for atherosclerotic CVD, and 1.05 (95% CI, 0.86-1.28) for all-cause mortality, the investigators reported.
The observed reductions in CVD in individuals with diabetes lost statistical significance at age 85 years when investigators looked at hazard ratios for each year of age. Similarly, reductions in all-cause mortality began to lose statistical significance at age 82 years and “definitively disappeared” in those aged 88 years or older, they said.
The project was supported by grants from the Ministerio de Salud, Spain’s Ministry of Science and Innovation through the Carlos III Health Institute and other entities.
Dr. Ramos and his coauthors declared no support in the previous 3 years from any organization related to, or that might have an interest in, the submitted work. They also declared no other relationships or activities that could appear to have influenced the work.
SOURCE: Ramos R et al. BMJ 2018 Sep 5;362:k3359.
Until better evidence is available, patient preference remains the guiding principle in deciding whether to prescribe statins in older adults, according to authors of an accompanying editorial.
“These observational findings are exploratory, however, and should be tested further in randomized trials to rule out any confounding and to study the effect of statins on CVD death, which were not recorded in the database used for this study,” editorial authors Aidan Ryan, MD, Simon Heath, MD, and Paul Cook, MD, wrote in the BMJ.
The ongoing Australian randomized STAREE trial (Statins for Reducing Events in the Elderly) is evaluating primary prevention with atorvastatin 40 mg versus placebo in adults older than 70 years, the authors noted.
While results are awaited, the decision of whether or not to prescribe statins in older adults may depend on their treatment goals, the authors added.
For example, in patients who cite longevity as a treatment goal, the current evidence remains limited that statins as primary prevention could help.
“A patient preference for reduction in myocardial infarction or stroke, however, might help to tilt the balance in favor of statin prescription but the absolute risk reduction, number needed to treat to prevent a CVD event in older patients remains uncertain,” the authors wrote.
Dr. Ryan is an academic clinical fellow and Dr. Cook is a consultant in chemical pathology and metabolic medicine, both at University Hospital Southampton, England. Dr. Heath is in group practice in Warwickshire, England. The authors declared no competing interests.
Any benefit of statins for primary prevention in older adult populations may depend on whether or not type 2 diabetes is present, results of a retrospective cohort study suggest.
Statins had no protective effect overall in the study, which included adults older than 74 years who had no clinically recognized atherosclerotic cardiovascular disease (ASCVD).
In older patients with diabetes, statins were associated with reductions in CVD incidence and all-cause mortality. However, this benefit was substantially reduced in patients 85 years and older, and completely absent in those over 90, study authors said in the BMJ.
“These results do not support the widespread use of statins in old and very old populations, but they do support treatment in those with type 2 diabetes younger than 85 years,” said Rafael Ramos, MD, of the University of Girona, Spain, and his coauthors.
While meta-analyses support statins as primary prevention of CVD in individuals 65 years or older, evidence is lacking on those older than 74 years, according to the investigators.
Accordingly, they conducted the present retrospective cohort study based on data from a Spanish primary care database that included patient records for more than 6 million people. They looked specifically for individuals aged 75 years or older with no history of ASCVD who had at least one visit between July 2006 and December 2007.
They found 46,864 people meeting those criteria, of whom 7,502 (16.0%) had started statin treatment and 7,880 (16.8%) had type 2 diabetes.
With a median follow-up of 7.7 years, statin use had no benefit in reducing ASCVD incidence or all-cause mortality for the entire study population, statistical analyses showed.
In participants with diabetes, however, statins did appear protective, at least in the patients aged 75-84 years, with hazard ratios of 0.76 (95% confidence interval, 0.65-0.89) for CVD and 0.84 (95% CI, 0.75-0.94) for all-cause mortality, Dr. Ramos and his colleagues reported.
The 1-year number needed to treat in this 75-84 age group was 164 for atherosclerotic CVD, and 306 for all-cause mortality, they added.
By contrast, the hazard ratios for patients 85 years and older were 0.82 (95% CI, 0.53-1.26) for atherosclerotic CVD, and 1.05 (95% CI, 0.86-1.28) for all-cause mortality, the investigators reported.
The observed reductions in CVD in individuals with diabetes lost statistical significance at age 85 years when investigators looked at hazard ratios for each year of age. Similarly, reductions in all-cause mortality began to lose statistical significance at age 82 years and “definitively disappeared” in those aged 88 years or older, they said.
The project was supported by grants from the Ministerio de Salud, Spain’s Ministry of Science and Innovation through the Carlos III Health Institute and other entities.
Dr. Ramos and his coauthors declared no support in the previous 3 years from any organization related to, or that might have an interest in, the submitted work. They also declared no other relationships or activities that could appear to have influenced the work.
SOURCE: Ramos R et al. BMJ 2018 Sep 5;362:k3359.
FROM THE BMJ
Key clinical point: Any benefit of statins for primary prevention in older adult populations may depend on whether or not type 2 diabetes is present.
Major finding: In participants with diabetes who were aged 75-84 years, hazard ratios were 0.76 (95% confidence interval, 0.65-0.89) for CVD and 0.84 (95% CI, 0.75-0.94) for all-cause mortality; participants with diabetes aged 85 years and older had markedly less benefit.
Study details: A retrospective cohort study including 46,864 individuals aged 75 years or older with no history of atherosclerotic CVD.
Disclosures: The project was supported by grants from the Ministerio de Salud and Spain’s Ministry of Science and Innovation through the Carlos III Health Institute, among other entities. Authors declared no support, relationships, or activities related to the submitted work.
Source: Ramos R et al. BMJ 2018;362:k3359.