User login
Penalties not necessary to save money in some Medicare ACOs
The Centers for Medicare & Medicaid Services may be able to reduce spending through the Medicare Shared Savings Program (MSSP) without asking for health care professionals and organizations to take on penalties or so-called downside risk, according to a study published in Sept. 5 in the New England Journal of Medicine.

Researchers, using fee-for-service claims from 2009 through 2015 and performing difference-in-difference analyses to compare changes in Medicare spending, found that Accountable Care Organizations (ACOs) formed from physician practices were able to save money while hospital-based ACOs were not.
“Our results also suggest that shared-savings contracts that do not impose a downside risk of financial losses for spending above benchmarks – which may appeal to smaller organizations without sufficient reserves to withstand potential losses – may be effective in lowering Medicare spending,” J. Michael McWilliams, MD, PhD, of Harvard Medical School, Boston, and his colleagues wrote.
Researchers found that by 2015, groups participating in MSSP, as compared with those who did not participate, were “associated with a mean differential reduction of $302 in total Medicare spending per beneficiary in the 2012 entry of cohorts of ACOs,” without accounting for bonus payments.
“Accounting for shared-savings bonus payments, we determined that the differential spending reductions in the entry cohorts of physician-group ACOs from 2012 through 2014 constituted a net savings to Medicare of $256.4 million in 2015,” Dr. McWilliams and his colleagues wrote. “For hospital-integrated ACOs, bonus payments more than offset annual spending reductions.”
Dr. McWilliams and his colleagues noted that their findings were limited by a narrow focus on organizational structure (financial independence from hospitals), so other factors could have held to differences in savings; changes in coding practices for ACOs coming in as of 2013; lack of data on costs to ACOs or efforts to lower spending or improve quality; and the inability to assess the effects of the MSSP on many aspects of quality of care because of the nature of using claims-based measures.
“Our results probably underestimate savings to Medicare because they do not account for spillover effects of ACO efforts on nonattributed patients or effects of lower fee-for-service Medicare spending on payments to Medicare Advantage plans,” the researchers added.
The study was funded by a grant from the National Institute on Aging. Dr. McWilliams and Michael Chernew, PhD, also of Harvard Medical School, both have received consulting fees related to ACO research.
SOURCE: McWilliams JM et al. N Engl J Med. 2018 Sep 5. doi: 10.1056/NEJMsa1803388.
The Centers for Medicare & Medicaid Services may be able to reduce spending through the Medicare Shared Savings Program (MSSP) without asking for health care professionals and organizations to take on penalties or so-called downside risk, according to a study published in Sept. 5 in the New England Journal of Medicine.
Researchers, using fee-for-service claims from 2009 through 2015 and performing difference-in-difference analyses to compare changes in Medicare spending, found that Accountable Care Organizations (ACOs) formed from physician practices were able to save money while hospital-based ACOs were not.
“Our results also suggest that shared-savings contracts that do not impose a downside risk of financial losses for spending above benchmarks – which may appeal to smaller organizations without sufficient reserves to withstand potential losses – may be effective in lowering Medicare spending,” J. Michael McWilliams, MD, PhD, of Harvard Medical School, Boston, and his colleagues wrote.
Researchers found that by 2015, groups participating in MSSP, as compared with those who did not participate, were “associated with a mean differential reduction of $302 in total Medicare spending per beneficiary in the 2012 entry of cohorts of ACOs,” without accounting for bonus payments.
“Accounting for shared-savings bonus payments, we determined that the differential spending reductions in the entry cohorts of physician-group ACOs from 2012 through 2014 constituted a net savings to Medicare of $256.4 million in 2015,” Dr. McWilliams and his colleagues wrote. “For hospital-integrated ACOs, bonus payments more than offset annual spending reductions.”
Dr. McWilliams and his colleagues noted that their findings were limited by a narrow focus on organizational structure (financial independence from hospitals), so other factors could have held to differences in savings; changes in coding practices for ACOs coming in as of 2013; lack of data on costs to ACOs or efforts to lower spending or improve quality; and the inability to assess the effects of the MSSP on many aspects of quality of care because of the nature of using claims-based measures.
“Our results probably underestimate savings to Medicare because they do not account for spillover effects of ACO efforts on nonattributed patients or effects of lower fee-for-service Medicare spending on payments to Medicare Advantage plans,” the researchers added.
The study was funded by a grant from the National Institute on Aging. Dr. McWilliams and Michael Chernew, PhD, also of Harvard Medical School, both have received consulting fees related to ACO research.
SOURCE: McWilliams JM et al. N Engl J Med. 2018 Sep 5. doi: 10.1056/NEJMsa1803388.
FROM THE NEW ENGLAND JOURNAL OF MEDICINE
Key clinical point: Physician group ACOs in the Medicare Shared Savings Program (MSSP) generated more savings than did hospital-led ACO groups.
Major finding: Physician group ACOs joining the MSSP in 2012-2014 generated $256.4 million in Medicare savings in 2015.
Study details: Analysis of fee-for-service Medicare claims during 2009-2015.
Disclosures: The study was funded by the National Institute on Aging. Dr. McWilliams and Dr. Chernew disclosed consulting fees related to ACO research.
Source: McWilliams JM et al. N Engl J Med. doi: 10.1056/NEJMsa1803388.
Single-dose influenza drug baloxavir similar to oseltamivir in efficacy
A new single-dose influenza antiviral drug appears significantly better than placebo at relieving the symptoms of infection, and reduces viral load faster than does oseltamivir, new research suggests.

Baloxavir marboxil – a selective inhibitor of influenza cap-dependent endonuclease – was tested in two randomized, double-blind, controlled trials. The first was a double-blind, placebo-controlled, dose-ranging, phase 2 randomized trial of 389 Japanese adults aged 20-64 years with acute uncomplicated influenza from December 2015 through March 2016. The second was a phase 3 randomized controlled trial of 1,366 patients comparing baloxavir with placebo and oseltamivir.
The phase 2 study showed patients treated with 10 mg, 20 mg or 40 mg oral dose of baloxavir experienced a significantly shorter median time to symptom alleviation compared with placebo (54.2, 51, 49.5, and 77.7 hours, respectively), according to a paper published in the Sept. 6 edition of the New England Journal of Medicine.
In addition, all three doses showed significantly greater reductions in influenza virus titers on days 2 and 3, compared with placebo.
The phase 3 trial CAPSTONE-1 (NCT02954354) was a double-blind, placebo- and oseltamivir-controlled, randomized trial that enrolled outpatients aged 12-64 years with influenza-like illness in the United States and Japan from December 2016 through March 2017. Patients aged 20-64 years received a single, weight-based oral dose of baloxavir (40 mg for patients weighing more than 80 kg, 80 mg for those weighing 80 kg or less) on day 1 only or oseltamivir at a dose of 75 mg twice daily or matching placebos on a 5-day regimen.
Patients aged 12-19 years were randomly assigned to receive either baloxavir or placebo on day 1 only, according to the researchers.
The median time to alleviation of symptoms was similar in the baloxavir (53.5 hours) and oseltamivir group (53.8 hours). However, patients taking baloxavir had significantly faster declines in infectious viral load compared with those taking oseltamivir, which was taken as a 75-mg dose twice daily for 5 days. In addition, patients who were treated with baloxavir within 24 hours of symptom onset showed significantly shorter time to alleviation of symptoms compared with placebo than did those who started treatment more than 24 hours after symptoms began.
Adverse events related to the study drug were more common among patients taking oseltamivir (8.4%) compared with those taking baloxavir (4.4%) or placebo (3.9%). In the phase 2 study, the adverse event rate was lower in the three baloxavir dosage groups compared with the placebo group. The study also showed a similar low frequency of complications requiring antibiotic treatment in both the baloxavir, oseltamivir, and placebo arms.
Some patients did show evidence of decreased susceptibility to baloxavir; for example, PA I38T/M amino acid substitutions were seen in 9.7% of the patients taking baloxavir but none of randomly selected patients in the placebo group of the phase 3 trial.
“These trials showed that single doses of the cap-dependent endonuclease inhibitor baloxavir were superior to placebo in alleviating influenza symptoms in patients with uncomplicated influenza, without clinically significant side effects,” wrote Dr. Frederick G. Hayden of the University of Virginia, Charlottesville, and his coauthors.
“The antiviral effects that were observed with baloxavir in patients with uncomplicated influenza provide encouragement with respect to its potential value in treating complicated or severe influenza infections,” they noted.
Because the treatment was inhibitory for influenza virus strains that were resistant to neuraminidase inhibitors or M2 ion-channel inhibitors, it could be a treatment option for patients infected with those viruses, the researchers added.
CAPSTONE-2, a randomized, controlled trial involving patients at high risk for influenza complications (NCT02949011) is in progress.
The study was supported by Shionogi, which developed baloxavir. Seven authors declared fees from the pharmaceutical industry, including Shionogi. Six authors were employees of Shionogi, one also holding stock. No other conflicts of interest were declared.
SOURCE: Hayden F et al. N Engl J Med. 2018;379:913-23. doi: 10.1056/NEJMoa1716197.
These two studies of baloxavir show that the drug has a clinical benefit similar to that of oseltamivir in individuals with uncomplicated influenza infection. As a single-dose treatment, baloxavir has the advantage in reducing concerns about adherence compared to the treatment regimen for oseltamivir, which requires 5 days of twice-daily dosing.
However, these studies should be viewed as the first step. While baloxavir showed significantly greater reductions in viral load at 24 hours and a shorter duration of infectious virus detection than did oseltamivir or placebo, it also induced the emergence of viral escape mutants with reduced susceptibility.
It’s not yet known whether these influenza viruses with reduced susceptibility are transmissible, and whether surveillance for I38T and other markers will be needed. We also need trials to identify which patients are most likely to benefit from baloxavir, and the timing for treatment.
Timothy M. Uyeki, MD, is with the Influenza Division at the National Center for Immunization and Respiratory Diseases, Centers for Disease Control and Prevention. These comments are taken from an editorial (N Engl J Med. 2018;397:975-7. doi: 10.1056/NEJMe1810815. No conflicts of interest were declared.
A new single-dose influenza antiviral drug appears significantly better than placebo at relieving the symptoms of infection, and reduces viral load faster than does oseltamivir, new research suggests.
Baloxavir marboxil – a selective inhibitor of influenza cap-dependent endonuclease – was tested in two randomized, double-blind, controlled trials. The first was a double-blind, placebo-controlled, dose-ranging, phase 2 randomized trial of 389 Japanese adults aged 20-64 years with acute uncomplicated influenza from December 2015 through March 2016. The second was a phase 3 randomized controlled trial of 1,366 patients comparing baloxavir with placebo and oseltamivir.
The phase 2 study showed patients treated with 10 mg, 20 mg or 40 mg oral dose of baloxavir experienced a significantly shorter median time to symptom alleviation compared with placebo (54.2, 51, 49.5, and 77.7 hours, respectively), according to a paper published in the Sept. 6 edition of the New England Journal of Medicine.
In addition, all three doses showed significantly greater reductions in influenza virus titers on days 2 and 3, compared with placebo.
The phase 3 trial CAPSTONE-1 (NCT02954354) was a double-blind, placebo- and oseltamivir-controlled, randomized trial that enrolled outpatients aged 12-64 years with influenza-like illness in the United States and Japan from December 2016 through March 2017. Patients aged 20-64 years received a single, weight-based oral dose of baloxavir (40 mg for patients weighing more than 80 kg, 80 mg for those weighing 80 kg or less) on day 1 only or oseltamivir at a dose of 75 mg twice daily or matching placebos on a 5-day regimen.
Patients aged 12-19 years were randomly assigned to receive either baloxavir or placebo on day 1 only, according to the researchers.
The median time to alleviation of symptoms was similar in the baloxavir (53.5 hours) and oseltamivir group (53.8 hours). However, patients taking baloxavir had significantly faster declines in infectious viral load compared with those taking oseltamivir, which was taken as a 75-mg dose twice daily for 5 days. In addition, patients who were treated with baloxavir within 24 hours of symptom onset showed significantly shorter time to alleviation of symptoms compared with placebo than did those who started treatment more than 24 hours after symptoms began.
Adverse events related to the study drug were more common among patients taking oseltamivir (8.4%) compared with those taking baloxavir (4.4%) or placebo (3.9%). In the phase 2 study, the adverse event rate was lower in the three baloxavir dosage groups compared with the placebo group. The study also showed a similar low frequency of complications requiring antibiotic treatment in both the baloxavir, oseltamivir, and placebo arms.
Some patients did show evidence of decreased susceptibility to baloxavir; for example, PA I38T/M amino acid substitutions were seen in 9.7% of the patients taking baloxavir but none of randomly selected patients in the placebo group of the phase 3 trial.
“These trials showed that single doses of the cap-dependent endonuclease inhibitor baloxavir were superior to placebo in alleviating influenza symptoms in patients with uncomplicated influenza, without clinically significant side effects,” wrote Dr. Frederick G. Hayden of the University of Virginia, Charlottesville, and his coauthors.
“The antiviral effects that were observed with baloxavir in patients with uncomplicated influenza provide encouragement with respect to its potential value in treating complicated or severe influenza infections,” they noted.
Because the treatment was inhibitory for influenza virus strains that were resistant to neuraminidase inhibitors or M2 ion-channel inhibitors, it could be a treatment option for patients infected with those viruses, the researchers added.
CAPSTONE-2, a randomized, controlled trial involving patients at high risk for influenza complications (NCT02949011) is in progress.
The study was supported by Shionogi, which developed baloxavir. Seven authors declared fees from the pharmaceutical industry, including Shionogi. Six authors were employees of Shionogi, one also holding stock. No other conflicts of interest were declared.
SOURCE: Hayden F et al. N Engl J Med. 2018;379:913-23. doi: 10.1056/NEJMoa1716197.
FROM THE NEW ENGLAND JOURNAL OF MEDICINE
Key clinical point: Single-dose influenza antiviral baloxavir shows efficacy similar to that of oseltamivir.
Major finding: Baloxavir shows similar time to alleviation of influenza symptoms compared with oseltamivir, but greater reductions in viral load.
Study details: Phase 2 and phase 3 randomized controlled trials in 389 and 1,366 otherwise healthy patients with influenza.
Disclosures: The study was supported by Shionogi, which developed baloxavir. Seven authors declared fees from the pharmaceutical industry, including Shionogi. Six authors were employees of Shionogi, one also holding stock. No other conflicts of interest were declared.
Source: Hayden F et al. N Engl J Med 2018;379:913-23. doi: 10.1056/NEJMoa1716197.
Janssen submits NDA for esketamine nasal spray
Janssen has announced its submission of a new drug application to the Food and Drug Administration for esketamine nasal spray, which is intended for adult patients with treatment-resistant depression.

About 30% of people with depression do not respond to currently available interventions (Biol Psychiatry. 2016 Sep 15;80[6]:424-31). “This represents a major unmet public health need,” Mathai Mammen, MD, PhD, global head, Janssen Research & Development, said in a Sept. 4 press release announcing the NDA.
The application submitted by Janssen is based on data from five phase 3 trials, all of which demonstrated rapid reduction of depressive symptoms, as well as delayed time to relapse of symptoms, in patients with treatment-resistant depression, Janssen said in the release. Those studies compared treatment with esketamine plus a newly initiated oral antidepressant with that of placebo plus a newly initiated oral antidepressant. One of the studies evaluated long-term safety associated with esketamine treatment and found no new safety signals at 52 weeks of treatment, compared with those seen in short-term studies of the drug.
Previously, it received Breakthrough Therapy Designations for both treatment-resistant depression and major depressive disorder with imminent risk for suicide. Phase 3 clinical studies for the latter indication are ongoing. According to Janssen, the company plans to submit a Marketing Authorization Application to the European Medicines Agency later in 2018 for the treatment-resistant depression indication.
Janssen has announced its submission of a new drug application to the Food and Drug Administration for esketamine nasal spray, which is intended for adult patients with treatment-resistant depression.
About 30% of people with depression do not respond to currently available interventions (Biol Psychiatry. 2016 Sep 15;80[6]:424-31). “This represents a major unmet public health need,” Mathai Mammen, MD, PhD, global head, Janssen Research & Development, said in a Sept. 4 press release announcing the NDA.
The application submitted by Janssen is based on data from five phase 3 trials, all of which demonstrated rapid reduction of depressive symptoms, as well as delayed time to relapse of symptoms, in patients with treatment-resistant depression, Janssen said in the release. Those studies compared treatment with esketamine plus a newly initiated oral antidepressant with that of placebo plus a newly initiated oral antidepressant. One of the studies evaluated long-term safety associated with esketamine treatment and found no new safety signals at 52 weeks of treatment, compared with those seen in short-term studies of the drug.
Previously, it received Breakthrough Therapy Designations for both treatment-resistant depression and major depressive disorder with imminent risk for suicide. Phase 3 clinical studies for the latter indication are ongoing. According to Janssen, the company plans to submit a Marketing Authorization Application to the European Medicines Agency later in 2018 for the treatment-resistant depression indication.
Antidepressants not effective in treating depression in patients with dementia
Antidepressants often are used to treat depressive symptoms in patients with dementia, but this practice is not backed by strong evidence, according to a systematic review published in the Cochrane Database of Systematic Reviews.
“On the only measure of efficacy for which we had high-quality evidence (depression rating scale scores), antidepressants showed little or no effect,” reported Robert Dudas, MD, PhD, of the University of Cambridge (England), and his associates. “The evidence on remission rates favored antidepressants but was of moderate quality, so future research may find a different result.”
For the review, a total of 10 studies – which altogether included of 1,592 patients – were examined, of which 8 included enough information to enter into analyses about antidepressant efficacy, Dr. Dudas and his associates reported. The average age in the studies was 75 years, and study participants had mild or moderate dementia.
After 6-13 weeks, little difference in depression symptom rating scale scores was found between antidepressant- and placebo-treated groups (standardized mean difference, –0.10 points; 95% confidence interval, –0.26 to 0.06). Similar results were found after 6-9 months (SMD, 0.59 points; 95% CI, –1.12 to 2.30).
Antidepressants did not significantly improve response rates (odds ratio, 1.71; 95% CI, 0.80-3.67) but were associated with a higher remission rate (OR, 2.57; 95% CI, 1.44-4.59). After 6-13 weeks, no difference was found between antidepressants and placebo on performance of daily activities (SMD, –0.05; 95% CI, –0.36 to 0.25) or in cognition (mean difference of 0.33 in Mini-Mental State Examination scores; 95% CI, –1.31 to 1.96).
In addition to experiencing no significant improvement in depression symptoms, patients who received antidepressants were more likely to drop out of treatment than were those receiving placebo (OR, 1.51; 95% CI, 1.07-2.14) and to experience at least one adverse event (OR, 1.55; 95% CI, 1.21-1.98). Adverse events more likely to occur in patients receiving antidepressants included dry mouth (OR, 1.80; 95% CI, 1.23-2.63) and dizziness (OR, 2.00; 95% CI, 1.34-2.98).
“ There is a need for well-conducted, randomized, controlled trials, using scales validated in older people with depression and dementia, of modern, frequently used drugs and sufficient sample sizes that would allow a study of treatment response and detailed adverse event profile according to dementia etiology and severity and depression severity,” the investigators concluded.
The study was supported by several entities, including the Cambridgeshire and Petersborough NHS Foundation Trust, Collaborations for Leadership in Applied Health Research and Care, and the National Institute for Health Research, all in the United Kingdom. Dr. Dudas and his associates declared no conflicts of interest.
SOURCE: Dudas R et al. Cochrane Database Syst Rev. 2018 Aug 31. doi: 10.1002/14651858.CD003944.pub2.
FROM THE COCHRANE DATABASE OF SYSTEMATIC REVIEWS
Service, please: Hospital setting matters for pneumonia
the National Center for Health Statistics (NCHS) reported.
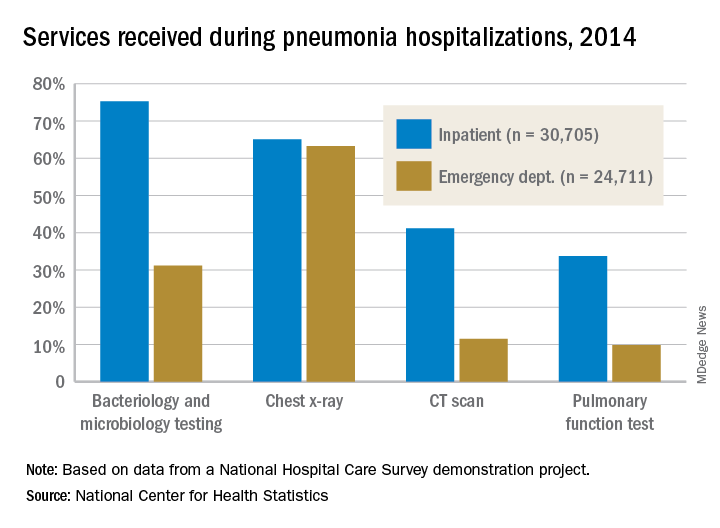
The percentages were not as close, however, for other diagnostic services. Inpatient stays were much more likely than ED encounters to involve bacteriology and microbiology testing (75.3% vs. 31.2%), CT scans (41.2% vs. 11.5%), and pulmonary function tests (33.7% vs. 9.8%), investigators from the NCHS said.
The age distribution of the two patient populations also were quite different, with those aged 65 years and older making up the largest share (46%) of pneumonia inpatients and the 15-and-under group representing the largest proportion (47%) of ED visits. For the inpatient setting, the smallest age group was those aged 15-44 years (10%), and for the ED it was those aged 65 years and older (14%), they reported.
The National Hospital Care Survey “is not yet nationally representative,” the NCHS investigators wrote – the overall sample for 2014 consisted of 581 hospitals – but “the number of encounters and the inclusion of [personally identifiable information] allow an example of analysis that was not previously possible.”
the National Center for Health Statistics (NCHS) reported.
The percentages were not as close, however, for other diagnostic services. Inpatient stays were much more likely than ED encounters to involve bacteriology and microbiology testing (75.3% vs. 31.2%), CT scans (41.2% vs. 11.5%), and pulmonary function tests (33.7% vs. 9.8%), investigators from the NCHS said.
The age distribution of the two patient populations also were quite different, with those aged 65 years and older making up the largest share (46%) of pneumonia inpatients and the 15-and-under group representing the largest proportion (47%) of ED visits. For the inpatient setting, the smallest age group was those aged 15-44 years (10%), and for the ED it was those aged 65 years and older (14%), they reported.
The National Hospital Care Survey “is not yet nationally representative,” the NCHS investigators wrote – the overall sample for 2014 consisted of 581 hospitals – but “the number of encounters and the inclusion of [personally identifiable information] allow an example of analysis that was not previously possible.”
Topical Corticosteroid Tachyphylaxis: Why Don’t Patients Adhere to Treatment?


Pancreatic abnormalities found in one-quarter of patients with high-risk germline mutations
according to a recent study. However, screening individuals under the age of 50 years, even those with risk factors, is a low-yield strategy.
In a retrospective analysis of 86 asymptomatic adult patients with high-risk germline mutations followed at a single center, screening by a variety of imaging modalities showed a pancreatic abnormality in about one-quarter of patients (23 of 86, 26.7%). No cancers were detected on initial screening or during a median 29.8-month follow-up period, though the investigators saw more abnormalities in patients over the age of 60 years (P = .043).
The mutations were detected through genetic screening at the University of Texas MD Anderson Cancer Center, Houston, where the study was conducted.
“At our institution, based on oncology and/or medical genetics assessments, patients with a personal history of breast cancer and/or family history of [pancreatic cancer] are screened for BRCAs and BRCA1 mutations. Patients with other types of cancers in the family are screened for P53, STK11, MSH2, ATM, and APC mutations,” explained first author R. Tomás DaVee, MD, of the division of gastroenterology, hepatology, and nutrition at the University of Texas, Houston, and his collaborators.
Patients were considered to have a family history of pancreatic cancer (PC) if any first-, second-, or third-degree relative had PC; overall, this amounted to 37 patients (43%). For the study, familial PC was defined as having either two first-degree or three or more relatives of any degree diagnosed with PC.
Patients, who were a median age of 48.5 years, were included in the study if they had any of the germline mutations, which are associated with an increase in relative risk of PC ranging from 2.26 for BRCA1 to 132 for STK11/LKB1, the mutation that causes Peutz-Jeghers syndrome. Patients who had a family history alone, without high-risk germline mutations, were excluded from the study. Most participants (79.8%) were women, and most of the participants were BRCA2 or BRCA1 positive (58.1% and 16.3%, respectively).
Of the abnormalities found, almost half (47.8%) were cysts, and almost as many (43.5%) were hyperechoic strands and foci. Two patients (8.7% of abnormalities) had mild pancreatic duct dilation. Patients who had only fatty infiltration or pancreas divisum were classified as having normal variations rather than abnormalities.
The pancreatic abnormalities had been found through endoscopic ultrasound (EUS), CT, or MRI, though the study’s primary aim was to look at outcomes and diagnostic yield for high-risk germline mutation patients receiving EUS. A secondary aim of the study, said the authors, was to compare EUS with both MRI and CT as methods to screen for early PC.
In this regard, Dr. DaVee and his coauthors wrote that “EUS-based screening conferred a higher yield in detecting abnormal pancreatic findings, compared with MRI [P = .007].” For MRI in comparison with EUS as the criterion standard, sensitivity and specificity were 55.6% and 93.8% for detecting pancreatic abnormalities. CT fared a little worse, with sensitivity of 50% and specificity of 89.5% for detecting pancreatic abnormalities.
Overall, the investigators noted that “the frequency of [pancreatic abnormalities] in our study is lower than reported in some studies using alternate criteria.” The relatively young age of the study cohort may be partly responsible for this finding, they said, adding that “our data further support evidence that abnormal pancreatic findings increase with age ... in asymptomatic [high-risk individuals], including the subtle finding of hyperechoic strands and foci.”
To improve survival, “premalignant and early PC identification is key,” wrote Dr. DaVee and his coauthors, pointing out that, of the 10% of patients diagnosed with PC when it is still localized, the 5-year survival rate is about 31.5%, compared with the overall 8.2% of individuals with PC who are still alive 5 years after their diagnosis. The latter figure, they noted, is a small improvement over the 3% 5-year survival figure from 1975.
Since population-wide screening for PC would not have a favorable cost-benefit profile, the challenge is identifying which individuals might benefit from targeted screening for PC. Dr. DaVee and his colleagues suggested that, as a general rule, high-risk individuals aged younger than 50 years need not be screened, and that EUS be used for the index screening, with MRI used to follow individuals with unremarkable initial screenings.
None of the authors reported relevant conflicts of interest, and no outside source of funding was reported.
SOURCE: DaVee RT et al. Gastrointest Endosc. 2018 Jun; 87(6):1443-50.
FROM GASTROINTESTINAL ENDOSCOPY
Key clinical point: Pancreatic abnormalities increased with age in high-risk individuals.
Major finding: Imaging found pancreatic abnormalities in 23 of 86 high-risk individuals (26.7%).
Study details: A retrospective, single-center study of 86 patients with germline mutations placing them at high risk for pancreatic cancer.
Disclosures: None of the authors reported relevant conflicts of interest, and no outside source of funding was reported.
Source: DaVee RT et al. Gastrointest Endosc. 2018 Jun;87(6):1443-540.
Physician groups call for CMS to drop E/M proposal
More than 170 physician groups are calling on the Centers for Medicare & Medicaid Services to withdraw a provision in the proposed 2019 physician fee schedule that would flatten evaluation and management payments.
The controversial proposal would set the payment rate for a level 1 evaluation and management (E/M) office visit for a new patient at $44, down from the $45 using the current methodology. Payment for levels 2-5 would be $135. Currently, payments for level 2 new patient visits are set at $76, level 3 at $110, level 4 at $167, and level 5 at $211.
For E/M office visits with established patients, the proposed rate would be $24 for level 1, up from the current payment of $22. Payment for levels 2-5 would be $93. Under the current methodology, payments for established patient level 2 visits are set at $45, level 3 at $74, level 4 at $109, and level 5 at $148.
In an Aug. 28 letter to the CMS, led by the American College of Rheumatology, physician groups applauded CMS recognition of the problems with the current E/M documentation guidelines and codes, but urged them to reconsider plans to “cut and consolidate evaluation and management services.” Doing so would “severely reduce Medicare patients’ access to care by cutting payments for complex office visits, adversely affecting the care and treatment of patients with complex conditions, and potentially exacerbate physician workforce shortages.”
A separate letter, led by the American Medical Association, made similar assertions that the current proposal has the potential to “hurt physicians and other health care professionals in specialties that treat the sickest patients, as well as those who provide comprehensive primary care, ultimately jeopardizing patients’ access to care.”
The American Gastroenterological Association sigend on to both letters.
AGA, along with the American College of Gastroenterology and the American Society for Gastrointestinal Endoscopy, sent out a member alert, asking their members to tell CMS not to move forward with the proposed change because all three societies believe that such a payment system undervalues care provided to their sickest and most vulnerable seniors and other Medicare beneficiaries.
Another concern related to the implementation of this proposal is the financial impact on physicians.
Implementation of the CMS proposal, as currently written, “would be amazingly expensive for private practice [doctors] and really for anyone else because we would have to change our EMRs,” Barbara Levy, MD, cochair of the CPT/RUC Work Group at the AMA.
“We would have to reprogram our billing software. All of that comes with a significant cost,” said Dr. Levy, who also serves as vice president of health policy at the American College of Obstetricians and Gynecologists.
Part of the selling point of the CMS proposal is the reduction in documentation that accompanies the E/M payment changes. The goal, according to the CMS, is to reduce time spent on paperwork and free up physicians to devote more time to patient care. But some physicians are skeptical it would work out that way.
"CMS has clearly heard from physicians about the need to reduce administrative burdens for physicians, and AGA appreciates that they're listening," said Peter S. Margolis, MD, AGAF, AGA Practice Councillor, University Gastroenterology, Providence, Rhode Island. "However, CMS' proposal drastically undervalues the care gastroenterologists and hepatologists provide to complex patients, including but not limited to those with inflammatory bowel disease, motility disorders, and chronic liver disease. Additionally, our experience shows that utilization management methods, such as prior authorization and step therapy appeals, are far more burdensome to physicians and physician practices than current E/M documentation requirements."
Another element of the proposal that is raising concerns among physician groups is a proposed payment reduction when a visit involves more than one service. For example, when a single office visit includes both an E/M code and a procedure code, the proposal calls for the E/M code to be cut in half.
“From the patients’ perspective, the potential threat is that doctors could be incentivized to spend less time with patients or potentially bring patients back for subsequent visits to handle multiple problems,” Angus Worthing, MD, chair of the American College of Rheumatology’s Committee on Government Affairs, said in an interview.
Comments on the proposed update to the 2019 Medicare physician fee schedule are due Sept. 10.
Cancer researchers fall short on financial disclosures
New research suggests that investigators involved in oncology trials sometimes fail to disclose payments from the pharmaceutical industry.
Researchers looked at clinical trials associated with cancer drugs recently approved in the United States and assessed whether funding was properly disclosed when the trial results were published in scientific journals.
The data showed that roughly a third of investigators failed to completely disclose payments from trial sponsors.
“We know that pharmaceutical companies sponsor trials of their own drugs. That’s not a surprise,” Cole Wayant, a DO/PhD student at Oklahoma State University in Tulsa, said in a statement. “But what is a surprise, and what warrants concern, is that this funding is often not disclosed in the publication of clinical trials that form the basis of FDA [Food and Drug Administration] approvals and clinical practice guidelines.”
Mr. Wayant and his colleagues conducted this research and reported the findings in a research letter published in JAMA Oncology.
The researchers began by searching the FDA Hematology/Oncology Approvals & Safety Notifications website for oncology drugs approved from Jan. 1, 2016, to Aug. 31, 2017.
The team then identified the published trials supporting these drug approvals and searched the Open Payments Database for industry payment data for each U.S.-based oncologist involved in the trials. Finally, the researchers compared the Open Payments data to the disclosure statements from the publications.
There were 344 authors of clinical trials associated with oncology drugs approved during the period studied. Most authors (76.5%) received at least one industry payment, and the total amount they received exceeded $216 million.
Nearly a third of the authors (32%, n = 110) did not fully disclose payments from a trial sponsor.
In all, the authors received about $6.3 million in general payments, such as speaking fees, and $1.7 million of that was undisclosed.
They received more than $500,000 in research payments, such as fees for study coordination, and more than $200,000 of that was undisclosed.
The authors received close to $210 million in associated research payments, such as grants, and about $78 million of that was undisclosed.
Mr. Wayant and his colleagues said these results suggest financial relationships between the pharmaceutical industry and oncology trial investigators “may be common, expensive, and frequently undisclosed.”
However, the research also suggests that Open Payments data could be used to ensure complete disclosure of industry payments.
The researchers reported having no financial disclosures.
SOURCE: Wayant C et al. JAMA Oncol. 2018 Aug 30. doi: 10.1001/jamaoncol.2018.3738.
FROM JAMA ONCOLOGY
Key clinical point:
Major finding: Among study authors involved in oncology trials, 32% did not fully disclose payments from trial sponsors.
Study details: A comparison of financial disclosure statements in published studies with information from the Open Payments database. The researchers looked at studies that supported U.S. oncology drug approvals from Jan. 1, 2016, to Aug. 31, 2017.
Disclosures: The researchers reported having no financial disclosures.
Source: Wayant C et al. JAMA Oncol. 2018 Aug 30. doi: 10.1001/jamaoncol.2018.3738.
Hydrocortisone plus fludrocortisone for adults with septic shock
Background: Septic shock is a serious and common health problem, associated with a more than 50% mortality rate. It is characterized by a dysregulated patient response to infection, resulting in life-threatening circulatory, cellular, and metabolic abnormalities. The benefit of corticosteroid use in septic shock is still controversial.
Study design: Double-blinded, randomized, placebo-controlled trial.
Setting: The study was conducted in 34 centers in France.
Synopsis: All 1,241 septic shock patients received usual care. Of these patients, 614 patients received hydrocortisone and fludrocortisone (HF), while 627 patients received placebo. HF patients had a lower rate of 90-day mortality (43.0% vs. 49.1%; P = .03), mortality at ICU discharge (35.4% vs. 41.0%; P = .04), mortality at hospital discharge (39.0% vs. 45.3%; P = .02), and mortality at day 180 (46.6% vs. 52.5%; P = .04). There was no significant difference between mortality at day 28 (33.7% in the HF group versus 38.9% in the placebo group; P = .06), ventilator-free days (11 vs. 10 days; P = .07), and rate of serious adverse events (53.1% vs. 58.0%; P = .08). The number of vasopressor-free days to day 28 was significantly higher in the HF group (17 vs. 15 days; P less than .001), as were the number of organ failure–free days (14 vs. 12 days; P = .003). There was more hyperglycemia in the HF group (89.1% vs. 83.1%; P = .002).
Bottom line: Patients with septic shock who received hydrocortisone plus fludrocortisone have a lower rate of 90-day all-cause mortality, compared with placebo.
Citation: Annane D et al. Hydrocortisone plus fludrocortisone for adults with septic shock. N Engl J Med. 2018 Mar 1. 378(9):809-18.
Dr. Salih is a hospitalist and instructor in the division of hospital medicine at the University of Kentucky, Lexington.