User login
Adherence to follow-up lung cancer screening not optimal
Former smokers’ adherence to annual follow-up screening for lung cancer was found to be less than optimal, according to a study to be presented at the CHEST 2018 annual meeting.
Paul B. Brasher, MD, and his colleagues from the Thoracic Oncology Research Group at the Medical University of South Carolina in Charleston studied adherence to recommended low-dose computed tomography (LDCT) among Veterans Affairs patients who were at high risk for lung cancer and whose baseline LDCTs were negative.
A total of 2,106 veterans aged 55-80 years who had at least a 30-pack year smoking history were initially screened within the Veterans Health Administration Lung Cancer Screening Demonstration Project. The study tracked 1,120 of these patients for 18 months to determine their adherence to annual LDCT screening; the rate of adherence was 77.6%.
View the abstract here: https://journal.chestnet.org/article/S0012-3692(18)31772-0/fulltext
The study will be presented in the session Lung Cancer Screening: New Questions and New Answers, Tuesday, Oct. 9, 8:45 a.m., Convention Center 207A.
CorMicA: Nonobstructive angina should trigger functional testing
SAN DIEGO – Don’t be satisfied with a diagnosis of angina with no obstructive coronary artery disease; push for acetylcholine testing, the findings from a trial in Scotland suggest.
Patients will have less angina and a better quality of life at 6 months, according to investigators from the University of Glasgow (Scotland).
Invasive angiography usually ends on both sides of the Atlantic when no occlusions are found. There are concerns about the safety of going further with acetylcholine challenges, and until now, there had been no grade A evidence from a randomized trial that it improves outcomes. The Glasgow team filled the evidence gap with their presentation of the Coronary Microvascular Angina (CorMicA) trial at the Transcatheter Cardiovascular Therapeutics (TCT) annual meeting, and there wasn’t a single serious adverse event (J Am Coll Cardiol. 2018 Sep 25. doi: 10.1016/j.jacc.2018.09.006).
“This was a proof-of-concept study, which we believe [should] substantiate a large, multicenter trial,” said senior investigator Colin Berry, PhD, a professor of cardiology and imaging at the university.
Acetylcholine was infused down the pressure wire in 151 subjects diagnosed with angina with no obstructive coronary artery diseases before they left the catheter lab. Of these patients, 76 were randomized to have their results shared with their treating cardiologist, and 75 were randomized to not have their results shared. Coronary functional testing is hardly ever done, so the no-share group was considered the standard-of-care control arm. The idea was to see whether it made a difference when treating physicians knew what was causing chest pain when their patients didn’t have occlusive disease.
It turned out to make a huge difference. The diagnosis of “chest pain of noncardiac origin” almost fell off the map. Once cardiologists knew what was going on, they switched up treatment according to European Society of Cardiology guidelines for functional heart pain. Patients with microvascular angina were given beta-blockers and switched off nitrates because these drugs make angina worse in microvascular disease. Subjects with vasospasms were shifted to calcium channel blockers and long-acting nitrates and away from beta-blockers because beta-blockers make vasospasms worse.
Cardiologists who didn’t know the results kept muddling along with what patients came in on at baseline – beta-blockers in two-thirds, long-acting nitrates in half, and calcium channel blockers in a third.
Subjects who got the right treatment because of acetylcholine testing outpaced the standard care group by almost 12 points on the Seattle Angina Questionnaire at 6 months; they could walk farther and didn’t have crushing angina almost every day (P = .001). They reported a statistically significant improvement in quality of life, and they were much happier with their doctors.
“This is the first randomized, sham-controlled trial in this space”; functional testing “was routinely safe and feasible. Therapy guided by the results of physiologic testing improved outcomes” and “treatment satisfaction,” said University of Glasgow interventional cardiologist Tom Ford, MD.
Acetylcholine was infused down the pressure wire into the radial artery, with the left anterior descending coronary artery as the target vessel. A final bolus of less than 100 mcg checked for coronary artery spasms; a symptomatic constriction of greater than 90% was considered positive. Glyceryl trinitrate was used to reverse the effects.
Three-quarters of the subjects were women, which Dr. Ford noted is unusual in an angina study. The mean age was 61 years, and subjects had about a 20% chance of a heart attack within 10 years. The whole procedure, including the angiogram, randomization, and functional testing, took a median of about 60 minutes.
There were no differences in major adverse cardiac events at 6 months, at 2.6% in both groups.
One patient developed persistent atrial fibrillation with acetylcholine testing that was converted to sinus rhythm with intravenous amiodarone, without a night in the hospital.
The work was funded by the British Heart Foundation. No companies were involved. The investigators didn’t have any relevant disclosures. The TCT meeting is sponsored by the Cardiovascular Research Foundation.
[email protected]
SOURCE: Ford TG et al. TCT 2018, Late-Breaking Trial.
REPORTING FROM TCT 2018
Key clinical point: A diagnosis of angina with no obstructive coronary artery disease is insufficient; acetylcholine testing should be considered.
Major finding: The diagnosis of “chest pain of noncardiac origin” almost fell off the map. At 6 months, patients could walk farther and didn’t have crushing angina almost every day (P = .001). They reported a statistically significant improvement in quality of life, and they were much happier with their doctors.
Study details: Randomized trial with 151 people who had chest pain but no coronary occlusions on angiography.
Disclosures: There was no industry funding, and the investigators had no relevant industry disclosures.
Source: Ford TG et al. TCT 2018, Late-Breaking Trial.
Aspirin for the elderly: what to do
Also today, swings in four metabolic measures predicted death in healthy people, anticoagulation plus single antiplatelet fails noninferiority measure 1 year after stenting, and Behavioral checklist identifies children at risk of depressive and/or anxiety disorders.
Amazon Alexa
Apple Podcasts
Spotify

Ground-breaking therapy comes with distinct challenges

NEW YORK—Two chimeric antigen receptor (CAR) T-cell therapies—axicabtagene ciloleucel (Yescarta ®) and tisagenlecleucel (Kymriah™)—are already approved in B-cell lymphoma by the U.S. Food and Drug Administration.
A third, lisocabtagene maraleucel, will most likely be approved before too long.
Despite differences in their costimulatory molecules, persistence, efficacy, and toxicity profiles, they all have high overall response rates and a fall-out of response during the first 3 to 6 months.
Longer-term follow-up is necessary to determine whether CAR T-cell therapy is actually curative.
“But based on the way things are looking,” said Reem Karmali, MD, of Robert H. Lurie Comprehensive Cancer Center of Northwestern University, “it seems this might be a realistic expectation.”
“CAR T-cell therapy is clearly effective and has been a ground-breaking form of therapy,” she said, “but there seems to be two sides to the coin. There are a number of challenges that we face with CAR T-cell therapy.”
Dr. Karmali outlined those challenges in a presentation at the NCCN 13th Annual Congress: Hematologic Malignancies.
Patient selection
One of the biggest challenges, according to Dr. Karmali, is patient selection.
First, patients must have an adequate hematopoietic reserve to ensure successful CAR T-cell manufacture.
Dr. Karmali referred to the JULIET study, in which 7% of patients failed the manufacturing process due to insufficient apheresis.
Second, the patient’s disease must be stable enough to make it through the time it takes to manufacturing the CAR product, which is typically 2 to 4 weeks.
Third, the patient’s overall health must be good enough to tolerate CAR T toxicities. "The patient needs good major organ function as well as preserved neurologic function,” she explained, “to withstand the unique toxicities that come with CAR T-cell therapy, specifically CRS [cytokine release syndrome] and neurotoxicity.”
Toxicities
The major toxicities are CRS and CAR‑T‑cell‑related encephalopathy syndrome (CRES).
Dr. Karmali pointed out there is also a theoretical risk of insertional oncogenesis from viral transduction used in manufacturing the T cells, and an off-tumor on target-effect that can result in B-cell aplasia and hypogammaglobulinemia.
The profiles of inflammatory cytokines and inflammation markers differ for each CAR construct and are driven in different ways. However, IL-6 is an important mediator for CRS and IL-6 receptor blockade is effective in managing the toxicity.
The drug of choice is tocilizumab, Dr. Karmali said, and for patients who are refractory to tocilizumab, siltuximab can be used.
“Steroids are extremely useful for CRS,” she added, “because they hold down inflammation and prevent immune activation.”
Steroids are also the mainstay for managing the neurotoxicity of CAR T-cell therapy because they help stabilize the blood-brain barrier.
“It’s important to make a note,” she said, “that there actually have been a number of analyses that have looked at the impact of using IL-6 receptor blockade and steroids on CAR T-cell expansion and persistence and there really doesn’t seem to be an impact.”
“So we really ought to use these quite liberally for grade 2 or higher toxicity without worrying about dampening the effect of CAR T-cell therapy,” she emphasized.
The Lee grading criteria for the management of CRS and the CTCAE 4.03 and CARTOX-10 for CRES provide guidance in assessing and managing the toxicities.
Future directions
Dr. Karmali outlined a few new directions to address the challenges with CAR T-cell therapy, such as switchable CARs that can be turned on or off and potentially improve safety; development of new constructs that may improve homing; improvement in persistence; use of combination and sequencing strategies; and improved antigen selection that may be effective with other lymphoproliferative diseases.
“A provocative question is whether CAR T-cell therapy can actually replace autologous stem cell transplant as second-line therapy,” she said. “This is actually being actively evaluated in a number of clinical trials including ZUMA-7 (NCT03391466).”
“I think another provocative question is whether CAR T-cell therapy can be used as consolidation in CR1 [first complete remission],” she added.
The rationale for using CAR Ts as either a replacement for autologous stem cell transplant or in CR1 is that there may be minimal residual disease present that would be enough to elicit a CAR T-cell effect, she explained.
“Ultimately, one envisions the following paradigm for the treatment of lymphomas across the board,” Dr. Karmali concluded.
“Specifically, chemotherapy with a targeted agent for rapid cytoreduction, followed by CAR T-cell consolidation in combination with either other cellular therapies or immunotherapy as a means of eradicating the minimal residual disease and ensuring a pathway to cure.”
Single leukemic cell can contaminate CAR T-cell product
Investigators report that a single leukemic cell unintentionally engineered into the chimeric antigen receptor (CAR) T-cell product can mask it from recognition and confer resistance to CAR T-cell therapy.
They described the case of a 20-year-old male who received the anti-CD19 CAR tisagenlecleucel (Kymriah) and relapsed at day 252 after the infusion.
The transduction of a leukemic cell during manufacture of the CAR T-cell product “is a rare event,” they wrote, and indicated that “this is the only case out of 369 patients reported worldwide at the time of publication.”
Lead author Marco Ruella, MD, of the University of Pennsylvania, and colleagues described the case in a Brief Communication published in Nature Medicine.
"In this case,” Dr. Ruella said, “we found that 100 percent of relapsed leukemic cells carried the CAR that we use to genetically modify T cells."
The patient had B-cell acute lymphoblastic leukemia (B-ALL) and relapsed three times after chemotherapy and a cord blood transplant before enrolling in the phase 1 trial of CTL019 (NCT 01626495).
The investigators reported that the infused CAR cells “displayed the typical pattern of in vivo engraftment and expansion.” At day 28 after the infusion, the patient was in complete remission.
But by day 252, he experienced a second expansion of CAR cells that did not correspond to the re-expansion of CAR+ T cells.
At day 261, the patient relapsed with more than 90% CD10+CD19- leukemic cells in the bone marrow and circulating blasts. The cells were CAR-transduced B-cell leukemia (CARB) cells.
The CARB cells continued to expand, and the patient died of progressive leukemia.
The investigators tracked the origin of the CARB cells by analyzing the relapsed CAR19+ cells using next-generation sequencing.
They hypothesized that the CAR19+ leukemia relapse occurred through lentiviral transduction during the manufacturing process, since they detected no replication-competent lentivirus when testing the patient’s peripheral blood at numerous time points after CTL019 infusion.
Further analysis confirmed the CARB cells were a byproduct made during CTL019 cell manufacturing.
To confirm that the leukemia relapse originated from a single clone, the investigators expanded in mice blast cells detected in the patient at month 9. Nine of 71 cells analyzed were positive for vector-host junctions. This confirmed that the relapsed cells originated from a single blast clone.
The investigators also excluded other possible reasons for the loss of CD19, including mutations, splicing variants, and structural alteration of the B-cell receptor complex.
They found that expression of the CAR in cis on B-ALL blasts masked the CAR target epitope.
The investigators concluded that their results “provide a direct confirmation of the cancer stem cell hypothesis in humans, given that clonal analysis indicated that the relapse and subsequent death of the patient were attributed to the progeny of a single leukemic blast cell with extensive replicative capacity, both in culture and in vivo.”
They called for improved manufacturing technologies that can eliminate contamination by residual tumor cells from engineered T cells.
Interestingly, this case developed not long after a case that showed essentially the opposite situation—a patient with chronic lymphocytic leukemia went into remission because of a single CAR T cell that reproduced and fought off the disease.
The Distracted Clinician
The other day, I saw my health care provider for a routine appointment—and indeed, it seemed that I saw him, rather than the other way around. After having my vital signs measured by the medical assistant, I was led into the exam room. To my surprise, the provider (I will not divulge whether he was a physician, PA, or NP) was already there, sitting in front of his computer. He glanced up to say hello, but did not stand up, shake my hand, or maintain any level of eye contact. He did swear under his breath several times—something about his hatred of electronic medical records (EMRs)—while he asked me questions, hammering away on his laptop in time with my responses. After confirming that I was there for a prescription refill, he picked up his laptop and walked out of the room. A few minutes later, he popped back in to say, “Gee, I guess I should listen to your heart.” He placed the stethoscope on my chest over my shirt for a fraction of a second and was gone again. When I got to the pharmacy, I discovered he had called in the wrong prescription.
When Harvard professor Clayton M. Christensen coined the phrase disruptive technology, I’m not sure he imagined quite this level of impact! The time focused on a computer or device, rather than on the patient, has become so disproportionate that Dr. Abraham Verghese coined the term iPatient—a result of what he calls the chart-as-surrogate-for-the-patient approach.1
While I hope my experience is not a regular occurrence in health care today, I’m well aware that the addition of e-this and e-that (computers, tablets, smartphones) at the bedside has clinicians multitasking more and more. Sure, performing more than one task at a time can be time-saving. But it can also lead to preoccupation and medical errors—at a time when medical errors are the third leading cause of death in the United States.2
We, as clinicians and as a larger society, are fascinated by speed. We want information faster than ever: medical information, lab results, etc. Our devices, stimulating and exhilarating as they are, have created a new society. Tell me you have not noticed the zombie-like motions of our colleagues walking in an electronic trance, pecking away at their preferred device! (OK, I am guilty of this, as well.)
Furthermore—and counterintuitively—efficiency in the clinic has been decimated by technology. In the “old days,” we could see patients roughly every 15 minutes, and many were double-booked. No problem; we merely dictated a note while walking from room to room, turned in our tapes at the end of the day, and signed a stack of notes two days later. Now, documentation alone takes at least 15 minutes, because it’s not just the note; it’s also the charges and the visit summary that is supposed to (but never does) go home with the patient.
So, if you want to see patients, if you want to generate revenue, if you want to keep the corporate slave drivers at bay, you either skimp on patient care or you document on your own time. One colleague lamented to me that, by implementing cost-saving measures to eliminate medical transcription ($2-$3/h outsourced to India), administrators and EMRs have reduced clinicians to the role of “Doc-retary.”
The diversion of attention, coupled with pressure to “perform,” is at the heart of the problem. Lately, every clinician I have spoken to seems to feel burdened by an influx of demands to see more patients in abbreviated visits while maintaining detailed records and documenting everything. It is no wonder that more than 75% of respondents in a study on physician distress met the criteria for burnout.3 I worry that NPs and PAs are not far behind. In a 2018 study, more than half (55.6%) of PAs rated “spending too many hours at work” as an important contributor to stress, and about 29% had previously quit a job due to stress.4
Continue to: If my own editorials are anything to judge by...
If my own editorials are anything to judge by, the joys and (welcome) challenges of the job are increasingly rare. I’ve discussed the “lost art” of the physical examination (November 2010); lamented the “death of altruism” (April 2016); and listed the pros and cons (mostly cons) of social media use (December 2017). Is careful listening to the patient the next thing to go?
We know intuitively that careful listening leads to better diagnosis and fewer errors. In fact, Balogh and colleagues identified patient engagement as one of four major cultural movements in health care (the others are patient safety, professionalism, and collaboration) that health care organizations need to foster in order to improve diagnosis and reduce errors.5 To my mind, that means finding ways to bring back the interpersonal relationship between clinician and patient and finding ways to remove the barriers that electronics can build.
I know exam room computing and EMRs are here to stay—and even, I suspect, likely to increase. But it is still possible, in my opinion, to incorporate patients into the interaction between clinician and computer. It is also possible, with the use of scribes, to have a third party transcribe your thoughts and actions as you interact directly with the patient. The last clinic I worked at operated this way, and it was liberating to be able to spend my time doing what I love best: interacting with my patients.
For those of you saying, “Yes, but my practice won’t hire scribes,” there is good advice out there on how to improve your interaction with patients in the Digital Age. In 2016, Frankel introduced the mnemonic POISED to enhance patient encounters while incorporating technologic devices:
Prepare. Review the patient’s medical records before you enter the exam room.
Continue to: Prepare
Orient. Let the patient know what you are doing or plan to do, and explain the use of the computer or scribe.
Information gathering. Although clinician-centric, this process should involve a two-way conversation between the clinician and patient.
Share. Use audiovisual sources (ie, your computer screen) to share information
Educate. Similarly, the computer can be a useful tool for educating the patient, as can low-tech materials like pictures and/or models.
Continue to: Debrief
Debrief. Review what has been said and make sure the patient has a chance to ask questions.6
The use of computers, EMRs, and other gadgets carries many potential consequences—but when used appropriately, these devices can be valuable tools for clinicians to interact with patients, stimulate engagement, and enrich patient-centered relationships. Do you agree? Please share with me your ideas on how we can better use the technology being placed before us at [email protected].
1. Verghese A. Culture shock-patient as icon, icon as patient. N Engl J Med. 2008;359(26):2748-2751.
2. Makary MA, Daniel M. Medical error—the third leading cause of death in the US. BMJ. 2016;353:i2139.
3. Wallace JE, Lemaire JB, Ghali WA. Physician wellness: a missing quality indicator. Lancet. 2009;374(9702):1714-1721.
4. Coplan B, McCall T, Smith N, et al. Burnout, job satisfaction, and stress levels of PAs. JAAPA. 2018;31(9):42-46.
5. Balogh EP, Miller BT, Ball JR; National Academies of Sciences, Engineering, and Medicine. Improving diagnosis in health care. Washington, DC; National Academies Press: 2016.
6. Frankel RM. Computers in the examination room. JAMA Intern Med. 2016;176(1):128-129.

The other day, I saw my health care provider for a routine appointment—and indeed, it seemed that I saw him, rather than the other way around. After having my vital signs measured by the medical assistant, I was led into the exam room. To my surprise, the provider (I will not divulge whether he was a physician, PA, or NP) was already there, sitting in front of his computer. He glanced up to say hello, but did not stand up, shake my hand, or maintain any level of eye contact. He did swear under his breath several times—something about his hatred of electronic medical records (EMRs)—while he asked me questions, hammering away on his laptop in time with my responses. After confirming that I was there for a prescription refill, he picked up his laptop and walked out of the room. A few minutes later, he popped back in to say, “Gee, I guess I should listen to your heart.” He placed the stethoscope on my chest over my shirt for a fraction of a second and was gone again. When I got to the pharmacy, I discovered he had called in the wrong prescription.
When Harvard professor Clayton M. Christensen coined the phrase disruptive technology, I’m not sure he imagined quite this level of impact! The time focused on a computer or device, rather than on the patient, has become so disproportionate that Dr. Abraham Verghese coined the term iPatient—a result of what he calls the chart-as-surrogate-for-the-patient approach.1
While I hope my experience is not a regular occurrence in health care today, I’m well aware that the addition of e-this and e-that (computers, tablets, smartphones) at the bedside has clinicians multitasking more and more. Sure, performing more than one task at a time can be time-saving. But it can also lead to preoccupation and medical errors—at a time when medical errors are the third leading cause of death in the United States.2
We, as clinicians and as a larger society, are fascinated by speed. We want information faster than ever: medical information, lab results, etc. Our devices, stimulating and exhilarating as they are, have created a new society. Tell me you have not noticed the zombie-like motions of our colleagues walking in an electronic trance, pecking away at their preferred device! (OK, I am guilty of this, as well.)
Furthermore—and counterintuitively—efficiency in the clinic has been decimated by technology. In the “old days,” we could see patients roughly every 15 minutes, and many were double-booked. No problem; we merely dictated a note while walking from room to room, turned in our tapes at the end of the day, and signed a stack of notes two days later. Now, documentation alone takes at least 15 minutes, because it’s not just the note; it’s also the charges and the visit summary that is supposed to (but never does) go home with the patient.
So, if you want to see patients, if you want to generate revenue, if you want to keep the corporate slave drivers at bay, you either skimp on patient care or you document on your own time. One colleague lamented to me that, by implementing cost-saving measures to eliminate medical transcription ($2-$3/h outsourced to India), administrators and EMRs have reduced clinicians to the role of “Doc-retary.”
The diversion of attention, coupled with pressure to “perform,” is at the heart of the problem. Lately, every clinician I have spoken to seems to feel burdened by an influx of demands to see more patients in abbreviated visits while maintaining detailed records and documenting everything. It is no wonder that more than 75% of respondents in a study on physician distress met the criteria for burnout.3 I worry that NPs and PAs are not far behind. In a 2018 study, more than half (55.6%) of PAs rated “spending too many hours at work” as an important contributor to stress, and about 29% had previously quit a job due to stress.4
Continue to: If my own editorials are anything to judge by...
If my own editorials are anything to judge by, the joys and (welcome) challenges of the job are increasingly rare. I’ve discussed the “lost art” of the physical examination (November 2010); lamented the “death of altruism” (April 2016); and listed the pros and cons (mostly cons) of social media use (December 2017). Is careful listening to the patient the next thing to go?
We know intuitively that careful listening leads to better diagnosis and fewer errors. In fact, Balogh and colleagues identified patient engagement as one of four major cultural movements in health care (the others are patient safety, professionalism, and collaboration) that health care organizations need to foster in order to improve diagnosis and reduce errors.5 To my mind, that means finding ways to bring back the interpersonal relationship between clinician and patient and finding ways to remove the barriers that electronics can build.
I know exam room computing and EMRs are here to stay—and even, I suspect, likely to increase. But it is still possible, in my opinion, to incorporate patients into the interaction between clinician and computer. It is also possible, with the use of scribes, to have a third party transcribe your thoughts and actions as you interact directly with the patient. The last clinic I worked at operated this way, and it was liberating to be able to spend my time doing what I love best: interacting with my patients.
For those of you saying, “Yes, but my practice won’t hire scribes,” there is good advice out there on how to improve your interaction with patients in the Digital Age. In 2016, Frankel introduced the mnemonic POISED to enhance patient encounters while incorporating technologic devices:
Prepare. Review the patient’s medical records before you enter the exam room.
Continue to: Prepare
Orient. Let the patient know what you are doing or plan to do, and explain the use of the computer or scribe.
Information gathering. Although clinician-centric, this process should involve a two-way conversation between the clinician and patient.
Share. Use audiovisual sources (ie, your computer screen) to share information
Educate. Similarly, the computer can be a useful tool for educating the patient, as can low-tech materials like pictures and/or models.
Continue to: Debrief
Debrief. Review what has been said and make sure the patient has a chance to ask questions.6
The use of computers, EMRs, and other gadgets carries many potential consequences—but when used appropriately, these devices can be valuable tools for clinicians to interact with patients, stimulate engagement, and enrich patient-centered relationships. Do you agree? Please share with me your ideas on how we can better use the technology being placed before us at [email protected].
1. Verghese A. Culture shock-patient as icon, icon as patient. N Engl J Med. 2008;359(26):2748-2751.
2. Makary MA, Daniel M. Medical error—the third leading cause of death in the US. BMJ. 2016;353:i2139.
3. Wallace JE, Lemaire JB, Ghali WA. Physician wellness: a missing quality indicator. Lancet. 2009;374(9702):1714-1721.
4. Coplan B, McCall T, Smith N, et al. Burnout, job satisfaction, and stress levels of PAs. JAAPA. 2018;31(9):42-46.
5. Balogh EP, Miller BT, Ball JR; National Academies of Sciences, Engineering, and Medicine. Improving diagnosis in health care. Washington, DC; National Academies Press: 2016.
6. Frankel RM. Computers in the examination room. JAMA Intern Med. 2016;176(1):128-129.
Noninvasive Vaginal Rejuvenation
Vaginal rejuvenation encompasses a group of procedures that alter the vaginal anatomy to improve cosmesis or achieve more pleasurable sexual intercourse. External vaginal procedures are defined as those performed on the female genitalia outside of the vaginal introitus, with major structures including the labia majora, mons pubis, labia minora, clitoral hood, clitoral glans, and vaginal vestibule. Internal vaginal procedures are defined as those performed within the vagina, extending from the vaginal introitus to the cervix.
The prevalence of elective vaginal rejuvenation procedures has increased in recent years, a trend that may be attributed to greater exposure through the media, including reality television and pornography. In a survey of 482 women undergoing labiaplasty, nearly all had heard about rejuvenation procedures within the last 2.2 years, and 78% had received their information through the media.1 Additionally, genital self-image can have a considerable effect on a woman’s sexual behavior and relationships. Genital dissatisfaction has been associated with decreased sexual activity, whereas positive genital self-image correlates with increased sexual desire and less sexual distress or depression.2,3
Currently, the 2 primary applications of noninvasive vaginal rejuvenation are vaginal laxity and genitourinary syndrome of menopause (GSM). Vaginal laxity occurs in premenopausal or postmenopausal women and is caused by aging, childbearing, or hormonal imbalances. These factors can lead to decreased friction within the vagina during intercourse, which in turn can decrease sexual pleasure. Genitourinary syndrome of menopause, previously known as vulvovaginal atrophy, encompasses genital (eg, dryness, burning, irritation), sexual (eg, lack of lubrication, discomfort or pain, impaired function), and urinary (eg, urgency, dysuria, recurrent urinary tract infections) symptoms of menopause.4
Noninvasive procedures are designed to apply ablative or nonablative energy to the vaginal mucosa to tighten a lax upper vagina, also known as a wide vagina.5 A wide vagina has been defined as a widened vaginal diameter that interferes with sexual function and sensation.6 Decreased sexual sensation also may result from fibrosis or scarring of the vaginal mucosa after prior vaginal surgery, episiotomy, or tears during childbirth.7 The objective of rejuvenation procedures to treat the vaginal mucosa is to create increased frictional forces that may lead to increased sexual sensation.8 Although there are numerous reports of heightened sexual satisfaction after reduction of the vaginal diameter, a formal link between sexual pleasure and vaginal laxity has yet to be established.8,9 At present, there are no US Food and Drug Administration (FDA)–approved energy-based devices to treat urinary incontinence or sexual function, and the FDA recently issued an alert cautioning patients on the current lack of safety and efficacy regulations.10
In this article we review the safety and efficacy data behind lasers and radiofrequency (RF) devices used in noninvasive vaginal rejuvenation procedures.
Lasers
CO2 Laser
The infrared CO2 laser utilizes 10,600-nm energy to target and vaporize water molecules within the target tissue. This thermal heating extends to the dermal collagen, which stimulates inflammatory pathways and neocollagenesis.11 The depth of penetration ranges from 20 to 125 μm.12 Zerbinati et al13 demonstrated the histologic and ultrastructural effects of a fractional CO2 laser on atrophic vaginal mucosa. Comparing pretreatment and posttreatment mucosal biopsies in 5 postmenopausal women, the investigators found that fractional CO2 laser treatment caused increased epithelial thickness, vascularity, and fibroblast activity, which led to augmented synthesis of collagen and ground substance proteins.13
New devices seek to translate these histologic improvements to the aesthetic appearance and function of female genitalia. The MonaLisa Touch (Cynosure), a new fractional CO2 laser specifically designed for treatment of the vaginal mucosa, uses dermal optical thermolysis (DOT) therapy to apply energy in a noncontinuous mode at 200-μm dots. Salvatore et al14 examined the use of this device in a noncontrolled study of 50 patients with GSM, with each patient undergoing 3 treatment sessions at monthly intervals. Intravaginal treatments were performed at the following settings: DOT (microablative zone) power of 30 W, dwell time of 1000 μs, DOT spacing of 1000 μm, and SmartStack parameter of 1 to 3. The investigators used the Vaginal Health Index (VHI) to objectively assess vaginal elasticity, secretions, pH, mucosa integrity, and moisture. Total VHI scores significantly improved between baseline and 1 month following the final treatment (mean score [SD], 13.1 [2.5] vs 23.1 [1.9]; P<.0001). There were no significant adverse events, and 84% of patients reported being satisfied with their outcome; however, the study lacked a comparison or control group, raising the possibility of placebo effect.14
Other noncontrolled series have corroborated the benefits of CO2 laser in GSM patients.15,16 In one of the largest studies to date, Filippini et al17 reviewed the outcomes of 386 menopausal women treated for GSM. Patients underwent 3 intravaginal laser sessions with the MonaLisa Touch. Intravaginal treatments were performed at a DOT power of 40 W, dwell time of 1000 μs, DOT spacing of 1000 μm, and SmartStack of 2. For the vulva, the DOT power was reduced to 30 W, dwell time of 1000 μs, DOT spacing of 1000 μm, and SmartStack of 1. Two months after the final treatment session, patients completed a nonvalidated questionnaire about their symptoms, with improved dryness reported in 60% of patients, improved burning in 56%, improved dyspareunia in 49%, improved itch in 56%, improved soreness in 73%, and improved vaginal introitus pain in 49%. Although most patients did not experience discomfort with the procedure, a minority noted a burning sensation (11%), bother with handpiece movement (6%), or vulvar pain (5%).17
Recently, Cruz et al18 performed one of the first randomized, double-blind, placebo-controlled trials comparing fractional CO2 laser therapy, topical estrogen therapy, and the combination of both treatments in patients with GSM. Forty-five women were included in the study, and validated assessments were performed at baseline and weeks 8 and 20. Intravaginal treatments were performed at a DOT power of 30 W, dwell time of 1000 μs, DOT spacing of 1000 μm, and SmartStack of 2. Importantly, the study incorporated placebo laser treatments (with the power adjusted to 0.0 W) in the topical estrogen group, thereby decreasing result bias. There was a significant increase in VHI scores from baseline to week 8 (P<.05) and week 20 (P<.01) in all study arms. At week 20, the laser group and laser plus estrogen group showed significant improvements in reported dyspareunia, burning, and dryness, whereas the estrogen arm only reported improvements in dryness (all values P<.05).18
Erbium-Doped YAG Laser
The erbium-doped YAG (Er:YAG) laser is an ablative laser emitting light at 2940 nm. This wavelength provides an absorption coefficient for water 16 times greater than the CO2 laser, leading to decreased penetration depth of 1 to 3 μm and reduced damage to the surrounding tissues.19,20 As such, the Er:YAG laser results in milder postoperative discomfort and faster overall healing times.21
In a noncontrolled study of vaginal relaxation syndrome, Lee22 used an Er:YAG laser fitted with Petit Lady (Lutronic) 90° and 360° vaginal scanning scopes. Thirty patients were divided into 2 groups and were treated with 4 sessions at weekly intervals. In group A, the first 2 sessions were performed with the 360° scope, and the last 2 sessions with the 90° scope in multiple micropulse mode (3 multishots; pulse width of 250 μs; 1.7 J delivered per shot). Group B was treated with the 90° scope in all 4 sessions in multiple micropulse mode (same parameters as group A), and during the last 2 sessions patients were additionally treated with 2 passes per session with the 360° scope (long-pulsed mode; pulse width of 1000 μs; 3.7 J delivered per shot). Perineometer measurements taken 2 months after the final treatment showed that the combined patient population experienced significant increases in both maximal vaginal pressure (P<.01) and average vaginal pressure (P<.05). Roughly 76% of patients’ partners noted improved vaginal tightening, and 70% of patients reported being satisfied with their treatment outcome. Histologic specimens taken at baseline and 2 months postprocedure showed evidence of thicker and more cellular epithelia along with more compact lamina propria with denser connective tissue. The sessions were well tolerated, with patients reporting a nonpainful heating sensation in the vagina during treatment. Three patients from the combined patient population experienced a mild burning sensation and vaginal ecchymoses, which lasted 24 to 48 hours following treatment and resolved spontaneously. There was no control group and no reports of major or long-term adverse events.22
Investigations also have shown the benefit of Er:YAG in the treatment of GSM.23,24 In a study by Gambacciani et al,24 patients treated with the Er:YAG laser FotonaSmooth (Fotona) every 30 days for 3 months reported significant improvements in vaginal dryness and dyspareunia (P<.01), which lasted up to 6 months posttreatment, though there was no placebo group comparator. Similar results were seen by Gaspar et al23 using 3 treatments at 3-week intervals, with results sustained up to 18 months after the final session.
Radiofrequency Devices
Radiofrequency devices emit focused electromagnetic waves that heat underlying tissues without targeting melanin. The release of thermal energy induces collagen contraction, neocollagenesis, and neovascularization, all of which aid in restoring the elasticity and moisture of the vaginal mucosa.25 Devices also may be equipped with cooling probes and reverse-heating gradients to protect the surface mucosa while deeper tissues are heated.
Millheiser et al26 performed a noncontrolled pilot study in 24 women with vaginal laxity using the Viveve System (Viveve), a cryogen-cooled monopolar RF device. Participants underwent a single 30-minute session (energy ranging from 75–90 J/cm2) during which the mucosal surface of the vaginal introitus (excluding the urethra) was treated with pulses at 0.5-cm overlapping intervals. Follow-up assessments were completed at 1, 3, and 6 months posttreatment. Self-reported vaginal tightness improved in 67% of participants at 1-month posttreatment and in 87% of participants at 6 months posttreatment (P<.001). There were no adverse events reported.26 Sekiguchi et al27 reported similar benefits lasting up to 12 months after a single 26-minute session at 90 J/cm2.
A prospective, randomized, placebo-controlled clinical trial using the Viveve system was recently completed by Krychman et al.28 Participants (N=186) were randomized to receive a single session of active treatment (90 J/cm2) or placebo treatment (1 J/cm2). In both groups, the vaginal introitus was treated with pulses at 0.5 cm in overlapping intervals, with the entire area (excluding the urethra) treated 5 times up to a total of 110 pulses. The primary end point was the proportion of randomized participants reporting no vaginal laxity at 6 months postin-tervention, which was assessed using the Vaginal Laxity Questionnaire. A grade of no vaginal laxity was achieved by 43.5% of participants in the active treatment group and 19.6% of participants in the sham group (P=.002). Overall numbers of treatment-emergent adverse events were comparable between the 2 groups, with the most commonly reported being vaginal discharge (2.6% in the active treatment group vs 3.5% in the sham group). There were no serious adverse events reported in the active treatment group.28
ThermiVa (ThermiGen, LLC), a unipolar RF device, was evaluated by Alinsod29 in the treatment of orgasmic dysfunction. The noncontrolled study included 25 women with self-reported difficulty achieving orgasm during intercourse, each of whom underwent 3 treatment sessions at 1-month intervals. Of the 25 enrolled women, 19 (76%) reported an average reduction in time to orgasm of at least 50%. All anorgasmic patients (n=10) at baseline reported renewed ability to achieve orgasms. Two (8%) patients failed to achieve a significant benefit from the treatments. Of note, the study did not include a control group, and specific data on the durability of beneficial effects was lacking.29
The Ultra Femme 360 (BLT Industries Inc), a monopolar RF device, was evaluated by Lalji and Lozanova30 in a noncontrolled study of 27 women with mild to moderate vaginal laxity and urinary incontinence. Participants underwent 3 treatment sessions at weekly intervals. Vaginal laxity was assessed by a subjective vulvovaginal laxity questionnaire, and data were collected before the first treatment and at 1-month follow-up. All 27 participants reported improvements in vaginal laxity, with the average grade (SD) increasing from very loose (2.19 [1.08]) to moderately tight (5.74 [0.76]; P<.05) on the questionnaire’s 7-point scale. The trial did not include a control group.30
Conclusion
With growing patient interest in vaginal rejuvenation, clinicians are increasingly incorporating a variety of procedures into their practice. Although long-term data on the safety and efficacy of these treatments has yet to be established, current evidence indicates that fractional ablative lasers and RF devices can improve vaginal laxity, sexual sensation, and symptoms of GSM.
To date, major complications have not been reported, but the FDA has advocated caution until regulatory approval is achieved.10 Concerns exist over the limited number of robust clinical trials as well as the prevalence of advertising campaigns that promise wide-ranging improvements without sufficient evidence. Definitive statements on medical or cosmetic indications will undoubtedly require more thorough investigation. At this time, the safety profile of these devices appears to be favorable, and high rates of patient satisfaction have been reported. As such, noninvasive vaginal rejuvenation procedures may represent a valuable addition to the cosmetic landscape.
- Koning M, Zeijlmans IA, Bouman TK, et al. Female attitudes regarding labia minora appearance and reduction with consideration of media influence. Aesthet Surg J. 2009;29:65-71.
- Rowen TS, Gaither TW, Shindel AW, et al. Characteristics of genital dissatisfaction among a nationally representative sample of U.S. women. J Sex Med. 2018;15:698-704.
- Berman L, Berman J, Miles M, et al. Genital self-image as a component of sexual health: relationship between genital self-image, female sexual function, and quality of life measures. J Sex Marital Ther. 2003;29(suppl 1):11-21.
- Portman DJ, Gass ML; Vulvovaginal Atrophy Terminology Consensus Conference Panel. Genitourinary syndrome of menopause: new terminology for vulvovaginal atrophy from the International Society for the Study of Women’s Sexual Health and the North American Menopause Society. Menopause. 2014;21:1063-1068.
- Goodman MP, Placik OJ, Benson RH 3rd, et al. A large multicenter outcome study of female genital plastic surgery. J Sex Med. 2010;7(4 pt 1):1565-1577.
- Ostrzenski A. Vaginal rugation rejuvenation (restoration): a new surgical technique for an acquired sensation of wide/smooth vagina. Gynecol Obstet Invest. 2012;73:48-52.
- Singh A, Swift S, Khullar V, et al. Laser vaginal rejuvenation: not ready for prime time. Int Urogynecol J. 2015;26:163-164.
- Iglesia CB, Yurteri-Kaplan L, Alinsod R. Female genital cosmetic surgery: a review of techniques and outcomes. Int Urogynecol J. 2013;24:1997-2009.
- Dobbeleir JM, Landuyt KV, Monstrey SJ. Aesthetic surgery of the female genitalia. Semin Plast Surg. 2011;25:130-141.
- US Food and Drug Administration. FDA warns against use of energy-based devices to perform vaginal ‘rejuvenation’ or vaginal cosmetic procedures: FDA safety communication. July 30, 2018. https://www.fda.gov/MedicalDevices/Safety/AlertsandNotices/ucm615013.htm. Accessed September 10, 2018.
- Patil UA, Dhami LD. Overview of lasers. Indian J Plast Surg. 2008;41(suppl):S101-S113.
- Qureshi AA, Tenenbaum MM, Myckatyn TM. Nonsurgical vulvovaginal rejuvenation with radiofrequency and laser devices: a literature review and comprehensive update for aesthetic surgeons. Aesthet Surg J. 2018;38:302-311.
- Zerbinati N, Serati M, Origoni M, et al. Microscopic and ultrastructural modifications of postmenopausal atrophic vaginal mucosa after fractional carbon dioxide laser treatment. Lasers Med Sci. 2015;30:429-436.
- Salvatore S, Nappi RE, Zerbinati N, et al. A 12-week treatment with fractional CO2 laser for vulvovaginal atrophy: a pilot study. Climacteric. 2014;17:363-369.
- Eder SE. Early effect of fractional CO2 laser treatment in post-menopausal women with vaginal atrophy. Laser Ther. 2018;27:41-47.
- Perino A, Calligaro A, Forlani F, et al. Vulvo-vaginal atrophy: a new treatment modality using thermo-ablative fractional CO2 laser. Maturitas. 2015;80:296-301.
- Filippini M, Del Duca E, Negosanti F, et al. Fractional CO2 laser: from skin rejuvenation to vulvo-vaginal reshaping. Photomed Laser Surg. 2017;35:171-175.
- Cruz VL, Steiner ML, Pompei LM, et al. Randomized, double-blind, placebo-controlled clinical trial for evaluating the efficacy of fractional CO2 laser compared with topical estriol in the treatment of vaginal atrophy in postmenopausal women. Menopause. 2018;25:21-28.
- Preissig J, Hamilton K, Markus R. Current laser resurfacing technologies: a review that delves beneath the surface. Semin Plast Surg. 2012;26:109-116.
- Kaushik SB, Alexis AF. Nonablative fractional laser resurfacing in skin of color: evidence-based review. J Clin Aesthet Dermatol. 2017;10:51-67.
- Alexiades-Armenakas MR, Dover JS, Arndt KA. Fractional laser skin resurfacing. J Drugs Dermatol. 2012;11:1274-1287.
- Lee MS. Treatment of vaginal relaxation syndrome with an erbium:YAG laser using 90 degrees and 360 degrees scanning scopes: a pilot study & short-term results. Laser Ther. 2014;23:129-138.
- Gaspar A, Brandi H, Gomez V, et al. Efficacy of erbium:YAG laser treatment compared to topical estriol treatment for symptoms of genitourinary syndrome of menopause. Lasers Surg Med. 2017;49:160-168.
- Gambacciani M, Levancini M, Cervigni M. Vaginal erbium laser: the second-generation thermotherapy for the genitourinary syndrome of menopause. Climacteric. 2015;18:757-763.
- Tadir Y, Gaspar A, Lev-Sagie A, et al. Light and energy based therapeutics for genitourinary syndrome of menopause: consensus and controversies. Lasers Surg Med. 2017;49:137-159.
- Millheiser LS, Pauls RN, Herbst SJ, et al. Radiofrequency treatment of vaginal laxity after vaginal delivery: nonsurgical vaginal tightening. J Sex Med. 2010;7:3088-3095.
- Sekiguchi Y, Utsugisawa Y, Azekosi Y, et al. Laxity of the vaginal introitus after childbirth: nonsurgical outpatient procedure for vaginal tissue restoration and improved sexual satisfaction using low-energy radiofrequency thermal therapy. J Womens Health (Larchmt). 2013;22:775-781.
- Krychman M, Rowan CG, Allan BB, et al. Effect of single-treatment, surface-cooled radiofrequency therapy on vaginal laxity and female sexual function: the VIVEVE I randomized controlled trial. J Sex Med. 2017;14:215-225.
- Alinsod RM. Transcutaneous temperature controlled radiofrequency for orgasmic dysfunction. Lasers Surg Med. 2016;48:641-645.
- Lalji S, Lozanova P. Evaluation of the safety and efficacy of a monopolar nonablative radiofrequency device for the improvement of vulvo-vaginal laxity and urinary incontinence. J Cosmet Dermatol. 2017;16:230-234.
Vaginal rejuvenation encompasses a group of procedures that alter the vaginal anatomy to improve cosmesis or achieve more pleasurable sexual intercourse. External vaginal procedures are defined as those performed on the female genitalia outside of the vaginal introitus, with major structures including the labia majora, mons pubis, labia minora, clitoral hood, clitoral glans, and vaginal vestibule. Internal vaginal procedures are defined as those performed within the vagina, extending from the vaginal introitus to the cervix.
The prevalence of elective vaginal rejuvenation procedures has increased in recent years, a trend that may be attributed to greater exposure through the media, including reality television and pornography. In a survey of 482 women undergoing labiaplasty, nearly all had heard about rejuvenation procedures within the last 2.2 years, and 78% had received their information through the media.1 Additionally, genital self-image can have a considerable effect on a woman’s sexual behavior and relationships. Genital dissatisfaction has been associated with decreased sexual activity, whereas positive genital self-image correlates with increased sexual desire and less sexual distress or depression.2,3
Currently, the 2 primary applications of noninvasive vaginal rejuvenation are vaginal laxity and genitourinary syndrome of menopause (GSM). Vaginal laxity occurs in premenopausal or postmenopausal women and is caused by aging, childbearing, or hormonal imbalances. These factors can lead to decreased friction within the vagina during intercourse, which in turn can decrease sexual pleasure. Genitourinary syndrome of menopause, previously known as vulvovaginal atrophy, encompasses genital (eg, dryness, burning, irritation), sexual (eg, lack of lubrication, discomfort or pain, impaired function), and urinary (eg, urgency, dysuria, recurrent urinary tract infections) symptoms of menopause.4
Noninvasive procedures are designed to apply ablative or nonablative energy to the vaginal mucosa to tighten a lax upper vagina, also known as a wide vagina.5 A wide vagina has been defined as a widened vaginal diameter that interferes with sexual function and sensation.6 Decreased sexual sensation also may result from fibrosis or scarring of the vaginal mucosa after prior vaginal surgery, episiotomy, or tears during childbirth.7 The objective of rejuvenation procedures to treat the vaginal mucosa is to create increased frictional forces that may lead to increased sexual sensation.8 Although there are numerous reports of heightened sexual satisfaction after reduction of the vaginal diameter, a formal link between sexual pleasure and vaginal laxity has yet to be established.8,9 At present, there are no US Food and Drug Administration (FDA)–approved energy-based devices to treat urinary incontinence or sexual function, and the FDA recently issued an alert cautioning patients on the current lack of safety and efficacy regulations.10
In this article we review the safety and efficacy data behind lasers and radiofrequency (RF) devices used in noninvasive vaginal rejuvenation procedures.
Lasers
CO2 Laser
The infrared CO2 laser utilizes 10,600-nm energy to target and vaporize water molecules within the target tissue. This thermal heating extends to the dermal collagen, which stimulates inflammatory pathways and neocollagenesis.11 The depth of penetration ranges from 20 to 125 μm.12 Zerbinati et al13 demonstrated the histologic and ultrastructural effects of a fractional CO2 laser on atrophic vaginal mucosa. Comparing pretreatment and posttreatment mucosal biopsies in 5 postmenopausal women, the investigators found that fractional CO2 laser treatment caused increased epithelial thickness, vascularity, and fibroblast activity, which led to augmented synthesis of collagen and ground substance proteins.13
New devices seek to translate these histologic improvements to the aesthetic appearance and function of female genitalia. The MonaLisa Touch (Cynosure), a new fractional CO2 laser specifically designed for treatment of the vaginal mucosa, uses dermal optical thermolysis (DOT) therapy to apply energy in a noncontinuous mode at 200-μm dots. Salvatore et al14 examined the use of this device in a noncontrolled study of 50 patients with GSM, with each patient undergoing 3 treatment sessions at monthly intervals. Intravaginal treatments were performed at the following settings: DOT (microablative zone) power of 30 W, dwell time of 1000 μs, DOT spacing of 1000 μm, and SmartStack parameter of 1 to 3. The investigators used the Vaginal Health Index (VHI) to objectively assess vaginal elasticity, secretions, pH, mucosa integrity, and moisture. Total VHI scores significantly improved between baseline and 1 month following the final treatment (mean score [SD], 13.1 [2.5] vs 23.1 [1.9]; P<.0001). There were no significant adverse events, and 84% of patients reported being satisfied with their outcome; however, the study lacked a comparison or control group, raising the possibility of placebo effect.14
Other noncontrolled series have corroborated the benefits of CO2 laser in GSM patients.15,16 In one of the largest studies to date, Filippini et al17 reviewed the outcomes of 386 menopausal women treated for GSM. Patients underwent 3 intravaginal laser sessions with the MonaLisa Touch. Intravaginal treatments were performed at a DOT power of 40 W, dwell time of 1000 μs, DOT spacing of 1000 μm, and SmartStack of 2. For the vulva, the DOT power was reduced to 30 W, dwell time of 1000 μs, DOT spacing of 1000 μm, and SmartStack of 1. Two months after the final treatment session, patients completed a nonvalidated questionnaire about their symptoms, with improved dryness reported in 60% of patients, improved burning in 56%, improved dyspareunia in 49%, improved itch in 56%, improved soreness in 73%, and improved vaginal introitus pain in 49%. Although most patients did not experience discomfort with the procedure, a minority noted a burning sensation (11%), bother with handpiece movement (6%), or vulvar pain (5%).17
Recently, Cruz et al18 performed one of the first randomized, double-blind, placebo-controlled trials comparing fractional CO2 laser therapy, topical estrogen therapy, and the combination of both treatments in patients with GSM. Forty-five women were included in the study, and validated assessments were performed at baseline and weeks 8 and 20. Intravaginal treatments were performed at a DOT power of 30 W, dwell time of 1000 μs, DOT spacing of 1000 μm, and SmartStack of 2. Importantly, the study incorporated placebo laser treatments (with the power adjusted to 0.0 W) in the topical estrogen group, thereby decreasing result bias. There was a significant increase in VHI scores from baseline to week 8 (P<.05) and week 20 (P<.01) in all study arms. At week 20, the laser group and laser plus estrogen group showed significant improvements in reported dyspareunia, burning, and dryness, whereas the estrogen arm only reported improvements in dryness (all values P<.05).18
Erbium-Doped YAG Laser
The erbium-doped YAG (Er:YAG) laser is an ablative laser emitting light at 2940 nm. This wavelength provides an absorption coefficient for water 16 times greater than the CO2 laser, leading to decreased penetration depth of 1 to 3 μm and reduced damage to the surrounding tissues.19,20 As such, the Er:YAG laser results in milder postoperative discomfort and faster overall healing times.21
In a noncontrolled study of vaginal relaxation syndrome, Lee22 used an Er:YAG laser fitted with Petit Lady (Lutronic) 90° and 360° vaginal scanning scopes. Thirty patients were divided into 2 groups and were treated with 4 sessions at weekly intervals. In group A, the first 2 sessions were performed with the 360° scope, and the last 2 sessions with the 90° scope in multiple micropulse mode (3 multishots; pulse width of 250 μs; 1.7 J delivered per shot). Group B was treated with the 90° scope in all 4 sessions in multiple micropulse mode (same parameters as group A), and during the last 2 sessions patients were additionally treated with 2 passes per session with the 360° scope (long-pulsed mode; pulse width of 1000 μs; 3.7 J delivered per shot). Perineometer measurements taken 2 months after the final treatment showed that the combined patient population experienced significant increases in both maximal vaginal pressure (P<.01) and average vaginal pressure (P<.05). Roughly 76% of patients’ partners noted improved vaginal tightening, and 70% of patients reported being satisfied with their treatment outcome. Histologic specimens taken at baseline and 2 months postprocedure showed evidence of thicker and more cellular epithelia along with more compact lamina propria with denser connective tissue. The sessions were well tolerated, with patients reporting a nonpainful heating sensation in the vagina during treatment. Three patients from the combined patient population experienced a mild burning sensation and vaginal ecchymoses, which lasted 24 to 48 hours following treatment and resolved spontaneously. There was no control group and no reports of major or long-term adverse events.22
Investigations also have shown the benefit of Er:YAG in the treatment of GSM.23,24 In a study by Gambacciani et al,24 patients treated with the Er:YAG laser FotonaSmooth (Fotona) every 30 days for 3 months reported significant improvements in vaginal dryness and dyspareunia (P<.01), which lasted up to 6 months posttreatment, though there was no placebo group comparator. Similar results were seen by Gaspar et al23 using 3 treatments at 3-week intervals, with results sustained up to 18 months after the final session.
Radiofrequency Devices
Radiofrequency devices emit focused electromagnetic waves that heat underlying tissues without targeting melanin. The release of thermal energy induces collagen contraction, neocollagenesis, and neovascularization, all of which aid in restoring the elasticity and moisture of the vaginal mucosa.25 Devices also may be equipped with cooling probes and reverse-heating gradients to protect the surface mucosa while deeper tissues are heated.
Millheiser et al26 performed a noncontrolled pilot study in 24 women with vaginal laxity using the Viveve System (Viveve), a cryogen-cooled monopolar RF device. Participants underwent a single 30-minute session (energy ranging from 75–90 J/cm2) during which the mucosal surface of the vaginal introitus (excluding the urethra) was treated with pulses at 0.5-cm overlapping intervals. Follow-up assessments were completed at 1, 3, and 6 months posttreatment. Self-reported vaginal tightness improved in 67% of participants at 1-month posttreatment and in 87% of participants at 6 months posttreatment (P<.001). There were no adverse events reported.26 Sekiguchi et al27 reported similar benefits lasting up to 12 months after a single 26-minute session at 90 J/cm2.
A prospective, randomized, placebo-controlled clinical trial using the Viveve system was recently completed by Krychman et al.28 Participants (N=186) were randomized to receive a single session of active treatment (90 J/cm2) or placebo treatment (1 J/cm2). In both groups, the vaginal introitus was treated with pulses at 0.5 cm in overlapping intervals, with the entire area (excluding the urethra) treated 5 times up to a total of 110 pulses. The primary end point was the proportion of randomized participants reporting no vaginal laxity at 6 months postin-tervention, which was assessed using the Vaginal Laxity Questionnaire. A grade of no vaginal laxity was achieved by 43.5% of participants in the active treatment group and 19.6% of participants in the sham group (P=.002). Overall numbers of treatment-emergent adverse events were comparable between the 2 groups, with the most commonly reported being vaginal discharge (2.6% in the active treatment group vs 3.5% in the sham group). There were no serious adverse events reported in the active treatment group.28
ThermiVa (ThermiGen, LLC), a unipolar RF device, was evaluated by Alinsod29 in the treatment of orgasmic dysfunction. The noncontrolled study included 25 women with self-reported difficulty achieving orgasm during intercourse, each of whom underwent 3 treatment sessions at 1-month intervals. Of the 25 enrolled women, 19 (76%) reported an average reduction in time to orgasm of at least 50%. All anorgasmic patients (n=10) at baseline reported renewed ability to achieve orgasms. Two (8%) patients failed to achieve a significant benefit from the treatments. Of note, the study did not include a control group, and specific data on the durability of beneficial effects was lacking.29
The Ultra Femme 360 (BLT Industries Inc), a monopolar RF device, was evaluated by Lalji and Lozanova30 in a noncontrolled study of 27 women with mild to moderate vaginal laxity and urinary incontinence. Participants underwent 3 treatment sessions at weekly intervals. Vaginal laxity was assessed by a subjective vulvovaginal laxity questionnaire, and data were collected before the first treatment and at 1-month follow-up. All 27 participants reported improvements in vaginal laxity, with the average grade (SD) increasing from very loose (2.19 [1.08]) to moderately tight (5.74 [0.76]; P<.05) on the questionnaire’s 7-point scale. The trial did not include a control group.30
Conclusion
With growing patient interest in vaginal rejuvenation, clinicians are increasingly incorporating a variety of procedures into their practice. Although long-term data on the safety and efficacy of these treatments has yet to be established, current evidence indicates that fractional ablative lasers and RF devices can improve vaginal laxity, sexual sensation, and symptoms of GSM.
To date, major complications have not been reported, but the FDA has advocated caution until regulatory approval is achieved.10 Concerns exist over the limited number of robust clinical trials as well as the prevalence of advertising campaigns that promise wide-ranging improvements without sufficient evidence. Definitive statements on medical or cosmetic indications will undoubtedly require more thorough investigation. At this time, the safety profile of these devices appears to be favorable, and high rates of patient satisfaction have been reported. As such, noninvasive vaginal rejuvenation procedures may represent a valuable addition to the cosmetic landscape.
- Koning M, Zeijlmans IA, Bouman TK, et al. Female attitudes regarding labia minora appearance and reduction with consideration of media influence. Aesthet Surg J. 2009;29:65-71.
- Rowen TS, Gaither TW, Shindel AW, et al. Characteristics of genital dissatisfaction among a nationally representative sample of U.S. women. J Sex Med. 2018;15:698-704.
- Berman L, Berman J, Miles M, et al. Genital self-image as a component of sexual health: relationship between genital self-image, female sexual function, and quality of life measures. J Sex Marital Ther. 2003;29(suppl 1):11-21.
- Portman DJ, Gass ML; Vulvovaginal Atrophy Terminology Consensus Conference Panel. Genitourinary syndrome of menopause: new terminology for vulvovaginal atrophy from the International Society for the Study of Women’s Sexual Health and the North American Menopause Society. Menopause. 2014;21:1063-1068.
- Goodman MP, Placik OJ, Benson RH 3rd, et al. A large multicenter outcome study of female genital plastic surgery. J Sex Med. 2010;7(4 pt 1):1565-1577.
- Ostrzenski A. Vaginal rugation rejuvenation (restoration): a new surgical technique for an acquired sensation of wide/smooth vagina. Gynecol Obstet Invest. 2012;73:48-52.
- Singh A, Swift S, Khullar V, et al. Laser vaginal rejuvenation: not ready for prime time. Int Urogynecol J. 2015;26:163-164.
- Iglesia CB, Yurteri-Kaplan L, Alinsod R. Female genital cosmetic surgery: a review of techniques and outcomes. Int Urogynecol J. 2013;24:1997-2009.
- Dobbeleir JM, Landuyt KV, Monstrey SJ. Aesthetic surgery of the female genitalia. Semin Plast Surg. 2011;25:130-141.
- US Food and Drug Administration. FDA warns against use of energy-based devices to perform vaginal ‘rejuvenation’ or vaginal cosmetic procedures: FDA safety communication. July 30, 2018. https://www.fda.gov/MedicalDevices/Safety/AlertsandNotices/ucm615013.htm. Accessed September 10, 2018.
- Patil UA, Dhami LD. Overview of lasers. Indian J Plast Surg. 2008;41(suppl):S101-S113.
- Qureshi AA, Tenenbaum MM, Myckatyn TM. Nonsurgical vulvovaginal rejuvenation with radiofrequency and laser devices: a literature review and comprehensive update for aesthetic surgeons. Aesthet Surg J. 2018;38:302-311.
- Zerbinati N, Serati M, Origoni M, et al. Microscopic and ultrastructural modifications of postmenopausal atrophic vaginal mucosa after fractional carbon dioxide laser treatment. Lasers Med Sci. 2015;30:429-436.
- Salvatore S, Nappi RE, Zerbinati N, et al. A 12-week treatment with fractional CO2 laser for vulvovaginal atrophy: a pilot study. Climacteric. 2014;17:363-369.
- Eder SE. Early effect of fractional CO2 laser treatment in post-menopausal women with vaginal atrophy. Laser Ther. 2018;27:41-47.
- Perino A, Calligaro A, Forlani F, et al. Vulvo-vaginal atrophy: a new treatment modality using thermo-ablative fractional CO2 laser. Maturitas. 2015;80:296-301.
- Filippini M, Del Duca E, Negosanti F, et al. Fractional CO2 laser: from skin rejuvenation to vulvo-vaginal reshaping. Photomed Laser Surg. 2017;35:171-175.
- Cruz VL, Steiner ML, Pompei LM, et al. Randomized, double-blind, placebo-controlled clinical trial for evaluating the efficacy of fractional CO2 laser compared with topical estriol in the treatment of vaginal atrophy in postmenopausal women. Menopause. 2018;25:21-28.
- Preissig J, Hamilton K, Markus R. Current laser resurfacing technologies: a review that delves beneath the surface. Semin Plast Surg. 2012;26:109-116.
- Kaushik SB, Alexis AF. Nonablative fractional laser resurfacing in skin of color: evidence-based review. J Clin Aesthet Dermatol. 2017;10:51-67.
- Alexiades-Armenakas MR, Dover JS, Arndt KA. Fractional laser skin resurfacing. J Drugs Dermatol. 2012;11:1274-1287.
- Lee MS. Treatment of vaginal relaxation syndrome with an erbium:YAG laser using 90 degrees and 360 degrees scanning scopes: a pilot study & short-term results. Laser Ther. 2014;23:129-138.
- Gaspar A, Brandi H, Gomez V, et al. Efficacy of erbium:YAG laser treatment compared to topical estriol treatment for symptoms of genitourinary syndrome of menopause. Lasers Surg Med. 2017;49:160-168.
- Gambacciani M, Levancini M, Cervigni M. Vaginal erbium laser: the second-generation thermotherapy for the genitourinary syndrome of menopause. Climacteric. 2015;18:757-763.
- Tadir Y, Gaspar A, Lev-Sagie A, et al. Light and energy based therapeutics for genitourinary syndrome of menopause: consensus and controversies. Lasers Surg Med. 2017;49:137-159.
- Millheiser LS, Pauls RN, Herbst SJ, et al. Radiofrequency treatment of vaginal laxity after vaginal delivery: nonsurgical vaginal tightening. J Sex Med. 2010;7:3088-3095.
- Sekiguchi Y, Utsugisawa Y, Azekosi Y, et al. Laxity of the vaginal introitus after childbirth: nonsurgical outpatient procedure for vaginal tissue restoration and improved sexual satisfaction using low-energy radiofrequency thermal therapy. J Womens Health (Larchmt). 2013;22:775-781.
- Krychman M, Rowan CG, Allan BB, et al. Effect of single-treatment, surface-cooled radiofrequency therapy on vaginal laxity and female sexual function: the VIVEVE I randomized controlled trial. J Sex Med. 2017;14:215-225.
- Alinsod RM. Transcutaneous temperature controlled radiofrequency for orgasmic dysfunction. Lasers Surg Med. 2016;48:641-645.
- Lalji S, Lozanova P. Evaluation of the safety and efficacy of a monopolar nonablative radiofrequency device for the improvement of vulvo-vaginal laxity and urinary incontinence. J Cosmet Dermatol. 2017;16:230-234.
Practice Points
- Noninvasive vaginal rejuvenation represents a growing area of cosmetic dermatology.
- Radiofrequency and ablative laser devices have demonstrated promising results in treating vaginal laxity and genitourinary syndrome of menopause, but US Food and Drug Administration approval has yet to be obtained.
Aquatic Antagonists: Lionfish (Pterois volitans)
The lionfish (Pterois volitans) is a member of the Scorpaenidae family of venomous fish.1-3 Lionfish are an invasive species originally from the Indian and Pacific oceans and the Red Sea that now are widely found throughout tropical and temperate oceans in both hemispheres. They are a popular aquarium fish and were inadvertently introduced in the Atlantic Ocean in South Florida during the late 1980s to early 1990s.2,4 Since then, lionfish have spread into reef systems throughout the Atlantic Ocean, Caribbean Sea, and Gulf of Mexico in rapidly growing numbers, and they are now fo und all along the southeastern coast of the United States.5
Characteristics
Lionfish are brightly colored with red or maroon and white stripes, tentacles above the eyes and mouth, fan-shaped pectoral fins, and spines that deliver an especially painful venomous sting that often results in edema (Figure 1). They have 12 dorsal spines, 2 pelvic spines, and 3 anal spines.

Symptoms of Envenomation
As lionfish continue to spread to popular areas of the southeast Atlantic Ocean and Caribbean Sea, the chances of human contact with lionfish have increased. Lionfish stings are now the second most common marine envenomation injury after those caused by stingrays.4 Lionfish stings usually occur on the hands, fingers, or forearms during handling of the fish in ocean waters or in maintenance of aquariums. The mechanism of the venom apparatus is similar for all venomous fish. The spines have surrounding integumentary sheaths containing venom that rupture and inject venom when they penetrate the skin.6 The venom is a heat-labile neuromuscular toxin that causes edema (Figure 2), plasma extravasation, and thrombotic skin lesions.7
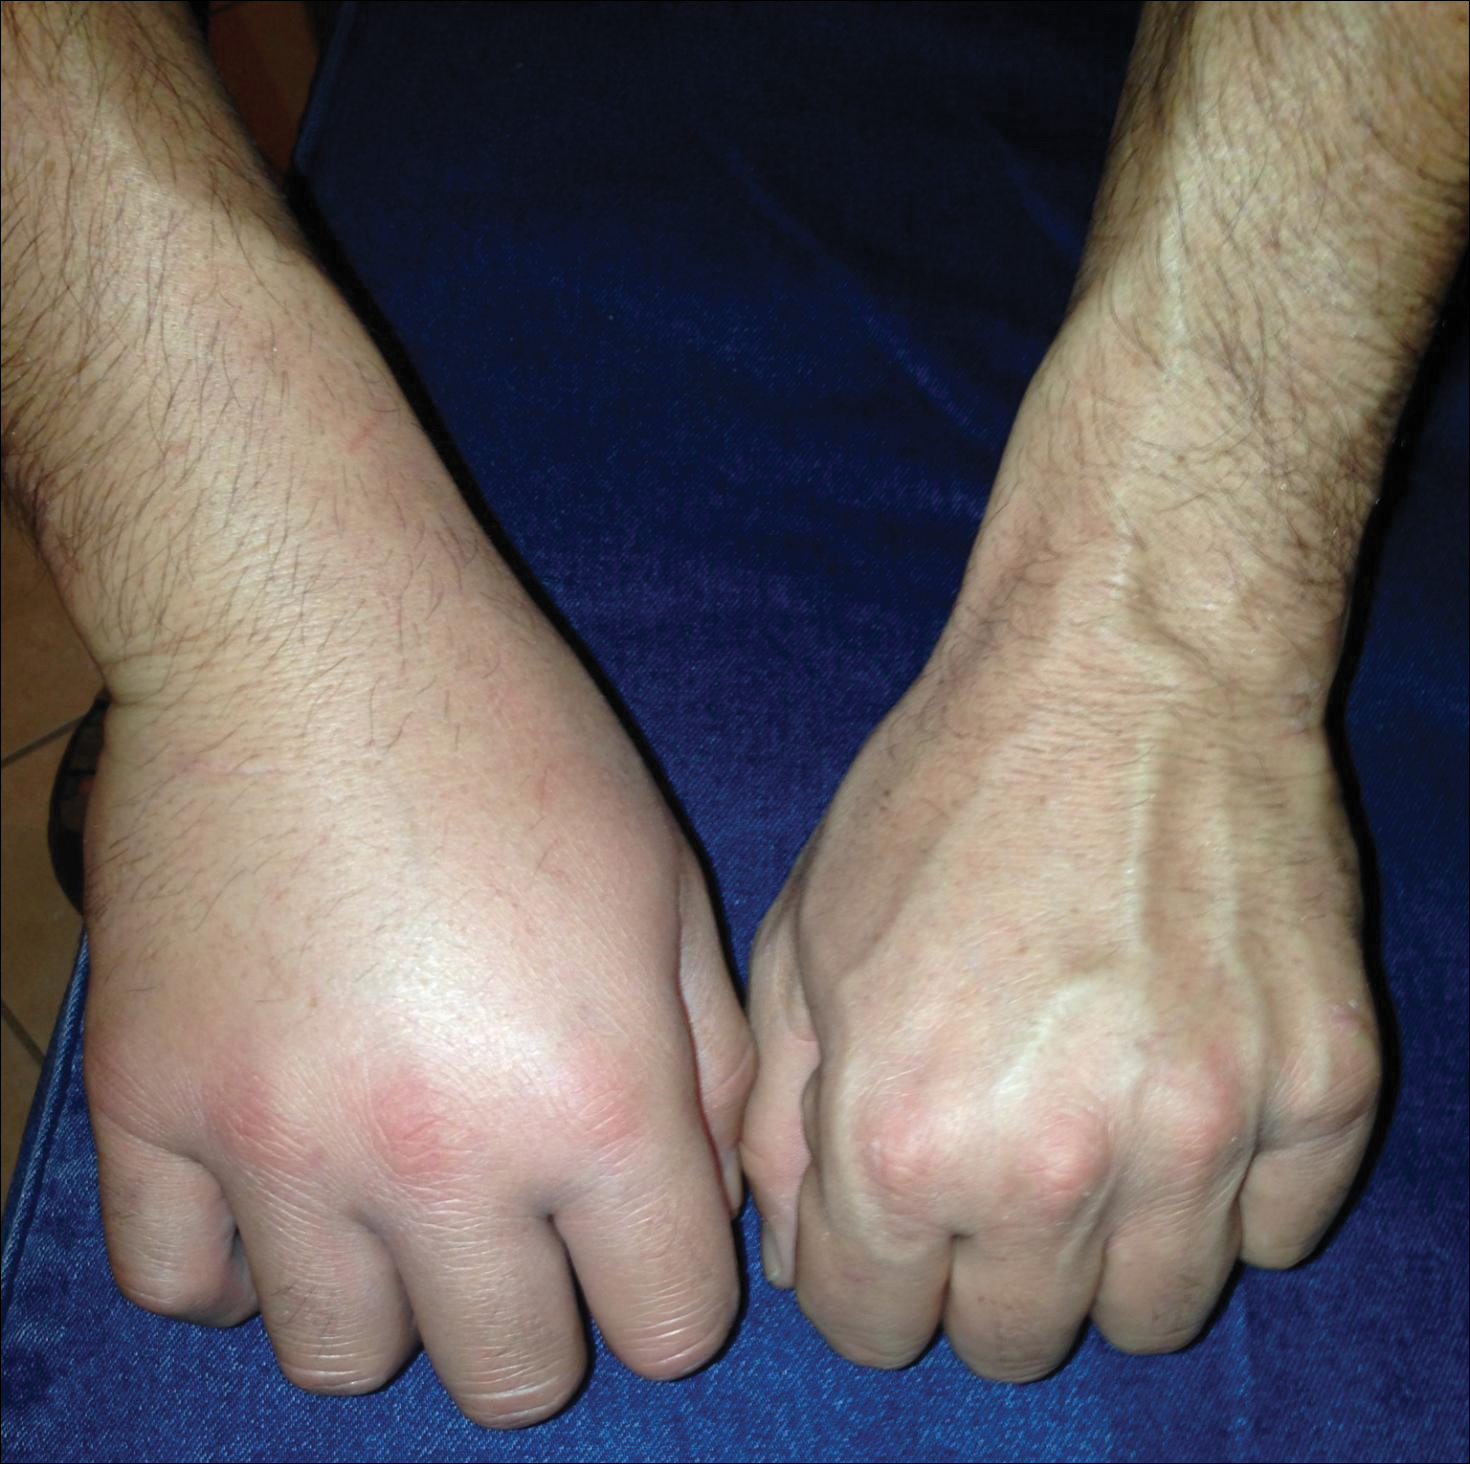
Wounds are classified into 3 categories: grade I consists of local erythema/ecchymosis, grade II involves vesicle or blister formation, and grade III denotes wounds that develop local necrosis.8 The sting causes immediate and severe throbbing pain, often described as excruciating or rated 10/10 on a basic pain scale, typically radiating up the affected limb. Puncture sites may bleed and often have associated redness and swelling. Pain may last up to 24 hours. Occasionally, foreign material may be left in the wound requiring removal. There also is a chance of secondary infection at the wound site, and severe envenomation can lead to local tissue necrosis.8 Systemic effects can occur in some cases, including nausea, vomiting, sweating, headache, dizziness, disorientation, palpitations, and even syncope.9 However, to our knowledge there are no documented cases of human death from a lionfish sting. Anaphylactic reactions are possible and require immediate treatment.6
A study conducted in the French West Indies evaluated 117 patients with lionfish envenomation and found that victims experienced severe pain and local edema (100%), paresthesia (90%), abdominal cramps (62%), extensive edema (53%), tachycardia (34%), skin rash (32%), gastrointestinal tract symptoms (28%), syncope (27%), transient weakness (24%), hypertension (21%), hypotension (18%), and hyperthermia (9%).9 Complications included local infection (18%) such as skin abscess (5%), skin necrosis (3%), and septic arthritis (2%). Twenty-two percent of patients were hospitalized and 8% required surgery. Local infectious complications were more frequent in those with multiple stings (19%). The study concluded that lionfish now represent a major health threat in the West Indies.9 As lionfish numbers have grown, health care providers are seeing increasing numbers of envenomation cases in areas of the coastal southeastern United States and Caribbean associated with considerable morbidity. Providers in nonendemic areas also may see envenomation injuries due to the lionfish popularity in home aquariums.9
Management
Individuals with lionfish stings should immerse the affected area in hot but not scalding water. Those with more serious injuries should seek medical attention. Home remedies that are generally contraindicated include application of topical papain or meat tenderizer.10 Data on ice packs are mixed, but because the toxin is heat labile, the most effective initial step in treatment is immersion of the affected area in water (temperature, 40°C to 45°C) for 30 to 90 minutes.6 The hot water inactivates the heat-labile toxin, leading to near-complete symptomatic relief in 80% of cases and moderate relief in an additional 14%. Immersion time more than 90 minutes considerably increases the risk for burns. Children should always be monitored to prevent burns. If a patient has received a nerve block for analgesia, the wound should not be immersed in hot water to avoid burns to the skin. The wound should be meticulously cleaned with saline irrigation, and radiography or ultrasonography should be performed as deemed necessary to look for any retained foreign bodies.8 Patients may require parenteral or oral analgesia as well as careful follow-up to ensure proper healing.9 Systemic symptoms require supportive care. Venomous fish wounds typically are small and superficial. Empiric antibiotic therapy is not advised for superficial wounds but may be required for clinically infected wounds.8 Tetanus prophylaxis should be given as appropriate to all affected patients. It has been noted that blister fluid contains high concentrations of lionfish venom, and when present, it increases the likelihood of converting the injury from a grade II to grade III wound with tissue necrosis; therefore, blisters should be drained or excised to decrease the chances of subsequent tissue necrosis.11,12 If secondary infection such as cellulitis develops, antibiotics should be chosen to cover likely pathogens including common skin flora such as staphylococci and marine organisms such as Vibrio species. Wounds showing signs of infection should be cultured, with antibiotics adjusted according to sensitivities.5 Deeper wounds should be left open (unsutured) with a proper dressing to heal. Any wounds that involve vascular or joint structures require specialty management. Wounds involving joints may on occasion require surgical exploration and debridement.
Public Health Concerns
In an attempt to slow the growth of their population, human consumption of the fish has been encouraged. The lionfish toxin is inactivated by cooking, and the fish is considered a delicacy; however, a study in the Virgin Islands found that in areas with endemic ciguatera poisoning, 12% of lionfish carried amounts of the toxin above the level considered safe for consumption. This toxin is not inactivated by cooking or freezing and can lead to ciguatera fish poisoning for which there is no antidote and can be associated with prolonged neurotoxicity.13
Conclusion
As lionfish numbers continue to increase, physicians across multiple specialties and regions may see an increase in envenomation injuries. It is important that physicians are aware of how to recognize and treat lionfish stings, as prompt and comprehensive treatment provides benefit to the patient.
- Pterois volitans. Integrated Taxonomic Information System website. https://www.itis.gov/servlet/SingleRpt/SingleRpt?search_topic=TSN&search_value=166883#null. Accessed September 6, 2018.
- Morris JA Jr, Whitfield PE. Biology, Ecology, Control and Management of the Invasive Indopacific Lionfish: An Updated Integrated Assessment. Beaufort, NC: National Oceanic and Atmospheric Administration; 2009. http://aquaticcommons.org/2847/1/NCCOS_TM_99.pdf. Accessed September 6, 2018.
- Pterois volitans/miles. US Geological Survey website. https://nas.er.usgs.gov/queries/FactSheet.aspx?speciesID=963. Revised April 18, 2018. Accessed September 6, 2018.
- Diaz JH. Invasive lionfish (Pterois volitans) pose public health threats [published online August 15, 2015]. J La State Med Soc. 2015;167:166-171.
- Diaz JH. Marine Scorpaenidae envenomation in travelers: epidemiology, management, and prevention. J Travel Med. 2015;22:251-258.
- Hobday D, Chadha P, Din AH, et al. Denaturing the lionfish. Eplasty. 2016;16:ic20.
- Sáenz A, Ortiz N, Lomonte B, et al. Comparison of biochemical and cytotoxic activities of extracts obtained from dorsal spines and caudal fin of adult and juvenile non-native Caribbean lionfish (Pterois volitans/miles). Toxicon. 2017;137:158-167.
- Schult RF, Acquisto NM, Stair CK, et al. A case of lionfish envenomation presenting to an inland emergency department [published online August 13, 2017]. Case Rep Emerg Med. 2017;2017:5893563.
- Resiere D, Cerland L, De Haro L, et al. Envenomation by the invasive Pterois volitans species (lionfish) in the French West Indies—a two-year prospective study in Martinique. Clin Toxicol (Phila). 2016;54:313-318.
- Auerbach PS. Envenomation by aquatic vertebrates. In: Auerback PS. Wilderness Medicine. 5th ed. Philadelphia, PA: Mosby Elsevier; 2007:1740-1741.
- Auerbach PS, McKinney HE, Rees RE, et al. Analysis of vesicle fluid following the sting of the lionfish, Pterois volitans. Toxicon. 1987;25:1350-1353.
- Patel MR, Wells S. Lionfish envenomation of the hand. J Hand Surg Am. 1993;18:523-525.
- Robertson A, Garcia AC, Quintana HA, et al. Invasive lionfish (Pterois volitans): a potential human health threat for Ciguatera fish poisoning in tropical waters. Marine Drugs. 2014;12:88-97.
The lionfish (Pterois volitans) is a member of the Scorpaenidae family of venomous fish.1-3 Lionfish are an invasive species originally from the Indian and Pacific oceans and the Red Sea that now are widely found throughout tropical and temperate oceans in both hemispheres. They are a popular aquarium fish and were inadvertently introduced in the Atlantic Ocean in South Florida during the late 1980s to early 1990s.2,4 Since then, lionfish have spread into reef systems throughout the Atlantic Ocean, Caribbean Sea, and Gulf of Mexico in rapidly growing numbers, and they are now fo und all along the southeastern coast of the United States.5
Characteristics
Lionfish are brightly colored with red or maroon and white stripes, tentacles above the eyes and mouth, fan-shaped pectoral fins, and spines that deliver an especially painful venomous sting that often results in edema (Figure 1). They have 12 dorsal spines, 2 pelvic spines, and 3 anal spines.
Symptoms of Envenomation
As lionfish continue to spread to popular areas of the southeast Atlantic Ocean and Caribbean Sea, the chances of human contact with lionfish have increased. Lionfish stings are now the second most common marine envenomation injury after those caused by stingrays.4 Lionfish stings usually occur on the hands, fingers, or forearms during handling of the fish in ocean waters or in maintenance of aquariums. The mechanism of the venom apparatus is similar for all venomous fish. The spines have surrounding integumentary sheaths containing venom that rupture and inject venom when they penetrate the skin.6 The venom is a heat-labile neuromuscular toxin that causes edema (Figure 2), plasma extravasation, and thrombotic skin lesions.7
Wounds are classified into 3 categories: grade I consists of local erythema/ecchymosis, grade II involves vesicle or blister formation, and grade III denotes wounds that develop local necrosis.8 The sting causes immediate and severe throbbing pain, often described as excruciating or rated 10/10 on a basic pain scale, typically radiating up the affected limb. Puncture sites may bleed and often have associated redness and swelling. Pain may last up to 24 hours. Occasionally, foreign material may be left in the wound requiring removal. There also is a chance of secondary infection at the wound site, and severe envenomation can lead to local tissue necrosis.8 Systemic effects can occur in some cases, including nausea, vomiting, sweating, headache, dizziness, disorientation, palpitations, and even syncope.9 However, to our knowledge there are no documented cases of human death from a lionfish sting. Anaphylactic reactions are possible and require immediate treatment.6
A study conducted in the French West Indies evaluated 117 patients with lionfish envenomation and found that victims experienced severe pain and local edema (100%), paresthesia (90%), abdominal cramps (62%), extensive edema (53%), tachycardia (34%), skin rash (32%), gastrointestinal tract symptoms (28%), syncope (27%), transient weakness (24%), hypertension (21%), hypotension (18%), and hyperthermia (9%).9 Complications included local infection (18%) such as skin abscess (5%), skin necrosis (3%), and septic arthritis (2%). Twenty-two percent of patients were hospitalized and 8% required surgery. Local infectious complications were more frequent in those with multiple stings (19%). The study concluded that lionfish now represent a major health threat in the West Indies.9 As lionfish numbers have grown, health care providers are seeing increasing numbers of envenomation cases in areas of the coastal southeastern United States and Caribbean associated with considerable morbidity. Providers in nonendemic areas also may see envenomation injuries due to the lionfish popularity in home aquariums.9
Management
Individuals with lionfish stings should immerse the affected area in hot but not scalding water. Those with more serious injuries should seek medical attention. Home remedies that are generally contraindicated include application of topical papain or meat tenderizer.10 Data on ice packs are mixed, but because the toxin is heat labile, the most effective initial step in treatment is immersion of the affected area in water (temperature, 40°C to 45°C) for 30 to 90 minutes.6 The hot water inactivates the heat-labile toxin, leading to near-complete symptomatic relief in 80% of cases and moderate relief in an additional 14%. Immersion time more than 90 minutes considerably increases the risk for burns. Children should always be monitored to prevent burns. If a patient has received a nerve block for analgesia, the wound should not be immersed in hot water to avoid burns to the skin. The wound should be meticulously cleaned with saline irrigation, and radiography or ultrasonography should be performed as deemed necessary to look for any retained foreign bodies.8 Patients may require parenteral or oral analgesia as well as careful follow-up to ensure proper healing.9 Systemic symptoms require supportive care. Venomous fish wounds typically are small and superficial. Empiric antibiotic therapy is not advised for superficial wounds but may be required for clinically infected wounds.8 Tetanus prophylaxis should be given as appropriate to all affected patients. It has been noted that blister fluid contains high concentrations of lionfish venom, and when present, it increases the likelihood of converting the injury from a grade II to grade III wound with tissue necrosis; therefore, blisters should be drained or excised to decrease the chances of subsequent tissue necrosis.11,12 If secondary infection such as cellulitis develops, antibiotics should be chosen to cover likely pathogens including common skin flora such as staphylococci and marine organisms such as Vibrio species. Wounds showing signs of infection should be cultured, with antibiotics adjusted according to sensitivities.5 Deeper wounds should be left open (unsutured) with a proper dressing to heal. Any wounds that involve vascular or joint structures require specialty management. Wounds involving joints may on occasion require surgical exploration and debridement.
Public Health Concerns
In an attempt to slow the growth of their population, human consumption of the fish has been encouraged. The lionfish toxin is inactivated by cooking, and the fish is considered a delicacy; however, a study in the Virgin Islands found that in areas with endemic ciguatera poisoning, 12% of lionfish carried amounts of the toxin above the level considered safe for consumption. This toxin is not inactivated by cooking or freezing and can lead to ciguatera fish poisoning for which there is no antidote and can be associated with prolonged neurotoxicity.13
Conclusion
As lionfish numbers continue to increase, physicians across multiple specialties and regions may see an increase in envenomation injuries. It is important that physicians are aware of how to recognize and treat lionfish stings, as prompt and comprehensive treatment provides benefit to the patient.
- Pterois volitans. Integrated Taxonomic Information System website. https://www.itis.gov/servlet/SingleRpt/SingleRpt?search_topic=TSN&search_value=166883#null. Accessed September 6, 2018.
- Morris JA Jr, Whitfield PE. Biology, Ecology, Control and Management of the Invasive Indopacific Lionfish: An Updated Integrated Assessment. Beaufort, NC: National Oceanic and Atmospheric Administration; 2009. http://aquaticcommons.org/2847/1/NCCOS_TM_99.pdf. Accessed September 6, 2018.
- Pterois volitans/miles. US Geological Survey website. https://nas.er.usgs.gov/queries/FactSheet.aspx?speciesID=963. Revised April 18, 2018. Accessed September 6, 2018.
- Diaz JH. Invasive lionfish (Pterois volitans) pose public health threats [published online August 15, 2015]. J La State Med Soc. 2015;167:166-171.
- Diaz JH. Marine Scorpaenidae envenomation in travelers: epidemiology, management, and prevention. J Travel Med. 2015;22:251-258.
- Hobday D, Chadha P, Din AH, et al. Denaturing the lionfish. Eplasty. 2016;16:ic20.
- Sáenz A, Ortiz N, Lomonte B, et al. Comparison of biochemical and cytotoxic activities of extracts obtained from dorsal spines and caudal fin of adult and juvenile non-native Caribbean lionfish (Pterois volitans/miles). Toxicon. 2017;137:158-167.
- Schult RF, Acquisto NM, Stair CK, et al. A case of lionfish envenomation presenting to an inland emergency department [published online August 13, 2017]. Case Rep Emerg Med. 2017;2017:5893563.
- Resiere D, Cerland L, De Haro L, et al. Envenomation by the invasive Pterois volitans species (lionfish) in the French West Indies—a two-year prospective study in Martinique. Clin Toxicol (Phila). 2016;54:313-318.
- Auerbach PS. Envenomation by aquatic vertebrates. In: Auerback PS. Wilderness Medicine. 5th ed. Philadelphia, PA: Mosby Elsevier; 2007:1740-1741.
- Auerbach PS, McKinney HE, Rees RE, et al. Analysis of vesicle fluid following the sting of the lionfish, Pterois volitans. Toxicon. 1987;25:1350-1353.
- Patel MR, Wells S. Lionfish envenomation of the hand. J Hand Surg Am. 1993;18:523-525.
- Robertson A, Garcia AC, Quintana HA, et al. Invasive lionfish (Pterois volitans): a potential human health threat for Ciguatera fish poisoning in tropical waters. Marine Drugs. 2014;12:88-97.
Practice Points
- Lionfish are now found all along the southeastern coast of the United States. Physicians may see an increase in envenomation injuries.
- Treat lionfish envenomation with immediate immersion in warm water (temperature, 40°C to 45°C) for 30 to 90 minutes to deactivate heat-labile toxin.
- Infected wounds should be treated with antibiotics for common skin flora and marine organisms such as Vibrio species.
Investing in the Future of Inpatient Dermatology: The Evolution and Impact of Specialized Dermatologic Consultation in Hospitalized Patients
The practice of inpatient dermatology has a rich history rooted in specialized hospital wards that housed patients with chronic dermatoses. Because systemic agents were limited, the care of these patients required skilled nursing and a distinctive knowledge of the application of numerous topical agents, including washes, baths, powders, lotions, and pastes1; however, with the evolving nature of health care in the last half a century, such dermatologic inpatient units are now rare, with only 2 units remaining in the United States, specifically at the Mayo Clinic in Minnesota and at the University of Miami.2
Although the shift away from a primary dermatologic admitting service is likely multifactorial, what is more sobering is that the majority of inpatients with dermatologic disorders are cared for by nondermatologists.2 Although the dynamics for such a diminished presence are due to various personal and professional concerns, the essential outcome for patients hospitalized with a cutaneous concern—whether directly related to their hospitalization or iatrogenic in nature—is the potential for suboptimal care.3
Fortunately, the practice of inpatient dermatology currently is undergoing a renaissance. With this renewed interest in hospital-based dermatology, there is a growing body of evidence that demonstrates how the dermatology hospitalist has become a vital member of the inpatient team, adding value to the care of patients across all specialties.
To explore the impact of consultative dermatology services, there has been a push by members of the Society for Dermatology Hospitalists to elucidate the contributions of dermatologists in the inpatient setting, which has been accomplished primarily by defining and characterizing the types of patients that dermatology hospitalists care for and, more recently, by demonstrating the improved outcomes that result from expert consultation.
Breadth of Inpatient Dermatologic Consultations
With the adaptation of dermatology consultation services, the scope of practice has shifted from the skilled management of chronic dermatoses to one with an emphasis on the identification of various acute dermatologic diseases. Although the extent of such acute disease states in the inpatient setting is vast, it is interesting to note that the majority of consultations are for common conditions, namely cutaneous infections, venous stasis dermatitis, contact dermatitis, atopic dermatitis, and cutaneous drug eruptions (Table).4,5

Moreover, for the services that obtain dermatologic consultation, the majority of requests originate from internal medicine and hematology/oncology.4,5 Although internal medicine often is the largest-represented specialty in the hospital and provides a proportional amount of dermatology consultations, hematology/oncology patients represent a distinct cohort who are prone to unique mucocutaneous dermatoses related to underlying malignancies, immunosuppression, and cancer-specific therapies (eg, chemotherapy, immunotherapy, stem cell transplantation). Within this subset of patients, cutaneous infections and drug eruptions constitute the majority of cases, while graft-versus-host disease and neutrophilic dermatoses account for a smaller percentage of dermatologic disease in this population. Given the complex and uncommon nature of these dermatoses, timely intervention by a dermatologist can have a considerable impact on morbidity and mortality associated with such disease states.6,7
Among pediatric patients, dermatology consultation patterns mimic those seen among adult patients, with common conditions such as atopic dermatitis and contact dermatitis representing the majority of consultations.8-11 Vascular lesions further represent a unique source of consultation among pediatric patients. Although they often are considered an outpatient concern, one group found that the majority of inpatient consultations for vascular lesions led to early identification of a syndromic association and/or complication (eg, ulceration).10 Identifying these cases in the hospital provides early opportunities for intervention and multidisciplinary care.
Adding Value to the Care of Hospitalized Patients
Following other inpatient models, hospitalist dermatology has begun to demonstrate feasibility, advances in quality improvement, and most importantly improved health care outcomes. In an effort to better characterize the enhancement of such health care delivery, recent literature around the impact of inpatient dermatology consultation has centered on improving key objective hospital-based quality measures, namely diagnosis and management as well as hospital length of stay (LOS) and readmission rates.5,12-18
When identifying cutaneous disease, recent evidence points to the increased diagnostic accuracy by way of dermatology consultation. Specifically, diagnoses were changed 30% to 70% of the time when consultations were provided.6,12-15 Interestingly, misdiagnosis regularly centered on common diagnoses, specifically cellulitis, stasis dermatitis, and hypersensitivity reactions.6,12-16 In a multi-institutional retrospective study that examined the national incidence of cellulitis misdiagnosis, the authors found that when a dermatology consultation for presumed cellulitis was called, approximately 75% (N=55) of cases represented mimickers of cellulitis, such as stasis dermatitis, contact dermatitis, and cutaneous fungal infections. Moreover, in more than 38% (N=21) of such cellulitis consultations, patients often had more than one ongoing disease process, further speaking to the diagnostic accuracy obtained from expert consultation.16 The result of such misdiagnosis is not trivial, as unnecessary hospital admission or inappropriate treatment due to misdiagnosis of cutaneous disease often leads to avoidable complications and preventable health care spending. In a cross-sectional analysis of patients diagnosed with presumed lower extremity cellulitis (N=259), approximately 30% were misdiagnosed. In these cases, more than 90% of patients received unnecessary antibiotics, with approximately 30% of them experiencing a complication or avoidable utilization of health care related to their misdiagnosis.17
Along with the profound impact on diagnostic accuracy, management and treatment are almost universally affected after dermatology consultation.5,12-14 Such findings bear importance on optimizing hospital LOS as well as readmission rates. For hospital LOS, a recent study demonstrated reductions in LOS by 2.64 days as well as 1-year cutaneous disease-specific readmissions for patients who received dermatologic consultation for their inflammatory skin disease.18 Similarly, in a recent prospective cohort study of patients diagnosed with presumed lower extremity cellulitis, hospital LOS decreased by 2 days following a diagnosis of pseudocellulitis via timely dermatologic consultation. Across the United States, such reductions in LOS associated with unnecessary hospitalization due to pseudocellulitis can result in annual health care savings of $100 to $200 million.13 As such, early dermatologic intervention plays a vital role in diagnostic accuracy, appropriate treatment implementation, expedited discharge, and the overall economics of health care delivery and utilization, thereby supporting the utility of clinical decision support through expert consultation.
Conclusion
There is a clear and distinct value that results in having specialized inpatient dermatology services. Such expert consultation enhances quality of care and reduces health care costs. Although the implementation and success of inpatient dermatology services has primarily been observed at large hospitals/tertiary care centers, there is incredible potential to further our impact through engagement in our community hospitals. With that said, all practicing dermatologists should feel empowered to employ their expert skillset in their own communities, as such access to care and specialty support is desperately needed and can remarkably impact health care outcomes. Moreover, in addition to the direct impact on health care delivery and economics, the intangible benefits of an inpatient dermatology presence are innumerable, as opportunities to promote quality research and improve trainee education also demonstrate our value. These facets together provide a positive perspective on the potential contribution that our field can have on shaping the outlook of hospital medicine. As such, in addition to enjoying the current renaissance of inpatient dermatology, it is imperative that dermatologists build on this momentum and invest in the future of consultative dermatology.
- Albert MR, Mackool BT. A dermatology ward at the beginning of the 20th century. J Am Acad Dermatol. 2000;42(1, pt 1):113-123.
- Ko LN, Kroshinsky D. Dermatology hospitalists: a multicenter survey study characterizing the infrastructure of consultative dermatology in select American hospitals. Int J Dermatol. 2018;57:553-558.
- Helms AE, Helms SE, Brodell RT. Hospital consultations: time to address an unmet need? J Am Acad Dermatol. 2009;60:308-311.
- Storan ER, McEvoy MT, Wetter DA, et al. Experience of a year of adult hospital dermatology consultations. Int J Dermatol. 2015;54:1150-1156.
- Galimberti F, Guren L, Fernandez AP, et al. Dermatology consultations significantly contribute quality to care of hospitalized patients: a prospective study of dermatology inpatient consults at a tertiary care center. Int J Dermatol. 2016;55:E547-E551.
- Tracey EH, Forrestel A, Rosenbach M, et al. Inpatient dermatology consultation in patients with hematologic malignancies. J Am Acad Dermatol. 2016;75:835-836.
- Phillips GS, Freites-Martinez A, Hsu M, et al. Inflammatory dermatoses, infections, and drug eruptions are the most common skin conditions in hospitalized cancer patients. J Am Acad Dermatol. 2018;78:1102-1109.
- Storan ER, McEvoy MT, Wetter DA, et al. Pediatric hospital dermatology: experience with inpatient and consult services at the Mayo Clinic. Pediatr Dermatol. 2013;30:433-437.
- Afsar FS. Analysis of pediatric dermatology inpatient consultations in a pediatric teaching hospital. Arch Argent Pediatr. 2017;115:E377-E384.
- McMahon P, Goddard D, Frieden IJ. Pediatric dermatology inpatient consultations: a retrospective study of 427 cases. J Am Acad Dermatol. 2013;68:926-931.
- Peñate Y, Borrego L, Hernández N, et al. Pediatric dermatology consultations: a retrospective analysis of inpatient consultations referred to the dermatology service. Pediatr Dermatol. 2012;29:115-118.
- Hu L, Haynes H, Ferrazza D, et al. Impact of specialist consultations on inpatient admissions for dermatology-specific and related DRGs. J Gen Intern Med. 2013;28:1477-1482.
- Li DG, Xia FD, Khosravi H, et al. Outcomes of early dermatology consultation for inpatients diagnosed with cellulitis. JAMA Dermatol. 2018;154:537-543.
- Falanga V, Schachner LA, Rae V, et al. Dermatologic consultations in the hospital setting. Arch Dermatol. 1994;130:1022-1025.
- Ko LN, Garza-Mayers AC, St John J, et al. Effect of dermatology consultation on outcomes for patients with presumed cellulitis: a randomized clinical trial. JAMA Dermatol. 2018;154:529-536.
- Strazzula L, Cotliar J, Fox LP, et al. Inpatient dermatology consultation aids diagnosis of cellulitis among hospitalized patients: a multi-institutional analysis. J Am Acad Dermatol. 2015;73:70-75.
- Weng QY, Raff AB, Cohen JM, et al. Costs and consequences associated with misdiagnosed lower extremity cellulitis [published online November 2, 2016]. JAMA Dermatol. doi:10.1001/jamadermatol.2016.3816.
- Milani-Nejad N, Zhang M, Kaffenberger BH. Association of dermatology consultations with patient care outcomes in hospitalized patients with inflammatory skin diseases. JAMA Dermatol. 2017;153:523-528.
The practice of inpatient dermatology has a rich history rooted in specialized hospital wards that housed patients with chronic dermatoses. Because systemic agents were limited, the care of these patients required skilled nursing and a distinctive knowledge of the application of numerous topical agents, including washes, baths, powders, lotions, and pastes1; however, with the evolving nature of health care in the last half a century, such dermatologic inpatient units are now rare, with only 2 units remaining in the United States, specifically at the Mayo Clinic in Minnesota and at the University of Miami.2
Although the shift away from a primary dermatologic admitting service is likely multifactorial, what is more sobering is that the majority of inpatients with dermatologic disorders are cared for by nondermatologists.2 Although the dynamics for such a diminished presence are due to various personal and professional concerns, the essential outcome for patients hospitalized with a cutaneous concern—whether directly related to their hospitalization or iatrogenic in nature—is the potential for suboptimal care.3
Fortunately, the practice of inpatient dermatology currently is undergoing a renaissance. With this renewed interest in hospital-based dermatology, there is a growing body of evidence that demonstrates how the dermatology hospitalist has become a vital member of the inpatient team, adding value to the care of patients across all specialties.
To explore the impact of consultative dermatology services, there has been a push by members of the Society for Dermatology Hospitalists to elucidate the contributions of dermatologists in the inpatient setting, which has been accomplished primarily by defining and characterizing the types of patients that dermatology hospitalists care for and, more recently, by demonstrating the improved outcomes that result from expert consultation.
Breadth of Inpatient Dermatologic Consultations
With the adaptation of dermatology consultation services, the scope of practice has shifted from the skilled management of chronic dermatoses to one with an emphasis on the identification of various acute dermatologic diseases. Although the extent of such acute disease states in the inpatient setting is vast, it is interesting to note that the majority of consultations are for common conditions, namely cutaneous infections, venous stasis dermatitis, contact dermatitis, atopic dermatitis, and cutaneous drug eruptions (Table).4,5
Moreover, for the services that obtain dermatologic consultation, the majority of requests originate from internal medicine and hematology/oncology.4,5 Although internal medicine often is the largest-represented specialty in the hospital and provides a proportional amount of dermatology consultations, hematology/oncology patients represent a distinct cohort who are prone to unique mucocutaneous dermatoses related to underlying malignancies, immunosuppression, and cancer-specific therapies (eg, chemotherapy, immunotherapy, stem cell transplantation). Within this subset of patients, cutaneous infections and drug eruptions constitute the majority of cases, while graft-versus-host disease and neutrophilic dermatoses account for a smaller percentage of dermatologic disease in this population. Given the complex and uncommon nature of these dermatoses, timely intervention by a dermatologist can have a considerable impact on morbidity and mortality associated with such disease states.6,7
Among pediatric patients, dermatology consultation patterns mimic those seen among adult patients, with common conditions such as atopic dermatitis and contact dermatitis representing the majority of consultations.8-11 Vascular lesions further represent a unique source of consultation among pediatric patients. Although they often are considered an outpatient concern, one group found that the majority of inpatient consultations for vascular lesions led to early identification of a syndromic association and/or complication (eg, ulceration).10 Identifying these cases in the hospital provides early opportunities for intervention and multidisciplinary care.
Adding Value to the Care of Hospitalized Patients
Following other inpatient models, hospitalist dermatology has begun to demonstrate feasibility, advances in quality improvement, and most importantly improved health care outcomes. In an effort to better characterize the enhancement of such health care delivery, recent literature around the impact of inpatient dermatology consultation has centered on improving key objective hospital-based quality measures, namely diagnosis and management as well as hospital length of stay (LOS) and readmission rates.5,12-18
When identifying cutaneous disease, recent evidence points to the increased diagnostic accuracy by way of dermatology consultation. Specifically, diagnoses were changed 30% to 70% of the time when consultations were provided.6,12-15 Interestingly, misdiagnosis regularly centered on common diagnoses, specifically cellulitis, stasis dermatitis, and hypersensitivity reactions.6,12-16 In a multi-institutional retrospective study that examined the national incidence of cellulitis misdiagnosis, the authors found that when a dermatology consultation for presumed cellulitis was called, approximately 75% (N=55) of cases represented mimickers of cellulitis, such as stasis dermatitis, contact dermatitis, and cutaneous fungal infections. Moreover, in more than 38% (N=21) of such cellulitis consultations, patients often had more than one ongoing disease process, further speaking to the diagnostic accuracy obtained from expert consultation.16 The result of such misdiagnosis is not trivial, as unnecessary hospital admission or inappropriate treatment due to misdiagnosis of cutaneous disease often leads to avoidable complications and preventable health care spending. In a cross-sectional analysis of patients diagnosed with presumed lower extremity cellulitis (N=259), approximately 30% were misdiagnosed. In these cases, more than 90% of patients received unnecessary antibiotics, with approximately 30% of them experiencing a complication or avoidable utilization of health care related to their misdiagnosis.17
Along with the profound impact on diagnostic accuracy, management and treatment are almost universally affected after dermatology consultation.5,12-14 Such findings bear importance on optimizing hospital LOS as well as readmission rates. For hospital LOS, a recent study demonstrated reductions in LOS by 2.64 days as well as 1-year cutaneous disease-specific readmissions for patients who received dermatologic consultation for their inflammatory skin disease.18 Similarly, in a recent prospective cohort study of patients diagnosed with presumed lower extremity cellulitis, hospital LOS decreased by 2 days following a diagnosis of pseudocellulitis via timely dermatologic consultation. Across the United States, such reductions in LOS associated with unnecessary hospitalization due to pseudocellulitis can result in annual health care savings of $100 to $200 million.13 As such, early dermatologic intervention plays a vital role in diagnostic accuracy, appropriate treatment implementation, expedited discharge, and the overall economics of health care delivery and utilization, thereby supporting the utility of clinical decision support through expert consultation.
Conclusion
There is a clear and distinct value that results in having specialized inpatient dermatology services. Such expert consultation enhances quality of care and reduces health care costs. Although the implementation and success of inpatient dermatology services has primarily been observed at large hospitals/tertiary care centers, there is incredible potential to further our impact through engagement in our community hospitals. With that said, all practicing dermatologists should feel empowered to employ their expert skillset in their own communities, as such access to care and specialty support is desperately needed and can remarkably impact health care outcomes. Moreover, in addition to the direct impact on health care delivery and economics, the intangible benefits of an inpatient dermatology presence are innumerable, as opportunities to promote quality research and improve trainee education also demonstrate our value. These facets together provide a positive perspective on the potential contribution that our field can have on shaping the outlook of hospital medicine. As such, in addition to enjoying the current renaissance of inpatient dermatology, it is imperative that dermatologists build on this momentum and invest in the future of consultative dermatology.
- Albert MR, Mackool BT. A dermatology ward at the beginning of the 20th century. J Am Acad Dermatol. 2000;42(1, pt 1):113-123.
- Ko LN, Kroshinsky D. Dermatology hospitalists: a multicenter survey study characterizing the infrastructure of consultative dermatology in select American hospitals. Int J Dermatol. 2018;57:553-558.
- Helms AE, Helms SE, Brodell RT. Hospital consultations: time to address an unmet need? J Am Acad Dermatol. 2009;60:308-311.
- Storan ER, McEvoy MT, Wetter DA, et al. Experience of a year of adult hospital dermatology consultations. Int J Dermatol. 2015;54:1150-1156.
- Galimberti F, Guren L, Fernandez AP, et al. Dermatology consultations significantly contribute quality to care of hospitalized patients: a prospective study of dermatology inpatient consults at a tertiary care center. Int J Dermatol. 2016;55:E547-E551.
- Tracey EH, Forrestel A, Rosenbach M, et al. Inpatient dermatology consultation in patients with hematologic malignancies. J Am Acad Dermatol. 2016;75:835-836.
- Phillips GS, Freites-Martinez A, Hsu M, et al. Inflammatory dermatoses, infections, and drug eruptions are the most common skin conditions in hospitalized cancer patients. J Am Acad Dermatol. 2018;78:1102-1109.
- Storan ER, McEvoy MT, Wetter DA, et al. Pediatric hospital dermatology: experience with inpatient and consult services at the Mayo Clinic. Pediatr Dermatol. 2013;30:433-437.
- Afsar FS. Analysis of pediatric dermatology inpatient consultations in a pediatric teaching hospital. Arch Argent Pediatr. 2017;115:E377-E384.
- McMahon P, Goddard D, Frieden IJ. Pediatric dermatology inpatient consultations: a retrospective study of 427 cases. J Am Acad Dermatol. 2013;68:926-931.
- Peñate Y, Borrego L, Hernández N, et al. Pediatric dermatology consultations: a retrospective analysis of inpatient consultations referred to the dermatology service. Pediatr Dermatol. 2012;29:115-118.
- Hu L, Haynes H, Ferrazza D, et al. Impact of specialist consultations on inpatient admissions for dermatology-specific and related DRGs. J Gen Intern Med. 2013;28:1477-1482.
- Li DG, Xia FD, Khosravi H, et al. Outcomes of early dermatology consultation for inpatients diagnosed with cellulitis. JAMA Dermatol. 2018;154:537-543.
- Falanga V, Schachner LA, Rae V, et al. Dermatologic consultations in the hospital setting. Arch Dermatol. 1994;130:1022-1025.
- Ko LN, Garza-Mayers AC, St John J, et al. Effect of dermatology consultation on outcomes for patients with presumed cellulitis: a randomized clinical trial. JAMA Dermatol. 2018;154:529-536.
- Strazzula L, Cotliar J, Fox LP, et al. Inpatient dermatology consultation aids diagnosis of cellulitis among hospitalized patients: a multi-institutional analysis. J Am Acad Dermatol. 2015;73:70-75.
- Weng QY, Raff AB, Cohen JM, et al. Costs and consequences associated with misdiagnosed lower extremity cellulitis [published online November 2, 2016]. JAMA Dermatol. doi:10.1001/jamadermatol.2016.3816.
- Milani-Nejad N, Zhang M, Kaffenberger BH. Association of dermatology consultations with patient care outcomes in hospitalized patients with inflammatory skin diseases. JAMA Dermatol. 2017;153:523-528.
Practice Points
- Dermatology inpatient consultation enhances quality of care and reduces health care costs.
- Dermatology input in the inpatient setting leads to a diagnosis change in up to 70% of consultations.
- The majority of dermatologic misdiagnoses by nondermatologists involves common dermatoses such as cellulitis, stasis dermatitis, and hypersensitivity reactions.

Neurologic disease eventually affects half of women and one-third of men
Around one-half of women and one-third of men will develop dementia, stroke, or parkinsonism during their lifetime, based on results from the population-based Rotterdam study published in the Oct. 1 online edition of the Journal of Neurology, Neurosurgery & Psychiatry.
The study involved 12,102 individuals (57.7% women) who were aged 45 years or older and free from neurologic disease at baseline who were followed for 26 years.
Silvan Licher, MD, and colleagues from the University Medical Center Rotterdam (the Netherlands) found that a 45-year-old woman had a 48.2% overall remaining lifetime risk of developing dementia, stroke, or parkinsonism, while a 45-year-old man had a 36.3% lifetime risk.
“There are currently no disease-modifying drugs available for dementia and most causes of parkinsonism, and prevention of stroke is hampered by suboptimal adherence to effective preventive strategies or unmet guideline thresholds,” the authors wrote. “Yet, a delay in onset of these common neurologic diseases by merely a few years could reduce the population burden of these diseases substantially.”
Women aged 45 years had a significantly higher lifetime risk than men of developing dementia (31.4% vs. 18.6% respectively) and stroke (21.6% vs. 19.3%), but the risk of parkinsonism was similar between the sexes.
Women also had a significantly greater lifetime risk of developing more than one neurologic disease, compared with men (4% vs. 3.1%, P less than .001), largely because of the overlap between dementia and stroke.
At age 45 women had the greatest risk of dementia, but as men and women aged, their remaining lifetime risk of dementia increased relative to other neurologic diseases. After age 85 years, 66.6% of first diagnoses in women and 55.6% in men were dementia.
By comparison, first manifestation of stroke was the greatest threat to men aged 45. Men were also at a significantly higher risk for stroke at a younger age – before age 75 years – than were women (8.4% vs. 5.8%).
In the case of parkinsonism, the lifetime risk peaked earlier than it did for dementia and stroke, and was relatively low after the age of 85 years, with no significant differences in risk between men and women.
The authors also considered what effect a delay in disease onset and occurrence might have on remaining lifetime risk for neurologic disease. They found that a 1, 2, or 3-year delay in the onset of all neurologic disease was associated with a 20% reduction in lifetime risk in individuals aged 45 years or older, and a greater than 50% reduction in risk in the very oldest.
A 3-year delay in the onset of dementia reduced the lifetime risk by 15% for both men and women aged 45 years and granted a 30% reduction in risk to those aged 45 years or older.
The Rotterdam study is supported by Erasmus MC and Erasmus University Rotterdam, The Netherlands Organization for Scientific Research, The Netherlands Organization for Health Research and Development, the Research Institute for Diseases in the Elderly, The Netherlands Genomics Initiative, the Ministry of Education, Culture and Science, the Ministry of Health, Welfare and Sports, the European Commission and the Municipality of Rotterdam, the Netherlands Consortium for Healthy Ageing, and the Dutch Heart Foundation. No conflicts of interest were declared.
SOURCE: Licher S et al. JNNP. 2018 Oct 1. doi: 10.1136/jnnp-2018-318650.
FROM JOURNAL OF NEUROLOGY, NEUROSURGERY & PSYCHIATRY
Major finding: A 45-year-old woman has a 48.2% lifetime risk of stroke, dementia, or parkinsonism, while a man has a 36.3% lifetime risk.
Study details: Population-based cohort study in 12,102 individuals.
Disclosures: The Rotterdam study is supported by Erasmus MC and Erasmus University Rotterdam, The Netherlands Organization for Scientific Research, The Netherlands Organization for Health Research and Development, the Research Institute for Diseases in the Elderly, The Netherlands Genomics Initiative, the Ministry of Education, Culture and Science, the Ministry of Health, Welfare and Sports, the European Commission and the Municipality of Rotterdam, the Netherlands Consortium for Healthy Ageing, and the Dutch Heart Foundation. No financial conflicts of interest were declared.
Source: Licher S et al. JNNP. 2018 Oct 1. doi: 10.1136/jnnp-2018-318650.