User login
Ibrutinib discontinuation harms survival in CLL
Discontinuing ibrutinib therapy because of disease progression was associated with worse survival, according to a real-world study of ibrutinib dosing in chronic lymphocytic leukemia (CLL) and non-Hodgkin lymphoma patients.

Researchers at the University of Rochester Wilmot Cancer Institute in New York, who performed the single-center study, also found that optimal dosing early on in treatment has a significant impact on disease progression.
“Treating physicians need to be aware of these outcomes when initiating therapy on patients with high-risk CLL or lymphoma, as well as those with significant comorbidities or immune deficiencies,” AnnaLynn M. Williams. MS, and her colleagues reported in Clinical Lymphoma, Myeloma and Leukemia.
The researchers examined the impact of ibrutinib discontinuation and dose adherence on overall and progression-free survival in 170 patients with non-Hodgkin lymphoma and CLL treated with the drug at the Wilmot Cancer Institute between Jan. 1, 2014, and Dec. 1, 2016.
The study comprised 115 patients with CLL, 23 patients with Waldenstrom macroglobulinemia, 21 patients with mantle cell lymphoma, and 11 patients with other non-Hodgkin lymphomas. The median age of patients who started ibrutinib was 68 years, and the median treatment duration was 14.3 months. About a third of patients were taking ibrutinib as a first-line treatment.
Overall, 51 patients (30%) permanently discontinued ibrutinib during the study period, with more than half of the discontinuations stemming from adverse events or comorbidities. About 35% of the discontinuations were due to disease progression.
Median overall survival after discontinuation due to disease progression was 1.7 months. When patients discontinued for other reasons, median overall survival was not reached, compared with stopping for disease progression (P = .0008).
The researchers reported that among patients who discontinued for nonprogression reasons, 67% were alive after 1 year. Among CLL patients, 80% were alive after 1 year.
Among 20 patients who had a dose adherence of less than 80% in the first 8 weeks, the researchers found worse progression-free survival (P = .002) and overall survival (P = .021). Among CLL patients only, progression-free survival was significantly worse (P = .043) but overall survival was not (P = .816).
The study also included five patients who reduced their ibrutinib dose in the first 8 weeks – down to 280 mg in two patients, 140 mg in two patients, and 420 mg in one patient. Again, the researchers observed worse progression-free survival (P = .004) and overall survival (P = .014), compared with patients who maintained their dosing level.
Interrupting ibrutinib dosing had an impact on survival but not as much as discontinuation. Among 10 patients who interrupted therapy for more than a week and then restarted, progression-free survival was worse, compared with those who stayed on treatment continuously (P = .047), but overall survival was not significantly worse (P = .577).
“This would suggest that the ideal treatment strategy would be to recommend initiation of therapy at standard dosing and interruption as needed as directed in the [Food and Drug Administration] label,” the researchers wrote.
The study was funded by the National Cancer Institute and the Cadregari Endowment Fund. The researchers reported having no conflicts of interest.
SOURCE: Williams AM et al. Clin Lymphoma Myeloma Leuk. 2018 Oct 12. doi: 10.1016/j.clml.2018.10.005.
Discontinuing ibrutinib therapy because of disease progression was associated with worse survival, according to a real-world study of ibrutinib dosing in chronic lymphocytic leukemia (CLL) and non-Hodgkin lymphoma patients.
Researchers at the University of Rochester Wilmot Cancer Institute in New York, who performed the single-center study, also found that optimal dosing early on in treatment has a significant impact on disease progression.
“Treating physicians need to be aware of these outcomes when initiating therapy on patients with high-risk CLL or lymphoma, as well as those with significant comorbidities or immune deficiencies,” AnnaLynn M. Williams. MS, and her colleagues reported in Clinical Lymphoma, Myeloma and Leukemia.
The researchers examined the impact of ibrutinib discontinuation and dose adherence on overall and progression-free survival in 170 patients with non-Hodgkin lymphoma and CLL treated with the drug at the Wilmot Cancer Institute between Jan. 1, 2014, and Dec. 1, 2016.
The study comprised 115 patients with CLL, 23 patients with Waldenstrom macroglobulinemia, 21 patients with mantle cell lymphoma, and 11 patients with other non-Hodgkin lymphomas. The median age of patients who started ibrutinib was 68 years, and the median treatment duration was 14.3 months. About a third of patients were taking ibrutinib as a first-line treatment.
Overall, 51 patients (30%) permanently discontinued ibrutinib during the study period, with more than half of the discontinuations stemming from adverse events or comorbidities. About 35% of the discontinuations were due to disease progression.
Median overall survival after discontinuation due to disease progression was 1.7 months. When patients discontinued for other reasons, median overall survival was not reached, compared with stopping for disease progression (P = .0008).
The researchers reported that among patients who discontinued for nonprogression reasons, 67% were alive after 1 year. Among CLL patients, 80% were alive after 1 year.
Among 20 patients who had a dose adherence of less than 80% in the first 8 weeks, the researchers found worse progression-free survival (P = .002) and overall survival (P = .021). Among CLL patients only, progression-free survival was significantly worse (P = .043) but overall survival was not (P = .816).
The study also included five patients who reduced their ibrutinib dose in the first 8 weeks – down to 280 mg in two patients, 140 mg in two patients, and 420 mg in one patient. Again, the researchers observed worse progression-free survival (P = .004) and overall survival (P = .014), compared with patients who maintained their dosing level.
Interrupting ibrutinib dosing had an impact on survival but not as much as discontinuation. Among 10 patients who interrupted therapy for more than a week and then restarted, progression-free survival was worse, compared with those who stayed on treatment continuously (P = .047), but overall survival was not significantly worse (P = .577).
“This would suggest that the ideal treatment strategy would be to recommend initiation of therapy at standard dosing and interruption as needed as directed in the [Food and Drug Administration] label,” the researchers wrote.
The study was funded by the National Cancer Institute and the Cadregari Endowment Fund. The researchers reported having no conflicts of interest.
SOURCE: Williams AM et al. Clin Lymphoma Myeloma Leuk. 2018 Oct 12. doi: 10.1016/j.clml.2018.10.005.
FROM CLINICAL LYMPHOMA, MYELOMA AND LEUKEMIA
Key clinical point:
Major finding: Median overall survival after discontinuation of ibrutinib due to disease progression was 1.7 months.
Study details: A single-institution study of 170 patients with CLL or non-Hodgkin lymphoma who were taking ibrutinib.
Disclosures: The study was funded by the National Cancer Institute and the Cadregari Endowment Fund. The researchers reported having no conflicts of interest.
Source: Williams AM et al. Clin Lymphoma Myeloma Leuk. 2018 Oct 12. doi: 10.1016/j.clml.2018.10.005.
“You have a pending query”
Specificity is essential in documentation and coding
Throughout medical training, you learn to write complete and detailed notes to communicate with other physicians. As a student and resident, you are praised when you succinctly analyze and address all patient problems while justifying your orders for the day. But notes do not exist just to document patient care; they are the template by which our actual quality of care is judged and our patients’ severity of illness is captured.

Like it or not, ICD-10 coding, documentation, denials, calls, and emails from administrators are integral parts of a hospitalist’s day-to-day job. Why? The specificity and comprehensiveness of diagnoses affect such metrics as hospital length of stay, mortality, and Case Mix Index documentation.

Good documentation can lead to better severity of illness (SOI) and risk of mortality (ROM) scores, better patient safety indicator (PSI) scores, better Healthgrades scores, better University Hospital Consortium (UHC) scores, and decreased Recovery Audit Contractor (RAC) denials as well as appropriate reimbursement. Good documentation can even lead to improved patient care and better perceived treatment outcomes.

It is no surprise that many hospital administrators invest time and money in staff to support the proper usage of language in your notes. Of course, sometimes these well-meaning “queries” can throw you into emotional turmoil as you try to understand what was not clear in your excellent note about your patient’s heart failure exacerbation. In this article, we will try to help you take your specificity and comprehensiveness of diagnoses to the next level.
Basics of billing
Physicians do not need to become coders but it is helpful to have some understanding of what happens behind the scenes. Not everyone realizes that physician billing is completely different from hospital billing. Physician billing pertains to the care provided by the clinician, whereas hospital billing pertains to the overall care the patient received.
Below is an example of a case of pneumonia, (see Table 1) which shows the importance of specificity. Just by specifying ‘Aspiration’ for the type of pneumonia, we increased the SOI and the expected ROM appropriately. Also see a change in relative weight (RW): Each diagnosis-related group (DRG) is assigned a relative weight = estimated use of resources, and payment per case is based on estimated resource consumption = relative weight x “blended rate for each hospital.”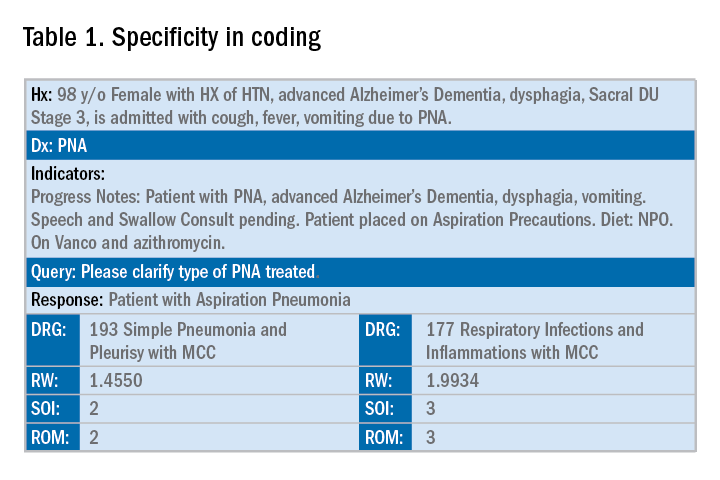
In addition to specificity, it is important to include all secondary diagnosis (know as cc/MCC – complication or comorbidity or a major complication or comorbidity – in the coding world). Table 2 is an example of using the correct terms and documenting secondary diagnosis. By documenting the type and severity of malnutrition we again increase the expected risk of mortality and the severity of illness.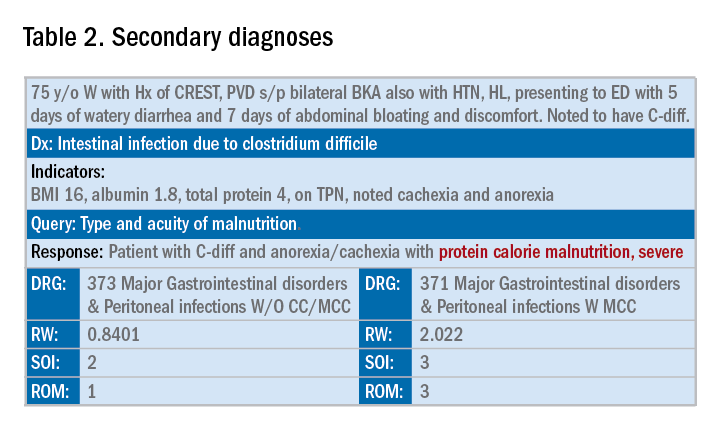
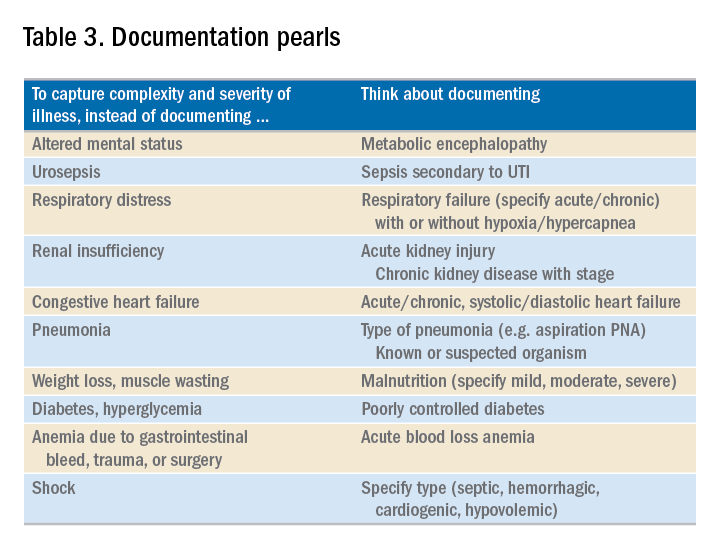
Physicians often do a lot more than what we record in the chart. Learning to document accurately to show the true clinical picture is an important skill set. Here are some tips to help understand and even avoid calls for better documentation.
- Use the terms “probable,” “possible,” “suspected,” or “likely” in documenting uncertain diagnoses (i.e., conditions for which physicians find clinical evidence that leads to a suspicion but not a definitive diagnosis). If conditions are ruled out or confirmed, clearly state so. If it remains uncertain, remember to carry this “possible” or “probable” diagnosis all the way through to the discharge summary or final progress note.
- Use linking of diagnoses when appropriate. For example, if the patient’s neuropathy, nephropathy, and retinopathy are related to their uncontrolled insulin dependent diabetes, state “uncontrolled insulin-dependent DMII with A1c of 11 complicated with nephropathy, neuropathy, and retinopathy.” The coders cannot link these diagnoses, and when you link them, you show a higher complexity of your patient. Remember to link the diagnoses only when they are truly related – this is where your medical knowledge and expertise come into play.
- Use the highest specificity of evidence that supports your medical decision making. You don’t need to be too verbose, all you need is evidence supporting your medical decision making and treatment plan. Think of it as demonstrating the logic of your diagnosis to another physician.
- Use Acuity (acute, chronic, acute on chronic, mild, moderate, severe, etc.) per diagnosis. For example, if you say heart failure exacerbation, it makes perfect sense to your medical colleagues, but in the coding world, it means nothing. Specify if it is acute, or acute on chronic, heart failure.
- Use status of each diagnosis. Is the condition improving, worsening, or resolved? Status does not have to be mentioned in all progress notes. Try to include this descriptor in the discharge summary and the day of the event.
- Always document the clinical significance of any abnormal laboratory, radiology reports, or pathology finding. Coders cannot use test results as a basis for coding unless a clinician has reviewed, interpreted, and documented the significance of the results in the progress note. Simply copying and pasting a report in the notes is not considered clinical acknowledgment. Shorthand notes like “Na=150, start hydration with 0.45% saline” is not acceptable. The actual diagnosis has to be written (i.e. “hypernatremia”). In addition, coders cannot code from nursing, dietitian, respiratory, and physical therapy notes. For example, if nursing documents that a patient has a pressure ulcer the clinician must still document the diagnosis of pressure ulcer, location, and stage. Although dietitian notes may state a body mass index greater than 40, coders cannot assume that patient is morbidly obese. Physician documentation is needed to support the obesity code assignment.
- Document all conditions that affect the patient’s stay, including complications and chronic conditions for which medications have been ordered. These secondary diagnoses paint the most accurate clinical picture and provide information needed to calculate important data, such as complexity and severity of patient illness and mortality risk. A patient with community-acquired pneumonia without other comorbidities requires fewer resources and has a greater chance of a good outcome than does the same patient with complications, such as acute heart failure.
- Downcoding brings losses, upcoding brings fines. Exaggerating the severity of patient conditions can lead to payer audits, reimbursement take backs, and charges of abuse and fraudulent billing. Never stretch the truth. Make sure you can support every diagnosis in the patient’s chart using clinical criteria.
You may be frustrated by the need to choose specific words about diagnoses that seem obvious to you without these descriptors. But accurate documentation can make a huge difference in your hospital’s bottom line and published metrics. Understanding the relative impact of changing your terminology can help you make these changes, until the language becomes second nature. Your hospital administrators will be grateful – and you just might cut down your queries!
Dr. Rajda is medical director of clinical documentation and quality improvement for Mount Sinai Hospital in New York, and medical director for DRG appeals for the Mount Sinai Health System. She serves as assistant professor of medicine at Icahn School of Medicine at Mount Sinai. Dr. Fatemi is an assistant professor at the University of New Mexico, Albuquerque. She is director of documentation, coding, and billing for the division of hospital medicine at UNM. Dr. Reyna is assistant professor in the division of hospital medicine and medical director for clinical documentation and quality improvement at Mount Sinai Medical Center.
Specificity is essential in documentation and coding
Specificity is essential in documentation and coding
Throughout medical training, you learn to write complete and detailed notes to communicate with other physicians. As a student and resident, you are praised when you succinctly analyze and address all patient problems while justifying your orders for the day. But notes do not exist just to document patient care; they are the template by which our actual quality of care is judged and our patients’ severity of illness is captured.
Like it or not, ICD-10 coding, documentation, denials, calls, and emails from administrators are integral parts of a hospitalist’s day-to-day job. Why? The specificity and comprehensiveness of diagnoses affect such metrics as hospital length of stay, mortality, and Case Mix Index documentation.
Good documentation can lead to better severity of illness (SOI) and risk of mortality (ROM) scores, better patient safety indicator (PSI) scores, better Healthgrades scores, better University Hospital Consortium (UHC) scores, and decreased Recovery Audit Contractor (RAC) denials as well as appropriate reimbursement. Good documentation can even lead to improved patient care and better perceived treatment outcomes.
It is no surprise that many hospital administrators invest time and money in staff to support the proper usage of language in your notes. Of course, sometimes these well-meaning “queries” can throw you into emotional turmoil as you try to understand what was not clear in your excellent note about your patient’s heart failure exacerbation. In this article, we will try to help you take your specificity and comprehensiveness of diagnoses to the next level.
Basics of billing
Physicians do not need to become coders but it is helpful to have some understanding of what happens behind the scenes. Not everyone realizes that physician billing is completely different from hospital billing. Physician billing pertains to the care provided by the clinician, whereas hospital billing pertains to the overall care the patient received.
Below is an example of a case of pneumonia, (see Table 1) which shows the importance of specificity. Just by specifying ‘Aspiration’ for the type of pneumonia, we increased the SOI and the expected ROM appropriately. Also see a change in relative weight (RW): Each diagnosis-related group (DRG) is assigned a relative weight = estimated use of resources, and payment per case is based on estimated resource consumption = relative weight x “blended rate for each hospital.”
In addition to specificity, it is important to include all secondary diagnosis (know as cc/MCC – complication or comorbidity or a major complication or comorbidity – in the coding world). Table 2 is an example of using the correct terms and documenting secondary diagnosis. By documenting the type and severity of malnutrition we again increase the expected risk of mortality and the severity of illness.
Physicians often do a lot more than what we record in the chart. Learning to document accurately to show the true clinical picture is an important skill set. Here are some tips to help understand and even avoid calls for better documentation.
- Use the terms “probable,” “possible,” “suspected,” or “likely” in documenting uncertain diagnoses (i.e., conditions for which physicians find clinical evidence that leads to a suspicion but not a definitive diagnosis). If conditions are ruled out or confirmed, clearly state so. If it remains uncertain, remember to carry this “possible” or “probable” diagnosis all the way through to the discharge summary or final progress note.
- Use linking of diagnoses when appropriate. For example, if the patient’s neuropathy, nephropathy, and retinopathy are related to their uncontrolled insulin dependent diabetes, state “uncontrolled insulin-dependent DMII with A1c of 11 complicated with nephropathy, neuropathy, and retinopathy.” The coders cannot link these diagnoses, and when you link them, you show a higher complexity of your patient. Remember to link the diagnoses only when they are truly related – this is where your medical knowledge and expertise come into play.
- Use the highest specificity of evidence that supports your medical decision making. You don’t need to be too verbose, all you need is evidence supporting your medical decision making and treatment plan. Think of it as demonstrating the logic of your diagnosis to another physician.
- Use Acuity (acute, chronic, acute on chronic, mild, moderate, severe, etc.) per diagnosis. For example, if you say heart failure exacerbation, it makes perfect sense to your medical colleagues, but in the coding world, it means nothing. Specify if it is acute, or acute on chronic, heart failure.
- Use status of each diagnosis. Is the condition improving, worsening, or resolved? Status does not have to be mentioned in all progress notes. Try to include this descriptor in the discharge summary and the day of the event.
- Always document the clinical significance of any abnormal laboratory, radiology reports, or pathology finding. Coders cannot use test results as a basis for coding unless a clinician has reviewed, interpreted, and documented the significance of the results in the progress note. Simply copying and pasting a report in the notes is not considered clinical acknowledgment. Shorthand notes like “Na=150, start hydration with 0.45% saline” is not acceptable. The actual diagnosis has to be written (i.e. “hypernatremia”). In addition, coders cannot code from nursing, dietitian, respiratory, and physical therapy notes. For example, if nursing documents that a patient has a pressure ulcer the clinician must still document the diagnosis of pressure ulcer, location, and stage. Although dietitian notes may state a body mass index greater than 40, coders cannot assume that patient is morbidly obese. Physician documentation is needed to support the obesity code assignment.
- Document all conditions that affect the patient’s stay, including complications and chronic conditions for which medications have been ordered. These secondary diagnoses paint the most accurate clinical picture and provide information needed to calculate important data, such as complexity and severity of patient illness and mortality risk. A patient with community-acquired pneumonia without other comorbidities requires fewer resources and has a greater chance of a good outcome than does the same patient with complications, such as acute heart failure.
- Downcoding brings losses, upcoding brings fines. Exaggerating the severity of patient conditions can lead to payer audits, reimbursement take backs, and charges of abuse and fraudulent billing. Never stretch the truth. Make sure you can support every diagnosis in the patient’s chart using clinical criteria.
You may be frustrated by the need to choose specific words about diagnoses that seem obvious to you without these descriptors. But accurate documentation can make a huge difference in your hospital’s bottom line and published metrics. Understanding the relative impact of changing your terminology can help you make these changes, until the language becomes second nature. Your hospital administrators will be grateful – and you just might cut down your queries!
Dr. Rajda is medical director of clinical documentation and quality improvement for Mount Sinai Hospital in New York, and medical director for DRG appeals for the Mount Sinai Health System. She serves as assistant professor of medicine at Icahn School of Medicine at Mount Sinai. Dr. Fatemi is an assistant professor at the University of New Mexico, Albuquerque. She is director of documentation, coding, and billing for the division of hospital medicine at UNM. Dr. Reyna is assistant professor in the division of hospital medicine and medical director for clinical documentation and quality improvement at Mount Sinai Medical Center.
Investigation Explores Triggers in Episodic Migraine
Multiple studies clearly demonstrate triggers in episodic migraine, often related to change in homeostasis or environment, according to a recent investigation. Furthermore, many common migraine triggers are not easily modifiable, and avoiding triggers may not be realistic. However, healthy lifestyle choices such as exercise, adequate sleep, stress management, and eating regularly may prevent triggers and transformation to chronic migraine over time. Multiple migraine attack triggers have been established based on patient surveys, diary studies, and clinical trials. Key points include:
- Stress, menstrual cycle changes, weather changes, sleep disturbances, alcohol, and other foods are among the most common factors mentioned.
- Clinical studies have also verified that fasting, premenstrual periods in women, “letdown” after stress, and most likely low barometric pressures are migraine triggers.
- Premonitory symptoms such as neck pain, fatigue, and sensitivity to lights, sounds, or odors may mimic triggers.
Marmura MJ. Triggers, protectors, and predictors in episodic migraine. Curr Pain Headache Rep. 2018;22:81. doi:10.1007/s11916-018-0734-0.
Genetic Migraine Risk in African-American Youth
A recent genome-wide association study (GWAS) provides new insights into the genetic basis of childhood migraine and allows for precision therapeutic development strategies targeting migraine patients of African-American ancestry. Researchers conducted a GWAS of 380 African-American children and 2129 ancestry-matched controls to identify variants associated with migraine. They then attempted to replicate their primary analysis in an independent cohort of 233 African-American patients and 4038 non-migraine control subjects. They found:
- Common variants at 5q33.1 are associated with migraine risk in African-American children.
- The association was validated in an independent study for an overall meta-analysis P-value of 3.81×10⁻¹⁰.
- eQTL (expression quantitative trait loci) analysis of the Genotype-Tissue Expression data also shows the genotypes of rs72793414 were strongly correlated with the mRNA expression levels of NMUR2 at 5q33.1.
Chang X, Pellegrino R, Garifallou, et al. Common variants at 5q33.1 predispose to migraine in African-American children. [Published online ahead of print September 28, 2018]. J Med Genet. doi:10.1136/jmedgenet-2018-105359.
Examining the Diagnostic Criteria for Migraine
The current diagnostic criteria for migraine outlined in the 3rd version of the International Classification of Headache Disorders (ICHD) are far more sensitive and specific than the clinical criteria proposed in 1962. This is according to a recent review that examines how the diagnostic criteria for migraine have evolved during the past 45 years and evaluates the strengths and weaknesses of the current diagnostic criteria promulgated by the ICHD. In future iterations, dividing episodic and chronic migraine into subtypes based on frequency (ie, low frequency vs high frequency; near-daily vs daily) potentially could assist in guiding clinical management. In addition, a better understanding of aura, vestibular migraine, migrainous infarction, and hemiplegic migraine likely will lead to more refined diagnostic criteria for those entities. As the pathophysiology of migraine is more fully elucidated and more sophisticated diagnostic technologies are developed (eg, the identification of biomarkers), the current diagnostic criteria for migraine will likely be further refined. Furthermore, the ICHD has allowed for more precise research study design in the field of headache medicine.
Tinsley A. Rothrock JF. What are we missing in the diagnostic criteria for migraine? Curr Pain Headache Rep. 2018;22:84. doi:10.1007/s11916-018-0733-1.
TB vaccine shows promise in previously infected
san francisco – A new The vaccine showed efficacy in young adults – an important finding because models suggest that inducing immunity in adolescents and young adults would be the fastest and most cost-effective approach to dealing with the global TB epidemic.

The study recruited adults who had previously been exposed to Mycobacterium tuberculosis, a population that receives no benefit from the long-standing bacillus Calmette-Guérin (BCG) vaccine. The overall efficacy of protection was 54%. “There isn’t any vaccine that’s been demonstrated to work in people who are already infected. It’s also the first vaccine to show this level of statistically significant protection in adults, and it’s adults who are the major transmitters of tuberculosis. The modeling has shown that even a vaccine that could protect infected adults at 20% vaccine efficacy would have a substantial impact on the epidemic and be cost effective,” said Ann Ginsberg, MD, PhD, chief medical officer at Aeras, which developed the vaccine and is now testing it in partnership with GlaxoSmithKline.
The results of the study were presented at ID Week 2018 and published in the New England Journal of Medicine (2018 Sep 25. doi: 10.1056/NEJMoa1803484).
The results address a major weakness of the BCG vaccine, which is that some studies have shown it offers little benefit to subjects who are already infected with the disease, which is the case for about a quarter of the world’s population, according to Dr. Ginsberg. The probable explanation is that previous infection with M. tuberculosis or a related bacteria is common in some populations and that this exposure grants some protection against progression to active disease.
The researchers tested the M72/AS01E vaccine, which includes two M. tuberculosis antigens that were identified from patients who had controlled their infection and also the AS01 adjuvant, which contains two immunostimulating agents and is a component of a developmental malaria vaccine and the recombinant zoster vaccine Shingrix.
In Kenya, South Africa, and Zambia, the researchers randomized 3,330 participants (mean age, 28.9 years; 43% female) to receive two doses 1 month apart of either vaccine or placebo. After a mean follow-up of 2.3 years, the protocol efficacy analysis showed that the vaccine had an efficacy rate of 54.0% (P = .04) for pulmonary tuberculosis.
The vaccine had greater efficacy in men (75.2%; P = .03) than it did in women (27.4%; P = .52) and among individuals aged 25 years or younger (84.4%; P = .01) than it did among older subjects (10.2%, P = .82).
The frequency of serious adverse events was similar between the vaccine (1.6%) and the placebo group (1.8%). Unsolicited reports of adverse events were more common in the vaccine group than the placebo group (67.4% vs. 45.4%, respectively), driven largely by more reports of injection site reactions and flu-like symptoms. Solicited reports of adverse events were highlighted by a greater frequency of injection site pain in the vaccine group (81.8% vs. 34.4%). A total of 24.3% of the vaccine recipients reported grade 3 pain, compared with 3.3% in the placebo arm. Rates of fatigue, headache, malaise, or myalgia were also higher in the vaccine group, as was fever.
All of the subjects in the vaccine group had seroconversion at month 2, and 99% remained seroconverted at 12 months.
Next, the researchers plan to conduct studies in HIV-infected individuals and to proceed with phase III trials.
The trial was funded by GlaxoSmithKline Biologicals and Aeras. Dr. Ginsberg is an employee of Aeras.
SOURCE: Ginsberg A et al. IDWeek 2018, Abstract 120
san francisco – A new The vaccine showed efficacy in young adults – an important finding because models suggest that inducing immunity in adolescents and young adults would be the fastest and most cost-effective approach to dealing with the global TB epidemic.
The study recruited adults who had previously been exposed to Mycobacterium tuberculosis, a population that receives no benefit from the long-standing bacillus Calmette-Guérin (BCG) vaccine. The overall efficacy of protection was 54%. “There isn’t any vaccine that’s been demonstrated to work in people who are already infected. It’s also the first vaccine to show this level of statistically significant protection in adults, and it’s adults who are the major transmitters of tuberculosis. The modeling has shown that even a vaccine that could protect infected adults at 20% vaccine efficacy would have a substantial impact on the epidemic and be cost effective,” said Ann Ginsberg, MD, PhD, chief medical officer at Aeras, which developed the vaccine and is now testing it in partnership with GlaxoSmithKline.
The results of the study were presented at ID Week 2018 and published in the New England Journal of Medicine (2018 Sep 25. doi: 10.1056/NEJMoa1803484).
The results address a major weakness of the BCG vaccine, which is that some studies have shown it offers little benefit to subjects who are already infected with the disease, which is the case for about a quarter of the world’s population, according to Dr. Ginsberg. The probable explanation is that previous infection with M. tuberculosis or a related bacteria is common in some populations and that this exposure grants some protection against progression to active disease.
The researchers tested the M72/AS01E vaccine, which includes two M. tuberculosis antigens that were identified from patients who had controlled their infection and also the AS01 adjuvant, which contains two immunostimulating agents and is a component of a developmental malaria vaccine and the recombinant zoster vaccine Shingrix.
In Kenya, South Africa, and Zambia, the researchers randomized 3,330 participants (mean age, 28.9 years; 43% female) to receive two doses 1 month apart of either vaccine or placebo. After a mean follow-up of 2.3 years, the protocol efficacy analysis showed that the vaccine had an efficacy rate of 54.0% (P = .04) for pulmonary tuberculosis.
The vaccine had greater efficacy in men (75.2%; P = .03) than it did in women (27.4%; P = .52) and among individuals aged 25 years or younger (84.4%; P = .01) than it did among older subjects (10.2%, P = .82).
The frequency of serious adverse events was similar between the vaccine (1.6%) and the placebo group (1.8%). Unsolicited reports of adverse events were more common in the vaccine group than the placebo group (67.4% vs. 45.4%, respectively), driven largely by more reports of injection site reactions and flu-like symptoms. Solicited reports of adverse events were highlighted by a greater frequency of injection site pain in the vaccine group (81.8% vs. 34.4%). A total of 24.3% of the vaccine recipients reported grade 3 pain, compared with 3.3% in the placebo arm. Rates of fatigue, headache, malaise, or myalgia were also higher in the vaccine group, as was fever.
All of the subjects in the vaccine group had seroconversion at month 2, and 99% remained seroconverted at 12 months.
Next, the researchers plan to conduct studies in HIV-infected individuals and to proceed with phase III trials.
The trial was funded by GlaxoSmithKline Biologicals and Aeras. Dr. Ginsberg is an employee of Aeras.
SOURCE: Ginsberg A et al. IDWeek 2018, Abstract 120
REPORTING FROM IDWEEK 2018
Key clinical point: The vaccine is the first to show efficacy in patients previously exposed to the TB bacterium.
Major finding: The vaccine had a protective efficacy of 54%.
Study details: Randomized, controlled trial with 3,330 participants.
Disclosures: The trial was funded by GlaxoSmithKline Biologicals and Aeras. Dr. Ginsberg is an employee of Aeras.
Source: Ginsberg A et al. IDWeek 2018, Abstract 120.
Etrasimod improves clinical, endoscopic outcomes in patients with UC
PHILADELPHIA – Use of etrasimod was associated with improved clinical and endoscopic results, and was generally safe and well tolerated compared with placebo in patients with moderate to severe ulcerative colitis, according to a recent award-winning presentation at the annual meeting of the American College of Gastroenterology.

“Patients with moderate to severe ulcerative colitis receiving etrasimod 2 mg per day achieved statistically significant and clinically meaningful differences in all of the primary and secondary endpoints, and most exploratory endpoints were also significantly proved,” William J. Sandborn, MD, AGAF, FACG, professor of clinical medicine at the University of California, San Diego, stated in his presentation at the meeting. “A dose-response relationship was observed in virtually all of the measures of treatment efficacy.”
The abstract received the ACG Auxiliary Award (Member), which is given to ACG members each year with outstanding abstract submissions.
Dr. Sandborn and his colleagues enrolled 156 patients with ulcerative colitis (UC) into the OASIS study, a randomized, double-blind, parallel-group, phase 2 study of etrasimod, an oral sphingosine 1-phosphate (S1P) receptor modulator, compared with placebo. Patients were aged 18-80 years, with moderate to severe UC as defined by a three-component Mayo Clinic Score (MCS) comprising rectal bleeding, frequency of stool, and endoscopy.
Those patients who achieved an MCS score between 4 and 9 points with an endoscopic subscore of at least 2 and rectal bleeding (RB) subscore of at least 1 were included. Patients were divided into once-daily etrasimod 1 mg (52 patients), once-daily etrasimod 2 mg (50 patients) and placebo (54 patients) groups and treated over a 12-week period.
At 12 weeks, the least-squares mean difference for change in baseline in three-component MCS was 1.94 in the 1-mg etrasimod group and 2.49 in the 2-mg etrasimod group compared with placebo (1.50). Endoscopic improvement was greater in the 1-mg etrasimod (22.5%) and 2-mg (41.8%) groups compared with placebo (17.8%); endoscopic remission rates also improved in the 1-mg etrasimod (13.7%) and 2-mg (15.3%) groups compared with placebo (5.3%). Lymphocyte count circulation significantly decreased in the 1-mg etrasimod (37.2%) and 2-mg (57.3%) groups compared with the placebo group. With regard to rectal bleeding, the rectal bleeding subscore also decreased in the 1-mg etrasimod and 2-mg groups compared with placebo at 12 weeks from baseline.
The researchers noted no significant differences in adverse events among groups, with the placebo group showing a higher rate of major adverse events (11.1%) compared with the 1-mg etrasimod (5.8%) and 2-mg etrasimod (0%) groups.
“The OASIS trial results for etrasimod would support proceeding to a phase 3 program for this drug in patients with moderate to severe ulcerative colitis,” Dr. Sandborn concluded.
Dr. Sandborn reports consultancies, speaker bureau memberships, and research support from AbbVie, Biogen, Celgene, Ferring, Genentech, Gilead Sciences, Immune Pharmaceuticals, Janssen, Lilly, MedImmune, Novartis, Pfizer, Regeneron, Ritter Pharmaceuticals, Salix, Theradiag, UCB Pharma, and Vascular Biogenics, among others.
SOURCE: Sandborn WJ et al. ACG 2018. Presentation 11.
PHILADELPHIA – Use of etrasimod was associated with improved clinical and endoscopic results, and was generally safe and well tolerated compared with placebo in patients with moderate to severe ulcerative colitis, according to a recent award-winning presentation at the annual meeting of the American College of Gastroenterology.
“Patients with moderate to severe ulcerative colitis receiving etrasimod 2 mg per day achieved statistically significant and clinically meaningful differences in all of the primary and secondary endpoints, and most exploratory endpoints were also significantly proved,” William J. Sandborn, MD, AGAF, FACG, professor of clinical medicine at the University of California, San Diego, stated in his presentation at the meeting. “A dose-response relationship was observed in virtually all of the measures of treatment efficacy.”
The abstract received the ACG Auxiliary Award (Member), which is given to ACG members each year with outstanding abstract submissions.
Dr. Sandborn and his colleagues enrolled 156 patients with ulcerative colitis (UC) into the OASIS study, a randomized, double-blind, parallel-group, phase 2 study of etrasimod, an oral sphingosine 1-phosphate (S1P) receptor modulator, compared with placebo. Patients were aged 18-80 years, with moderate to severe UC as defined by a three-component Mayo Clinic Score (MCS) comprising rectal bleeding, frequency of stool, and endoscopy.
Those patients who achieved an MCS score between 4 and 9 points with an endoscopic subscore of at least 2 and rectal bleeding (RB) subscore of at least 1 were included. Patients were divided into once-daily etrasimod 1 mg (52 patients), once-daily etrasimod 2 mg (50 patients) and placebo (54 patients) groups and treated over a 12-week period.
At 12 weeks, the least-squares mean difference for change in baseline in three-component MCS was 1.94 in the 1-mg etrasimod group and 2.49 in the 2-mg etrasimod group compared with placebo (1.50). Endoscopic improvement was greater in the 1-mg etrasimod (22.5%) and 2-mg (41.8%) groups compared with placebo (17.8%); endoscopic remission rates also improved in the 1-mg etrasimod (13.7%) and 2-mg (15.3%) groups compared with placebo (5.3%). Lymphocyte count circulation significantly decreased in the 1-mg etrasimod (37.2%) and 2-mg (57.3%) groups compared with the placebo group. With regard to rectal bleeding, the rectal bleeding subscore also decreased in the 1-mg etrasimod and 2-mg groups compared with placebo at 12 weeks from baseline.
The researchers noted no significant differences in adverse events among groups, with the placebo group showing a higher rate of major adverse events (11.1%) compared with the 1-mg etrasimod (5.8%) and 2-mg etrasimod (0%) groups.
“The OASIS trial results for etrasimod would support proceeding to a phase 3 program for this drug in patients with moderate to severe ulcerative colitis,” Dr. Sandborn concluded.
Dr. Sandborn reports consultancies, speaker bureau memberships, and research support from AbbVie, Biogen, Celgene, Ferring, Genentech, Gilead Sciences, Immune Pharmaceuticals, Janssen, Lilly, MedImmune, Novartis, Pfizer, Regeneron, Ritter Pharmaceuticals, Salix, Theradiag, UCB Pharma, and Vascular Biogenics, among others.
SOURCE: Sandborn WJ et al. ACG 2018. Presentation 11.
REPORTING FROM ACG 2018
Key clinical point: Compared with placebo, etrasimod was associated with endoscopic and clinical improvement in patients with ulcerative colitis.
Major finding: Patients taking etrasimod 2 mg (41.8%) and etrasimod 1 mg (22.5%) saw greater endoscopic improvement compared with placebo (17.8%).
Study details: A randomized, double-blind, parallel-group, phase 2 study of 156 patients with ulcerative colitis receiving etrasimod or placebo.
Disclosures: Dr. Sandborn reports consultancies, speaker bureau memberships, and research support from AbbVie, Biogen, Celgene, Ferring, Genentech, Gilead Sciences, Immune Pharmaceuticals, Janssen, Lilly, MedImmune, Novartis, Pfizer, Regeneron, Ritter Pharmaceuticals, Salix, Theradiag, UCB Pharma, and Vascular Biogenics, among others.
Source: Sandborn WJ et al. ACG 2018. Presentation 11.
Smartphone device beat Holter for post-stroke AF detection
MONTREAL – A smartphone-based method for quick and inexpensive monitoring for atrial fibrillation in patients hospitalized for a recent acute ischemic stroke or transient ischemic attack identified three times more patients with the arrhythmia than did 24-hour Holter monitoring of the same patients after their hospital discharge.
This high level of atrial fibrillation (AF) detection using a relatively cheap and noninvasive device suggests that this method is a good “complement” to conventional monitoring by a 24-hour Holter recording or an implanted loop recorder in recent stroke patients, as called for in current guidelines of the world’s cardiology societies.
In the study, 294 of 1,079 patients hospitalized for an acute ischemic stroke or transient ischemic attack (TIA) underwent Holter monitoring, which identified 8 patients (3%) with AF, compared with 25 of these 294 patients (9%) identified with AF while they were hospitalized using serial, 30-second monitoring with the AliveCor device for smartphone assessment of ECG measurement, Bernard Yan, MD, said at the World Stroke Congress. Seven of the eight patients identified with AF by Holter monitoring were also found to have AF by the AliveCor device.

Dr. Yan, an interventional neurologist at the Comprehensive Stroke Center at the Royal Melbourne Hospital, attributed the higher pick-up rate for AF by monitoring during hospitalization to the timing of screening, which was within days of the stroke or TIA, rather than waiting to run a Holter sometime after the patient left the hospital.
“I suspect the difference in timing explains the difference” in detection, he said in an interview. “The difference may be because we monitored patients [with the AliveCor device] much earlier, during their ‘hot’ period, right after their stroke.”
The SPOT-AF trial ran at several centers in Australia, China, and Hong Kong, and enrolled 1,079 patients hospitalized for acute ischemic stroke or TIA who all underwent AliveCor monitoring during their median 4-day stay in the hospital. Patients performed a 30-second heart rhythm check every time a nurse saw them for a routine vital-sign examination, usually three or four times a day. The current analysis focused on the 294 patients (27% of the 1,079 patients) who also underwent 24-hour Holter monitoring following hospital discharge when ordered by their personal physician. This 27% incidence of postdischarge Holter monitoring despite guidelines that call for AF screening in all recent ischemic stroke and TIA patients was consistent with a 2016 review of more than 17,000 stroke or TIA patients in Canada that showed 31% underwent 24-hour Holter monitoring for AF during the 30 days following their index event (Stroke. 2016 Aug;47[8]:1982-9).
Although AF screening with a smartphone-based device is inexpensive and easy, Dr. Yan stopped short of suggesting that it is time for this approach to replace a Holter monitor or an implanted loop recorder because that is what current guidelines call for. “To change the guidelines, we need a different study that compares these approaches head to head.”
SPOT-AF received partial funding from Boehringer Ingelheim. Dr. Yan has been a speaker on behalf of Bayer, Boehringer Ingelheim, Pfizer, and Stryker.
MONTREAL – A smartphone-based method for quick and inexpensive monitoring for atrial fibrillation in patients hospitalized for a recent acute ischemic stroke or transient ischemic attack identified three times more patients with the arrhythmia than did 24-hour Holter monitoring of the same patients after their hospital discharge.
This high level of atrial fibrillation (AF) detection using a relatively cheap and noninvasive device suggests that this method is a good “complement” to conventional monitoring by a 24-hour Holter recording or an implanted loop recorder in recent stroke patients, as called for in current guidelines of the world’s cardiology societies.
In the study, 294 of 1,079 patients hospitalized for an acute ischemic stroke or transient ischemic attack (TIA) underwent Holter monitoring, which identified 8 patients (3%) with AF, compared with 25 of these 294 patients (9%) identified with AF while they were hospitalized using serial, 30-second monitoring with the AliveCor device for smartphone assessment of ECG measurement, Bernard Yan, MD, said at the World Stroke Congress. Seven of the eight patients identified with AF by Holter monitoring were also found to have AF by the AliveCor device.
Dr. Yan, an interventional neurologist at the Comprehensive Stroke Center at the Royal Melbourne Hospital, attributed the higher pick-up rate for AF by monitoring during hospitalization to the timing of screening, which was within days of the stroke or TIA, rather than waiting to run a Holter sometime after the patient left the hospital.
“I suspect the difference in timing explains the difference” in detection, he said in an interview. “The difference may be because we monitored patients [with the AliveCor device] much earlier, during their ‘hot’ period, right after their stroke.”
The SPOT-AF trial ran at several centers in Australia, China, and Hong Kong, and enrolled 1,079 patients hospitalized for acute ischemic stroke or TIA who all underwent AliveCor monitoring during their median 4-day stay in the hospital. Patients performed a 30-second heart rhythm check every time a nurse saw them for a routine vital-sign examination, usually three or four times a day. The current analysis focused on the 294 patients (27% of the 1,079 patients) who also underwent 24-hour Holter monitoring following hospital discharge when ordered by their personal physician. This 27% incidence of postdischarge Holter monitoring despite guidelines that call for AF screening in all recent ischemic stroke and TIA patients was consistent with a 2016 review of more than 17,000 stroke or TIA patients in Canada that showed 31% underwent 24-hour Holter monitoring for AF during the 30 days following their index event (Stroke. 2016 Aug;47[8]:1982-9).
Although AF screening with a smartphone-based device is inexpensive and easy, Dr. Yan stopped short of suggesting that it is time for this approach to replace a Holter monitor or an implanted loop recorder because that is what current guidelines call for. “To change the guidelines, we need a different study that compares these approaches head to head.”
SPOT-AF received partial funding from Boehringer Ingelheim. Dr. Yan has been a speaker on behalf of Bayer, Boehringer Ingelheim, Pfizer, and Stryker.
REPORTING FROM THE WORLD STROKE CONGRESS
Key clinical point:
Major finding: Holter monitoring detected atrial fibrillation in 8 of 294 patients, while smartphone monitoring identified 25 with the arrhythmia.
Study details: SPOT-AF, a multicenter study with 1,079 total patients, including 294 who underwent Holter monitoring.
Disclosures: SPOT-AF received partial funding from Boehringer Ingelheim. Dr. Yan has been a speaker on behalf of Bayer, Boehringer Ingelheim, Pfizer, and Stryker.

Hypopigmentation
Hypopigmentation or depigmentation of the skin is very challenging to treat. The loss of melanin in the skin is often a frustrating problem, resulting from acne, burn scars, vitiligo, topically applied chemicals, or cryotherapy. To date, there is no universally accepted treatment that restores skin pigmentation. In our clinic, the induction of trauma to the skin via a series of microneedling or subcision treatments has shown promise in increasing the pigmentation of skin with localized hypo- or depigmented patches.

to improve the appearance of fine lines, acne scars, photoaging, stretch marks, enlarged pores, and other cosmetic issues characterized by loss of collagen or altered collagen remodeling. The skin-needling technique involves fine sterile needles 0.1 mm–2.5 mm in length that repeatedly pierce the stratum corneum producing microscopic “holes” in the dermis. These microscopic wounds lead to the release of growth factors stimulating the formation of new collagen, elastin, and neovascularization in the dermis. Similar to microneedling, subcision uses repeat trauma to the dermis and subcutis through the insertion and repeat movement of a needle.

In our practice, patients presenting with hypopigmentation of the skin from a variety of causes have been treated with a series of five subcision or microneedling procedures, resulting in rapid repigmentation of the skin with minimal to no side effects. Trauma to the skin causes regenerative mechanisms and wound healing. The release of cytokines that induce neoangiogenesis, neocollagenesis, and the deposition of hemosiderin from dermal bleeding induce the activation of melanocytes and stimulate skin pigmentation.

Subcision and microneedling are safe, effective, in-office procedures with vast indications that now can be applied to depigmented and hypopigmented skin. Patients have little to no downtime and results are permanent.
Dr. Talakoub and Dr. Wesley are co-contributors to this column. Dr. Talakoub is in private practice in McLean, Va. Dr. Wesley practices dermatology in Beverly Hills, Calif. This month’s column is by Dr. Talakoub. Write to them at [email protected]. They had no relevant disclosures.
References
Dermatol Surg. 1995 Jun;21(6):543-9.
Aesthet Plast Surg. 1997 Jan-Feb;21(1):48-51.
Oral Maxillofac Surg Clin North Am. 2005 Feb;17(1):51-63.
Plast Reconstr Surg. 2008 Apr;121(4):1421-9.
Clin Dermatol. 2008 Mar-Apr;26(2):192-9.Plast Reconstr Surg. 2008 Nov;122(5):1553-63.
J Dermatolog Treat. 2012 Apr;23(2):144-52.
J Cutan Aesthet Surg. 2009 Jan;2(1):26-30.
J Cutan Aesthet Surg. 2009 Jul;2(2):110-1.
J Cosmet Dermatol. 2014 Sep;13(3):180-7.J Am Acad Dermatol. 2016 Nov;75(5):e195-e197.
Hypopigmentation or depigmentation of the skin is very challenging to treat. The loss of melanin in the skin is often a frustrating problem, resulting from acne, burn scars, vitiligo, topically applied chemicals, or cryotherapy. To date, there is no universally accepted treatment that restores skin pigmentation. In our clinic, the induction of trauma to the skin via a series of microneedling or subcision treatments has shown promise in increasing the pigmentation of skin with localized hypo- or depigmented patches.
to improve the appearance of fine lines, acne scars, photoaging, stretch marks, enlarged pores, and other cosmetic issues characterized by loss of collagen or altered collagen remodeling. The skin-needling technique involves fine sterile needles 0.1 mm–2.5 mm in length that repeatedly pierce the stratum corneum producing microscopic “holes” in the dermis. These microscopic wounds lead to the release of growth factors stimulating the formation of new collagen, elastin, and neovascularization in the dermis. Similar to microneedling, subcision uses repeat trauma to the dermis and subcutis through the insertion and repeat movement of a needle.
In our practice, patients presenting with hypopigmentation of the skin from a variety of causes have been treated with a series of five subcision or microneedling procedures, resulting in rapid repigmentation of the skin with minimal to no side effects. Trauma to the skin causes regenerative mechanisms and wound healing. The release of cytokines that induce neoangiogenesis, neocollagenesis, and the deposition of hemosiderin from dermal bleeding induce the activation of melanocytes and stimulate skin pigmentation.
Subcision and microneedling are safe, effective, in-office procedures with vast indications that now can be applied to depigmented and hypopigmented skin. Patients have little to no downtime and results are permanent.
Dr. Talakoub and Dr. Wesley are co-contributors to this column. Dr. Talakoub is in private practice in McLean, Va. Dr. Wesley practices dermatology in Beverly Hills, Calif. This month’s column is by Dr. Talakoub. Write to them at [email protected]. They had no relevant disclosures.
References
Dermatol Surg. 1995 Jun;21(6):543-9.
Aesthet Plast Surg. 1997 Jan-Feb;21(1):48-51.
Oral Maxillofac Surg Clin North Am. 2005 Feb;17(1):51-63.
Plast Reconstr Surg. 2008 Apr;121(4):1421-9.
Clin Dermatol. 2008 Mar-Apr;26(2):192-9.Plast Reconstr Surg. 2008 Nov;122(5):1553-63.
J Dermatolog Treat. 2012 Apr;23(2):144-52.
J Cutan Aesthet Surg. 2009 Jan;2(1):26-30.
J Cutan Aesthet Surg. 2009 Jul;2(2):110-1.
J Cosmet Dermatol. 2014 Sep;13(3):180-7.J Am Acad Dermatol. 2016 Nov;75(5):e195-e197.
Next-gen triple correctors look safe and effective for cystic fibrosis
Adding a next-generation corrector to dual corrector-potentiator therapy is safe and effective in cystic fibrosis patients with one or two Phe508del alleles, results of two randomized phase 2, proof-of-concept clinical trials suggest.

The were reported in the New England Journal of Medicine.
Both triple combinations improved lung function for patients heterozygous for the Phe508del cystic fibrosis transmembrane conductance regulator (CFTR) mutation and a minimal function mutation (Phe508del-MF) who had not previously received CFTR modulators, according to the investigators, who reported results simultaneously at the North American Cystic Fibrosis Conference in Denver.
These therapies also were effective in patients homozygous for Phe508del CFTR mutation (Phe508del-Phe508del) who had previously been treated with tezacaftor-ivacaftor, the results show.
No dose-limiting side effects or toxic effects were observed in the phase 2 studies, which included 4-week treatment periods.
“These trials provide proof of the concept that targeting the Phe508del CFTR protein with a triple-combination corrector–potentiator regimen can restore CFTR function and has the potential to represent a clinical advance for patients with cystic fibrosis who harbor either one or two Phe508del alleles, approximately 9 of every 10 patients with the disease,” Steven M. Rowe, MD, of the University of Alabama at Birmingham and his coauthors said in the report on VX-659 phase 2 study.
In that report, 63 patients with the Phe508del-MF genotype were randomized to one of three VX-659 doses in combination with tezacaftor and ivacaftor versus triple placebo for 4 weeks, while 29 Phe508del-Phe508del patients underwent a 4-week tezacaftor-ivacaftor run-in phase before starting 4 weeks of the triple combination.
The primary efficacy endpoint of the study was the absolute increase in percentage of predicted forced expiratory volume in 1 second (FEV1).
In the Phe508del-MF patients, adding VX-659 improved that endpoint by up to 13.3 points versus baseline (P less than .001), whereas the absolute change was just 0.4 in the placebo group, the report shows. In the Phe508del-phe508del group, there was a 9.7-point increase over baseline.
Similarly, the companion study on VX-445, reported by Jennifer L. Taylor‑Cousar, MD, of National Jewish Health, Denver, and her colleagues, showed an increase in percentage of predicted FEV1 of up to 13.8 points for Phe508del-MF patients (P less than .001), and an increase of 11.0 points in the Phe508del-Phe508del group (P less than .001).
Those results suggest that targeting the Phe508del CFTR mutation with a combination of two correctors and a potentiator can produce effective CFTR function in patients who have these forms of cystic fibrosis, according to Dr. Taylor-Cousar and her colleagues.
“Lung function was improved by a magnitude similar to that achieved with the CFTR modulator ivacaftor in patients with gating mutations, in whom treatment has been disease modifying,” the researchers wrote in their report.
Sweat chloride concentrations were reduced and respiratory domain scores were improved in patients receiving triple therapy, investigators reported.
Triple therapy improved Phe508del CFTR protein processing and trafficking, and chloride transport more so than any two agents in combination, according in vitro results, also described in the studies.
Phase 3 trials of these compounds are now underway, they said.
Both studies were supported by Vertex Pharmaceuticals, which received funding from the Cystic Fibrosis Foundation for the development of both VX-445 and VX-659. Dr. Rowe and Dr. Taylor-Cousar reported grants, personal fees, and nonfinancial support from Vertex while conducting the study. Study authors also reported disclosures related to AstraZeneca, Novartis, Bayer, Proteostasis, Gilead, Galapagos/AbbVie, and Celtaxsys, among other entities. Full disclosures for all authors were provided in the journal.
SOURCES: Keating D et al. N Engl J Med. 2018 Oct 18. doi: 10.1056/NEJMoa1807120; Davies JC et al. N Engl J Med. 2018 Oct 18. doi: 10.1056/NEJMoa1807119.
These recent investigations show that triple combination therapy improves lung function more than double combination therapy in patients with cystic fibrosis and Phe508del mutations, according to Fernando Holguin, MD, of the division of pulmonary sciences and critical care at the University of Colorado, Aurora.
“These reports represent a major breakthrough in cystic fibrosis therapeutics, with the potential for improving health and possibly survival in all patients who carry the most common cystic fibrosis transmembrane conductance regulator [CFTR] mutation,” Dr. Holguin said in an editorial.
Neither study reported dose-limiting side effects or toxicity, and only three patients in the VX-445 study stopped treatment due to adverse events, he remarked in his editorial.
However, it remains to be seen whether the lung function improvements will be maintained for longer treatment periods, he said. Patients in the phase 2 studies received a total of 4 weeks of the trial regimen, according to the reports. Also unknown is whether the new therapies will reduce exacerbation rates, or impact outcomes such as weight gain.
“These questions should soon be answered in the ongoing phase 3 trials of these regimens,” he added.
These comments are excerpted from an editorial by Dr. Holguin that accompanied the study (N Eng J Med. Oct 18; doi: 10.1056/NEJMe1811996). Dr. Holguin reported that he had no disclosures related to his editorial.
Adding a next-generation corrector to dual corrector-potentiator therapy is safe and effective in cystic fibrosis patients with one or two Phe508del alleles, results of two randomized phase 2, proof-of-concept clinical trials suggest.
The were reported in the New England Journal of Medicine.
Both triple combinations improved lung function for patients heterozygous for the Phe508del cystic fibrosis transmembrane conductance regulator (CFTR) mutation and a minimal function mutation (Phe508del-MF) who had not previously received CFTR modulators, according to the investigators, who reported results simultaneously at the North American Cystic Fibrosis Conference in Denver.
These therapies also were effective in patients homozygous for Phe508del CFTR mutation (Phe508del-Phe508del) who had previously been treated with tezacaftor-ivacaftor, the results show.
No dose-limiting side effects or toxic effects were observed in the phase 2 studies, which included 4-week treatment periods.
“These trials provide proof of the concept that targeting the Phe508del CFTR protein with a triple-combination corrector–potentiator regimen can restore CFTR function and has the potential to represent a clinical advance for patients with cystic fibrosis who harbor either one or two Phe508del alleles, approximately 9 of every 10 patients with the disease,” Steven M. Rowe, MD, of the University of Alabama at Birmingham and his coauthors said in the report on VX-659 phase 2 study.
In that report, 63 patients with the Phe508del-MF genotype were randomized to one of three VX-659 doses in combination with tezacaftor and ivacaftor versus triple placebo for 4 weeks, while 29 Phe508del-Phe508del patients underwent a 4-week tezacaftor-ivacaftor run-in phase before starting 4 weeks of the triple combination.
The primary efficacy endpoint of the study was the absolute increase in percentage of predicted forced expiratory volume in 1 second (FEV1).
In the Phe508del-MF patients, adding VX-659 improved that endpoint by up to 13.3 points versus baseline (P less than .001), whereas the absolute change was just 0.4 in the placebo group, the report shows. In the Phe508del-phe508del group, there was a 9.7-point increase over baseline.
Similarly, the companion study on VX-445, reported by Jennifer L. Taylor‑Cousar, MD, of National Jewish Health, Denver, and her colleagues, showed an increase in percentage of predicted FEV1 of up to 13.8 points for Phe508del-MF patients (P less than .001), and an increase of 11.0 points in the Phe508del-Phe508del group (P less than .001).
Those results suggest that targeting the Phe508del CFTR mutation with a combination of two correctors and a potentiator can produce effective CFTR function in patients who have these forms of cystic fibrosis, according to Dr. Taylor-Cousar and her colleagues.
“Lung function was improved by a magnitude similar to that achieved with the CFTR modulator ivacaftor in patients with gating mutations, in whom treatment has been disease modifying,” the researchers wrote in their report.
Sweat chloride concentrations were reduced and respiratory domain scores were improved in patients receiving triple therapy, investigators reported.
Triple therapy improved Phe508del CFTR protein processing and trafficking, and chloride transport more so than any two agents in combination, according in vitro results, also described in the studies.
Phase 3 trials of these compounds are now underway, they said.
Both studies were supported by Vertex Pharmaceuticals, which received funding from the Cystic Fibrosis Foundation for the development of both VX-445 and VX-659. Dr. Rowe and Dr. Taylor-Cousar reported grants, personal fees, and nonfinancial support from Vertex while conducting the study. Study authors also reported disclosures related to AstraZeneca, Novartis, Bayer, Proteostasis, Gilead, Galapagos/AbbVie, and Celtaxsys, among other entities. Full disclosures for all authors were provided in the journal.
SOURCES: Keating D et al. N Engl J Med. 2018 Oct 18. doi: 10.1056/NEJMoa1807120; Davies JC et al. N Engl J Med. 2018 Oct 18. doi: 10.1056/NEJMoa1807119.
FROM THE NEW ENGLAND JOURNAL OF MEDICINE
Key clinical point: Adding the next-generation correctors VX-445 or VX-659 to tezacaftor-ivacaftor was safe and improved lung function in patients with one or two Phe508del alleles.
Major finding: Improvements of up to 13.8 points over baseline were noted in absolute increase in percentage of predicted FEV1, the primary efficacy endpoint of the investigations.
Study details: Companion phase 2, randomized proof-of-concept studies included a total of 117 and 123 patients with cystic fibrosis.
Disclosures: Both studies were supported by Vertex Pharmaceuticals. Lead investigators reported grants, personal fees, and nonfinancial support from Vertex during the study. Other disclosures reported were related to AstraZeneca, Novartis, Bayer, Gilead, and Galapagos/AbbVie, among others.
Sources: Keating D et al. N Engl J Med. 2018 Oct 18. doi: 10.1056/NEJMoa1807120; Davies JC et al. N Engl J Med. 2018 Oct 18. doi: 10.1056/NEJMoa1807119.