User login
FDA OKs stimulation device for anxiety in depression
The U.S. Food and Drug Administration has expanded the indication for the noninvasive BrainsWay Deep Transcranial Magnetic Stimulation (Deep TMS) System to include treatment of comorbid anxiety symptoms in adult patients with depression, the company has announced.

As reported by this news organization, the neurostimulation system has previously received FDA approval for treatment-resistant major depression, obsessive-compulsive disorder, and smoking addiction.
In the August 18 announcement, BrainsWay reported that it has also received 510(k) clearance from the FDA to market its TMS system for the reduction of anxious depression symptoms.
“This clearance is confirmation of what many have believed anecdotally for years – that Deep TMS is a unique form of therapy that can address comorbid anxiety symptoms using the same depression treatment protocol,” Aron Tendler, MD, chief medical officer at BrainsWay, said in a press release.
‘Consistent, robust’ effect
, which included both randomized controlled trials and open-label studies.
“The data demonstrated a treatment effect that was consistent, robust, and clinically meaningful for decreasing anxiety symptoms in adult patients suffering from major depressive disorder [MDD],” the company said in its release.
Data from three of the randomized trials showed an effect size of 0.3 when compared with a sham device and an effect size of 0.9 when compared with medication. The overall, weighted, pooled effect size was 0.55.
The company noted that in more than 70 published studies with about 16,000 total participants, effect sizes have ranged from 0.2-0.37 for drug-based anxiety treatments.
“The expanded FDA labeling now allows BrainsWay to market its Deep TMS System for the treatment of depressive episodes and for decreasing anxiety symptoms for those who may exhibit comorbid anxiety symptoms in adult patients suffering from [MDD] and who failed to achieve satisfactory improvement from previous antidepressant medication treatment in the current episode,” the company said.
A version of this article first appeared on Medscape.com.
The U.S. Food and Drug Administration has expanded the indication for the noninvasive BrainsWay Deep Transcranial Magnetic Stimulation (Deep TMS) System to include treatment of comorbid anxiety symptoms in adult patients with depression, the company has announced.
As reported by this news organization, the neurostimulation system has previously received FDA approval for treatment-resistant major depression, obsessive-compulsive disorder, and smoking addiction.
In the August 18 announcement, BrainsWay reported that it has also received 510(k) clearance from the FDA to market its TMS system for the reduction of anxious depression symptoms.
“This clearance is confirmation of what many have believed anecdotally for years – that Deep TMS is a unique form of therapy that can address comorbid anxiety symptoms using the same depression treatment protocol,” Aron Tendler, MD, chief medical officer at BrainsWay, said in a press release.
‘Consistent, robust’ effect
, which included both randomized controlled trials and open-label studies.
“The data demonstrated a treatment effect that was consistent, robust, and clinically meaningful for decreasing anxiety symptoms in adult patients suffering from major depressive disorder [MDD],” the company said in its release.
Data from three of the randomized trials showed an effect size of 0.3 when compared with a sham device and an effect size of 0.9 when compared with medication. The overall, weighted, pooled effect size was 0.55.
The company noted that in more than 70 published studies with about 16,000 total participants, effect sizes have ranged from 0.2-0.37 for drug-based anxiety treatments.
“The expanded FDA labeling now allows BrainsWay to market its Deep TMS System for the treatment of depressive episodes and for decreasing anxiety symptoms for those who may exhibit comorbid anxiety symptoms in adult patients suffering from [MDD] and who failed to achieve satisfactory improvement from previous antidepressant medication treatment in the current episode,” the company said.
A version of this article first appeared on Medscape.com.

COVID-19 booster shots to start in September: Officials
at a press briefing August 18.
Those who received the Pfizer-BioNTech and Moderna vaccines would be eligible to get a booster shot 8 months after they received the second dose of those vaccines, officials said. Information on boosters for those who got the one-dose Johnson & Johnson vaccine will be forthcoming.
“We anticipate a booster will [also] likely be needed,” said U.S. Surgeon General Vivek Murthy, MD. The J&J vaccine was not available in the U.S. until March, he said, and ‘’we expect more data on J&J in the coming weeks, so that plan is coming.”
The plan for boosters for the two mRNA vaccines is pending the FDA’s conducting of an independent review and authorizing the third dose of the Moderna and Pfizer-BioNTech vaccines, as well as an advisory committee of the CDC making the recommendation.
“We know that even highly effective vaccines become less effective over time,” Dr. Murthy said. “Having reviewed the most current data, it is now our clinical judgment that the time to lay out a plan for the COVID-19 boosters is now.”
Research released Aug. 18 shows waning effectiveness of the two mRNA vaccines.
At the briefing, Dr. Murthy and others continually reassured listeners that while effectiveness against infection declines, the vaccines continue to protect against severe infections, hospitalizations, and death.
“If you are fully vaccinated, you still have a high degree of protection against the worst outcomes,” Dr. Murthy said.
Data driving the plan
CDC Director Rochelle Walensky, MD, cited three research studies published Aug. 18 in the CDC’s Morbidity and Mortality Weekly Report that helped to drive the decision to recommend boosters.
Analysis of nursing home COVID-19 data from the CDC’s National Healthcare Safety Network showed a significant decline in the effectiveness of the full mRNA vaccine against lab-confirmed COVID-19 infection, from 74.7% before the Delta variant (March 1-May 9, 2021) to 53% when the Delta variant became predominant in the United States. The analysis during the Delta dominant period included 85,000 weekly reports from nearly 15,000 facilities.
Another study looked at more than 10 million New York adults who had been fully vaccinated with either the Moderna, Pfizer, or J&J vaccine by July 25. During the period from May 3 to July 25, overall, the age-adjusted vaccine effectiveness against infection decreased from 91.7% to 79.8%.
Vaccine effectiveness against hospitalization remains high, another study found. An analysis of 1,129 patients who had gotten two doses of an mRNA vaccine showed vaccine effectiveness against hospitalization after 24 weeks. It was 86% at weeks 2-12 and 84% at weeks 13-24.
Immunologic facts
Immunologic information also points to the need for a booster, said Anthony Fauci, MD, the chief medical advisor to the president and director of the National Institute of Allergy and Infectious Diseases.
“Antibody levels decline over time,” he said, “and higher antibody levels are associated with higher efficacy of the vaccine. Higher levels of antibody may be needed to protect against Delta.”
A booster increased antibody levels by ‘’at least tenfold and possibly more,” he said. And higher levels of antibody may be required to protect against Delta. Taken together, he said, the data support the use of a booster to increase the overall level of protection.
Booster details
“We will make sure it is convenient and easy to get the booster shot,” said Jeff Zients, the White House COVID-19 response coordinator. As with the previous immunization, he said, the booster will be free, and no one will be asked about immigration status.
The plan for booster shots is an attempt to stay ahead of the virus, officials stressed
Big picture
Not everyone agrees with the booster dose idea. At a World Health Organization briefing Aug. 18, WHO’s Chief Scientist Soumya Swaminathan, MD, an Indian pediatrician, said that the right thing to do right now ‘’is to wait for the science to tell us when boosters, which groups of people, and which vaccines need boosters.”
Like others, she also broached the ‘’moral and ethical argument of giving people third doses, when they’re already well protected and while the rest of the world is waiting for their primary immunization.”
Dr. Swaminathan does see a role for boosters to protect immunocompromised people but noted that ‘’that’s a small number of people.” Widespread boosters ‘’will only lead to more variants, to more escape variants, and perhaps we’re heading into more dire situations.”
A version of this article first appeared on WebMD.com.
Pfizer recalls four more lots of smoking cessation drug Chantix
Pfizer has recalled four more lots of the smoking cessation drug varenicline (Chantix), according to an Aug. 16 update on the U.S. Food and Drug Administration website.

In a new FDA MedWatch, the agency notes that these 0.5 mg/1 mg tablets are being recalled because of the presence of N-nitroso-varenicline, a nitrosamine impurity, at a level higher than Pfizer’s acceptable intake limit.
On July 2, the FDA reported that Pfizer had voluntarily recalled nine lots of the drug for this reason. As reported by this news organization, the company added three more lots to the recall a few weeks later.
In the update, the FDA noted that, although long-term ingestion of the impurity “may be associated with a theoretical potential increased cancer risk in humans,” there is no immediate risk in taking this medication. The agency added that no related adverse events (AEs) have been reported.
The four additional lots included in the newest recall are as follows:
- 00018522 (expiration date: August 2021).
- 00018523 (expiration date: August 2021).
- 00018739 (expiration date: August 2021).
- 00018740 (expiration date: August 2021).
The recalled lots were distributed in the United States and Puerto Rico from June 2019 to June 2021.
As before, the FDA noted that the benefits of stopping smoking “outweigh the theoretical potential cancer risk” from varenicline’s impurity.
It added that, although the impurities may increase risk for cancer if a high level of exposure continues over a long period, the drug is intended as a short-term treatment to aid in smoking cessation.
For now, clinicians should report any AEs from varenicline to the FDA’s MedWatch program, and patients taking this treatment should consult with their health care practitioner or pharmacy, the update notes.
A version of this article first appeared on Medscape.com.
Pfizer has recalled four more lots of the smoking cessation drug varenicline (Chantix), according to an Aug. 16 update on the U.S. Food and Drug Administration website.
In a new FDA MedWatch, the agency notes that these 0.5 mg/1 mg tablets are being recalled because of the presence of N-nitroso-varenicline, a nitrosamine impurity, at a level higher than Pfizer’s acceptable intake limit.
On July 2, the FDA reported that Pfizer had voluntarily recalled nine lots of the drug for this reason. As reported by this news organization, the company added three more lots to the recall a few weeks later.
In the update, the FDA noted that, although long-term ingestion of the impurity “may be associated with a theoretical potential increased cancer risk in humans,” there is no immediate risk in taking this medication. The agency added that no related adverse events (AEs) have been reported.
The four additional lots included in the newest recall are as follows:
- 00018522 (expiration date: August 2021).
- 00018523 (expiration date: August 2021).
- 00018739 (expiration date: August 2021).
- 00018740 (expiration date: August 2021).
The recalled lots were distributed in the United States and Puerto Rico from June 2019 to June 2021.
As before, the FDA noted that the benefits of stopping smoking “outweigh the theoretical potential cancer risk” from varenicline’s impurity.
It added that, although the impurities may increase risk for cancer if a high level of exposure continues over a long period, the drug is intended as a short-term treatment to aid in smoking cessation.
For now, clinicians should report any AEs from varenicline to the FDA’s MedWatch program, and patients taking this treatment should consult with their health care practitioner or pharmacy, the update notes.
A version of this article first appeared on Medscape.com.
Latest data show increase in breakthrough COVID-19 cases
Breakthrough cases accounted for about one in five newly diagnosed cases in six of the states, according to the New York Times. Hospitalizations and deaths among vaccinated people may be higher than previously thought as well.
“Remember when the early vaccine studies came out, it was like nobody gets hospitalized, nobody dies,” Robert Wachter, MD, chairman of the department of medicine at the University of California, San Francisco, said in an interview. “That clearly is not true.”
The New York Times analyzed data in seven states – California, Colorado, Massachusetts, Oregon, Utah, Vermont, and Virginia – that are tracking the most detailed information. The trends in these states may not reflect the numbers throughout the country, the newspaper reported.
Even still, the numbers back up the idea that vaccinated people may need booster shots this fall to support their earlier vaccine doses. Federal health officials are scheduled to approve the extra shots in coming weeks, potentially in September. The first people to receive booster shots will likely be health care workers and nursing home residents who took the first vaccines in December and January.
“If the chances of a breakthrough infection have gone up considerably, and I think the evidence is clear that they have, and the level of protection against severe illness is no longer as robust as it was, I think the case for boosters goes up pretty quickly,” Dr. Wachter said.
Previous analyses of breakthrough cases included data from June and earlier, the newspaper reported. But since July, COVID-19 cases have soared again because of the Delta variant, and the most recent numbers show an uptick among vaccinated people. In Los Angeles County, for instance, fully vaccinated people account for 20% of new COVID-19 cases, which is up from 11% in May, 5% in April, and 2% in March, according to a late July report from the Los Angeles County Department of Public Health.
What’s more, breakthrough infections in the seven states accounted for 12%-24% of COVID-19 hospitalizations in those states. About 8,000 breakthrough hospitalizations have been reported to the CDC. Still, the overall numbers remain low – in California, for instance, about 1,615 people have been hospitalized with breakthrough infections, which accounts for 0.007% of the state’s 22 million vaccinated people, the Times reported.
The breakthrough infections appear to be more severe among vaccinated people who are older or have weakened immune systems. About 74% of breakthrough cases are among adults 65 or older, the CDC reported.
The increase may shift how vaccinated people see their risks for infection and interact with loved ones. Public health officials have suggested that people follow some COVID-19 safety protocols again, such as wearing masks in public indoor spaces regardless of vaccination status.
As the Delta variant continues to circulate this fall, public health researchers will be researching more about breakthrough cases among vaccinated people, including whether they have prolonged symptoms and how easily they may pass the virus to others.
“I think some of us have been challenged by the numbers of clusters that we’ve seen,” Michael Osterholm, PhD, director of the Center for Infectious Disease Research and Policy at the University of Minnesota, told this news organization.
“I think that really needs to be examined more,” he said.
A version of this article first appeared on WebMD.com.
Mental health after ICU: It’s complicated
It is well known that survivors of critical care are at heightened risk of mental health disorders even months afterward they are discharged, but it’s less clear what factors might contribute to those outcomes. A new attempt to identify risk factors for post-ICU depression, anxiety, or posttraumatic stress disorder, as well as worse quality of life, paints a complex picture.
Age, mental preexisting mental health concerns, acute emotional stress at the time of critical care, and post-care physical impairment all may play a role, according to the multicenter, prospective cohort study conducted in Brazil, which was published in CHEST .
Previous systematic reviews have shown raised frequencies mental health disorders following ICU discharge, including anxiety (32%-40%), depression (29%-34%), and PTSD (16%-23%). Few studies have looked at the potential impact of preexisting conditions or post-ICU disability on these outcomes, yet that information is critical to key to designing effective prevention and rehabilitation interventions.
The results suggest that preexisting mental health and factors associated with the critical illness, which have gained attention as potential factors, aren’t sufficient to explain these outcomes. “Our data suggest that the network of potential risk factors for mental illness among patients who have been discharged from the ICU is much more complex and may involve risk factors from multiple domains. ... Long-term mental health disorders after critical illness may be the result of the interaction among stressors before ICU stay, during ICU stay, and after ICU stay, calling attention to the need for interdisciplinary and multifaceted strategies aimed at preventing and screening for mental health disorders after ICU discharge,” Cassiano Teixeira, MD, PhD, of the Postgraduation of Pulmonology–Federal University of Rio Grande do Sul, Brazil, and colleagues wrote.
The researchers also noted that some risk factors could be screened and may be modifiable, including anxiety and depression symptoms at ICU discharge, as well as reduced physical function status.
Complications or risk factors?
The findings are significant, though they may represent complications of emotional distress following ICU stays, rather than risk factors that predict it, according to an accompanying editorial. The author, O. Joseph Bienvenu III, MD, PhD, who is a professor of psychiatry and behavioral sciences at Johns Hopkins Medicine, Baltimore. He called for prospective studies to determine the predictive value of these factors. “If we are to improve long-term mental health after critical illnesses, this predictive information will be vital to selective prevention efforts.”

Potential interventions could include psychological treatment in the ICU, ICU follow-up clinics, support groups, and cognitive-behavioral therapy, among others. Whichever approach is used, it should be targeted, according to Dr. Bienvenu, since patients who have greater emotional distress seem to gain the most benefit from such interventions.
The researchers examined outcomes among 579 adults who had spent at least 72 hours in the ICU. The median age was 61 years, and 47% were women.
Six months after release from the ICU, telephone assessments by trained researchers revealed that 48% had impairment in physical function, compared with the time preceding ICU admission. 36.2% of participants had a mental health disorder: 24.2% reported anxiety, 20.9% had depression, and 15.4% had PTSD.
Increasing numbers of psychiatric syndromes, from 0 to 3, was associated with worse scores on the mental dimension on the health-related quality of life (HRQoL) score, but there was no relationship with scores on the physical dimension.
Risks to mental health
Clinical characteristics associated with risk of anxiety at 6 months post discharge included being 65 years or older (prevalence ratio, 0.63; P = .009), a history of depression (PR, 1.52; P = .009), anxiety at discharge (PR, 1.65; P = .003), depression at discharge (HR, 1.44; P = .02), physical dependence (PR, 1.48; P = .01), and reduced physical functional status at 6 months post discharge (PR, 1.38; P = .04).
Characteristics associated with depression at 6 months post discharge included a history of depression (PR, 1.78; P = .001), symptoms of depression at discharge (PR, 3.04; P < .001), and reduced physical functional status at 6 months (PR, 1.53; P = .01).
Characteristics associated with PTSD at 6 months post discharge were depression symptoms at discharge (PR, 1.70; P = .01), physical dependence (PR, 1.79; P = .01), and reduced physical status at 6 months (PR, 1.62; P = .02).
Characteristics associated with any mental health disorder included higher education (PR, 0.74; P = .04), a history of depression (PR, 1.32; P = .02), anxiety symptoms at discharge (PR, 1.55; P = .001), depression symptoms at discharge (PR, 1.50; P = .001), and physical dependence at 6 months following discharge (PR, 1.66; P < .001).
“The lower HRQoL found in ICU survivors with mental health disorders in comparison with those without is a reason for concern. This finding, in association with the higher prevalence of psychiatric syndromes among ICU survivors, reinforces the importance of assessing anxiety, depression, and PTSD symptoms among ICU survivors, because these syndromes typically are long lasting and underdiagnosed, and their occurrence may affect quality of life, survival, and costs in the context of care after ICU discharge,” according to the researchers.
The authors of the study and Dr. Bienvenu have no relevant financial disclosures.
It is well known that survivors of critical care are at heightened risk of mental health disorders even months afterward they are discharged, but it’s less clear what factors might contribute to those outcomes. A new attempt to identify risk factors for post-ICU depression, anxiety, or posttraumatic stress disorder, as well as worse quality of life, paints a complex picture.
Age, mental preexisting mental health concerns, acute emotional stress at the time of critical care, and post-care physical impairment all may play a role, according to the multicenter, prospective cohort study conducted in Brazil, which was published in CHEST .
Previous systematic reviews have shown raised frequencies mental health disorders following ICU discharge, including anxiety (32%-40%), depression (29%-34%), and PTSD (16%-23%). Few studies have looked at the potential impact of preexisting conditions or post-ICU disability on these outcomes, yet that information is critical to key to designing effective prevention and rehabilitation interventions.
The results suggest that preexisting mental health and factors associated with the critical illness, which have gained attention as potential factors, aren’t sufficient to explain these outcomes. “Our data suggest that the network of potential risk factors for mental illness among patients who have been discharged from the ICU is much more complex and may involve risk factors from multiple domains. ... Long-term mental health disorders after critical illness may be the result of the interaction among stressors before ICU stay, during ICU stay, and after ICU stay, calling attention to the need for interdisciplinary and multifaceted strategies aimed at preventing and screening for mental health disorders after ICU discharge,” Cassiano Teixeira, MD, PhD, of the Postgraduation of Pulmonology–Federal University of Rio Grande do Sul, Brazil, and colleagues wrote.
The researchers also noted that some risk factors could be screened and may be modifiable, including anxiety and depression symptoms at ICU discharge, as well as reduced physical function status.
Complications or risk factors?
The findings are significant, though they may represent complications of emotional distress following ICU stays, rather than risk factors that predict it, according to an accompanying editorial. The author, O. Joseph Bienvenu III, MD, PhD, who is a professor of psychiatry and behavioral sciences at Johns Hopkins Medicine, Baltimore. He called for prospective studies to determine the predictive value of these factors. “If we are to improve long-term mental health after critical illnesses, this predictive information will be vital to selective prevention efforts.”
Potential interventions could include psychological treatment in the ICU, ICU follow-up clinics, support groups, and cognitive-behavioral therapy, among others. Whichever approach is used, it should be targeted, according to Dr. Bienvenu, since patients who have greater emotional distress seem to gain the most benefit from such interventions.
The researchers examined outcomes among 579 adults who had spent at least 72 hours in the ICU. The median age was 61 years, and 47% were women.
Six months after release from the ICU, telephone assessments by trained researchers revealed that 48% had impairment in physical function, compared with the time preceding ICU admission. 36.2% of participants had a mental health disorder: 24.2% reported anxiety, 20.9% had depression, and 15.4% had PTSD.
Increasing numbers of psychiatric syndromes, from 0 to 3, was associated with worse scores on the mental dimension on the health-related quality of life (HRQoL) score, but there was no relationship with scores on the physical dimension.
Risks to mental health
Clinical characteristics associated with risk of anxiety at 6 months post discharge included being 65 years or older (prevalence ratio, 0.63; P = .009), a history of depression (PR, 1.52; P = .009), anxiety at discharge (PR, 1.65; P = .003), depression at discharge (HR, 1.44; P = .02), physical dependence (PR, 1.48; P = .01), and reduced physical functional status at 6 months post discharge (PR, 1.38; P = .04).
Characteristics associated with depression at 6 months post discharge included a history of depression (PR, 1.78; P = .001), symptoms of depression at discharge (PR, 3.04; P < .001), and reduced physical functional status at 6 months (PR, 1.53; P = .01).
Characteristics associated with PTSD at 6 months post discharge were depression symptoms at discharge (PR, 1.70; P = .01), physical dependence (PR, 1.79; P = .01), and reduced physical status at 6 months (PR, 1.62; P = .02).
Characteristics associated with any mental health disorder included higher education (PR, 0.74; P = .04), a history of depression (PR, 1.32; P = .02), anxiety symptoms at discharge (PR, 1.55; P = .001), depression symptoms at discharge (PR, 1.50; P = .001), and physical dependence at 6 months following discharge (PR, 1.66; P < .001).
“The lower HRQoL found in ICU survivors with mental health disorders in comparison with those without is a reason for concern. This finding, in association with the higher prevalence of psychiatric syndromes among ICU survivors, reinforces the importance of assessing anxiety, depression, and PTSD symptoms among ICU survivors, because these syndromes typically are long lasting and underdiagnosed, and their occurrence may affect quality of life, survival, and costs in the context of care after ICU discharge,” according to the researchers.
The authors of the study and Dr. Bienvenu have no relevant financial disclosures.
FROM CHEST
Preterm and early term birth linked to an increased risk of autism
Preterm and early birth is associated with an increased risk of autism independent of genetic or environmental factors, according to new research published in Pediatrics.
Although previous studies have linked preterm births to an increased risk of autism – one 2017 study published in Cerebral Cortex found that 27.4% of the children born extremely preterm were diagnosed with autism – Casey Crump, MD, PhD, said potential causality, sex-specific differences, and association with early-term births were still unclear.
“Preterm birth had previously been linked with higher risk of autism; however, several important questions remained unanswered,” said Dr. Crump, professor and vice chair for research at the department of family medicine and community health and professor of epidemiology in the department of population health science and policy at Icahn School of Medicine at Mount Sinai New York. “To our knowledge, [our study] is the largest to date of gestational age at birth in relation to autism, and one of the first to investigate sex-specific differences, early term birth, or the influence of shared familial factors.”
Dr. Crump and colleagues examined data from more than 4 million infants born in Sweden between 1973 and 2013 who were followed-up for autism spectrum disorder identified from nationwide outpatient and inpatient diagnoses through December 2015. Children born between 22 and 27 weeks were considered extremely preterm, those born between 28 and 33 week were characterized as very to moderate preterm, and those born between 34 and 36 weeks were considered late preterm. Early-term births are characterized as infants born between 37 and 38 weeks and children born between 39 and 41 weeks were considered term births.
They found that 6.1% of those born extremely preterm were diagnosed with autism. Meanwhile, autism spectrum disorder prevalences were 2.6% for very to moderate preterm, 1.9% for late preterm, 2.1% for all preterm, and 1.6% for early term, compared with 1.4% for term birth.
The researchers’ analysis showed that preterm and early birth were associated with a significantly increased risk of autism in males and females. Children who were born extremely preterm had an approximately fourfold increased risk of autism. Researchers also found that each additional week of gestation was associated with a 5% lower prevalence of autism spectrum disorder (ASD) on average.
“The elevated risk even in [late preterm] infants is not completely surprising because a number of investigators have shown higher incidences of early cognitive, language motor and impairment, and school problems ... and psychiatric disorders, some of which may extend to adulthood,” Elisabeth McGowan, MD, who was not involved in the study, said in a solicited editorial commentary about the study.
Dr. Crump believes the association between preterm birth and autism may be because of increased inflammatory marker levels. A 2009 study published in Reproductive Sciences found that increased proinflammatory cytokine levels have been associated with the timing and initiation of preterm birth, and also have been detected in the brain and cerebrospinal fluid of individuals with autism “and may play a key role in its pathogenesis,” Dr. Crump said.
“Inflammatory-driven alteration of neuronal connections during critical periods of brain development may be central to the development of autism,” Dr. Crump explained.
However, Dr. Crump said that, although the relative risks of autism were higher in those born preterm, the absolute risk of the condition is low.
“The report by Crump is in many ways a definitive accounting of the elevated rates of ASD in preterm infants,” said Dr. McGowan, associate professor of pediatrics at the Women and Infants Hospital, Providence, R.I. “And although the impact of prematurity on brain development may be part of the causal chain resulting in ASD (or other neurodevelopmental outcomes), these factors are operating in a complex biological landscape, with pathways to ASD outcomes that can be expected to be heterogeneous.”
ASD is a developmental condition that affects about 1 in 54 children, according to the Centers for Disease Control and Prevention. Many children are not diagnosed with ASD until later in childhood, which in some cases delays treatment and early intervention. ASD may be detected as early as 18 months, but the average age of diagnosis for ASD is 4.3 years, according to the CDC.
“Children born prematurely need early evaluation and long-term follow-up to facilitate timely detection and treatment of autism, especially those born at the earliest gestational ages,” Dr. Crump said in an interview. “In patients of all ages, gestational age at birth should be routinely included in history-taking and medical records to help identify in clinical practice those born preterm or early term. Such information can provide additional valuable context for understanding patients’ health and may facilitate earlier evaluation for autism and other neurodevelopmental conditions in those born prematurely.”
Dr. Crump and colleagues said more research is needed to understand the biologic mechanisms linking preterm birth with higher risks of autism, which “may reveal new targets for intervention at critical windows of neurodevelopment to improve the disease trajectory.”
Experts interviewed did not disclose any relevant financial relationships.
FROM PEDIATRICS
Inflamed skin lesions on legs
Superinfected eczema is an inflammation of the skin accompanied by itchy, weeping, oozing lesions. Secondary infection of the open skin can occur as a result of scratching. In this case, the infection was a consequence of sensitivity to wearing shin pads.
Although superinfected eczema is a complication of eczema, it can produce separate challenges. With damaged protective skin function and disturbance of quantity and quality of skin lipids, patients with eczema may have secondary bacterial infections. Staphylococcus aureus organisms are the most common etiologic agents; up to 90% of patients with eczema have staphylococcal colonization. Streptococcus is less commonly a cause. The progression from colonization to infection often is associated with a flare of eczema, and increased severity of the eczema is associated with more colonization. More erythema may be noted when the infection begins; then, the affected areas become encrusted or show a serous drainage. A clinical clue to superinfection of any kind is when patients stop responding to therapies that they are normally responsive to (eg, topical steroids).
With the recent increase in methicillin-resistant S. aureus (MRSA), treatment of a secondary infection of eczema with these organisms can be tricky. Patients with eczema and secondary bacterial skin infections should be treated with topical steroids or other anti-inflammatory medications and moisturizers to repair the skin barrier. The level of skin colonization with S. aureus is decreased with use of these agents alone. Topical or systemic antibiotics appropriate for specific or community-based sensitivities may be needed in severe infections.
Because of the damaged protective skin function, cutaneous inoculation of herpes simplex virus (HSV) can occur. Eczema herpeticum, or HSV-associated Kaposi varicelliform eruption, describes eczema secondarily infected with HSV (type 1 or type 2). The eczema may become more erythematous; then, vesicles develop that are arranged in a grouped pattern. Accompanying symptoms include fever, malaise, and lymphadenopathy. The condition can be diagnosed by a Tzanck smear (seeking multinucleated giant cells), a fluorescent antibody smear, or culture of a vesicular lesion. Patients with eczema herpeticum should be treated with acyclovir. More severe involvement may require hospitalization and use of systemic antivirals. In addition, topical steroids and moisturizers should be continued to repair the skin barrier.
Children with eczema are more likely than adults to acquire molluscum contagiosum infection, and the disease tends to be widespread. The lesions are generally smooth papules, sometimes with umbilicated skin. The lesions can spread by auto-inoculation to surrounding areas. Molluscum dermatitis accompanies 10% of molluscum lesions, and the dermatitis can be difficult to distinguish from eczema lesions. Untreated, molluscum lesions may resolve on their own; if necessary, the lesions can be treated with cantharidin, liquid nitrogen, or curettage.
Molluscum dermatitis is treated with topical steroids. Early recognition of infections associated with a diagnosis of eczema is critical for timely initiation of appropriate treatment.
Brian S. Kim, MD, Associate Professor, Department of Medicine, Division of Dermatology, Washington University School of Medicine, St. Louis, Missouri
Brian S. Kim, MD, has disclosed no relevant financial relationships.

An 11-year-old boy presents with diffuse, inflamed lesions on both shins. His mother first noticed the abrasions when he was scratching them to the point where they bled. He doesn't remember any insect bites, but as a catcher on his Little League baseball team, he noticed that the lesions are always worse after a game and after practice. He is generally healthy and of normal weight for his height. He has no history of allergies or asthma.
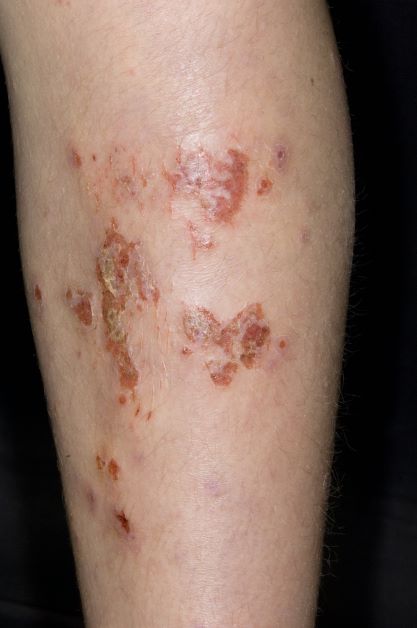
Health care workers share stories of Delta variant’s toll
With the Delta variant surging across the country, already spread-thin health care workers are facing even sicker –and younger – Americans affected by COVID-19 than at the start of the pandemic.
While the exact toll the pandemic will take on essential workers will remain unknown, one thing is clear: The COVID-19 outbreak they’re experiencing right now on the front lines is a far cry from the original strain. They’re scared, exasperated, and crying out for us to pay attention and get vaccinated.
Five health care workers told this news organization about their experiences working the front lines amid the recent surge and what they think needs to happen – fast.
COVID-19 perspective from a paramedic in Connecticut
Michael Battistelli has been an emergency medical services worker for over 20 years and a licensed paramedic in Stratford, Conn., for a decade. He’s also the father of a 5-year-old daughter who isn’t eligible for a vaccination yet. For him, every day has been the same since the start of the pandemic: Surgical mask, N95 mask, face shield, change clothes before going home, and shower as soon as he walks in the door. He’s worried about Delta right now and wants you to be, too.
What keeps him up at night: “It seems like the last time, COVID-19 hit the Pacific Northwest and Northeast first. I hope it’s not the reverse and that it isn’t working its way back up to us here in Connecticut. I’ll add that if we start seeing young people dying, that might be it for me. That might be my final stand as an EMS.”
Why he’s frustrated: “For people to say COVID-19 isn’t real is mind-blowing. I’ve been at this for over a year, and all I think about is how to keep my daughter safe and protect my parents, especially my mom, who is a cancer survivor. When this first started, I brought people into the hospital who thought they would be fine after a day or week in the hospital. They ended up being on ventilators for months – and these were healthy people.”
What he wants to see: “I try not to judge people, but please understand how hard health care workers are working. We’re fatigued and burned out, and we are begging you: Please get vaccinated.”
COVID-19 perspective from an ICU director in Tennessee
Todd Rice, MD, FCCP, is an associate professor of medicine in the division of allergy, pulmonary and critical care at Vanderbilt Medical Center in Nashville, Tenn. While this father of two – ages 15 and 17 – trained for a pandemic, specifically Ebola and H1N1, the sheer volume of young COVID-19 patients in the ICU right now is taking a huge toll on him and his staff.
Why he’s frustrated: “First, there are a group of people that are adamantly against getting vaccinated. It doesn’t matter what we do or say. Second, a lot of people are confused and tell me that they don’t have somebody they trust to answer their questions about the vaccine. Third, some of this is driven by our colleagues: In the last 2 weeks, eight pregnant women with COVID-19 were admitted to our ICU. At least six said that their [obstetrician] told them not to get the vaccine while pregnant. That myth is still out there.”
What’s going on in the ICU: “I want people to know that our unvaccinated infected COVID-19 patients are the sickest patients we take care of. Their condition can change on a dime. We think they’re getting better, and suddenly we turn around and they’re near death or they die in seconds. What’s hard for our staff is that many of these patients have been with us for several weeks, and we get to know them. So when this happens, it hurts us even more because we’ve gotten to know them.”
What we need to do: “While it may take time, we have to talk to vaccine-hesitant people one by one and ask them what questions they have and then provide them with the answers they need. I think the next 6 months is going to be all about getting people who are still movable on this and get them to be comfortable that the vaccine is safe, that we didn’t cut corners. Yes, it was developed faster than anything we’ve ever done before, but that’s because it had to be.”
COVID-19 perspective from a cardiopulmonary doctor in Florida
Yvonne Billings, MD, director of cardiopulmonary medicine at Cleveland Clinic Martin Health in Stuart, Fla., says the “explosion” of COVID-19 cases right after July 4 has left her and her staff emotionally and physically overwhelmed.
What worries her: “We have great PPE, but we’re all worries because Delta is so contagious, and our colleagues have gotten it. We’ll eat lunch next to each other – socially distanced, of course – and we won’t know if we’ve gotten it by just sitting down to eat.”
What she wants us to do – now: “Everyone needs to listen to the real medical science and understand how much this is impacting everyone’s care. For example, if you need to come to the hospital for something other than COVID-19, you will receive slower care because everyone is so tied up caring for COVID-19 patients.”
Health care workers need to get on board, too: “I look at some of my respiratory therapists who chose not to be vaccinated until this last surge. Many told me that when the younger patients started coming in, they could relate to that. One said: ‘I see this gentleman is 27. I’m 27. I could be in the exact same position.’ I don’t want to see anyone get sick, but I’m hoping that when people see that this affects anyone at any age, they can push politics and what they thought was true about the vaccine aside, and make different choices and move forward.”
COVID-19 perspective from a registered nurse in Louisiana
Gina McNemar, 37, an ICU nurse at Baton Rouge General Medical Center in Baton Rouge, La., is wiped out. Her ICU unit is currently full of COVID-19 patients. This mom of 5-year-old twins is so upset about the onslaught of patients in her unit that she sent an email to the CEO of the hospital, which he then shared on Facebook with hundreds of followers. From the email: “This Covid is different. Let me repeat myself: THIS COVID IS NOT THE SAME. ... For the first time since April 2020, I kneeled on top of a patient in the middle of CPR and saw myself. She was 41 years old, no comorbidities, a full life ahead of her. The first time we fought Covid, everyone was old and sickly. They weren’t ‘me.’ This sweet woman was ‘me.’ We ran a full code on her for 1 hour and 26 minutes in front of her fiancé. He cried out to God to save her. He cried out to us to save her. We did everything in our power to save her. We weren’t able to. Three nurses, a pharmacy tech, an x-ray tech, and our HMG doctor hugged, prayed, and cried together after. She was living her life, got Covid, and died.”
Why she wants people to pay attention: “Our COVID-19 patients are young, they’re healthy, they’re able to answer our questions and immediately crash. We don’t have time to catch our breath between one code to the next. This COVID-19 is a much more violent disease, and I can no longer keep quiet. Someone has to say it. Someone has to say, ‘You can believe what you want to believe,’ but I’m seeing it with my own eyes, I’m holding their hands while they die, I’m bagging their body for the morgue. See this crisis through my eyes – please!”
What’s happening with her coworkers: “We’ve had some pretty bad days. We’re all crying and we’re afraid for each other now. We feel like it could be any of us at any point. I’m feeling that I don’t want to let it get to me, but it is. At home, we pray every night. The other night, one of my twins said: ‘I pray that you don’t get coronavirus and die.’ I can’t help but think: 5-year-olds should pray for unicorns and rainbows, not that their mom could die at work.”
Please stop playing politics: “America has become so divided and the vaccine somehow became the evil thing instead of the fact that the vaccine is the savior. I waited in line to get my vaccine because the scientists came up with something to end all this, but not everyone sees it that way. I feel like people don’t want to see and it shouldn’t matter if you’re a Republican or Democrat – after all, Biden is vaccinated [and] Trump is vaccinated.”
COVID-19 perspective from an ED doctor in New York City
Amanda Smith, MD, an ED doctor at Staten Island University Hospital in New York, says she’s sensing a “slow wave coming” when it comes to the Delta variant. The mom of three kids (she has 10-year-old twins and a 12-year-old) thinks often of the first signs of COVID-19 in 2020 and hopes that there won’t be a repeat surge like the initial one in New York City.
It’s hard not to feel frustrated: “I’m annoyed about the Delta variant. Of course, I’ve experienced the ‘I’m not getting the vaccine’ argument, and I’ve been at this long enough that I’m able to compartmentalize my own feelings, but I’m worn down, and I’m aware that I have compassion fatigue. When people complain about their COVID-19 symptoms and say things like ‘If I knew I would feel this horrible, I would have gotten the vaccine,’ I can’t help but feel that this was avoidable. It’s hard to talk to those people. I want to say ‘600,000 dead people weren’t enough to get vaccinated?’ ”
The people avoiding the vaccine: “There are the absolute deniers who will never get vaccinated and aren’t going to change their minds. Then there are the people who feel invincible, and then there are the folks who think that COVID-19 isn’t that bad, it’s just like the flu, it’s only old people dying and they’re not getting information from an appropriate source. It’s not the flu, it does kill you. Delta kills younger people, and it’s very easy to spread. Every one person who was infected with the original strain could infect two to three others. The Delta variant can infect 8-9, and measles, at 13, is the most contagious, so we need to keep reminding people about this.”
It’s not just about you: “Vaccination campaigns were never about the individual. We live together in a civilized society, and the vaccine is something you do for each other. People don’t understand the importance of breaking the chain of transmission and doing this to help each other and eradicate the spread. I just don’t understand what happened to us that we forgot this.”
A version of this article first appeared on WebMD.com.
Some patients with more severe PH in COPD may respond to treatment
Patients with pulmonary hypertension (PH) as a complication of chronic obstructive pulmonary disease (COPD) have worse functional impairment and higher mortality, compared with patients who have idiopathic pulmonary arterial hypertension (IPAH).
Despite these factors, some patients with more severe PH in COPD may respond to treatment and show clinical improvement after treatment, according to recent research published in the journal CHEST®.
Carmine Dario Vizza, MD, of the pulmonary hypertension unit, department of cardiovascular and respiratory diseases at Sapienza University of Rome, and colleagues evaluated patients in the Comparative, Prospective Registry of Newly Initiated Therapies for Pulmonary Hypertension (COMPERA) database, enrolled up to August 2020, identifying 68 patients with moderate PH and COPD and 307 patients with severe PH and COPD. The researchers compared the PH and COPD groups with 307 patients who had idiopathic pulmonary arterial hypertension.
Overall, mostly older men made up the group of patients with moderate (50%; mean, 68.5 years) and severe PH in COPD (61%; mean 68.4 years), compared with those who had IPAH (37%; mean 61.7 years. Oral monotherapy for patients with PH and COPD was the main treatment, consisting of phosphodiesterase-5 inhibitors, while most patients with IPAH received endothelin receptor antagonists.
On functional tests, patients in the PH and COPD group tended to perform poorer on the 6-minute walking distance (6MWD) and World Health Organization functional class (WHO FC) than patients with IPAH. Specifically, among 42.7% of patients in both group for whom follow-up data were available, there was a similar frequency of improvement for 6MWD of 30 meters or more from baseline for both PH and COPD and IPAH groups (46.9% vs. 52.6%; P = .294), but there were significant differences between 6MWD between patients with moderate and severe PH and COPD (51.6% vs. 31.6%; P = .04). There was a nonsignificant improvement in WHO FC improvement of one or more classes for 65.6% of patients with PH and COPD and 58.3% of patients with IPAH with follow-up data available, with 28.5% of patients with PH in COPD improving compared with 35.8% of patients with IPAH (P = .078) and nonsignificant differences between moderate and severe PH and COPD (19.0% vs. 30.4%; P = .188).
Comparing outcomes
Follow-up data were available for 84% of patients with IPAH and 94% of patients with PH and COPD. Dr. Dario Vizza and colleagues found 45.7% of patients in the PH and COPD group and 24.9% of patients in the IPAH group died during follow-up, while 1.1% in the PH and COPD group and 1.5% of patients in the IPAH group underwent lung transplantations. For patients with moderate PH and COPD, 31.3% died and none underwent lung transplantation, while 49.0% of patients in the severe PH and COPD group died and 1.4% underwent lung transplantations.
Patients in the moderate PH and COPD group were more likely to discontinue treatment (10.9%), compared with patients with IPAH (6.6%) and patients with severe PH and COPD (5.2%). The most common reasons for discontinuations were tolerability and efficacy failure; the IPAH group had 63% of patients discontinue because of tolerability and 7% for efficacy failure, 47% of patients in the severe PH and COPD group discontinued because of tolerability and efficacy, and 29% discontinued treatment for tolerability and 57% for efficacy failure in the moderate and COPD group.
The researchers said male sex, low 6MWD, and high pulmonary vascular resistance at baseline were predictive of poorer outcomes for PH and COPD, but patients with more severe PH and COPD had better outcomes if they improved by 30 meters or more in 6MWD, or improved in WHO FC after receiving medical therapy. For patients with IPAH response to therapy was better among patients who were younger, had higher WHO FC, had high diffusing capacity of the lung for carbon monoxide, had high mean pulmonary artery pressure, and had low PCO2.
“Our data suggest that PH-targeted drug therapy in patients with COPD and severe PH may improve exercise tolerance and WHO FC in a subgroup of patients and that patients with COPD and PH who respond to therapy may have a better prognosis than patients who do not show clinical improvement. These findings need to be explored further in prospective, randomized controlled clinical studies,” the authors concluded.
More research needed
In a related editorial, James R. Klinger, MD, a pulmonologist with Brown University, Providence, R.I., and the director of the Rhode Island Hospital Pulmonary Hypertension Center in East Providence, said there is a “keen interest” in treating PH in COPD despite a lack of consistency on whether treatment is effective in this patient population. About 80% of PH centers in the United States treat PH in COPD when they treat conditions like lung disease with PAH medication, he pointed out. However, he questioned whether current medications designed for PAH could improve pulmonary hemodynamics for PH in COPD.
“Reasons that the pathobiologic condition of PH-COPD may differ from PAH include the likely exposure of the pulmonary circulation to greater degrees of hypoxia and hypercapnia and the greater loss of alveolar capillaries associated with emphysema,” he said.
The study by Dr. Dario Vizza and colleagues is an attempt to evaluate treatment response for patients with PH and COPD “in a way that allows comparison with patients who have been treated with similar drugs for PAH,” Dr. Klinger said. He noted the study’s retrospective nature, lack of control group, and lack of information on lung disease severity could limit the findings.
“These limitations preclude recommendations for the routine treatment of patients with PH-COPD, but the findings suggest that, despite greater morbidity at baseline, patients with PH-COPD may be nearly as likely to benefit from PAH medications as patients with IPAH,” he said.
“What is needed now is well-designed randomized controlled studies to determine whether improved outcomes can be achieved in this population and which patients are most likely to benefit,” he concluded. “Simply put: How bad does PH need to be in patients with COPD before treatment is helpful, and how severe does COPD need to be before PH treatment is futile?”
The authors reported personal and institutional relationships in the form of grants, consultancies, advisory board memberships, speakers bureau appointments, honoraria, patents, grant and research funding, lectures, travel compensation, and steering committee positions for a variety of pharmaceutical companies, agencies, societies, journals, medical publishing companies, and other organizations. Dr. Klinger reported his institution receives grant support from Acceleron and United Therapeutics in the area of PH, and he has been an unpaid consultant for Bayer.
FROM THE JOURNAL CHEST®
FDA approves Pfizer’s tick-borne encephalitis vaccine
The U.S. Food and Drug Administration has approved Pfizer’s TicoVac vaccine for the treatment of tick-borne encephalitis (TBE). The vaccine is approved outside of the United States, and more than 170 million doses have been administered since 1976. The World Health Organization recommends vaccination for everyone in areas where the annual incidence of clinical disease is highly endemic, defined as more than five cases per 100,000 population, which is primarily the Baltic countries of Europe but includes some regions of Central and East Asia.
GlaxoSmithKline’s Encepur is also approved outside the United States, as is a vaccine from China and two from Russia. The efficacy of all the vaccines is greater than 95%. Pfizer’s protection is 98.7% to 100.0% after the three-dose course. With the new approval, American travelers will be able to get immunized before their departure instead of waiting until they are overseas to start the series.
TicoVac can cause injection-site pain, headache, myalgia, and fever, as is typical with many vaccines.
Tick-borne encephalitis
TBE is caused by a flavivirus and is transmitted by the bite of an infected Ixodes scapularis, or deer tick. Like the Powassan virus, another flavivirus, infection can be transmitted in minutes through the tick’s saliva, so early removal of the tick might not prevent illness. This is different than Lyme disease, where vigilance and early removal of the tick can prevent transmission.
Reservoirs for the virus include mice, voles, and shrews. Large mammals (deer, sheep, cattle, goats) also serve to support tick multiplication. In addition to tick bites, ingestion of unpasteurized milk from infected mammals can transmit TBE.
TBE symptoms can range from none to severe encephalitis (brain inflammation). One-quarter of infected people develop encephalitis. Most recover fully, but one-third of those infected can develop lifelong damage and paralysis or cognitive deficits. Death is rare, except in those infected with the Russian strain.
The first phase of a TBE infection is typical of viral infections, with nonspecific fever, headache, nausea, and myalgia. The next phase involves an asymptomatic interval of about a week (range, 1 to 33 days), followed by symptoms of a central nervous system infection.
There is no treatment for TBE and no antivirals with proven benefit. However, a recent case report describes the successful treatment of TBE with favipiravir.
For now, if you are unvaccinated, prevention is the only viable option. If you plan to travel to an endemic region and anticipate participating in outdoor activities (such as hunting or hiking), wear permethrin-treated clothes, use an insecticide, and don’t eat or drink unpasteurized dairy products.
Judy Stone, MD, is an infectious disease specialist and author of Resilience: One Family’s Story of Hope and Triumph Over Evil and of Conducting Clinical Research, the essential guide to the topic. You can find her at drjudystone.com or on Twitter @drjudystone.
A version of this article first appeared on Medscape.com.