User login
Vision loss may be a risk with PRP facial injections
A systematic review was recently conducted by Wu and colleagues examining the risk of blindness associated with platelet-rich plasma (PRP) injection. In dermatology, PRP is used more commonly now than 5 years ago to promote hair growth with injections on the scalp, as an adjunct to microneedling procedures, and sometimes – in a similar way to facial fillers – to improve volume loss, and skin tone and texture (particularly to the tear trough region).
Total unilateral blindness occurred in all cases. In one of the seven reported cases, the patient experienced recovery of vision after 3 months, but with some residual deficits noted on the ophthalmologist examination. In this case, the patient was evaluated and treated by an ophthalmologist within 3 hours of symptom onset.

In addition, four cases were reported from Venezuela, one from the United States, one from the United Kingdom, and one from Malaysia. Similar to reports of blindness with facial fillers, the most common injection site reported with this adverse effect was the glabella (five cases);
Other reports involved injections of the forehead (two), followed by the nasolabial fold (one), lateral canthus (one), and temporomandibular joint (one). Two of the seven patients received injections at more than one site, resulting in the total number of injections reported (10) being higher than the number of patients.
The risk of blindness is inherent with deep injection into a vessel that anastomoses with the blood supply to the eye. No mention was made as to whether PRP or platelet-rich fibrin was used. Other details are lacking from the original articles as to injection technique and whether or not cannula injection was used. No treatment was attempted in four of seven cases.
As plasma is native to the arteries and dissolves in the blood stream naturally, the mechanism as to why retinal artery occlusion or blindness would occur is not completely clear. One theory is that it is volume related and results from the speed of injection, causing a large rapid bolus that temporarily occludes or compresses an involved vessel.
Another theory is that damage to the vessel results from the injection itself or injection technique, leading to a clotting cascade and clot of the involved vessel with subsequent retrograde flow or blockade of the retinal artery. But if this were the case, we would expect to hear about more cases of clots leading to vascular occlusion or skin necrosis, which does not typically occur or we do not hear about.
Details about proper collection materials and technique or mixing with some other materials are also unknown in these cases, thus leaving the possibility that a more occlusive material may have been injected, as opposed to the fluid-like composition of the typical PRP preparation.With regards to risk with scalp PRP injection, the frontal scalp does receive blood supply from the supratrochlear artery that anastomoses with the angular artery of the face – both of which anastomose with the retinal artery (where occlusion would occur via back flow). The scalp tributaries are small and far enough away from the retina at that point that risk of back flow the to retinal artery should be minimal. Additionally, no reports of vascular occlusion from PRP scalp injection leading to skin necrosis have ever been reported. Of note, this is also not a risk that has been reported with the use of PRP with microneedling procedures, where PRP is placed on top of the skin before, during and after microneedling.
Anything that occludes the blood supply to the eye, whether it be fat, filler, or PRP, has an inherent risk of blindness. As there is no reversal agent or designated treatment for PRP occlusion, care must be taken to minimize risk, including awareness of anatomy and avoidance of injection into high risk areas, and cannula use where appropriate. Gentle, slow, low-volume administration, and when possible, use of a retrograde injection technique, may also be helpful.
Dr. Wesley and Lily Talakoub, MD, are cocontributors to this column. Dr. Wesley practices dermatology in Beverly Hills, Calif. Dr. Talakoub is in private practice in McLean, Va. This month’s column is by Dr. Wesley. Write to them at [email protected]. They had no relevant disclosures.
A systematic review was recently conducted by Wu and colleagues examining the risk of blindness associated with platelet-rich plasma (PRP) injection. In dermatology, PRP is used more commonly now than 5 years ago to promote hair growth with injections on the scalp, as an adjunct to microneedling procedures, and sometimes – in a similar way to facial fillers – to improve volume loss, and skin tone and texture (particularly to the tear trough region).
Total unilateral blindness occurred in all cases. In one of the seven reported cases, the patient experienced recovery of vision after 3 months, but with some residual deficits noted on the ophthalmologist examination. In this case, the patient was evaluated and treated by an ophthalmologist within 3 hours of symptom onset.
In addition, four cases were reported from Venezuela, one from the United States, one from the United Kingdom, and one from Malaysia. Similar to reports of blindness with facial fillers, the most common injection site reported with this adverse effect was the glabella (five cases);
Other reports involved injections of the forehead (two), followed by the nasolabial fold (one), lateral canthus (one), and temporomandibular joint (one). Two of the seven patients received injections at more than one site, resulting in the total number of injections reported (10) being higher than the number of patients.
The risk of blindness is inherent with deep injection into a vessel that anastomoses with the blood supply to the eye. No mention was made as to whether PRP or platelet-rich fibrin was used. Other details are lacking from the original articles as to injection technique and whether or not cannula injection was used. No treatment was attempted in four of seven cases.
As plasma is native to the arteries and dissolves in the blood stream naturally, the mechanism as to why retinal artery occlusion or blindness would occur is not completely clear. One theory is that it is volume related and results from the speed of injection, causing a large rapid bolus that temporarily occludes or compresses an involved vessel.
Another theory is that damage to the vessel results from the injection itself or injection technique, leading to a clotting cascade and clot of the involved vessel with subsequent retrograde flow or blockade of the retinal artery. But if this were the case, we would expect to hear about more cases of clots leading to vascular occlusion or skin necrosis, which does not typically occur or we do not hear about.
Details about proper collection materials and technique or mixing with some other materials are also unknown in these cases, thus leaving the possibility that a more occlusive material may have been injected, as opposed to the fluid-like composition of the typical PRP preparation.With regards to risk with scalp PRP injection, the frontal scalp does receive blood supply from the supratrochlear artery that anastomoses with the angular artery of the face – both of which anastomose with the retinal artery (where occlusion would occur via back flow). The scalp tributaries are small and far enough away from the retina at that point that risk of back flow the to retinal artery should be minimal. Additionally, no reports of vascular occlusion from PRP scalp injection leading to skin necrosis have ever been reported. Of note, this is also not a risk that has been reported with the use of PRP with microneedling procedures, where PRP is placed on top of the skin before, during and after microneedling.
Anything that occludes the blood supply to the eye, whether it be fat, filler, or PRP, has an inherent risk of blindness. As there is no reversal agent or designated treatment for PRP occlusion, care must be taken to minimize risk, including awareness of anatomy and avoidance of injection into high risk areas, and cannula use where appropriate. Gentle, slow, low-volume administration, and when possible, use of a retrograde injection technique, may also be helpful.
Dr. Wesley and Lily Talakoub, MD, are cocontributors to this column. Dr. Wesley practices dermatology in Beverly Hills, Calif. Dr. Talakoub is in private practice in McLean, Va. This month’s column is by Dr. Wesley. Write to them at [email protected]. They had no relevant disclosures.
Atypical Localized Scleroderma Development During Nivolumab Therapy for Metastatic Lung Adenocarcinoma
To the Editor:
Immune checkpoint inhibitors such as anti–programmed cell death protein 1 (anti–PD-1) and anticytotoxic T lymphocyte–associated protein 4 therapies are a promising class of cancer therapeutics. However, they are associated with a variety of immune-related adverse events (irAEs), including cutaneous toxicity.1 The PD-1/programmed death ligand 1 (PD-L1) pathway is important for the maintenance of immune tolerance, and a blockade has been shown to lead to development of various autoimmune diseases.2 We present the case of a patient who developed new-onset localized scleroderma during treatment with the PD-1 inhibitor nivolumab.
A 65-year-old woman presented with a rash on the left thigh that was associated with pruritus, pain, and a pulling sensation. She had a history of stage IV lung adenocarcinoma, with a mass in the right upper lobe with metastatic foci to the left femur, right humerus, right hilar, and pretracheal lymph nodes. She received palliative radiation to the left femur and was started on carboplatin and pemetrexed. Metastasis to the liver was noted after completion of 6 cycles of therapy, and the patient’s treatment was changed to nivolumab. After 17 months on nivolumab therapy (2 years after initial diagnosis and 20 months after radiation therapy), she presented to our dermatology clinic with a cutaneous eruption on the buttocks that spread to the left thigh. The rash failed to improve after 1 month of treatment with emollients and triamcinolone cream 0.1%.
At the current presentation, which was 2 months after she initially presented to our clinic, dermatologic examination revealed erythematous and sclerotic plaques on the left lateral thigh (Figure 1A). Betamethasone cream 0.05% was prescribed, and nivolumab was discontinued due to progression of cutaneous symptoms. A punch biopsy from the left thigh demonstrated superficial dermal sclerosis that was suggestive of chronic radiation dermatitis; direct immunofluorescence testing was negative. The patient was started on prednisone 50 mg daily, which resulted in mild improvement in symptoms.

Within 6 months, new sclerotic plaques developed on the patient’s back and right thigh (Figure 1B). Because the lesions were located outside the radiation field of the left femur, a second biopsy was obtained from the right thigh. Histopathology revealed extensive dermal sclerosis and a perivascular lymphoplasmacytic infiltrate (Figure 2). An antinuclear antibody test was weakly positive (1:40, nucleolar pattern) with a negative extractable nuclear antigen panel result. Anti–double-stranded DNA, anti–topoisomerase 1, anti-Smith, antiribonucleoprotein, anti–Sjögren syndrome type A, anti–Sjögren syndrome type B, and anticentromere serology test results were negative. The patient denied decreased oral aperture, difficulty swallowing, or Raynaud phenomenon. Due to the atypical clinical presentation in the setting of PD-1 inhibitor therapy, the etiology of the eruption was potentially attributable to nivolumab. She was started on treatment with methotrexate 20 mg weekly and clobetasol cream 0.05% twice daily; she continued taking prednisone 5 mg daily. The cutaneous manifestations on the patient’s back completely resolved, and the legs continued to gradually improve on this regimen. Immunotherapy continued to be held due to skin toxicity.
 extending into the subcutaneous tissue with a perivascular lymphoplasmacytic infiltrate (H&E, original magnification ×40 [inset, original magn")
Localized scleroderma is an autoimmune disorder characterized by inflammation and skin thickening. Overactive fibroblasts produce excess collagen, leading to the clinical symptoms of skin thickening, hardening, and discoloration.3 Lesions frequently develop on the arms, face, or legs and can present as patches or linear bands. Unlike systemic sclerosis, the internal organs typically are uninvolved; however, sclerotic lesions can be disfiguring and cause notable disability if they impede joint movement.
The PD-1/PD-L1 pathway is a negative regulator of the immune response that inactivates T cells and helps maintain self-tolerance. Modulation of the PD-1/PD-L1 pathway and overexpression of PD-L1 are seen in various cancers as a mechanism to help malignant cells avoid immune destruction.4 Conversely, inhibition of this pathway can be used to stimulate an antitumor immune response. This checkpoint inhibition strategy has been highly successful for the treatment of various cancers including melanoma and non–small cell lung carcinoma. There are several checkpoint inhibitors approved in the United States that are used for cancer therapy and target the PD-1/PD-L1 pathway, such as nivolumab, pembrolizumab, atezolizumab, durvalumab, and avelumab.4 A downside of checkpoint inhibitor treatment is that uncontrolled T-cell activation can lead to irAEs, including cutaneous eruptions, pruritus, diarrhea, colitis, hepatitis, endocrinopathies, pneumonitis, and renal insufficiency.5 These toxicities are reversible if treated appropriately but can cause notable morbidity and mortality if left unrecognized. Cutaneous eruption is one of the most common irAEs associated with anti–PD-1 and anti–PD-L1 therapies and can limit therapeutic efficacy, as the drug may need to be held or discontinued due to the severity of the eruption.6 Mid-potency to high-potency topical corticosteroids and systemic antihistamines are first-line treatments of grades 1 and 2 skin toxicities associated with PD-1 inhibitor therapy. For eruptions classified as grades 3 or 4 or refractory grade 2, discontinuation of the drug and systemic corticosteroids is recommended.7
The cutaneous eruption in immunotherapy-mediated dermatitis is thought to be largely mediated by activated T cells infiltrating the dermis.8 In localized scleroderma, increased tumor necrosis factor α, IFN-γ, IFN-γ–induced protein 10, and granulocyte macrophage colony stimulating factor activity have been shown to correlate with disease activity.9,10 Interestingly, increased tumor necrosis factor α and IFN-γ correlate with better response and increased overall survival in PD-1 inhibition therapy, suggesting a correlation between PD-1 inhibition and T helper activation as noted by the etiology of sclerosis in our patient.11 Additionally, history of radiation was a confounding factor in the diagnosis of our patient, as both sclerodermoid reactions and chronic radiation dermatitis can present with dermal sclerosis. However, the progression of disease outside of the radiation field excluded this etiology. Although new-onset sclerodermoid reactions have been reported with PD-1 inhibitors, they have been described secondary to sclerodermoid reactions from treatment with pembrolizumab.12,13 One case series reported a case of diffuse sclerodermoid reaction and a limited reaction in response to pembrolizumab treatment, while another case report described a relapse of generalized morphea in response to pembrolizumab treatment.12,13 One case of relapsing morphea in response to nivolumab treatment for stage IV lung adenocarcinoma also has been reported.14
Cutaneous toxicities are one of the most common irAEs associated with checkpoint inhibitors and are seen in more than one-third of treated patients. Most frequently, these irAEs manifest as spongiotic dermatitis on histopathology, but a broad spectrum of cutaneous reactions have been observed.15 Although sclerodermoid reactions have been reported with PD-1 inhibitors, most are described secondary to sclerodermoid reactions with pembrolizumab and involve relapse of previously diagnosed morphea rather than new-onset disease.12-14
Our case highlights new-onset localized scleroderma in the setting of nivolumab therapy that showed clinical improvement with methotrexate and topical and systemic steroids. This reaction pattern should be considered in all patients who develop cutaneous eruptions when treated with a PD-1 inhibitor. There should be a high index of suspicion for the potential occurrence of irAEs to ensure early recognition and treatment to minimize morbidity and maximize adherence to therapy for the underlying malignancy.
- Baxi S, Yang A, Gennarelli RL, et al. Immune-related adverse events for anti-PD-1 and anti-PD-L1 drugs: systematic review and meta-analysis. BMJ. 2018;360:k793.
- Dai S, Jia R, Zhang X, et al. The PD-1/PD-Ls pathway and autoimmune diseases. Cell Immunol. 2014;290:72-79.
- Badea I, Taylor M, Rosenberg A, et al. Pathogenesis and therapeutic approaches for improved topical treatment in localized scleroderma and systemic sclerosis. Rheumatology (Oxford). 2009;48:213-221.
- Constantinidou A, Alifieris C, Trafalis DT. Targeting programmed cell death-1 (PD-1) and ligand (PD-L1): a new era in cancer active immunotherapy. Pharmacol Ther. 2019;194:84-106.
- Villadolid J, Asim A. Immune checkpoint inhibitors in clinical practice: update on management of immune-related toxicities. Transl Lung Cancer Res. 2015;4:560-575.
- Naidoo J, Page DB, Li BT, et al. Toxicities of the anti-PD-1 and anti-PD-L1 immune checkpoint antibodies. Ann Oncol. 2016;27:1362.
- O’Kane GM, Labbé C, Doherty MK, et al. Monitoring and management of immune-related adverse events associated with programmed cell death protein-1 axis inhibitors in lung cancer. Oncologist. 2017;22:70-80.
- Shi VJ, Rodic N, Gettinger S, et al. Clinical and histologic features of lichenoid mucocutaneous eruptions due to anti-programmed celldeath 1 and anti-programmed cell death ligand 1 immunotherapy. JAMA Dermatol. 2016;152:1128-1136.
- Torok KS, Kurzinski K, Kelsey C, et al. Peripheral blood cytokine and chemokine profiles in juvenile localized scleroderma: T-helper cell-associated cytokine profiles. Semin Arthritis Rheum. 2015;45:284-293.
- Guo X, Higgs BW, Bay-Jensen AC, et al. Suppression of T cell activation and collagen accumulation by an anti-IFNAR1 mAb, anifrolumab, in adult patients with systemic sclerosis. J Invest Dermatol. 2015;135:2402-2409.
- Boutsikou E, Domvri K, Hardavella G, et al. Tumor necrosis factor, interferon-gamma and interleukins as predictive markers of antiprogrammed cell-death protein-1 treatment in advanced non-small cell lung cancer: a pragmatic approach in clinical practice. Ther Adv Med Oncol. 2018;10:1758835918768238.
- Barbosa NS, Wetter DA, Wieland CN, et al. Scleroderma induced by pembrolizumab: a case series. Mayo Clin Proc. 2017;92:1158-1163.
- Cheng MW, Hisaw LD, Bernet L. Generalized morphea in the setting of pembrolizumab. Int J Dermatol. 2019;58:736-738.
- Alegre-Sánchez A, Fonda-Pascual P, Saceda-Corralo D, et al. Relapse of morphea during nivolumab therapy for lung adenocarcinoma. Actas Dermosifiliogr. 2017;108:69-70.
- Sibaud V. Dermatologic reactions to immune checkpoint inhibitors: skin toxicities and immunotherapy. Am J Clin Dermatol. 2018;19:345-361.
To the Editor:
Immune checkpoint inhibitors such as anti–programmed cell death protein 1 (anti–PD-1) and anticytotoxic T lymphocyte–associated protein 4 therapies are a promising class of cancer therapeutics. However, they are associated with a variety of immune-related adverse events (irAEs), including cutaneous toxicity.1 The PD-1/programmed death ligand 1 (PD-L1) pathway is important for the maintenance of immune tolerance, and a blockade has been shown to lead to development of various autoimmune diseases.2 We present the case of a patient who developed new-onset localized scleroderma during treatment with the PD-1 inhibitor nivolumab.
A 65-year-old woman presented with a rash on the left thigh that was associated with pruritus, pain, and a pulling sensation. She had a history of stage IV lung adenocarcinoma, with a mass in the right upper lobe with metastatic foci to the left femur, right humerus, right hilar, and pretracheal lymph nodes. She received palliative radiation to the left femur and was started on carboplatin and pemetrexed. Metastasis to the liver was noted after completion of 6 cycles of therapy, and the patient’s treatment was changed to nivolumab. After 17 months on nivolumab therapy (2 years after initial diagnosis and 20 months after radiation therapy), she presented to our dermatology clinic with a cutaneous eruption on the buttocks that spread to the left thigh. The rash failed to improve after 1 month of treatment with emollients and triamcinolone cream 0.1%.
At the current presentation, which was 2 months after she initially presented to our clinic, dermatologic examination revealed erythematous and sclerotic plaques on the left lateral thigh (Figure 1A). Betamethasone cream 0.05% was prescribed, and nivolumab was discontinued due to progression of cutaneous symptoms. A punch biopsy from the left thigh demonstrated superficial dermal sclerosis that was suggestive of chronic radiation dermatitis; direct immunofluorescence testing was negative. The patient was started on prednisone 50 mg daily, which resulted in mild improvement in symptoms.
Within 6 months, new sclerotic plaques developed on the patient’s back and right thigh (Figure 1B). Because the lesions were located outside the radiation field of the left femur, a second biopsy was obtained from the right thigh. Histopathology revealed extensive dermal sclerosis and a perivascular lymphoplasmacytic infiltrate (Figure 2). An antinuclear antibody test was weakly positive (1:40, nucleolar pattern) with a negative extractable nuclear antigen panel result. Anti–double-stranded DNA, anti–topoisomerase 1, anti-Smith, antiribonucleoprotein, anti–Sjögren syndrome type A, anti–Sjögren syndrome type B, and anticentromere serology test results were negative. The patient denied decreased oral aperture, difficulty swallowing, or Raynaud phenomenon. Due to the atypical clinical presentation in the setting of PD-1 inhibitor therapy, the etiology of the eruption was potentially attributable to nivolumab. She was started on treatment with methotrexate 20 mg weekly and clobetasol cream 0.05% twice daily; she continued taking prednisone 5 mg daily. The cutaneous manifestations on the patient’s back completely resolved, and the legs continued to gradually improve on this regimen. Immunotherapy continued to be held due to skin toxicity.
Localized scleroderma is an autoimmune disorder characterized by inflammation and skin thickening. Overactive fibroblasts produce excess collagen, leading to the clinical symptoms of skin thickening, hardening, and discoloration.3 Lesions frequently develop on the arms, face, or legs and can present as patches or linear bands. Unlike systemic sclerosis, the internal organs typically are uninvolved; however, sclerotic lesions can be disfiguring and cause notable disability if they impede joint movement.
The PD-1/PD-L1 pathway is a negative regulator of the immune response that inactivates T cells and helps maintain self-tolerance. Modulation of the PD-1/PD-L1 pathway and overexpression of PD-L1 are seen in various cancers as a mechanism to help malignant cells avoid immune destruction.4 Conversely, inhibition of this pathway can be used to stimulate an antitumor immune response. This checkpoint inhibition strategy has been highly successful for the treatment of various cancers including melanoma and non–small cell lung carcinoma. There are several checkpoint inhibitors approved in the United States that are used for cancer therapy and target the PD-1/PD-L1 pathway, such as nivolumab, pembrolizumab, atezolizumab, durvalumab, and avelumab.4 A downside of checkpoint inhibitor treatment is that uncontrolled T-cell activation can lead to irAEs, including cutaneous eruptions, pruritus, diarrhea, colitis, hepatitis, endocrinopathies, pneumonitis, and renal insufficiency.5 These toxicities are reversible if treated appropriately but can cause notable morbidity and mortality if left unrecognized. Cutaneous eruption is one of the most common irAEs associated with anti–PD-1 and anti–PD-L1 therapies and can limit therapeutic efficacy, as the drug may need to be held or discontinued due to the severity of the eruption.6 Mid-potency to high-potency topical corticosteroids and systemic antihistamines are first-line treatments of grades 1 and 2 skin toxicities associated with PD-1 inhibitor therapy. For eruptions classified as grades 3 or 4 or refractory grade 2, discontinuation of the drug and systemic corticosteroids is recommended.7
The cutaneous eruption in immunotherapy-mediated dermatitis is thought to be largely mediated by activated T cells infiltrating the dermis.8 In localized scleroderma, increased tumor necrosis factor α, IFN-γ, IFN-γ–induced protein 10, and granulocyte macrophage colony stimulating factor activity have been shown to correlate with disease activity.9,10 Interestingly, increased tumor necrosis factor α and IFN-γ correlate with better response and increased overall survival in PD-1 inhibition therapy, suggesting a correlation between PD-1 inhibition and T helper activation as noted by the etiology of sclerosis in our patient.11 Additionally, history of radiation was a confounding factor in the diagnosis of our patient, as both sclerodermoid reactions and chronic radiation dermatitis can present with dermal sclerosis. However, the progression of disease outside of the radiation field excluded this etiology. Although new-onset sclerodermoid reactions have been reported with PD-1 inhibitors, they have been described secondary to sclerodermoid reactions from treatment with pembrolizumab.12,13 One case series reported a case of diffuse sclerodermoid reaction and a limited reaction in response to pembrolizumab treatment, while another case report described a relapse of generalized morphea in response to pembrolizumab treatment.12,13 One case of relapsing morphea in response to nivolumab treatment for stage IV lung adenocarcinoma also has been reported.14
Cutaneous toxicities are one of the most common irAEs associated with checkpoint inhibitors and are seen in more than one-third of treated patients. Most frequently, these irAEs manifest as spongiotic dermatitis on histopathology, but a broad spectrum of cutaneous reactions have been observed.15 Although sclerodermoid reactions have been reported with PD-1 inhibitors, most are described secondary to sclerodermoid reactions with pembrolizumab and involve relapse of previously diagnosed morphea rather than new-onset disease.12-14
Our case highlights new-onset localized scleroderma in the setting of nivolumab therapy that showed clinical improvement with methotrexate and topical and systemic steroids. This reaction pattern should be considered in all patients who develop cutaneous eruptions when treated with a PD-1 inhibitor. There should be a high index of suspicion for the potential occurrence of irAEs to ensure early recognition and treatment to minimize morbidity and maximize adherence to therapy for the underlying malignancy.
- Baxi S, Yang A, Gennarelli RL, et al. Immune-related adverse events for anti-PD-1 and anti-PD-L1 drugs: systematic review and meta-analysis. BMJ. 2018;360:k793.
- Dai S, Jia R, Zhang X, et al. The PD-1/PD-Ls pathway and autoimmune diseases. Cell Immunol. 2014;290:72-79.
- Badea I, Taylor M, Rosenberg A, et al. Pathogenesis and therapeutic approaches for improved topical treatment in localized scleroderma and systemic sclerosis. Rheumatology (Oxford). 2009;48:213-221.
- Constantinidou A, Alifieris C, Trafalis DT. Targeting programmed cell death-1 (PD-1) and ligand (PD-L1): a new era in cancer active immunotherapy. Pharmacol Ther. 2019;194:84-106.
- Villadolid J, Asim A. Immune checkpoint inhibitors in clinical practice: update on management of immune-related toxicities. Transl Lung Cancer Res. 2015;4:560-575.
- Naidoo J, Page DB, Li BT, et al. Toxicities of the anti-PD-1 and anti-PD-L1 immune checkpoint antibodies. Ann Oncol. 2016;27:1362.
- O’Kane GM, Labbé C, Doherty MK, et al. Monitoring and management of immune-related adverse events associated with programmed cell death protein-1 axis inhibitors in lung cancer. Oncologist. 2017;22:70-80.
- Shi VJ, Rodic N, Gettinger S, et al. Clinical and histologic features of lichenoid mucocutaneous eruptions due to anti-programmed celldeath 1 and anti-programmed cell death ligand 1 immunotherapy. JAMA Dermatol. 2016;152:1128-1136.
- Torok KS, Kurzinski K, Kelsey C, et al. Peripheral blood cytokine and chemokine profiles in juvenile localized scleroderma: T-helper cell-associated cytokine profiles. Semin Arthritis Rheum. 2015;45:284-293.
- Guo X, Higgs BW, Bay-Jensen AC, et al. Suppression of T cell activation and collagen accumulation by an anti-IFNAR1 mAb, anifrolumab, in adult patients with systemic sclerosis. J Invest Dermatol. 2015;135:2402-2409.
- Boutsikou E, Domvri K, Hardavella G, et al. Tumor necrosis factor, interferon-gamma and interleukins as predictive markers of antiprogrammed cell-death protein-1 treatment in advanced non-small cell lung cancer: a pragmatic approach in clinical practice. Ther Adv Med Oncol. 2018;10:1758835918768238.
- Barbosa NS, Wetter DA, Wieland CN, et al. Scleroderma induced by pembrolizumab: a case series. Mayo Clin Proc. 2017;92:1158-1163.
- Cheng MW, Hisaw LD, Bernet L. Generalized morphea in the setting of pembrolizumab. Int J Dermatol. 2019;58:736-738.
- Alegre-Sánchez A, Fonda-Pascual P, Saceda-Corralo D, et al. Relapse of morphea during nivolumab therapy for lung adenocarcinoma. Actas Dermosifiliogr. 2017;108:69-70.
- Sibaud V. Dermatologic reactions to immune checkpoint inhibitors: skin toxicities and immunotherapy. Am J Clin Dermatol. 2018;19:345-361.
Practice Points
- Immune checkpoint inhibitors such as nivolumab, a programmed cell death protein 1 (PD-1) inhibitor, are associated with immune-related adverse events (irAEs) such as skin toxicity.
- Scleroderma should be considered in the differential diagnosis of patients who develop cutaneous eruptions during treatment with PD-1 inhibitors.
- To ensure prompt recognition and treatment, health care providers should maintain a high index of suspicion for development of cutaneous irAEs in patients using checkpoint inhibitors.

Transitioning From an Intern to a Dermatology Resident
The transition from medical school to residency is a rewarding milestone but involves a steep learning curve wrought with new responsibilities, new colleagues, and a new schedule, often all within a new setting. This transition period has been a longstanding focus of graduate medical education research, and a recent study identified 6 key areas that residency programs need to address to better facilitate this transition: (1) a sense of community within the residency program, (2) relocation resources, (3) residency preparation courses in medical school, (4) readiness to address racism and bias, (5) connecting with peers, and (6) open communication with program leadership.1 There is considerable interest in ensuring that this transition is smooth for all graduates, as nearly all US medical schools feature some variety of a residency preparation course during the fourth year of medical school, which, alongside the subinternships, serves to better prepare their graduates for the healthcare workforce.2
What about the transition from intern to dermatology resident? Near the end of intern year, my categorical medicine colleagues experienced a crescendo of responsibilities, all in preparation for junior year. The senior medicine residents, themselves having previously experienced the graduated responsibilities, knew to ease their grip on the reins and provide the late spring interns an opportunity to lead rounds or run a code. This was not the case for the preliminary interns for whom there was no preview available for what was to come; little guidance exists on how to best transform from a preliminary or transitional postgraduate year (PGY) 1 to a dermatology PGY-2. A survey of 44 dermatology residents and 33 dermatology program directors found electives such as rheumatology, infectious diseases, and allergy and immunology to be helpful for this transition, and residents most often cited friendly and supportive senior and fellow residents as the factor that eased their transition to PGY-2.3 Notably, less than half of the residents (40%) surveyed stated that team-building exercises and dedicated time to meet colleagues were helpful for this transition. They identified studying principles of dermatologic disease, learning new clinical duties, and adjusting to new coworkers and supervisors as the greatest work-related stressors during entry to PGY-2.3
My transition from intern year to dermatology was shrouded in uncertainty, and I was fortunate to have supportive seniors and co-residents to ease the process. There is much about starting dermatology residency that cannot be prepared for by reading a book, and a natural metamorphosis into the new role is hard to articulate. Still, the following are pieces of information I wish I knew as a graduating intern, which I hope will prove useful for those graduating to their PGY-2 dermatology year.
The Pace of Outpatient Dermatology
If the preliminary or transitional year did not have an ambulatory component, the switch from wards to clinic can be jarring. An outpatient encounter can be as short as 10 to 15 minutes, necessitating an efficient interview and examination to avoid a backup of patients. Unlike a hospital admission where the history of present illness can expound on multiple concerns and organ systems, the general dermatology visit must focus on the chief concern, with priority given to the clinical examination of the skin. For total-body skin examinations, a formulaic approach to assessing all areas of the body, with fluent transitions and minimal repositioning of the patient, is critical for patient comfort and to save time. Of course, accuracy and thoroughness are paramount, but the constant mindfulness of time and efficiency is uniquely emphasized in the outpatient setting.
Continuity of Care
On the wards, patients are admitted with an acute problem and discharged with the aim to prevent re-admission. However, in the dermatology clinic, the conditions encountered often are chronic, requiring repeated follow-ups that involve dosage tapers, laboratory monitoring, and trial and error. Unlike the rigid algorithm-based treatments utilized in the inpatient setting, the management of the same chronic disease can vary, as it is tailored to the patient based on their comorbidities and response. This longitudinal relationship with patients, whereby many disorders are managed rather than treated, stands in stark contrast to inpatient medicine, and learning to value symptom management rather than focusing on a cure is critical in a largely outpatient specialty such as dermatology.
Consulter to Consultant
Calling a consultation as an intern is challenging and requires succinct delivery of pertinent information while fearing pushback from the consultant. In a survey of 50 hospitalist attendings, only 11% responded that interns could be entrusted to call an effective consultation without supervision.4 When undertaking the role of a consultant, the goals should be to identify the team’s main question and to obtain key information necessary to formulate a differential diagnosis. The quality of the consultation will inevitably fluctuate; try to remember what it was like for you as a member of the primary team and remain patient and courteous during the exchange.5 In 1983, Goldman et al6 published a guideline on effective consultations that often is cited to this day, dubbed the “Ten Commandments for Effective Consultations,” which consists of the following: (1) determine the question that is being asked, (2) establish the urgency of the consultation, (3) gather primary data, (4) communicate as briefly as appropriate, (5) make specific recommendations, (6) provide contingency plans, (7) understand your own role in the process, (8) offer educational information, (9) communicate recommendations directly to the requesting physician, and (10) provide appropriate follow-up.
Consider Your Future
Frequently reflect on what you most enjoy about your job. Although it can be easy to passively engage with intern year as a mere stepping-stone to dermatology residency, the years in PGY-2 and onward require active introspection to find a future niche. What made you gravitate to the specialty of dermatology? Try to identify your predilections for dermatopathology, pediatric dermatology, dermatologic surgery, cosmetic dermatology, and academia. Be consistently cognizant of your life after residency, as some fellowships such as dermatopathology require applications to be submitted at the conclusion of the PGY-2 year. Seek out faculty mentors or alumni who are walking a path similar to the one you want to embark on, as the next stop after graduation may be your forever job.
Depth, Not Breadth
The practice of medicine changes when narrowing the focus to one organ system. In both medical school and intern year, my study habits and history-taking of patients cast a wide net across multiple organ systems, aiming to know just enough about any one specialty to address all chief concerns and to know when it was appropriate to consult a specialist. This paradigm inevitably shifts in dermatology residency, as residents are tasked with memorizing the endless number of diagnoses of the skin alone, comprehending the many shades of “erythematous,” including pink, salmon, red, and purple. Both on the wards and in clinics, I had to grow comfortable with telling patients that I did not have an answer for many of their nondermatologic concerns and directing them to the right specialist. As medicine continues trending to specialization, subspecialization, and sub-subspecialization, the scope of any given physician likely will continue to narrow,7 as evidenced by specialty clinics within dermatology such as those focusing on hair loss or immunobullous disease. In this health care system, it is imperative to remember that you are only one physician within a team of care providers—understand your own role in the process and become comfortable with not having the answer to all the questions.
Final Thoughts
In a study of 44 dermatology residents, 35 (83%) indicated zero to less than 1 hour per week of independent preparation for dermatology residency during PGY-1.3 Although the usefulness of preparing is debatable, this figure likely reflects the absence of any insight on how to best prepare for the transition. Recognizing the many contrasts between internal medicine and dermatology and embracing the changes will enable a seamless promotion from a medicine PGY-1 to a dermatology PGY-2.
- Staples H, Frank S, Mullen M, et al. Improving the medical school to residency transition: narrative experiences from first-year residents.J Surg Educ. 2022;S1931-7204(22)00146-5. doi:10.1016/j.jsurg.2022.06.001
- Heidemann LA, Walford E, Mack J, et al. Is there a role for internal medicine residency preparation courses in the fourth year curriculum? a single-center experience. J Gen Intern Med. 2018;33:2048-2050.
- Hopkins C, Jalali O, Guffey D, et al. A survey of dermatology residents and program directors assessing the transition to dermatology residency. Proc (Bayl Univ Med Cent). 2020;34:59-62.
- Marcus CH, Winn AS, Sectish TC, et al. How much supervision is required is the beginning of intern year? Acad Pediatr. 2016;16:E3-E4.
- Bly RA, Bly EG. Consult courtesy. J Grad Med Educ. 2013;5:533-534.
- Goldman L, Lee T, Rudd P. Ten commandments for effective consultations. Arch Intern Med. 1983;143:1753-1755.
- Oren O, Gersh BJ, Bhatt DL. On the pearls and perils of sub-subspecialization. Am J Med. 2020;133:158-159.
The transition from medical school to residency is a rewarding milestone but involves a steep learning curve wrought with new responsibilities, new colleagues, and a new schedule, often all within a new setting. This transition period has been a longstanding focus of graduate medical education research, and a recent study identified 6 key areas that residency programs need to address to better facilitate this transition: (1) a sense of community within the residency program, (2) relocation resources, (3) residency preparation courses in medical school, (4) readiness to address racism and bias, (5) connecting with peers, and (6) open communication with program leadership.1 There is considerable interest in ensuring that this transition is smooth for all graduates, as nearly all US medical schools feature some variety of a residency preparation course during the fourth year of medical school, which, alongside the subinternships, serves to better prepare their graduates for the healthcare workforce.2
What about the transition from intern to dermatology resident? Near the end of intern year, my categorical medicine colleagues experienced a crescendo of responsibilities, all in preparation for junior year. The senior medicine residents, themselves having previously experienced the graduated responsibilities, knew to ease their grip on the reins and provide the late spring interns an opportunity to lead rounds or run a code. This was not the case for the preliminary interns for whom there was no preview available for what was to come; little guidance exists on how to best transform from a preliminary or transitional postgraduate year (PGY) 1 to a dermatology PGY-2. A survey of 44 dermatology residents and 33 dermatology program directors found electives such as rheumatology, infectious diseases, and allergy and immunology to be helpful for this transition, and residents most often cited friendly and supportive senior and fellow residents as the factor that eased their transition to PGY-2.3 Notably, less than half of the residents (40%) surveyed stated that team-building exercises and dedicated time to meet colleagues were helpful for this transition. They identified studying principles of dermatologic disease, learning new clinical duties, and adjusting to new coworkers and supervisors as the greatest work-related stressors during entry to PGY-2.3
My transition from intern year to dermatology was shrouded in uncertainty, and I was fortunate to have supportive seniors and co-residents to ease the process. There is much about starting dermatology residency that cannot be prepared for by reading a book, and a natural metamorphosis into the new role is hard to articulate. Still, the following are pieces of information I wish I knew as a graduating intern, which I hope will prove useful for those graduating to their PGY-2 dermatology year.
The Pace of Outpatient Dermatology
If the preliminary or transitional year did not have an ambulatory component, the switch from wards to clinic can be jarring. An outpatient encounter can be as short as 10 to 15 minutes, necessitating an efficient interview and examination to avoid a backup of patients. Unlike a hospital admission where the history of present illness can expound on multiple concerns and organ systems, the general dermatology visit must focus on the chief concern, with priority given to the clinical examination of the skin. For total-body skin examinations, a formulaic approach to assessing all areas of the body, with fluent transitions and minimal repositioning of the patient, is critical for patient comfort and to save time. Of course, accuracy and thoroughness are paramount, but the constant mindfulness of time and efficiency is uniquely emphasized in the outpatient setting.
Continuity of Care
On the wards, patients are admitted with an acute problem and discharged with the aim to prevent re-admission. However, in the dermatology clinic, the conditions encountered often are chronic, requiring repeated follow-ups that involve dosage tapers, laboratory monitoring, and trial and error. Unlike the rigid algorithm-based treatments utilized in the inpatient setting, the management of the same chronic disease can vary, as it is tailored to the patient based on their comorbidities and response. This longitudinal relationship with patients, whereby many disorders are managed rather than treated, stands in stark contrast to inpatient medicine, and learning to value symptom management rather than focusing on a cure is critical in a largely outpatient specialty such as dermatology.
Consulter to Consultant
Calling a consultation as an intern is challenging and requires succinct delivery of pertinent information while fearing pushback from the consultant. In a survey of 50 hospitalist attendings, only 11% responded that interns could be entrusted to call an effective consultation without supervision.4 When undertaking the role of a consultant, the goals should be to identify the team’s main question and to obtain key information necessary to formulate a differential diagnosis. The quality of the consultation will inevitably fluctuate; try to remember what it was like for you as a member of the primary team and remain patient and courteous during the exchange.5 In 1983, Goldman et al6 published a guideline on effective consultations that often is cited to this day, dubbed the “Ten Commandments for Effective Consultations,” which consists of the following: (1) determine the question that is being asked, (2) establish the urgency of the consultation, (3) gather primary data, (4) communicate as briefly as appropriate, (5) make specific recommendations, (6) provide contingency plans, (7) understand your own role in the process, (8) offer educational information, (9) communicate recommendations directly to the requesting physician, and (10) provide appropriate follow-up.
Consider Your Future
Frequently reflect on what you most enjoy about your job. Although it can be easy to passively engage with intern year as a mere stepping-stone to dermatology residency, the years in PGY-2 and onward require active introspection to find a future niche. What made you gravitate to the specialty of dermatology? Try to identify your predilections for dermatopathology, pediatric dermatology, dermatologic surgery, cosmetic dermatology, and academia. Be consistently cognizant of your life after residency, as some fellowships such as dermatopathology require applications to be submitted at the conclusion of the PGY-2 year. Seek out faculty mentors or alumni who are walking a path similar to the one you want to embark on, as the next stop after graduation may be your forever job.
Depth, Not Breadth
The practice of medicine changes when narrowing the focus to one organ system. In both medical school and intern year, my study habits and history-taking of patients cast a wide net across multiple organ systems, aiming to know just enough about any one specialty to address all chief concerns and to know when it was appropriate to consult a specialist. This paradigm inevitably shifts in dermatology residency, as residents are tasked with memorizing the endless number of diagnoses of the skin alone, comprehending the many shades of “erythematous,” including pink, salmon, red, and purple. Both on the wards and in clinics, I had to grow comfortable with telling patients that I did not have an answer for many of their nondermatologic concerns and directing them to the right specialist. As medicine continues trending to specialization, subspecialization, and sub-subspecialization, the scope of any given physician likely will continue to narrow,7 as evidenced by specialty clinics within dermatology such as those focusing on hair loss or immunobullous disease. In this health care system, it is imperative to remember that you are only one physician within a team of care providers—understand your own role in the process and become comfortable with not having the answer to all the questions.
Final Thoughts
In a study of 44 dermatology residents, 35 (83%) indicated zero to less than 1 hour per week of independent preparation for dermatology residency during PGY-1.3 Although the usefulness of preparing is debatable, this figure likely reflects the absence of any insight on how to best prepare for the transition. Recognizing the many contrasts between internal medicine and dermatology and embracing the changes will enable a seamless promotion from a medicine PGY-1 to a dermatology PGY-2.
- Staples H, Frank S, Mullen M, et al. Improving the medical school to residency transition: narrative experiences from first-year residents.J Surg Educ. 2022;S1931-7204(22)00146-5. doi:10.1016/j.jsurg.2022.06.001
- Heidemann LA, Walford E, Mack J, et al. Is there a role for internal medicine residency preparation courses in the fourth year curriculum? a single-center experience. J Gen Intern Med. 2018;33:2048-2050.
- Hopkins C, Jalali O, Guffey D, et al. A survey of dermatology residents and program directors assessing the transition to dermatology residency. Proc (Bayl Univ Med Cent). 2020;34:59-62.
- Marcus CH, Winn AS, Sectish TC, et al. How much supervision is required is the beginning of intern year? Acad Pediatr. 2016;16:E3-E4.
- Bly RA, Bly EG. Consult courtesy. J Grad Med Educ. 2013;5:533-534.
- Goldman L, Lee T, Rudd P. Ten commandments for effective consultations. Arch Intern Med. 1983;143:1753-1755.
- Oren O, Gersh BJ, Bhatt DL. On the pearls and perils of sub-subspecialization. Am J Med. 2020;133:158-159.
Resident Pearl
- There is surprisingly little information on what to expect when transitioning from intern year to dermatology residency. Recognizing the unique aspects of a largely outpatient specialty and embracing the role of a specialist will help facilitate this transition.

Ossification and Migration of a Nodule Following Calcium Hydroxylapatite Injection
To the Editor:
Calcium hydroxylapatite is an injectable filler approved by the US Food and Drug Administration for moderate to severe rhytides of the face and the treatment of facial lipodystrophy in patients with HIV.1 This long-lasting filler generally is well tolerated with minimal side effects; however, there have been reports of nodules or granulomatous formation following injection.2 We present a case of a migrating nodule following injection of a calcium hydroxylapatite filler that appeared ossified on radiographic imaging. We highlight this rarely reported phenomenon to increase awareness of this complication.
A 72-year-old woman presented to our clinic with a mass on the left cheek. The patient had a history of treatment with facial fillers but no notable medical conditions. She initially received hyaluronic acid injectable gel dermal filler twice—3 years apart—before switching to calcium hydroxylapatite injections twice—4 months apart—from an outside provider. One month after the second treatment, she noticed a mass on the left cheek and promptly returned to the provider who performed the calcium hydroxylapatite injections. The provider, who had originally injected in the infraorbital area, stated it was unlikely that the filler would have migrated to the mid cheek and referred the patient to a general dentist who suspected salivary gland pathology. The patient was referred to an oral and maxillofacial surgeon who suspected the mass was related to the parotid gland. Maxillofacial computed tomography (CT) revealed heterotopic ossification vs myositis ossificans, possibly related to the recent injection. The patient was eventually referred to the Division of Plastic Surgery, Department of Surgery, at the University of Texas Medical Branch (Galveston, Texas) for further evaluation. Physical examination revealed a 2×1-cm firm, mobile, nontender mass in the left cheek in the area of the buccinator muscles. The mass did not express any fluid and was most easily palpable from the oral cavity. Radiography findings showed that the calcium hydroxylapatite filler had migrated to this location and formed a nodule (Figure). Because calcium hydroxylapatite fillers generally last 12 to 18 months, we opted to observe the lesion for spontaneous resolution. Four months later, the patient presented to our clinic for follow-up and the mass had reduced in size and appeared to be spontaneously resolving.

We present a unique case of a migrating nodule that occurred after injection with calcium hydroxylapatite, which led to concern for neoplastic tumor formation. This complication is rare, and it is important for practitioners who inject calcium hydroxylapatite as well as those who these patients may be referred to for evaluation to be aware that migrating nodules can occur. This awareness can help reduce unnecessary referrals, medical procedures, and anxiety.
Calcium hydroxylapatite filler is composed of 30% calcium hydroxylapatite microspheres suspended in a 70% sodium carboxymethylcellulose gel. The water-soluble gel rapidly becomes absorbed upon injection; however, the microspheres form a scaffold for the production of newly synthesized collagen. The filling effect generally lasts 12 to 18 months.1
Calcium hydroxylapatite, similar to most fillers, generally is well tolerated with a low complication rate of 3%.1 Although nodule formation with calcium hydroxylapatite is rare, it is the most common adverse event and encompasses 96% of complications. The remaining 4% of complications include persistent inflammation, swelling, erythema, and technical mistakes leading to overcorrection.1 Migrating nodules are rare; however, Beer3 reported a similar case.
Treatment of calcium hydroxylapatite nodules depends on differentiating a cause based on the time of onset. Early nodules that occur within 1 to 2 weeks of the injection usually represent incorrect positioning of the filler and can be treated by massaging the nodule. Other more invasive techniques involve aspiration or injection of sterile water. Late-onset nodules have shown response to corticosteroid injections. For inflammatory nodules of infectious origin, antibiotics can be useful. Surgical excision of the nodule rarely is required, as most nodules will resolve spontaneously, even without intervention.1,2
Radiologic findings of calcium hydroxylapatite appear as high-attenuation linear streaks or masses on CT (280–700 HU) and as low to intermediate signal intensity on T1- or T2-weighted sequences on magnetic resonance imaging. Oftentimes, calcium hydroxylapatite has a similar radiographic appearance to bone and can persist for 2 years or more on radiographic imaging, longer than they are clinically visible.4 The nodule formation from injection with calcium hydroxylapatite can mimic pathologic conditions such as miliary osteomas, myositis ossificans, heterotrophic/dystrophic calcifications, and foreign bodies on CT. Our patient’s CT findings of high attenuation linear streaks and nodules of similar signal intensity to bone were consistent with those previously described in the radiographic literature.
Calcium hydroxylapatite fillers have a good safety profile, but it is important to recognize that nodule formation is a common adverse event and that migration of nodules can occur. Practitioners should recognize this possibility in patients presenting with new masses after filler injection before advocating for potentially invasive and costly procedures and diagnostic modalities.
- Kadouch JA. Calcium hydroxylapatite: a review on safety and complications. J Cosmet Dermatol. 2017;16:152-161.
- Moulinets I, Arnaud E, Bui P, et al. Foreign body reaction to Radiesse: 2 cases. Am J Dermatopathol. 2013;35:e37-40.
- Beer KR. Radiesse nodule of the lips from a distant injection site: report of a case and consideration of etiology and management. J Drugs Dermatol. 2007;6:846-847.
- Ginat DT, Schatz CJ. Imaging features of midface injectable fillers and associated complications. AJNR Am J Neuroradiol. 2013;34:1488-1495.
To the Editor:
Calcium hydroxylapatite is an injectable filler approved by the US Food and Drug Administration for moderate to severe rhytides of the face and the treatment of facial lipodystrophy in patients with HIV.1 This long-lasting filler generally is well tolerated with minimal side effects; however, there have been reports of nodules or granulomatous formation following injection.2 We present a case of a migrating nodule following injection of a calcium hydroxylapatite filler that appeared ossified on radiographic imaging. We highlight this rarely reported phenomenon to increase awareness of this complication.
A 72-year-old woman presented to our clinic with a mass on the left cheek. The patient had a history of treatment with facial fillers but no notable medical conditions. She initially received hyaluronic acid injectable gel dermal filler twice—3 years apart—before switching to calcium hydroxylapatite injections twice—4 months apart—from an outside provider. One month after the second treatment, she noticed a mass on the left cheek and promptly returned to the provider who performed the calcium hydroxylapatite injections. The provider, who had originally injected in the infraorbital area, stated it was unlikely that the filler would have migrated to the mid cheek and referred the patient to a general dentist who suspected salivary gland pathology. The patient was referred to an oral and maxillofacial surgeon who suspected the mass was related to the parotid gland. Maxillofacial computed tomography (CT) revealed heterotopic ossification vs myositis ossificans, possibly related to the recent injection. The patient was eventually referred to the Division of Plastic Surgery, Department of Surgery, at the University of Texas Medical Branch (Galveston, Texas) for further evaluation. Physical examination revealed a 2×1-cm firm, mobile, nontender mass in the left cheek in the area of the buccinator muscles. The mass did not express any fluid and was most easily palpable from the oral cavity. Radiography findings showed that the calcium hydroxylapatite filler had migrated to this location and formed a nodule (Figure). Because calcium hydroxylapatite fillers generally last 12 to 18 months, we opted to observe the lesion for spontaneous resolution. Four months later, the patient presented to our clinic for follow-up and the mass had reduced in size and appeared to be spontaneously resolving.
We present a unique case of a migrating nodule that occurred after injection with calcium hydroxylapatite, which led to concern for neoplastic tumor formation. This complication is rare, and it is important for practitioners who inject calcium hydroxylapatite as well as those who these patients may be referred to for evaluation to be aware that migrating nodules can occur. This awareness can help reduce unnecessary referrals, medical procedures, and anxiety.
Calcium hydroxylapatite filler is composed of 30% calcium hydroxylapatite microspheres suspended in a 70% sodium carboxymethylcellulose gel. The water-soluble gel rapidly becomes absorbed upon injection; however, the microspheres form a scaffold for the production of newly synthesized collagen. The filling effect generally lasts 12 to 18 months.1
Calcium hydroxylapatite, similar to most fillers, generally is well tolerated with a low complication rate of 3%.1 Although nodule formation with calcium hydroxylapatite is rare, it is the most common adverse event and encompasses 96% of complications. The remaining 4% of complications include persistent inflammation, swelling, erythema, and technical mistakes leading to overcorrection.1 Migrating nodules are rare; however, Beer3 reported a similar case.
Treatment of calcium hydroxylapatite nodules depends on differentiating a cause based on the time of onset. Early nodules that occur within 1 to 2 weeks of the injection usually represent incorrect positioning of the filler and can be treated by massaging the nodule. Other more invasive techniques involve aspiration or injection of sterile water. Late-onset nodules have shown response to corticosteroid injections. For inflammatory nodules of infectious origin, antibiotics can be useful. Surgical excision of the nodule rarely is required, as most nodules will resolve spontaneously, even without intervention.1,2
Radiologic findings of calcium hydroxylapatite appear as high-attenuation linear streaks or masses on CT (280–700 HU) and as low to intermediate signal intensity on T1- or T2-weighted sequences on magnetic resonance imaging. Oftentimes, calcium hydroxylapatite has a similar radiographic appearance to bone and can persist for 2 years or more on radiographic imaging, longer than they are clinically visible.4 The nodule formation from injection with calcium hydroxylapatite can mimic pathologic conditions such as miliary osteomas, myositis ossificans, heterotrophic/dystrophic calcifications, and foreign bodies on CT. Our patient’s CT findings of high attenuation linear streaks and nodules of similar signal intensity to bone were consistent with those previously described in the radiographic literature.
Calcium hydroxylapatite fillers have a good safety profile, but it is important to recognize that nodule formation is a common adverse event and that migration of nodules can occur. Practitioners should recognize this possibility in patients presenting with new masses after filler injection before advocating for potentially invasive and costly procedures and diagnostic modalities.
- Kadouch JA. Calcium hydroxylapatite: a review on safety and complications. J Cosmet Dermatol. 2017;16:152-161.
- Moulinets I, Arnaud E, Bui P, et al. Foreign body reaction to Radiesse: 2 cases. Am J Dermatopathol. 2013;35:e37-40.
- Beer KR. Radiesse nodule of the lips from a distant injection site: report of a case and consideration of etiology and management. J Drugs Dermatol. 2007;6:846-847.
- Ginat DT, Schatz CJ. Imaging features of midface injectable fillers and associated complications. AJNR Am J Neuroradiol. 2013;34:1488-1495.
Practice Points
- Calcium hydroxylapatite filler can migrate and form nodules in distant locations from the original injection site.
- Practitioners of calcium hydroxylapatite fillers should be aware of the potential for nodule migration to avoid costly, time-consuming, and invasive referrals and procedures.
Medications for Opioid Use Disorder Program in a VA Emergency Department
Opioid use disorder (OUD) is a public health crisis significantly affecting veterans. A substantial increase in veterans diagnosed with OUD has occurred, nearly tripling from 25,031 in 2003 to 69,142 in 2017
For patients with active OUD, medications for opioid use disorder (MOUD) reduce the risk of overdose and all-cause mortality.3 In 2009, the US Department of Veterans Affairs (VA) and Department of Defense (DoD) published clinical practice guidelines for substance use disorders that strongly recommended MOUD with either buprenorphine or methadone as a first-line treatment. In 2015 updated guidelines encouraged buprenorphine initiation in primary care settings.4,5 This was followed by an academic detailing campaign designed to encourage VA clinicians to initiate MOUD.1 Despite this institutional support, MOUD remains underutilized within the VA, with widely variable rates of prescribing among VA sites.1
Efforts to further expand MOUD cultivated interest in administering buprenorphine in VA emergency departments (EDs). Patients with OUD often use the ED for same-day care, providing opportunities to initiate buprenorphine in the ED 24 hours, 7 days per week. This has been especially true during the COVID-19 pandemic during which reliable access to usual recovery services has been disrupted and EDs have served as a safety net.6
Buprenorphine’s safety profile and prolonged effect duration make it superior to other MOUD options for ED administration. As a partial opioid agonist, buprenorphine is unlikely to cause significant sedation or respiratory depression compared with full agonists like methadone. This is known as the ceiling effect. Additionally, at higher doses, buprenorphine’s effects can last for about 3 days, potentially obviating the need for repeat dosing. D’Onofrio and colleagues seminal 2015 paper conceptually proved the feasibility and value of initiating buprenorphine in the ED; patients who received ED initiation therapy were more likely to be engaged in addiction treatment 30 days after their visit and have reduced rates of illicit opioid drug use.7 Such ED harm-reduction strategies are increasingly recognized as essential, given that 1 in 20 patients treated for a nonfatal opioid overdose in an ED will die within 1 year of their visit, many within 2 days.8 Finally, a significant barrier faced by physicians wanting to administer or prescribe buprenorphine for patients with OUD has been the special licensing required by the Drug Enforcement Administration Drug Addiction Treatment Act of 2000, also known as an X-waiver. A notable exception to this X-waiver requirement is the 72-hour rule, which allows nonwaivered practitioners to administer (but not prescribe for home use) buprenorphine to a patient to relieve acute withdrawal symptoms for up to 72 hours while arranging for specialist referral.Under the 72-hour rule, ED clinicians have a unique opportunity to treat patients experiencing acute withdrawal symptoms and bridge them to specialty care, without the burden of an X-waiver requirement.
The VA Greater Los Angeles Healthcare System (VAGLAHS), therefore, developed and implemented a program to administer buprenorphine in the ED to bridge patients with OUD to an appointment with substance use disorder (SUD) services. We describe our development, implementation and evaluation of this program protocol as a model for other VA EDs. This project was determined to be quality improvement (nonresearch) by the VAGLAHS Institutional Review Board.
ED MOUD Program
We engaged in a 2-month (January-March 2019) preimplementation process during which we (1) obtained stakeholder buy-in; (2) developed a protocol and supporting resources and tools; (3) worked with stakeholders to enact local organizational policy and process modifications; and (4) educated practitioners.
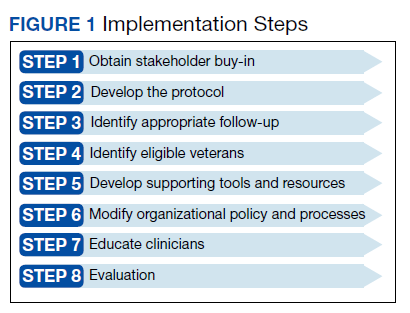
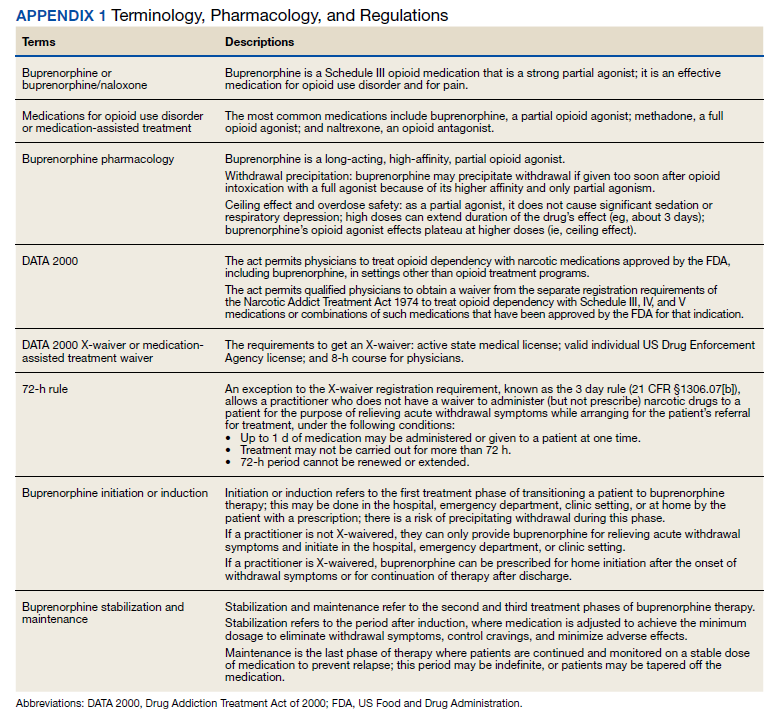
Appendix 1 provides an overview of MOUD terminology, pharmacology, and regulations. We developed an 8-step program implementation plan for the ED MOUD program (Figure 1).
Obtaining Stakeholder Buy-in
Two ED physician champions (MC, JH) organized all activities. Champions obtained stakeholder buy-in from clinical and administrative leaders as well as from frontline personnel in OUD specialty care, ED, and pharmacy services. ED social workers and clerks who schedule post-ED appointments also were engaged. These stakeholders emphasized the importance of fitting the developed protocol into the existing ED workflows as well as minimizing additional resources required to initiate and maintain the program.
We ascertained that in fiscal year 2018, VAGLAHS had 156 ED visits with International Statistical Classification of Diseases, Tenth Revision (ICD-10) codes related to OUD for 108 unique patients. Based on these data and in consultation with OUD specialty care, we determined that the potential number of referrals to the SUD clinic would be manageable with existing resources. Additionally, there was consensus that most opioid withdrawal patients could be treated in the urgent care portion of our ED since these patients generally do not require special monitoring. This consideration was important for obtaining ED stakeholder buy-in and for planning protocol logistics.
Developing the Protocol
We customized resources created by CalBridge Behavioral Health Navigator Program (CA Bridge), formerly called ED Bridge, a program of the Public Health Institute in Oakland, California, funded through California Department of Health Care Services. CA Bridge offers technical assistance and support for hospitals as well as guidance and tools for establishing processes for EDs providing buprenorphine prescriptions for the management of acute opioid withdrawal and serving as a bridge to follow-up care in SUD clinics.9 We also reviewed protocols described by D’Onofrio and colleagues. With iterative input from stakeholders, we created a protocol concretely delineating each process and corresponding responsible party with the overall aim of removing potential barriers to MOUD initiation and follow-up (Appendix 2).
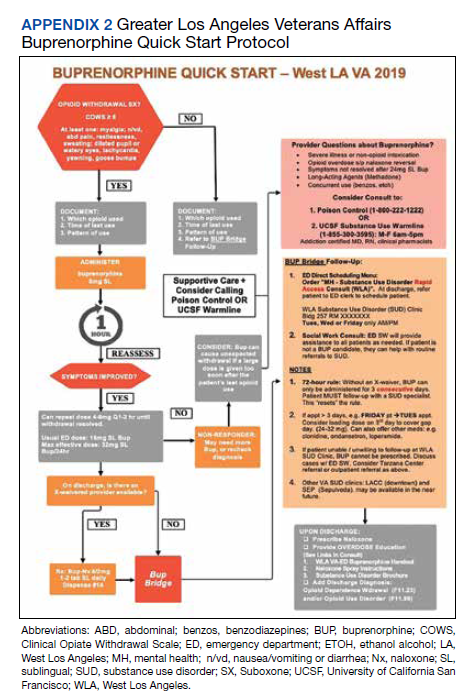
Identifying Appropriate Follow-up
To operationalize protocol implementation, we built on VA’s Emergency Department Rapid Access Clinic (ED-RAC) process, a mechanism for scheduling appointments for post-ED specialty follow-up care. This process facilitated veterans’ access to urgent specialty care follow-up after ED visits by scheduling appointments prior to ED discharge.10 For the ED MOUD program, we adapted the ED-RAC process to schedule appointments in SUD clinic prior to ED discharge. These appointments allowed patients to be seen by an SUD clinician within 72 hours of ED discharge. This step was critical to working within the 72-hour rule without relying on X-waiver licensing of ED clinicians. Alternatively, as was previous practice, per patient preference, patients were also referred to non-VA residential rehabilitation services if the facility had capacity and patients met criteria for admission.
Identification of Eligible Veterans
Target patients were those primarily presenting with a request for treatment of opioid dependence or withdrawal. Patients were not actively screened for OUD. Clinicians diagnosed and assessed for OUD as per their usual practice. Patients with OUD who presented to the ED for other reasons were assessed, at clinician discretion, for their interest in receiving MOUD. If patients presented in moderate-to-severe withdrawal (eg, Clinical Opiate Withdrawal Scale [COWS] ≥ 8), buprenorphine was initiated in the ED. These patients were subsequently referred to either the local SUD clinic or to a residential treatment center. Patients presenting with a COWS score < 8 were referred to the outpatient SUD clinic or residential treatment centers without initiating buprenorphine from the ED. The SUD clinic or residential treatment centers could offer buprenorphine or other MOUD options. From the ED, prescribing buprenorphine for patients to self-initiate at home was not available as this required an X-waivered prescriber, which were limited during the program time frame.
Support Tools and Resources
To facilitate ED clinicians using the protocol, we worked with a programmer experienced with the Computerized Patient Record System, the VA electronic health record (EHR), to create electronic order menu sets that directed clinicians to the protocol and educational materials (Appendix 3). These menus are readily accessible and embedded into the ED clinician workflow. The menus highlight key elements of the protocol, including indications for initiation, contraindications, recommended dosing with quick orders, and how to obtain follow-up for the patient. Links also are provided to the protocol and patient discharge handouts, including the CA Bridge website.
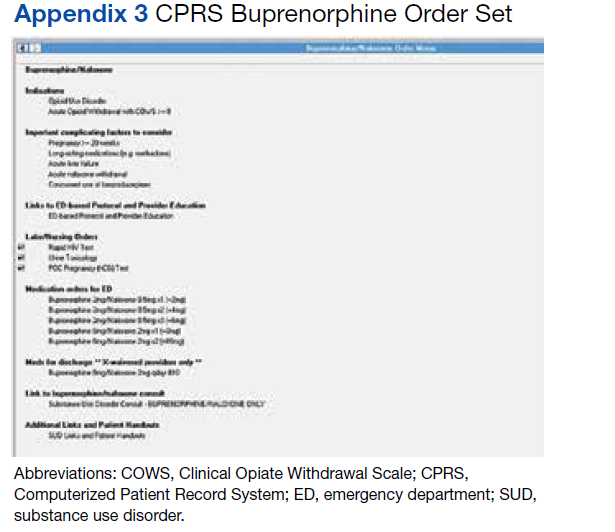
Organizational Policy and Processes
Before implementing the developed protocol, we worked with stakeholders to modify organizational policies and processes. Our pharmacy agreed to stock buprenorphine in the ED to make it readily available. EHR restrictions that historically prohibited ordering buprenorphine for ED administration by nonwaivered clinicians were modified. Additionally, our chief of staff, pharmacy, and credentialing department agreed that physicians did not need to apply for additional delineated privileges.
Clinician Education
The final preparation step was educating clinicians and other protocol users. The VAGLAHS SUD chief presented a lecture and answered questions about MOUD to core ED faculty about the rising prevalence of OUD and use of buprenorphine as a recommended treatment.
Evaluation
To assess adherence to the developed protocol, we conducted a retrospective health record review of all ED visits March 1 to October 25, 2019, in which the patient had OUD and may have qualified for MOUD. To do this, we identified (1) ED visits with an OUD ICD-10 code as a primary or secondary diagnoses; (2) ED referrals to outpatient SUD treatment; and/or (3) ED visits in which buprenorphine was given or prescribed. We included the latter 2 criteria as application of ICD-10 codes for OUD care was inconsistent. Visits were excluded if patients did not have OUD, had OUD in remission, were already maintained on a stable MOUD regimen and no longer using illicit drugs or craving additional opioids, or were presenting solely for a refill or administration of a missed dose. Patients who relapsed were categorized as unstable. Visits were excluded if the patient was admitted to the hospital or left against medical advice. Patients on MOUD who had relapsed or requested a change in MOUD treatment were included. For all included visits, 2 ED physicians (MC, JH) reviewed the ED clinician and nursing notes, pharmacy and referral records, diagnostic codes, and veteran demographics.
In the evaluation, there were 130 visits with 92 unique veterans meeting inclusion criteria. The final sample included 70 visits with 47 unique veterans (Table 1). Of note, 24 (53%) patients self-identified as homeless or were engaged with VA housing services. Twelve veterans had multiple ED visits (7 patients with 2 visits; 5 patients with ≥ 3 visits). In 30 (43%) visits the veteran’s primary reason for seeking ED care was to obtain treatment for opioid withdrawal or receive MOUD. Type of opiate used was specified in 58% of visits; of these, 69% indicated heroin use and 17% prescription medications. Buprenorphine was initiated in the ED in 18 (26%) visits for 10 veterans. Appendix 4 outlines the clinical course and follow-up after these visits. Some veterans returned to the ED for buprenorphine redosing per the 72-hour rule. SUD clinic appointments were provided in 11 visits, and direct transfer to an inpatient rehabilitation center was arranged in 4 visits. In 42 (60%) visits, across 32 unique veterans, buprenorphine was not given in the ED, but patients were referred for SUD treat
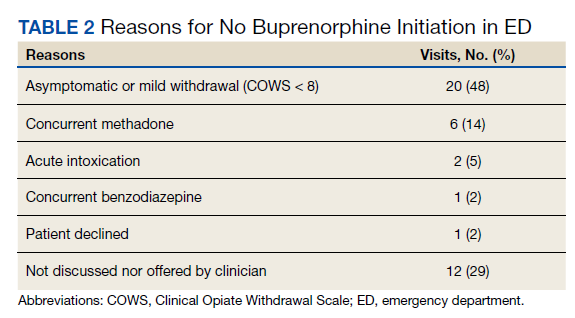
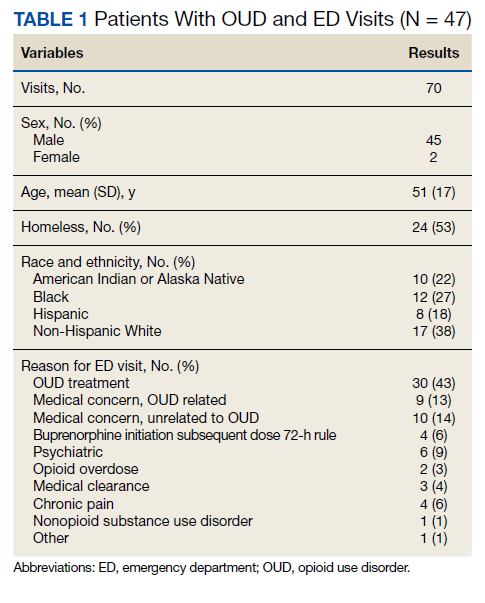
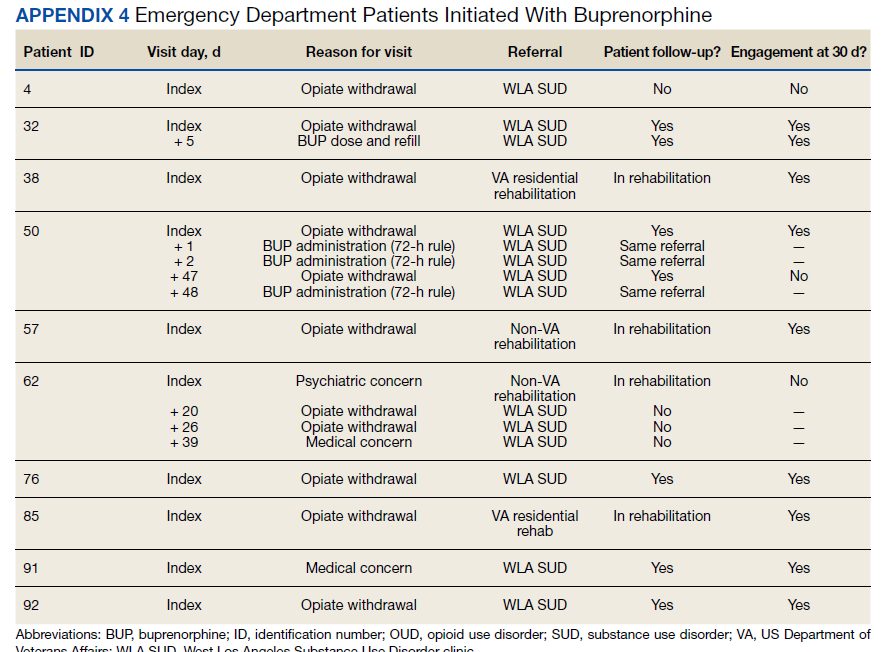
A majority of veterans who received buprenorphine and a referral for an SUD appointment went to their initial SUD follow-up appointment and had ongoing engagement in addiction care 30 days after their index ED visit. Among veterans who did not receive buprenorphine but were referred for SUD treatment, about half went to their SUD appointments and about 1 in 5 had ongoing engagement in addiction care at 30 days after the index ED visit. Of note, 2 patients who received referrals died within 1 year of their index ED visit. The cause of death for one patient was an overdose; the other was unspecified.
DISCUSSION
We developed the ED MOUD program as a bridge to SUD specialty care. Our 8 implementation steps can serve as a model for implementing programs at other VA EDs. We demonstrated feasibility, high follow-up rates, and high retention in treatment.
Patients who received ED buprenorphine initiation were more likely to follow up and had higher rates of ongoing engagement at 30 days than did those who received only a clinic referral. In a similar Canadian study, buprenorphine was initiated in the ED, and patients followed up as a walk-in for addiction services; however, only 54% of patients presented to this initial follow-up.11 Our higher initial follow-up rate may be due to our ability to directly schedule clinic appointments. Our 70% 30-day follow-up rate is comparable, but slightly lower than the 2015 D’Onofrio and colleagues study in which 78% of patients remained engaged at 30 days.7 A possible reason is that in the D’Onofrio and colleagues study, all study physicians obtained X-waiver training and were able to prescribe buprenorphine after ED initiation or for self-initiation at home. X-waiver training was not required of our clinicians, and none of our patients were offered a prescription for self-initiation.
Our program demonstrates that it is feasible to develop a protocol without X-waiver licensing. This program provides a supportive framework for the use of MOUD and allows nonspecialists to gain experience and confidence in using buprenorphine. Any clinician could administer buprenorphine in the ED, and patients could be bridged at later ED visits until follow-up with a specialist. Of note, only a small percentage of the total visits for buprenorphine initiation required multiple daily visits for buprenorphine. Appointments with the specialist were assured to fall within a 72-hour window.
Our program has some limitations. First, the number of patients who were candidates for our ED MOUD program was small. In our 7-month review, only 47 patients were identified as potential candidates for MOUD treatment across 70 visits, and only 10 were initiated in the ED. Second, all patients were not actively screened for OUD. There was potential for missing eligible veterans as inclusion criteria relied on clinicians both recognizing OUD and manually entering a correct diagnostic code. We attempted to mitigate this by also reviewing all ED referrals to the SUD clinic and all patients who received buprenorphine in the ED. In addition, we do not have data on preimplementation rates of follow-up for comparison.
Future Directions
More than half of our patients did not receive ED buprenorphine initiation because they were not in moderate or severe withdrawal (COWS ≥ 8) similar to 57% of patients cited in the D’Onofrio and colleagues study.7 Teaching veterans how to start buprenorphine at home could greatly expand enrollment. However, this requires a prescription from an X-waiver licensed clinician. In 2021, the US Department of Health and Human Services removed the 8-hour training requirement for obtaining an X-waiver.12 However, clinicians are still required to apply for licensing. Eliminating the X-waiver requirement, as proposed by D’Onofrio and colleagues in a 2021 editorial, would have allowed all clinicians to offer home initiation.13
Previous studies suggest that despite the ability to provide a prescription, clinicians may be reluctant to offer home initiation.14–17 In a national VA 2019 survey, many emergency medicine physicians believe that SUD care is not in their scope of practice, as Dieujuste and colleagues described in Federal Practitioner.14 Although it is likely some attitudes have changed with the increased visibility of ED MOUD programs, there is still much work to be done to change perceptions.
Another area for improvement is screening for OUD in the ED to better reveal MOUD candidates. Missed opportunities (neither referral nor treatment offered) occurred in 21% of our visits. D’Onofrio and colleagues identified 66% of patients by screening all ED patients.7 Although universal screening for SUD in routine health care settings has been recommended, 2021 VA guidelines state that there is insufficient evidence to recommend universal screening.18-20 There are also limited data on the best screening tool for OUD in the ED.21 Further research on how to effectively and efficiently identify OUD patients in the ED is needed.
Conclusions
With minimal resource allocation, we started the program to offer MOUD with buprenorphine for patients with OUD at a VA ED and provided addiction treatment follow-up. This program, the first of its kind within VA, can be modeled and expanded to other VA facilities. Given increasing numbers of fatal opioid overdose, and significant adverse impacts of the COVID-19 pandemic on the OUD crisis, developing local and national strategies to treat OUD is essential. Future steps include improved screening and expanding capacity to offer home initiation by increasing the number of X-waiver ED clinicians.6
Acknowledgments
Thank you to Jeffrey Balsam, PharmD, BCPS, Veterans Affairs Greater Los Angeles Clinical Applications Coordinator for his contributions in creating a Computerized Patient Record System opioid use disorder screening tool. Thank you to Gracielle Tan, MD, Veterans Affairs Greater Los Angeles Health Science Specialist for her administrative assistance in manuscript preparation.
1. Wyse JJ, Gordon AJ, Dobscha SK, et al. Medications for opioid use disorder in the Department of Veterans Affairs (VA) health care system: historical perspective, lessons learned, and next steps. Subst Abuse. 2018;39(2):139-144. doi:10.1080/08897077.2018.1452327
2. Bohnert ASB, Ilgen MA, Galea S, McCarthy JF, Blow FC. Accidental poisoning mortality among patients in the Department of Veterans Affairs health system. Med Care. 2011;49(4):393-396. doi:10.1097/MLR.0b013e318202aa27
3. Ma J, Bao Y-P, Wang R-J, et al. Effects of medication-assisted treatment on mortality among opioids users: a systematic review and meta-analysis. Mol Psychiatry. 2019;24(12):1968-1983. doi:10.1038/s41380-018-0094-5
4. The Management of Substance Use Disorders Work Group. VA/DoD Clinical Practice Guideline for the Management of Substance Use Disorders. Version 2.0. US Department of Veterans Affairs; 2009.
5. The Management of Substance Use Disorders Work Group. VA/DoD Clinical Practice Guideline for the Management of Substance Use Disorders. Version 3.0. US Department of Veterans Affairs. 2015. Accessed July 1, 2022. https://www.healthquality.va.gov/guidelines/MH/sud/VADoDSUDCPGRevised22216.pdf
6. Hulsey J, Mellis A, Kelly B. COVID-19 pandemic impact on patients, families and individuals in recovery from substance use disorder. Accessed July 7, 2021. https://www.addictionpolicy.org/covid19-report
7. D’Onofrio G, O’Connor PG, Pantalon MV, et al. Emergency department-initiated buprenorphine/naloxone treatment for opiod dependence. JAMA. 2015;313(16):1636-1644. doi:10.1001/jama.2015.3474
8. Weiner SG, Baker O, Bernson D, Schuur JD. One-year mortality of patients after emergency department treatment for non-fatal opioid overdose. Ann Emerg Med. 2020;75(1):13-17. doi:10.1016/j.annemergmed.2019.04.020
9. CA Bridge. Updated 2021. Accessed July 1, 2022. https://cabridge.org
10. Penney L, Miake-Lye I, Lewis D, et al. Proceedings from the 11th annual conference on the science of dissemination and implementation: S72 spreading VA’s emergency department-rapid access clinics (ED-RAC) intervention: key factors for success. Implementation Sci. 2019;14(suppl 1). doi:10.1186/s13012-019-0878-2
11. Hu T, Snider-Alder M, Nijmeh L, Pyle A. Buprenorphine/naloxone induction in a Canadian emergency department with rapid access to community-based addictions providers. CJEM. 2019;21(4):492-498. doi:10.1017/cem.2019.24
12. US Department of Health and Human Services. Practice Guidelines for the Administration of Buprenorphine for Treating Opioid Use Disorder. Federal Register. Accessed July 1, 2022. https://www.federalregister.gov/documents/2021/04/28/2021-08961/practice-guidelines-for-the-administration-of-buprenorphine-for-treating-opioid-use-disorder
13. D’Onofrio G, Melnick ER, Hawk KF. Improve access to care for opioid use disorder: a call to eliminate the x-waiver requirement now. Ann Emerg Med. 2021;78(2):220-222. doi:10.1016/j.annemergmed.2021.03.023
14. Dieujuste N, Johnson-Koenke R, Celedon M, et al. Provider perceptions of opioid safety measures in VHA emergency department and urgent care centers. Fed Pract. 2021;38(9):412-419. doi:10.12788/fp.0179
15. Hawk KF, D’Onofrio G, Chawarski MC, et al. Barriers and faciliatators to clinician readiness to provide emergency department-initiated buprenorphine. JAMA Netw Open. 2020;3(5):e204561. doi:10.1001/jamanetworkopen.2020.4561
16. Lowenstein M, Kilaru A, Perrone J, et al. Barriers and facilitators for emergency department initiation of buprenorphine: a physician survey. Am J Emerg Med. 2019;37(9):1787-1790. doi:10.1016/j.ajem.2019.02.025
17. Srivastava A, Kahan M, Leece P, McAndrew A. Buprenorphine unobserved “home” induction: a survey of Ontario’s addiction physicians. Addic Sci Clin Pract. 2019;14(1):18. doi:10.1186/s13722-019-0146-4
18. The Management of Substance Use Disorders Work Group. VA/DoD Clinical Practice Guideline for the Management of Substance Use Disorders. Version 4.0. US Department of Veterans Affairs. 2021. Accessed July 1, 2022. https://www.healthquality.va.gov/guidelines/MH/sud/VADoDSUDCPG.pdf
19. Patnode CD, Perdue LA, Rushkin M, et al. Screening for unhealthy drug use updated evidence report and systematic review for the US Preventive Services Task Force. JAMA. 2020;323(22):2310-2338. doi:10.1001/jama.2019.21381
20. Coles S, Vosooney A. Evidence lacking to support universal unhealthy drug use screening. Am Fam Physician. 2021;103(2):72-73.
21. Sahota PK, Sharstry S, Mukamel DB, et al. Screening emergency department patients for opioid drug use: a qualitative systematic review. Addict Behav. 2018;85:139-146. doi:10.1016/j.addbeh.2018.05.022
Opioid use disorder (OUD) is a public health crisis significantly affecting veterans. A substantial increase in veterans diagnosed with OUD has occurred, nearly tripling from 25,031 in 2003 to 69,142 in 2017
For patients with active OUD, medications for opioid use disorder (MOUD) reduce the risk of overdose and all-cause mortality.3 In 2009, the US Department of Veterans Affairs (VA) and Department of Defense (DoD) published clinical practice guidelines for substance use disorders that strongly recommended MOUD with either buprenorphine or methadone as a first-line treatment. In 2015 updated guidelines encouraged buprenorphine initiation in primary care settings.4,5 This was followed by an academic detailing campaign designed to encourage VA clinicians to initiate MOUD.1 Despite this institutional support, MOUD remains underutilized within the VA, with widely variable rates of prescribing among VA sites.1
Efforts to further expand MOUD cultivated interest in administering buprenorphine in VA emergency departments (EDs). Patients with OUD often use the ED for same-day care, providing opportunities to initiate buprenorphine in the ED 24 hours, 7 days per week. This has been especially true during the COVID-19 pandemic during which reliable access to usual recovery services has been disrupted and EDs have served as a safety net.6
Buprenorphine’s safety profile and prolonged effect duration make it superior to other MOUD options for ED administration. As a partial opioid agonist, buprenorphine is unlikely to cause significant sedation or respiratory depression compared with full agonists like methadone. This is known as the ceiling effect. Additionally, at higher doses, buprenorphine’s effects can last for about 3 days, potentially obviating the need for repeat dosing. D’Onofrio and colleagues seminal 2015 paper conceptually proved the feasibility and value of initiating buprenorphine in the ED; patients who received ED initiation therapy were more likely to be engaged in addiction treatment 30 days after their visit and have reduced rates of illicit opioid drug use.7 Such ED harm-reduction strategies are increasingly recognized as essential, given that 1 in 20 patients treated for a nonfatal opioid overdose in an ED will die within 1 year of their visit, many within 2 days.8 Finally, a significant barrier faced by physicians wanting to administer or prescribe buprenorphine for patients with OUD has been the special licensing required by the Drug Enforcement Administration Drug Addiction Treatment Act of 2000, also known as an X-waiver. A notable exception to this X-waiver requirement is the 72-hour rule, which allows nonwaivered practitioners to administer (but not prescribe for home use) buprenorphine to a patient to relieve acute withdrawal symptoms for up to 72 hours while arranging for specialist referral.Under the 72-hour rule, ED clinicians have a unique opportunity to treat patients experiencing acute withdrawal symptoms and bridge them to specialty care, without the burden of an X-waiver requirement.
The VA Greater Los Angeles Healthcare System (VAGLAHS), therefore, developed and implemented a program to administer buprenorphine in the ED to bridge patients with OUD to an appointment with substance use disorder (SUD) services. We describe our development, implementation and evaluation of this program protocol as a model for other VA EDs. This project was determined to be quality improvement (nonresearch) by the VAGLAHS Institutional Review Board.
ED MOUD Program
We engaged in a 2-month (January-March 2019) preimplementation process during which we (1) obtained stakeholder buy-in; (2) developed a protocol and supporting resources and tools; (3) worked with stakeholders to enact local organizational policy and process modifications; and (4) educated practitioners.
Appendix 1 provides an overview of MOUD terminology, pharmacology, and regulations. We developed an 8-step program implementation plan for the ED MOUD program (Figure 1).
Obtaining Stakeholder Buy-in
Two ED physician champions (MC, JH) organized all activities. Champions obtained stakeholder buy-in from clinical and administrative leaders as well as from frontline personnel in OUD specialty care, ED, and pharmacy services. ED social workers and clerks who schedule post-ED appointments also were engaged. These stakeholders emphasized the importance of fitting the developed protocol into the existing ED workflows as well as minimizing additional resources required to initiate and maintain the program.
We ascertained that in fiscal year 2018, VAGLAHS had 156 ED visits with International Statistical Classification of Diseases, Tenth Revision (ICD-10) codes related to OUD for 108 unique patients. Based on these data and in consultation with OUD specialty care, we determined that the potential number of referrals to the SUD clinic would be manageable with existing resources. Additionally, there was consensus that most opioid withdrawal patients could be treated in the urgent care portion of our ED since these patients generally do not require special monitoring. This consideration was important for obtaining ED stakeholder buy-in and for planning protocol logistics.
Developing the Protocol
We customized resources created by CalBridge Behavioral Health Navigator Program (CA Bridge), formerly called ED Bridge, a program of the Public Health Institute in Oakland, California, funded through California Department of Health Care Services. CA Bridge offers technical assistance and support for hospitals as well as guidance and tools for establishing processes for EDs providing buprenorphine prescriptions for the management of acute opioid withdrawal and serving as a bridge to follow-up care in SUD clinics.9 We also reviewed protocols described by D’Onofrio and colleagues. With iterative input from stakeholders, we created a protocol concretely delineating each process and corresponding responsible party with the overall aim of removing potential barriers to MOUD initiation and follow-up (Appendix 2).
Identifying Appropriate Follow-up
To operationalize protocol implementation, we built on VA’s Emergency Department Rapid Access Clinic (ED-RAC) process, a mechanism for scheduling appointments for post-ED specialty follow-up care. This process facilitated veterans’ access to urgent specialty care follow-up after ED visits by scheduling appointments prior to ED discharge.10 For the ED MOUD program, we adapted the ED-RAC process to schedule appointments in SUD clinic prior to ED discharge. These appointments allowed patients to be seen by an SUD clinician within 72 hours of ED discharge. This step was critical to working within the 72-hour rule without relying on X-waiver licensing of ED clinicians. Alternatively, as was previous practice, per patient preference, patients were also referred to non-VA residential rehabilitation services if the facility had capacity and patients met criteria for admission.
Identification of Eligible Veterans
Target patients were those primarily presenting with a request for treatment of opioid dependence or withdrawal. Patients were not actively screened for OUD. Clinicians diagnosed and assessed for OUD as per their usual practice. Patients with OUD who presented to the ED for other reasons were assessed, at clinician discretion, for their interest in receiving MOUD. If patients presented in moderate-to-severe withdrawal (eg, Clinical Opiate Withdrawal Scale [COWS] ≥ 8), buprenorphine was initiated in the ED. These patients were subsequently referred to either the local SUD clinic or to a residential treatment center. Patients presenting with a COWS score < 8 were referred to the outpatient SUD clinic or residential treatment centers without initiating buprenorphine from the ED. The SUD clinic or residential treatment centers could offer buprenorphine or other MOUD options. From the ED, prescribing buprenorphine for patients to self-initiate at home was not available as this required an X-waivered prescriber, which were limited during the program time frame.
Support Tools and Resources
To facilitate ED clinicians using the protocol, we worked with a programmer experienced with the Computerized Patient Record System, the VA electronic health record (EHR), to create electronic order menu sets that directed clinicians to the protocol and educational materials (Appendix 3). These menus are readily accessible and embedded into the ED clinician workflow. The menus highlight key elements of the protocol, including indications for initiation, contraindications, recommended dosing with quick orders, and how to obtain follow-up for the patient. Links also are provided to the protocol and patient discharge handouts, including the CA Bridge website.
Organizational Policy and Processes
Before implementing the developed protocol, we worked with stakeholders to modify organizational policies and processes. Our pharmacy agreed to stock buprenorphine in the ED to make it readily available. EHR restrictions that historically prohibited ordering buprenorphine for ED administration by nonwaivered clinicians were modified. Additionally, our chief of staff, pharmacy, and credentialing department agreed that physicians did not need to apply for additional delineated privileges.
Clinician Education
The final preparation step was educating clinicians and other protocol users. The VAGLAHS SUD chief presented a lecture and answered questions about MOUD to core ED faculty about the rising prevalence of OUD and use of buprenorphine as a recommended treatment.
Evaluation
To assess adherence to the developed protocol, we conducted a retrospective health record review of all ED visits March 1 to October 25, 2019, in which the patient had OUD and may have qualified for MOUD. To do this, we identified (1) ED visits with an OUD ICD-10 code as a primary or secondary diagnoses; (2) ED referrals to outpatient SUD treatment; and/or (3) ED visits in which buprenorphine was given or prescribed. We included the latter 2 criteria as application of ICD-10 codes for OUD care was inconsistent. Visits were excluded if patients did not have OUD, had OUD in remission, were already maintained on a stable MOUD regimen and no longer using illicit drugs or craving additional opioids, or were presenting solely for a refill or administration of a missed dose. Patients who relapsed were categorized as unstable. Visits were excluded if the patient was admitted to the hospital or left against medical advice. Patients on MOUD who had relapsed or requested a change in MOUD treatment were included. For all included visits, 2 ED physicians (MC, JH) reviewed the ED clinician and nursing notes, pharmacy and referral records, diagnostic codes, and veteran demographics.
In the evaluation, there were 130 visits with 92 unique veterans meeting inclusion criteria. The final sample included 70 visits with 47 unique veterans (Table 1). Of note, 24 (53%) patients self-identified as homeless or were engaged with VA housing services. Twelve veterans had multiple ED visits (7 patients with 2 visits; 5 patients with ≥ 3 visits). In 30 (43%) visits the veteran’s primary reason for seeking ED care was to obtain treatment for opioid withdrawal or receive MOUD. Type of opiate used was specified in 58% of visits; of these, 69% indicated heroin use and 17% prescription medications. Buprenorphine was initiated in the ED in 18 (26%) visits for 10 veterans. Appendix 4 outlines the clinical course and follow-up after these visits. Some veterans returned to the ED for buprenorphine redosing per the 72-hour rule. SUD clinic appointments were provided in 11 visits, and direct transfer to an inpatient rehabilitation center was arranged in 4 visits. In 42 (60%) visits, across 32 unique veterans, buprenorphine was not given in the ED, but patients were referred for SUD treat
A majority of veterans who received buprenorphine and a referral for an SUD appointment went to their initial SUD follow-up appointment and had ongoing engagement in addiction care 30 days after their index ED visit. Among veterans who did not receive buprenorphine but were referred for SUD treatment, about half went to their SUD appointments and about 1 in 5 had ongoing engagement in addiction care at 30 days after the index ED visit. Of note, 2 patients who received referrals died within 1 year of their index ED visit. The cause of death for one patient was an overdose; the other was unspecified.
DISCUSSION
We developed the ED MOUD program as a bridge to SUD specialty care. Our 8 implementation steps can serve as a model for implementing programs at other VA EDs. We demonstrated feasibility, high follow-up rates, and high retention in treatment.
Patients who received ED buprenorphine initiation were more likely to follow up and had higher rates of ongoing engagement at 30 days than did those who received only a clinic referral. In a similar Canadian study, buprenorphine was initiated in the ED, and patients followed up as a walk-in for addiction services; however, only 54% of patients presented to this initial follow-up.11 Our higher initial follow-up rate may be due to our ability to directly schedule clinic appointments. Our 70% 30-day follow-up rate is comparable, but slightly lower than the 2015 D’Onofrio and colleagues study in which 78% of patients remained engaged at 30 days.7 A possible reason is that in the D’Onofrio and colleagues study, all study physicians obtained X-waiver training and were able to prescribe buprenorphine after ED initiation or for self-initiation at home. X-waiver training was not required of our clinicians, and none of our patients were offered a prescription for self-initiation.
Our program demonstrates that it is feasible to develop a protocol without X-waiver licensing. This program provides a supportive framework for the use of MOUD and allows nonspecialists to gain experience and confidence in using buprenorphine. Any clinician could administer buprenorphine in the ED, and patients could be bridged at later ED visits until follow-up with a specialist. Of note, only a small percentage of the total visits for buprenorphine initiation required multiple daily visits for buprenorphine. Appointments with the specialist were assured to fall within a 72-hour window.
Our program has some limitations. First, the number of patients who were candidates for our ED MOUD program was small. In our 7-month review, only 47 patients were identified as potential candidates for MOUD treatment across 70 visits, and only 10 were initiated in the ED. Second, all patients were not actively screened for OUD. There was potential for missing eligible veterans as inclusion criteria relied on clinicians both recognizing OUD and manually entering a correct diagnostic code. We attempted to mitigate this by also reviewing all ED referrals to the SUD clinic and all patients who received buprenorphine in the ED. In addition, we do not have data on preimplementation rates of follow-up for comparison.
Future Directions
More than half of our patients did not receive ED buprenorphine initiation because they were not in moderate or severe withdrawal (COWS ≥ 8) similar to 57% of patients cited in the D’Onofrio and colleagues study.7 Teaching veterans how to start buprenorphine at home could greatly expand enrollment. However, this requires a prescription from an X-waiver licensed clinician. In 2021, the US Department of Health and Human Services removed the 8-hour training requirement for obtaining an X-waiver.12 However, clinicians are still required to apply for licensing. Eliminating the X-waiver requirement, as proposed by D’Onofrio and colleagues in a 2021 editorial, would have allowed all clinicians to offer home initiation.13
Previous studies suggest that despite the ability to provide a prescription, clinicians may be reluctant to offer home initiation.14–17 In a national VA 2019 survey, many emergency medicine physicians believe that SUD care is not in their scope of practice, as Dieujuste and colleagues described in Federal Practitioner.14 Although it is likely some attitudes have changed with the increased visibility of ED MOUD programs, there is still much work to be done to change perceptions.
Another area for improvement is screening for OUD in the ED to better reveal MOUD candidates. Missed opportunities (neither referral nor treatment offered) occurred in 21% of our visits. D’Onofrio and colleagues identified 66% of patients by screening all ED patients.7 Although universal screening for SUD in routine health care settings has been recommended, 2021 VA guidelines state that there is insufficient evidence to recommend universal screening.18-20 There are also limited data on the best screening tool for OUD in the ED.21 Further research on how to effectively and efficiently identify OUD patients in the ED is needed.
Conclusions
With minimal resource allocation, we started the program to offer MOUD with buprenorphine for patients with OUD at a VA ED and provided addiction treatment follow-up. This program, the first of its kind within VA, can be modeled and expanded to other VA facilities. Given increasing numbers of fatal opioid overdose, and significant adverse impacts of the COVID-19 pandemic on the OUD crisis, developing local and national strategies to treat OUD is essential. Future steps include improved screening and expanding capacity to offer home initiation by increasing the number of X-waiver ED clinicians.6
Acknowledgments
Thank you to Jeffrey Balsam, PharmD, BCPS, Veterans Affairs Greater Los Angeles Clinical Applications Coordinator for his contributions in creating a Computerized Patient Record System opioid use disorder screening tool. Thank you to Gracielle Tan, MD, Veterans Affairs Greater Los Angeles Health Science Specialist for her administrative assistance in manuscript preparation.
1. Wyse JJ, Gordon AJ, Dobscha SK, et al. Medications for opioid use disorder in the Department of Veterans Affairs (VA) health care system: historical perspective, lessons learned, and next steps. Subst Abuse. 2018;39(2):139-144. doi:10.1080/08897077.2018.1452327
2. Bohnert ASB, Ilgen MA, Galea S, McCarthy JF, Blow FC. Accidental poisoning mortality among patients in the Department of Veterans Affairs health system. Med Care. 2011;49(4):393-396. doi:10.1097/MLR.0b013e318202aa27
3. Ma J, Bao Y-P, Wang R-J, et al. Effects of medication-assisted treatment on mortality among opioids users: a systematic review and meta-analysis. Mol Psychiatry. 2019;24(12):1968-1983. doi:10.1038/s41380-018-0094-5
4. The Management of Substance Use Disorders Work Group. VA/DoD Clinical Practice Guideline for the Management of Substance Use Disorders. Version 2.0. US Department of Veterans Affairs; 2009.
5. The Management of Substance Use Disorders Work Group. VA/DoD Clinical Practice Guideline for the Management of Substance Use Disorders. Version 3.0. US Department of Veterans Affairs. 2015. Accessed July 1, 2022. https://www.healthquality.va.gov/guidelines/MH/sud/VADoDSUDCPGRevised22216.pdf
6. Hulsey J, Mellis A, Kelly B. COVID-19 pandemic impact on patients, families and individuals in recovery from substance use disorder. Accessed July 7, 2021. https://www.addictionpolicy.org/covid19-report
7. D’Onofrio G, O’Connor PG, Pantalon MV, et al. Emergency department-initiated buprenorphine/naloxone treatment for opiod dependence. JAMA. 2015;313(16):1636-1644. doi:10.1001/jama.2015.3474
8. Weiner SG, Baker O, Bernson D, Schuur JD. One-year mortality of patients after emergency department treatment for non-fatal opioid overdose. Ann Emerg Med. 2020;75(1):13-17. doi:10.1016/j.annemergmed.2019.04.020
9. CA Bridge. Updated 2021. Accessed July 1, 2022. https://cabridge.org
10. Penney L, Miake-Lye I, Lewis D, et al. Proceedings from the 11th annual conference on the science of dissemination and implementation: S72 spreading VA’s emergency department-rapid access clinics (ED-RAC) intervention: key factors for success. Implementation Sci. 2019;14(suppl 1). doi:10.1186/s13012-019-0878-2
11. Hu T, Snider-Alder M, Nijmeh L, Pyle A. Buprenorphine/naloxone induction in a Canadian emergency department with rapid access to community-based addictions providers. CJEM. 2019;21(4):492-498. doi:10.1017/cem.2019.24
12. US Department of Health and Human Services. Practice Guidelines for the Administration of Buprenorphine for Treating Opioid Use Disorder. Federal Register. Accessed July 1, 2022. https://www.federalregister.gov/documents/2021/04/28/2021-08961/practice-guidelines-for-the-administration-of-buprenorphine-for-treating-opioid-use-disorder
13. D’Onofrio G, Melnick ER, Hawk KF. Improve access to care for opioid use disorder: a call to eliminate the x-waiver requirement now. Ann Emerg Med. 2021;78(2):220-222. doi:10.1016/j.annemergmed.2021.03.023
14. Dieujuste N, Johnson-Koenke R, Celedon M, et al. Provider perceptions of opioid safety measures in VHA emergency department and urgent care centers. Fed Pract. 2021;38(9):412-419. doi:10.12788/fp.0179
15. Hawk KF, D’Onofrio G, Chawarski MC, et al. Barriers and faciliatators to clinician readiness to provide emergency department-initiated buprenorphine. JAMA Netw Open. 2020;3(5):e204561. doi:10.1001/jamanetworkopen.2020.4561
16. Lowenstein M, Kilaru A, Perrone J, et al. Barriers and facilitators for emergency department initiation of buprenorphine: a physician survey. Am J Emerg Med. 2019;37(9):1787-1790. doi:10.1016/j.ajem.2019.02.025
17. Srivastava A, Kahan M, Leece P, McAndrew A. Buprenorphine unobserved “home” induction: a survey of Ontario’s addiction physicians. Addic Sci Clin Pract. 2019;14(1):18. doi:10.1186/s13722-019-0146-4
18. The Management of Substance Use Disorders Work Group. VA/DoD Clinical Practice Guideline for the Management of Substance Use Disorders. Version 4.0. US Department of Veterans Affairs. 2021. Accessed July 1, 2022. https://www.healthquality.va.gov/guidelines/MH/sud/VADoDSUDCPG.pdf
19. Patnode CD, Perdue LA, Rushkin M, et al. Screening for unhealthy drug use updated evidence report and systematic review for the US Preventive Services Task Force. JAMA. 2020;323(22):2310-2338. doi:10.1001/jama.2019.21381
20. Coles S, Vosooney A. Evidence lacking to support universal unhealthy drug use screening. Am Fam Physician. 2021;103(2):72-73.
21. Sahota PK, Sharstry S, Mukamel DB, et al. Screening emergency department patients for opioid drug use: a qualitative systematic review. Addict Behav. 2018;85:139-146. doi:10.1016/j.addbeh.2018.05.022
Longer interval between bevacizumab exposure and CRC surgery could prevent additional mortality risk
Key clinical point: Emergent vs elective surgery after bevacizumab exposure was associated with a significantly higher mortality in patients with metastatic colorectal cancer (mCRC), with an interval of >4 weeks between the surgery and last bevacizumab infusion being protective against additional mortality risk.
Major finding: Emergent vs elective surgery was an independent risk factor for 60-day mortality (adjusted odds ratio [aOR] 1.912; 95% CI 1.220-2.996), with elective surgery within 29-56 days (aOR 0.522; 95% CI 0.310-0.877) and >57 days (aOR 0.540; 95% CI 0.333-0.873) vs within 28 days of last bevacizumab infusion being associated with a significantly lower 60-day mortality.
Study details: The data come from a retrospective study including 2047 patients with mCRC who underwent surgery (emergent 13.78%; elective 86.22%) within 1 year of receiving bevacizumab.
Disclosures: This study was funded by Kaohsiung Veterans General Hospital, Taiwan. No conflicts of interest were declared.
Source: Chen YH et al. Mortality of patients with metastatic colorectal cancer who received elective or emergent operation after exposure to bevacizumab: A nationwide database study. Eur J Surg Oncol. 2022 (Oct 1). Doi: 10.1016/j.ejso.2022.09.018
Emergency readmission frequent after curative intent CRC surgery
Key clinical point: Every 1 in 5 patients who underwent colorectal cancer (CRC) surgery with curative intent required emergency 30-day readmission, with some requiring extended readmission and surgical re-intervention, highlighting the benefits of additional post-discharge follow-ups in patients at a high risk for preventable readmissions.
Major finding: Overall, 20.5% (95% CI 20.1%-20.9%) of patients were readmitted within 30 days of discharge after CRC surgery with curative intent, with 12.2% (95% CI 11.9%-12.5%) and 1.9% (95% CI 1.8-2.1%) requiring post-discharge extended re-admission and surgical readmission, respectively. A very shortlength of stay (odds ratio [OR] 2.36; 95% CI 1.95-2.87) and an American Society of Anesthesiology score ≥IV (OR 2.21; 95% CI, 1.56-3.13) were the strongest predictors of emergency 30-day readmission.
Study details: The findings are from a retrospective study including 40,782 patients who had undergone colorectal tumor resection with curative intent.
Disclosures: This study was financially supported by local institutional sources. The authors declared no conflicts of interest.
Source: Clausen J et al. Incidence and clinical predictors of 30-day emergency readmission after colorectal cancer surgery - A nationwide cohort study. Colorectal Dis. 2022 (Oct 5). Doi: 10.1111/codi.16349
Liver-dominant mCRC: Prognostic factors for efficacy outcomes after TARE
Key clinical point: Aspartate transaminase to platelet ratio index (APRI), international normalized ratio (INR), and albumin-bilirubin (ALBI) grade can help identify patients with liver-dominant metastatic colorectal cancer (mCRC) who may benefit from transarterial radioembolization (TARE) with 90Y resin microspheres.
Major finding: APRI >0.40 independently predicted worse overall survival (OS; hazard ratio [HR] 2.25; P < .0001), progression-free survival (PFS; HR 1.42; P = .0416), and hepatic PFS (HR 1.50; P = .0207). The other independent predictors for worse OS and hepatic PFS were an INR <1 (HR 1.66; P = .0091) and ALBI grade 3 (HR 5.29; P = .0075), respectively.
Study details: This study evaluated 237 patients with liver-dominant mCRC from the prospective observational CIRSE Registry for SIR-Spheres Therapy (CIRT) study scheduled to receive TARE with 90Y resin microspheres.
Disclosures: The CIRT study was funded by SIRTEX Medical Europe GmbH (Bonn, Germany). Some authors declared receiving grants, consulting fees, honoraria, or lecture and travel support from or serving on data safety monitoring or advisory boards for various sources, including SIRTEX.
Source: Schaefer N et al, on behalf of the CIRT Principal Investigators. Prognostic factors for effectiveness outcomes after transarterial radioembolization in metastatic colorectal cancer: Results from the multicentre observational study CIRT. Clin Colorectal Cancer. 2022 (Sep 19). Doi: 10.1016/j.clcc.2022.09.002
Preoperative vitamin D levels may influence outcomes in patients with localized CRC undergoing resection
Key clinical point: Higher preoperative vitamin D levels were associated with lower odds of a complicated surgical course in older patients with colorectal cancer (CRC) undergoing resection, with deficient preoperative vitamin D levels being associated with poor overall survival irrespective of age.
Major finding: Higher vitamin D levels prior to resection were associated with a reduced risk for major complications after surgery in patients aged ≥70 years (odd ratio 0.51; 95% CI 0.27-0.95) but not in those aged <70 years, with deficient (<25 nmol/L) vs sufficient (>50 nmol/L) levels of vitamin D being associated with reduced survival irrespective of age (hazard ratio 3.39; P = .019).
Study details: Findings are from an ongoing prospective cohort study including 398 patients with stage I-III CRC who underwent surgical resection, of which 208 patients were aged ≥70 years.
Disclosures: This study was funded by the VELUX Foundation, Denmark, and the Beckett Foundation, Denmark. The authors declared no competing financial interests.
Source: Dolin TG et al. Preoperative plasma vitamin D in patients with localized colorectal cancer: Age-dependent association with inflammation, postoperative complications, and survival. Eur J Surg Oncol. 2022 (Sep 10). Doi: 10.1016/j.ejso.2022.08.040
Special CRC prevention efforts may focus on population with higher serum uric acid levels
Key clinical point: A significant positive association exists between elevated levels of serum uric acid (SUA) and the risk for incident colorectal cancer (CRC).
Major finding: SUA levels and the risk for CRC showed a positive dose-response and linear association (P = .004), with the risk for incident CRC being 1.55-fold higher among participants in the highest vs lowest tertile of SUA levels (adjusted hazard ratio 1.55; P = .019).
Study details: Findings are from an ongoing prospective cohort study including 93,356 cancer-free participants.
Disclosures: This study did not report any source of funding. The authors declared no conflicts of interest.
Source: Li W et al. The relationship between serum uric acid and colorectal cancer: A prospective cohort study. Sci Rep. 2022;12:16677 (Oct 6). Doi: 10.1038/s41598-022-20357-7