User login
The Journal of Clinical Outcomes Management® is an independent, peer-reviewed journal offering evidence-based, practical information for improving the quality, safety, and value of health care.
div[contains(@class, 'header__large-screen')]
div[contains(@class, 'read-next-article')]
div[contains(@class, 'nav-primary')]
nav[contains(@class, 'nav-primary')]
section[contains(@class, 'footer-nav-section-wrapper')]
footer[@id='footer']
div[contains(@class, 'main-prefix')]
section[contains(@class, 'nav-hidden')]
div[contains(@class, 'ce-card-content')]
nav[contains(@class, 'nav-ce-stack')]
Variants spur new FDA guidance on COVID vaccines, tests, drugs
The United States is currently facing three main variant threats, according to the Centers for Disease Control and Prevention: B.1.1.7, which originated in the United Kingdom; B.1.351 from South Africa; and the P.1 variant, which originated in Brazil.
Acting FDA Commissioner Janet Woodcock, MD, said on a telephone press briefing call Feb. 22 that the FDA has already been communicating with individual manufacturers as they assess the variants’ effect on their products, but these guidelines are issued for the sake of transparency and to welcome scientific input.
Tailoring may be necessary
Dr. Woodcock emphasized that, “at this time, available data suggest the FDA-authorized vaccines are effective in protecting circulating strains of SARS-CoV-2.” However, in the event the strains start to show resistance, it may be necessary to tailor the vaccine to the variant.
In that case, effectiveness of a modified vaccine should be determined by data from clinical immunogenicity studies, which would compare a recipient’s immune response with virus variants induced by the modified vaccine against the immune response to the authorized vaccine, the guidance states.
Manufacturers should also study the vaccine in both nonvaccinated people and people fully vaccinated with the authorized vaccine, according to the guidance.
Peter Marks, MD, PhD, director of the FDA’s Center for Biologics Evaluation and Research, said on the call that the clinical immunogenicity data is needed to understand, for instance, whether a new vaccine strain is able to cover the new and old strain or whether it just covers the new strain. Information is also needed to understand whether the modified vaccine, when given to someone fully vaccinated, will still promote a positive response without introducing safety concerns.
Further discussions will be necessary to decide whether future modified vaccines may be authorized without the need for clinical studies.
Variants and testing
The FDA’s updated guidance for test developers, Policy for Evaluating Impact of Viral Mutations on COVID-19 Tests, includes information that test performance can be influenced by the sequence of the variant, prevalence of the variant in the population, or design of the test. For example, molecular tests designed to detect multiple SARS-CoV-2 genetic targets are less susceptible to genetic variants than tests designed to detect a single genetic target.
The FDA already issued a safety alert on Jan. 8 to caution that genetic mutations to the virus in a patient sample can potentially change the performance of a diagnostic test. The FDA identified three tests that had been granted emergency-use authorization (EUA) that are known to be affected.
However, Dr. Woodcock said on the call, “at this time the impact does not appear to be significant.”
Updated guidance for therapeutics
The FDA has issued new guidance on the effect of variants on monoclonal antibody treatments.
“The FDA is aware that some of the monoclonal antibodies that have been authorized are less active against some of the SARS-CoV-2 variants that have emerged,” the FDA noted in its press release. “This guidance provides recommendations on efficient approaches to the generation of ... manufacturing and controls data that could potentially support an EUA for monoclonal antibody products that may be effective against emerging variants.”
While the FDA is monitoring the effects of variants, manufacturers bear a lot of the responsibility as well.
The FDA added: “With these guidances, the FDA is encouraging developers of drugs or biological products targeting SARS-CoV-2 to continuously monitor genomic databases for emerging SARS-CoV-2 variants and evaluate phenotypically any specific variants in the product target that are becoming prevalent or could potentially impact its activity.”
Dr.Woodcock added that “we urge all Americans to continue to get tested, get their vaccines when available, and follow important heath measures such as handwashing, masking, and social distancing.”
A version of this article first appeared on Medscape.com.
Pandemic puts patients with psoriatic disease off seeking medical help
More than half of respondents to a recent survey looking at how the COVID-19 pandemic has affected people with psoriasis or psoriatic arthritis (PsA) said that they had avoided seeking medical care in person with a doctor or at a hospital.

Moreover, around a quarter had their appointment with a rheumatologist canceled, rescheduled, or conducted virtually. Another 1 in 10 had their treatment plan disrupted, and 6% had to change or stop treatment entirely.
The mental health impact of living with these conditions during the pandemic was also notable, said Rachael Manion, the executive director of the Canadian Association of Psoriasis Patients (CAPP), which conducted the survey in collaboration with the Canadian Psoriasis Network (CPN) and Unmasking Psoriasis.
“It’s important to know that there have been a lot of different impacts of the pandemic on people living with psoriatic arthritis and psoriasis. Mental health in particular has had a really big hit as a result,” she said at the Canadian Arthritis Research Conference: Research with Impact.
“About half of the people who responded to our survey noted that their mental health was ‘worse’ or ‘much worse’ during the pandemic,” she said at the meeting, which was sponsored by the Arthritis Society, the Canadian Rheumatology Association, and Canada’s Institute of Musculoskeletal Health and Arthritis. Anxiety and feelings of isolation were reported by a respective 57% and 58% of respondents, and 40% reported depression.
“We can compare that to our earlier information around depression,” Ms. Manion said, which showed that, prior to the pandemic, 24% of people with psoriasis and 23% of those with PsA had said they experienced depression.
“What I found alarming looking at these results was that about a third of people were experiencing despair. Now that’s a really big, scary, overwhelming emotion that has a lot of burden on your mental health,” Ms. Manion said.
Despite the substantial effects on mental health, only 29% of respondents said they had been able to access mental health services during the pandemic.
To look at the impact of the COVID-19 pandemic on the psoriasis and PsA community in Canada, three patient advocacy groups – CAPP, CPN, and Unmasking Psoriasis – codeveloped a survey to look at the disease experience before and after the start of the COVID-19 pandemic. The survey was performed once, with 830 respondents providing information on their lives with psoriasis or PsA in the months before the start of the pandemic and at the time they were surveyed in September and October 2020.
Most of the survey respondents lived in Ontario, Quebec, British Columbia, or Alberta, although other provinces or territories were represented. Almost all respondents (96%) had psoriasis, and 60% also had PsA.
Pre-COVID, nearly half (49%) of patients said that they had not been seen by a rheumatologist, and 39% had not seen a dermatologist for treatment. Asked why, 56% and 27%, respectively, had not been referred, 9% and 15% said they had no specialist located nearby, and 7% and 10% stated that the wait list was too long.
“This tells us that there’s a lot more work that can be done and a lot more education of general practitioners and family medicine professionals about the benefits and the value of specialized care for psoriatic arthritis,” Ms. Manion suggested.
Before the pandemic, joint pain was occurring in 88% of patients, stiffness in 71%, and joint swelling in 67%. Disease flares or sudden periods of worsening occurred on a daily basis for 17%, and around one in five (21%) experienced multiple flares every month.
Prepandemic data also highlighted the negative impact that living with psoriasis or PsA has on people’s ability to sleep, interactions and intimacy with others, and on their school or work lives.
During the pandemic, around a quarter (26%) of respondents said they had worse or much worse access to employment, as well as its benefits such as a stable income (24%). A minority of respondent also described worse access to prescription medication (15%) and over-the-counter medication (13%).
“There are all kinds of things going on for patients in our community: changes to their work, changes to their drug coverage, their ability to sleep and sleep well, their mental health, and their ability to access care and treatments as part of their disease management,” Ms. Manion said.
Her final message to health care professionals was: “I just want to encourage you to continue to check in with your patients about what their experiences have been during the pandemic, and to really consider those impacts as you’re working with them to manage their disease.”
The survey received funding support from AbbVie, Bausch Health, Boehringer Ingelheim, Janssen, LEO Pharma, and Novartis.
More than half of respondents to a recent survey looking at how the COVID-19 pandemic has affected people with psoriasis or psoriatic arthritis (PsA) said that they had avoided seeking medical care in person with a doctor or at a hospital.
Moreover, around a quarter had their appointment with a rheumatologist canceled, rescheduled, or conducted virtually. Another 1 in 10 had their treatment plan disrupted, and 6% had to change or stop treatment entirely.
The mental health impact of living with these conditions during the pandemic was also notable, said Rachael Manion, the executive director of the Canadian Association of Psoriasis Patients (CAPP), which conducted the survey in collaboration with the Canadian Psoriasis Network (CPN) and Unmasking Psoriasis.
“It’s important to know that there have been a lot of different impacts of the pandemic on people living with psoriatic arthritis and psoriasis. Mental health in particular has had a really big hit as a result,” she said at the Canadian Arthritis Research Conference: Research with Impact.
“About half of the people who responded to our survey noted that their mental health was ‘worse’ or ‘much worse’ during the pandemic,” she said at the meeting, which was sponsored by the Arthritis Society, the Canadian Rheumatology Association, and Canada’s Institute of Musculoskeletal Health and Arthritis. Anxiety and feelings of isolation were reported by a respective 57% and 58% of respondents, and 40% reported depression.
“We can compare that to our earlier information around depression,” Ms. Manion said, which showed that, prior to the pandemic, 24% of people with psoriasis and 23% of those with PsA had said they experienced depression.
“What I found alarming looking at these results was that about a third of people were experiencing despair. Now that’s a really big, scary, overwhelming emotion that has a lot of burden on your mental health,” Ms. Manion said.
Despite the substantial effects on mental health, only 29% of respondents said they had been able to access mental health services during the pandemic.
To look at the impact of the COVID-19 pandemic on the psoriasis and PsA community in Canada, three patient advocacy groups – CAPP, CPN, and Unmasking Psoriasis – codeveloped a survey to look at the disease experience before and after the start of the COVID-19 pandemic. The survey was performed once, with 830 respondents providing information on their lives with psoriasis or PsA in the months before the start of the pandemic and at the time they were surveyed in September and October 2020.
Most of the survey respondents lived in Ontario, Quebec, British Columbia, or Alberta, although other provinces or territories were represented. Almost all respondents (96%) had psoriasis, and 60% also had PsA.
Pre-COVID, nearly half (49%) of patients said that they had not been seen by a rheumatologist, and 39% had not seen a dermatologist for treatment. Asked why, 56% and 27%, respectively, had not been referred, 9% and 15% said they had no specialist located nearby, and 7% and 10% stated that the wait list was too long.
“This tells us that there’s a lot more work that can be done and a lot more education of general practitioners and family medicine professionals about the benefits and the value of specialized care for psoriatic arthritis,” Ms. Manion suggested.
Before the pandemic, joint pain was occurring in 88% of patients, stiffness in 71%, and joint swelling in 67%. Disease flares or sudden periods of worsening occurred on a daily basis for 17%, and around one in five (21%) experienced multiple flares every month.
Prepandemic data also highlighted the negative impact that living with psoriasis or PsA has on people’s ability to sleep, interactions and intimacy with others, and on their school or work lives.
During the pandemic, around a quarter (26%) of respondents said they had worse or much worse access to employment, as well as its benefits such as a stable income (24%). A minority of respondent also described worse access to prescription medication (15%) and over-the-counter medication (13%).
“There are all kinds of things going on for patients in our community: changes to their work, changes to their drug coverage, their ability to sleep and sleep well, their mental health, and their ability to access care and treatments as part of their disease management,” Ms. Manion said.
Her final message to health care professionals was: “I just want to encourage you to continue to check in with your patients about what their experiences have been during the pandemic, and to really consider those impacts as you’re working with them to manage their disease.”
The survey received funding support from AbbVie, Bausch Health, Boehringer Ingelheim, Janssen, LEO Pharma, and Novartis.
FROM CARC 2021
New light cast on type 2 MI aims to sharpen diagnosis, therapy
The hospital and postdischarge course of patients diagnosed with type 2 myocardial infarction, triggered when myocardial oxygen demand outstrips supply, differs in telling ways from those with the more common atherothrombotic type 1 MI, suggests a new registry analysis that aims to lift a cloud of confusion surrounding their management.
The observational study of more than 250,000 patients with either form of MI, said to be the largest of its kind, points to widespread unfamiliarity with distinctions between the two, and the diagnostic and therapeutic implications of misclassification. It suggests, in particular, that type 2 MI may be grossly underdiagnosed and undertreated.
The minority of patients with type 2 MI were more likely female and to have heart failure (HF), renal disease, valve disease, or atrial fibrillation, and less likely to have a lipid disorder, compared with those with type 1 MI. They were one-fifth as likely to be referred for coronary angiography and 20 times less likely to undergo revascularization.
Indeed, only about 2% of the type 2 cohort ultimately underwent percutaneous coronary intervention (PCI) or coronary bypass surgery (CABG). Yet the analysis suggests that cardiovascular risk climbs regardless of MI type and that in patients with type 2 MI, coronary revascularization might well cut the risk of death in half over the short term.
There were also disparities in clinical outcomes in the analysis, based on data from the final 3 months of 2017 in the Nationwide Readmissions Database, which reportedly documents almost 60% of hospitalizations in the United States.
For example, those with type 1 or type 2 MI – as characterized in the then-current third Universal Definition of Myocardial Infarction and today’s UDMI-4 – were comparably at risk for both 30-day all-cause readmission and HF readmission. But type 2 patients were less likely to die in the hospital or be readmitted within 30 days for recurrent MI.
Revascularization uncertainty
Importantly, the study’s 3-month observation period immediately followed the debut of a code specifically for type 2 MI in the ICD-10-CM system.
Type 2 accounted for about 15% of MIs during that period, the percentage climbing sharply from the first to the third month. That suggests clinicians were still getting used to the code during the early weeks, “undercoding” for type-2 MI at first but less so after some experience, Cian P. McCarthy, MB, BCh, BAO, Massachusetts General Hospital, Boston, said in an interview.
“I can imagine that as people become more aware of the coding, using it more often, the proportion of type 2 MI relative to the total MI cases will probably be much higher,” said McCarthy, lead author on the study published online Feb. 15, 2021, in the Journal of the American College of Cardiology.
What had been understood about type 2 MI came largely from single-center studies, he said. This “first national study of type-2 MI in the United States” sought to determine whether such findings are hospital specific or “representative of what people are doing nationally.”
The new analysis largely confirms that patients with type 2 MI are typically burdened with multiple comorbidities, Dr. McCarthy said, but also suggests that type 2 often was, and likely still is, incorrectly classified as type 1. So, it was “surprising” that they were rarely referred for angiography. “Only 1 in 50 received revascularization.”
Those diagnosed with type-2 MI were far less likely to receive coronary angiography (10.9% vs. 57.3%), PCI (1.7% vs. 38.5%), or CABG (0.4% vs. 7.8%) (P < .001 for all three differences), the report noted.
That, Dr. McCarthy said, “clearly shows that clinicians are uncertain about whether revascularization is beneficial” in type 2 MI.
Coding not in sync with UDMI
If there is confusion in practice about differentiating type 2 from type 1 MI, it likely has multiple sources, and one may be inconsistencies in how the UDMI and relevant ICD codes are applied in practice.
For example, the coding mandate is always to classify ST-segment elevation MI and non-STEMI as type 1, yet UDMI-4 itself states that a type 2 MI may be either STEMI or non-STEMI, noted Dr. McCarthy, as well as an editorial accompanying the report.
“It also can be difficult at times to distinguish type 2 MI from the diagnosis of myocardial injury,” both of which are partly defined by elevated cardiac troponin (cTn), adds the editorial, from Kristian Thygesen, MD, DSc, Aarhus (Denmark) University Hospital, Aarhus, Denmark, and Allan S. Jaffe, MD, Mayo Clinic, Rochester, Minn.
Crucially, but potentially sometimes overlooked, a diagnosis of infarction requires evidence of ischemia along with the biomarker elevation, whereas myocardial injury is defined by raised cTn without evidence of ischemia. Yet there is no ICD-10-CM code for “nonischemic myocardial injury,” Dr. Thygesen and Dr. Jaffe observed.
“Instead, the new ICD-10-CM coding includes a proxy called ‘non-MI troponin elevation due to an underlying cause,’ ” they wrote. “Unfortunately, although some have advocated using this code for myocardial injury, it is not specific for an elevated cTn value and could represent any abnormal laboratory measurements.” The code could be “misleading” and thus worsen the potential for miscoding and “misattribution of MI diagnoses.”
In the current study, 84.6% of the cohort were classified with type 1 MI, 14.8% with type 2, and 0.6% with both types. Of those with type 1 MI, 22.1% had STEMI, 76.4% had non-STEMI with the remainder “unspecified.”
“I think the introduction of ICD codes for type-2 MI is helpful in that we can study type 2 MI more broadly, across institutions, and try and get a better sense of its outcomes and how these patients are treated,” Dr. McCarthy said. But the coding system’s deficiencies may often lead to misclassification of patients. Especially, patients with type 2 STEMI may be miscoded as having type-1 STEMI, and those with only myocardial injury may be miscoded as having type 2 MI.
Most type 2 MI is a complication
A profile of patients with type 2 MI may be helpful for making distinctions. The analysis showed that, compared with patients with type 1 MI, they were slightly but significantly older and more likely to have clinical depression, alcohol or other substance abuse disorder, and to be female. They also had more heart failure (27.9% vs. 10.9%), kidney disease (35.7% vs. 25.7%), atrial fibrillation (31% vs. 21%), and anemia (26% vs. 18.9%) (P < .001 for all differences).
Type 2 patients were less likely to have CV risk factors usually associated with plaque instability and atherothrombosis, including a history of smoking, dyslipidemia, MI, PCI, or CABG (P < .001 for all differences), the group noted.
Of the 37,765 patients with type 2 MI, 91% received the diagnosis as secondary to another condition, including sepsis in 24.5%, hypertension in 16.9%, arrhythmias in 6.1%, respiratory failure in 4.3%, and pneumonia in 2.8% of cases.
In multivariate analyses, patients with type 2 MI, compared with type 1, showed lower risks of in-hospital death and readmission for MI within 30 days. Their 30-day risks of readmission from any cause and from MI were similar.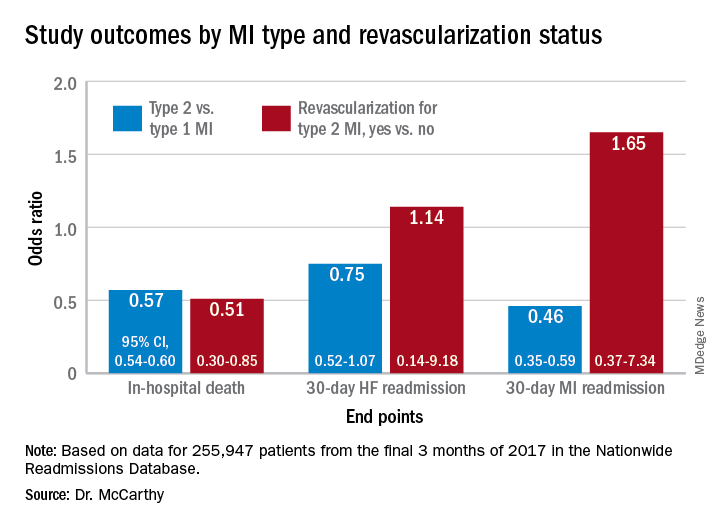
In-hospital mortality was lower for patients with type 2 MI who underwent revascularization, compared with those who did not, “but they were a very select, small proportion of the patient group. I would say there are probably unmeasured confounders,” Dr. McCarthy said.
“There’s a real kind of equipoise, so I think we desperately need a trial to guide us on whether revascularization is beneficial.”
Dr. McCarthy has disclosed no relevant financial relationships. Dr. Thygesen disclosed no relevant financial relationships. Dr. Jaffe disclosed serving as a consultant for Abbott, Roche, Siemens, Beckman-Coulter, Radiometer, ET Healthcare, Sphingotec, Brava, Quidel, Amgen, Novartis, and Medscape for educational activities.
A version of this article first appeared on Medscape.com.
Oxford launches COVID-19 vaccine study in children
Oxford University is starting a COVID-19 vaccine study with children and young adults aged between 6 and 17 years.
At Oxford and three partner sites in London, Southampton, and Bristol, the phase 2 clinical trial will test whether kids and teens have a good immune response to the AstraZeneca vaccine. Previous trials have shown that the shot is safe in children.
“While most children are relatively unaffected by coronavirus and are unlikely to become unwell with the infection, it is important to establish the safety and immune response to the vaccine in children and young people as some children may benefit from vaccination,” Andrew Pollard, PhD, the chief investigator for the trial and a professor of pediatric infection and immunity at Oxford, said in a statement.
The new trial will enroll 300 volunteers, with up to 240 receiving the vaccine. The control group will receive a meningitis vaccine, which is safe in children and produces similar side effects to the COVID-19 vaccine, such as a sore arm.
COVID-19 vaccine trials have included children over age 12, so this marks the youngest group to be tested so far. Pfizer, Moderna, and Janssen have announced plans to start trials in younger children this spring, according to the Washington Post. Widespread vaccination in children likely won’t occur until 2022, the newspaper reported.
The trial launched on Feb. 12, and the first vaccinations are expected by the end of the month. Parents can visit Oxford’s COVID-19 Vaccine Trial website to sign their children up for the study.
“This study will play an important role in helping to protect children in the future,” Grace Li, a pediatric clinical research fellow for the Oxford Vaccine Group, said in the statement.
“We’ve already seen that the vaccine is safe and effective in adults, and our understanding of how children are affected by the coronavirus continues to evolve,” she said.
A version of this article first appeared on WebMD.com.
Large study finds trans men on testosterone at risk for blood clots
Over 10% of transgender men (females transitioning to male) who take testosterone develop high hematocrit levels that could put them at greater risk for a thrombotic event, and the largest increase in levels occurs in the first year after starting therapy, a new Dutch study indicates.
Erythrocytosis, defined as a hematocrit greater than 0.50 L/L, is a potentially serious side effect of testosterone therapy, say Milou Cecilia Madsen, MD, and colleagues in their article published online Feb. 18, 2021, in the Journal of Clinical Endocrinology & Metabolism.
When hematocrit was measured twice, 11.1% of the cohort of 1073 trans men had levels in excess of 0.50 L/L over a 20-year follow-up.
“Erythrocytosis is common in transgender men treated with testosterone, especially in those who smoke, have [a] high BMI [body mass index], and [who] use testosterone injections,” Dr. Madsen, of the VU University Medical Center Amsterdam, said in a statement from the Endocrine Society.
“A reasonable first step in the care of transgender men with high red blood cells while on testosterone is to advise them to quit smoking, switch injectable testosterone to gel, and, if BMI is high, to lose weight,” she added.
First large study of testosterone in trans men with 20-year follow-up
Transgender men often undergo testosterone therapy as part of gender-affirming treatment.
Secondary erythrocytosis, a condition where the body makes too many red blood cells, is a common side effect of testosterone therapy that can increase the risk of thrombolic events, heart attack, and stroke, Dr. Madsen and colleagues explained.
This is the first study of a large cohort of trans men taking testosterone therapy followed for up to 20 years. Because of the large sample size, statistical analysis with many determinants could be performed. And because of the long follow-up, a clear time relation between initiation of testosterone therapy and hematocrit could be studied, they noted.
Participants were part of the Amsterdam Cohort of Gender Dysphoria study, a large cohort of individuals seen at the Center of Expertise on Gender Dysphoria at Amsterdam University Medical Center between 1972 and 2015.
Laboratory measurements taken between 2004 and 2018 were available for analysis. Trans men visited the center every 3-6 months during their first year of testosterone therapy and were then monitored every year or every other year.
Long-acting undecanoate injection was associated with the highest risk of a hematocrit level greater than 0.50 L/L, and the risk of erythrocytosis in those who took long-acting intramuscular injections was about threefold higher, compared with testosterone gel (adjusted odds ratio, 3.1).
In contrast, short-acting ester injections and oral administration of testosterone had a similar risk for erythrocytosis, as did testosterone gel.
Other determinants of elevated hematocrit included smoking, medical history of a number of comorbid conditions, and older age on initiation of testosterone.
In contrast, “higher testosterone levels per se were not associated with an increased odds of hematocrit greater than 0.50 L/L”, the authors noted.
Current advice for trans men based on old guidance for hypogonadism
The authors said that current advice for trans men is based on recommendations for testosterone-treated hypogonadal cis men (those assigned male at birth) from 2008, which advises a hematocrit greater than 0.50 L/L has a moderate to high risk of adverse outcome. For levels greater than 0.54 L/L, cessation of testosterone therapy, a dose reduction, or therapeutic phlebotomy to reduce the risk of adverse events is advised. For levels 0.50-0.54 L/L, no clear advice is given.
But questions remain as to whether these guidelines are applicable to trans men because the duration of testosterone therapy is much longer in trans men and hormone treatment often cannot be discontinued without causing distress.
Meanwhile, hematology guidelines indicate an upper limit for hematocrit for cis females of 0.48 L/L.
“It could be argued that the upper limit for cis females should be applied, as trans men are born with female genetics,” the authors said. “This is a subject for further research.”
Duration of testosterone therapy impacts risk of erythrocytosis
In the study, the researchers found that longer duration of testosterone therapy increased the risk of developing hematocrit levels greater than 0.50 L/L. For example, after 1 year, the cumulative incidence of erythrocytosis was 8%; after 10 years, it was 38%; and after 14 years, it was 50%.
Until more specific guidance is developed for trans men, if hematocrit levels rise to 0.50-0.54 L/L, the researchers suggested taking “reasonable” steps to prevent a further increase:
- Consider switching patients who use injectable testosterone to transdermal products.
- Advise patients with a BMI greater than 25 kg/m2 to lose weight to attain a BMI of 18.5-25.
- Advise patients to stop smoking.
- Pursue treatment optimization for chronic lung disease or sleep apnea.
The study had no external funding. The authors reported no relevant financial relationships.
A version of this article first appeared on Medscape.com.
Influenza-related maternal morbidity has more than doubled over 15 years
Despite slightly decreasing numbers of pregnant women hospitalized with influenza, the rate of morbidity among those who do have influenza has substantially increased from 2000 to 2015, likely due in part to an increase in comorbidities.
, according to findings from a new study presented at the Pregnancy Meeting, sponsored by the Society for Maternal-Fetal Medicine.
Pregnant women were also at substantially greater risk of sepsis or shock, needing mechanical ventilation, and acute respiratory distress syndrome. In fact, rates of overall severe maternal morbidity and of influenza-related complications have increased in maternal patients with influenza by more than 200% from 2000 to 2015.
“It was striking to see how the rate of delivery hospitalizations complicated by influenza has remained relatively stable with a small decline, but the rates of severe maternal morbidity were increasing and so markedly among those with influenza,” Timothy Wen, MD, MPH, a maternal-fetal medicine clinical fellow at the University of California, San Francisco, said in an interview. “The findings suggest that influenza may either be a contributor to rising rates of severe maternal morbidity or synergistically amplifying existing comorbidities to worsen outcomes,” he said during his presentation.
The increased risk of influenza complications in pregnant women became particularly apparent during the 2009-2010 H1N1 influenza pandemic. “Physiologic and immunologic changes predispose pregnant patients to higher risk for complications such as pneumonia, intensive care unit admission, and inpatient mortality,” Dr. Wen told attendees. But data have been scarce since H1N1.
The researchers conducted a cross-sectional analysis of delivery hospitalizations from 2000 to 2015 using the Nationwide Inpatient Sample, which includes about 20% of all U.S. inpatient hospitalizations from all payers. They looked at all maternal patients aged 15-54 who had a diagnosis of influenza. In looking at potential associations between influenza and morbidity, they adjusted their calculations for maternal age, payer status, median income, and race/ethnicity as well as the hospital factors of location, teaching status, and region. They also adjusted for a dozen clinical factors.
Of 62.7 million hospitalizations, 0.67% involved severe maternal mortality, including the following influenza complications:
- 0.02% with shock/sepsis.
- 0.01% needing mechanical ventilation.
- 0.04% with acute respiratory distress syndrome.
The 182,228 patients with influenza represented a rate of 29 cases per 10,000 deliveries, and 2.09% of them involved severe maternal morbidity, compared to severe maternal morbidity in just 0.66% of deliveries without influenza.
When looking specifically at rates of shock/sepsis, mechanical ventilation, and acute respiratory distress syndrome, the data revealed similar trends, with substantially higher proportions of patients with influenza experiencing these complications compared to maternal patients without influenza. For example, 0.3% of patients with influenza developed shock/sepsis whereas only 0.04% of patients without influenza did. Acute respiratory distress syndrome was similarly more common in patients with flu (0.45% vs. 0.04%), as was the need for mechanical ventilation (0.09% vs. 0.01%).
During the 15-year study period, the rate of maternal hospitalizations with influenza infections declined about 1.5%, from 30 to 24 per 10,000 deliveries. But trends with severe maternal morbidity in patients with influenza went in the other direction, increasing more than 200% over 15 years, from 100 to 342 cases of severe maternal morbidity per 10,000 patients with influenza. An increase also occurred in patients without influenza, but it was more modest, a nearly 50% increase, from 53 to 79 cases per 10,000 hospitalizations.
From year to year, severe maternal morbidity increased 5.3% annually among hospitalizations with influenza – more than twice the rate of a 2.4% annual increase among hospitalizations without influenza.
The researchers found that influenza is linked to twice the risk of severe maternal morbidity (adjusted risk ratio [aRR] = 2.08, P < .01). There were similarly higher risks with influenza of sepsis/shock (aRR = 3.23), mechanical ventilation (aRR = 6.04), and acute respiratory distress syndrome (aRR = 5.76; all P < .01).
Among the possible reasons for the increase in influenza morbidity – despite a decrease in influenza infections in this population – is the increase in the medical complexity of the patient population, Dr. Wen said.
“Patients who are getting pregnant today likely have more comorbid conditions (chronic hypertension, obesity, pregestational diabetes mellitus, etc.) than they did decades prior,” Dr. Wen said. “Clinically, it means that we have a baseline patient population at a higher risk of susceptibility for influenza and its complications.”
Maternal influenza immunization rates have meanwhile stagnated, Dr. Wen added. Influenza “is something that we know is preventable, or at least mitigated, by a vaccine,” he said. “Our results serve as a reminder for clinicians to continue counseling on the importance of influenza vaccination among pregnant patients, and even in those who are planning to become pregnant.”
He said these findings suggest the need for a low threshold for treating pregnant patients who have influenza symptoms with over-the-counter therapies or closely monitoring them.
Adetola Louis-Jacques, MD, of the University of South Florida, Tampa, found the increase in morbidity in those with flu particularly unexpected and concerning.

“What surprised me was the big difference in how severe maternal morbidity rates increased over time in the influenza group compared to the group without influenza,” Dr. Louis-Jacques, who moderated the session, said in an interview. She agreed with Dr. Wen that the findings underscore the benefits of immunization.
“The study means we should reinforce to mothers how important the vaccine is. It’s critical,” Dr. Louis-Jacques said. “We should encourage mothers to get it and focus on educating women, trying to understand and allay [any concerns about the vaccine] and reinforce the importance of flu vaccination to decrease the likelihood of these mothers getting pretty sick during pregnancy.”
Dr. Wen and Dr. Louis-Jacques had no disclosures.
Despite slightly decreasing numbers of pregnant women hospitalized with influenza, the rate of morbidity among those who do have influenza has substantially increased from 2000 to 2015, likely due in part to an increase in comorbidities.
, according to findings from a new study presented at the Pregnancy Meeting, sponsored by the Society for Maternal-Fetal Medicine.
Pregnant women were also at substantially greater risk of sepsis or shock, needing mechanical ventilation, and acute respiratory distress syndrome. In fact, rates of overall severe maternal morbidity and of influenza-related complications have increased in maternal patients with influenza by more than 200% from 2000 to 2015.
“It was striking to see how the rate of delivery hospitalizations complicated by influenza has remained relatively stable with a small decline, but the rates of severe maternal morbidity were increasing and so markedly among those with influenza,” Timothy Wen, MD, MPH, a maternal-fetal medicine clinical fellow at the University of California, San Francisco, said in an interview. “The findings suggest that influenza may either be a contributor to rising rates of severe maternal morbidity or synergistically amplifying existing comorbidities to worsen outcomes,” he said during his presentation.
The increased risk of influenza complications in pregnant women became particularly apparent during the 2009-2010 H1N1 influenza pandemic. “Physiologic and immunologic changes predispose pregnant patients to higher risk for complications such as pneumonia, intensive care unit admission, and inpatient mortality,” Dr. Wen told attendees. But data have been scarce since H1N1.
The researchers conducted a cross-sectional analysis of delivery hospitalizations from 2000 to 2015 using the Nationwide Inpatient Sample, which includes about 20% of all U.S. inpatient hospitalizations from all payers. They looked at all maternal patients aged 15-54 who had a diagnosis of influenza. In looking at potential associations between influenza and morbidity, they adjusted their calculations for maternal age, payer status, median income, and race/ethnicity as well as the hospital factors of location, teaching status, and region. They also adjusted for a dozen clinical factors.
Of 62.7 million hospitalizations, 0.67% involved severe maternal mortality, including the following influenza complications:
- 0.02% with shock/sepsis.
- 0.01% needing mechanical ventilation.
- 0.04% with acute respiratory distress syndrome.
The 182,228 patients with influenza represented a rate of 29 cases per 10,000 deliveries, and 2.09% of them involved severe maternal morbidity, compared to severe maternal morbidity in just 0.66% of deliveries without influenza.
When looking specifically at rates of shock/sepsis, mechanical ventilation, and acute respiratory distress syndrome, the data revealed similar trends, with substantially higher proportions of patients with influenza experiencing these complications compared to maternal patients without influenza. For example, 0.3% of patients with influenza developed shock/sepsis whereas only 0.04% of patients without influenza did. Acute respiratory distress syndrome was similarly more common in patients with flu (0.45% vs. 0.04%), as was the need for mechanical ventilation (0.09% vs. 0.01%).
During the 15-year study period, the rate of maternal hospitalizations with influenza infections declined about 1.5%, from 30 to 24 per 10,000 deliveries. But trends with severe maternal morbidity in patients with influenza went in the other direction, increasing more than 200% over 15 years, from 100 to 342 cases of severe maternal morbidity per 10,000 patients with influenza. An increase also occurred in patients without influenza, but it was more modest, a nearly 50% increase, from 53 to 79 cases per 10,000 hospitalizations.
From year to year, severe maternal morbidity increased 5.3% annually among hospitalizations with influenza – more than twice the rate of a 2.4% annual increase among hospitalizations without influenza.
The researchers found that influenza is linked to twice the risk of severe maternal morbidity (adjusted risk ratio [aRR] = 2.08, P < .01). There were similarly higher risks with influenza of sepsis/shock (aRR = 3.23), mechanical ventilation (aRR = 6.04), and acute respiratory distress syndrome (aRR = 5.76; all P < .01).
Among the possible reasons for the increase in influenza morbidity – despite a decrease in influenza infections in this population – is the increase in the medical complexity of the patient population, Dr. Wen said.
“Patients who are getting pregnant today likely have more comorbid conditions (chronic hypertension, obesity, pregestational diabetes mellitus, etc.) than they did decades prior,” Dr. Wen said. “Clinically, it means that we have a baseline patient population at a higher risk of susceptibility for influenza and its complications.”
Maternal influenza immunization rates have meanwhile stagnated, Dr. Wen added. Influenza “is something that we know is preventable, or at least mitigated, by a vaccine,” he said. “Our results serve as a reminder for clinicians to continue counseling on the importance of influenza vaccination among pregnant patients, and even in those who are planning to become pregnant.”
He said these findings suggest the need for a low threshold for treating pregnant patients who have influenza symptoms with over-the-counter therapies or closely monitoring them.
Adetola Louis-Jacques, MD, of the University of South Florida, Tampa, found the increase in morbidity in those with flu particularly unexpected and concerning.
“What surprised me was the big difference in how severe maternal morbidity rates increased over time in the influenza group compared to the group without influenza,” Dr. Louis-Jacques, who moderated the session, said in an interview. She agreed with Dr. Wen that the findings underscore the benefits of immunization.
“The study means we should reinforce to mothers how important the vaccine is. It’s critical,” Dr. Louis-Jacques said. “We should encourage mothers to get it and focus on educating women, trying to understand and allay [any concerns about the vaccine] and reinforce the importance of flu vaccination to decrease the likelihood of these mothers getting pretty sick during pregnancy.”
Dr. Wen and Dr. Louis-Jacques had no disclosures.
FROM THE PREGNANCY MEETING

Short sleep predicts incident dementia and all-cause mortality
More evidence has emerged linking sleep deficiency, dementia, and mortality.

“Sleep disturbance and insufficiency have been shown to be associated with both the development and progression of Alzheimer’s disease and with all-cause mortality,” wrote Rebecca S. Robbins, PhD, of Brigham and Women’s Hospital, Boston, and colleagues. However, research on this topic has yielded conflicting results, and “few studies have included a comprehensive set of sleep characteristics in a single examination of incident dementia and all-cause mortality.”
In a study published in Aging, the researchers identified 2,812 adults aged 65 years and older from the National Health and Aging Trends Study (NHATS), a nationally representative longitudinal study of Medicare beneficiaries aged 65 years and older in the United States.
Participants completed surveys about sleep disturbance and duration in 2013 (1,575 individuals) and in 2014 (1,237 individuals), and the researchers examined the relationship between sleep disturbance and deficiency and incident dementia and all-cause mortality over the next 5 years. The average age of the study participants was 76.9 years, 60% were women, and 72% were White.
Overall, approximately 60% of the participants reported never or rarely having problems with alertness, approximately half said that they rarely or never napped, and more than half said they fell asleep in 15 minutes or less. Approximately 70% rated their sleep quality as good or very good, and more than 90% said they rarely or never snored.
The researchers examined the relationships between sleep characteristics and the development of incident dementia over 5 years. In a fully adjusted Cox multivariate analysis, individuals who slept 5 hours or less per night had approximately twice the risk for incident dementia as those who slept longer (hazard ratio, 2.04); risk of dementia also was higher among those who took 30 minutes or longer to fall asleep (HR, 1.45).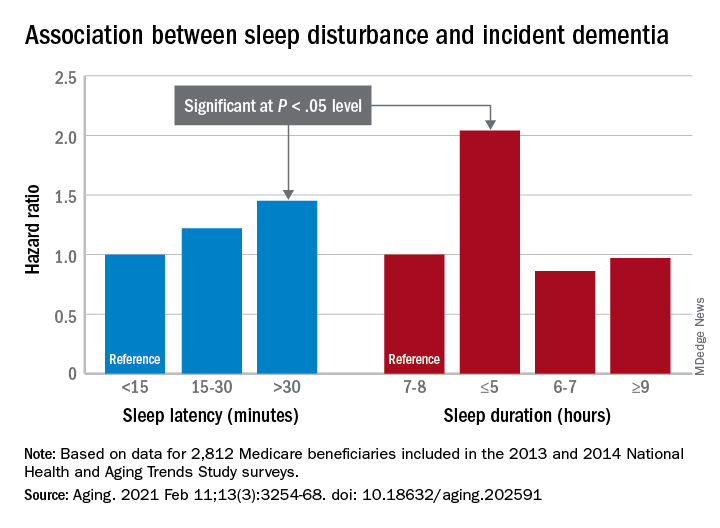
In addition, the risk of all-cause mortality was significantly higher among individuals who reported difficulty maintaining alertness some days or most days/every day (HR, 1.49 and HR, 1.65, respectively), routinely napping some days or most days/every day (HR, 1.38 and HR, 1.73, respectively), poor or very poor sleep quality (HR, 1.75), and sleeping 5 hours or less each night (HR, 2.38).
The study findings were limited by several factors including a population representing only one-quarter of the NHATS cohort, which prevented nationally representative estimates, the availability of only 2 years of sleep data, and small sample size for certain response categories, the researchers noted.
However, “our study offers a contribution to the literature on sleep among aging populations in its assessment of incident dementia and all-cause mortality and a range of sleep characteristics among older adults,” they said. In particular, “short sleep duration was a strong predictor of both incident dementia and all-cause mortality, suggesting this may be a sleep characteristic that is important – over and above the other predictors – of adverse outcomes among older adults,” and future areas for research include the development of novel behavioral interventions to improve sleep in this population.
The study was supported in part by the National Institute for Occupational Safety and Health; the National Heart, Lung, and Blood Institute; the National Institute on Aging; and the Brigham Research Institute Fund to Sustain Research Excellence. Lead author Dr. Robbins disclosed fees from Denihan Hospitality, Rituals Cosmetics, Dagmejan, Asystem, and SleepCycle. Several coauthors disclosed relationships with multiple pharmaceutical companies, and support from various philanthropic organizations.
More evidence has emerged linking sleep deficiency, dementia, and mortality.
“Sleep disturbance and insufficiency have been shown to be associated with both the development and progression of Alzheimer’s disease and with all-cause mortality,” wrote Rebecca S. Robbins, PhD, of Brigham and Women’s Hospital, Boston, and colleagues. However, research on this topic has yielded conflicting results, and “few studies have included a comprehensive set of sleep characteristics in a single examination of incident dementia and all-cause mortality.”
In a study published in Aging, the researchers identified 2,812 adults aged 65 years and older from the National Health and Aging Trends Study (NHATS), a nationally representative longitudinal study of Medicare beneficiaries aged 65 years and older in the United States.
Participants completed surveys about sleep disturbance and duration in 2013 (1,575 individuals) and in 2014 (1,237 individuals), and the researchers examined the relationship between sleep disturbance and deficiency and incident dementia and all-cause mortality over the next 5 years. The average age of the study participants was 76.9 years, 60% were women, and 72% were White.
Overall, approximately 60% of the participants reported never or rarely having problems with alertness, approximately half said that they rarely or never napped, and more than half said they fell asleep in 15 minutes or less. Approximately 70% rated their sleep quality as good or very good, and more than 90% said they rarely or never snored.
The researchers examined the relationships between sleep characteristics and the development of incident dementia over 5 years. In a fully adjusted Cox multivariate analysis, individuals who slept 5 hours or less per night had approximately twice the risk for incident dementia as those who slept longer (hazard ratio, 2.04); risk of dementia also was higher among those who took 30 minutes or longer to fall asleep (HR, 1.45).
In addition, the risk of all-cause mortality was significantly higher among individuals who reported difficulty maintaining alertness some days or most days/every day (HR, 1.49 and HR, 1.65, respectively), routinely napping some days or most days/every day (HR, 1.38 and HR, 1.73, respectively), poor or very poor sleep quality (HR, 1.75), and sleeping 5 hours or less each night (HR, 2.38).
The study findings were limited by several factors including a population representing only one-quarter of the NHATS cohort, which prevented nationally representative estimates, the availability of only 2 years of sleep data, and small sample size for certain response categories, the researchers noted.
However, “our study offers a contribution to the literature on sleep among aging populations in its assessment of incident dementia and all-cause mortality and a range of sleep characteristics among older adults,” they said. In particular, “short sleep duration was a strong predictor of both incident dementia and all-cause mortality, suggesting this may be a sleep characteristic that is important – over and above the other predictors – of adverse outcomes among older adults,” and future areas for research include the development of novel behavioral interventions to improve sleep in this population.
The study was supported in part by the National Institute for Occupational Safety and Health; the National Heart, Lung, and Blood Institute; the National Institute on Aging; and the Brigham Research Institute Fund to Sustain Research Excellence. Lead author Dr. Robbins disclosed fees from Denihan Hospitality, Rituals Cosmetics, Dagmejan, Asystem, and SleepCycle. Several coauthors disclosed relationships with multiple pharmaceutical companies, and support from various philanthropic organizations.
FROM AGING
CDC chief lays out attack plan for COVID variants
earlier this week.
As part of JAMA’s Q&A series with JAMA editor in chief Howard Bauchner, MD, Dr. Walensky referenced the blueprint she coathored with Anthony Fauci, MD, the nation’s top infectious disease expert, and Henry T. Walke, MD, MPH, of the CDC, which was published on Feb. 17 in JAMA.
In the viewpoint article, they explain that the Department of Health & Human Services has established the SARS-CoV-2 Interagency Group to improve coordination among the CDC, the National Institutes of Health, the Food and Drug Administration, the Biomedical Advanced Research and Development Authority, the Department of Agriculture, and the Department of Defense.
Dr. Walensky said the first objective is to reinforce vigilance regarding public health mitigation strategies to decrease the amount of virus that’s circulating.
As part of that strategy, she said, the CDC strongly urges against nonessential travel.
In addition, public health leaders are working on a surveillance system to better understand the SARS-CoV-2 variants. That will take ramping up genome sequencing of the SARS-CoV-2 virus and ensuring that sampling is geographically representative.
She said the CDC is partnering with state health labs to obtain about 750 samples every week and is teaming up with commercial labs and academic centers to obtain an interim target of 6,000 samples per week.
She acknowledged the United States “is not where we need to be” with sequencing but has come a long way since January. At that time, they were sequencing 250 samples every week; they are currently sequencing thousands each week.
Data analysis is another concern: “We need to be able to understand at the basic science level what the information means,” Dr. Walensky said.
Researchers aren’t sure how the variants might affect use of convalescent plasma or monoclonal antibody treatments. It is expected that 5% of persons who are vaccinated against COVID-19 will nevertheless contract the disease. Sequencing will help answer whether such persons who have been vaccinated and who subsequently contract the virus are among those 5% or whether have been infected by a variant that evades the vaccine.
Accelerating vaccine administration globally and in the United States is essential, Dr. Walensky said.
As of Feb. 17, 56 million doses had been administered in the United States.
Top three threats
She updated the numbers on the three biggest variant threats.
Regarding B.1.1.7, which originated in the United Kingdom, she said: “So far, we’ve had over 1,200 cases in 41 states.” She noted that the variant is likely to be about 50% more transmissible and 30% to 50% more virulent.
“So far, it looks like that strain doesn’t have any real decrease in susceptibility to our vaccines,” she said.
The strain from South Africa (B.1.351) has been found in 19 cases in the United States.
The P.1. variant, which originated in Brazil, has been identified in two cases in two states.
Outlook for March and April
Dr. Bauchner asked Dr. Walensky what she envisions for March and April. He noted that public optimism is high in light of the continued reductions in COVID-19 case numbers, hospitalizations, and deaths, as well as the fact that warmer weather is coming and that more vaccinations are on the horizon.
“While I really am hopeful for what could happen in March and April,” Dr. Walensky said, “I really do know that this could go bad so fast. We saw it in November. We saw it in December.”
CDC models have projected that, by March, the more transmissible B.1.1.7 strain is likely to be the dominant strain, she reiterated.
“I worry that it will be spring, and we will all have had enough,” Dr. Walensky said. She noted that some states are already relaxing mask mandates.
“Around that time, life will look and feel a little better, and the motivation for those who might be vaccine hesitant may be diminished,” she said.
Dr. Bauchner also asked her to weigh in on whether a third vaccine, from Johnson & Johnson (J&J), may soon gain FDA emergency-use authorization – and whether its lower expected efficacy rate may result in a tiered system of vaccinations, with higher-risk populations receiving the more efficacious vaccines.
Dr. Walensky said more data are needed before that question can be answered.
“It may very well be that the data point us to the best populations in which to use this vaccine,” she said.
In phase 3 data, the J&J vaccine was shown to be 72% effective in the United States for moderate to severe disease.
Dr. Walensky said it’s important to remember that the projected efficacy for that vaccine is higher than that for the flu shot as well as many other vaccines currently in use for other diseases.
She said it also has several advantages. The vaccine has less-stringent storage requirements, requires just one dose, and protects against hospitalization and death, although it’s less efficacious in protecting against contracting the disease.
“I think many people would opt to get that one if they could get it sooner,” she said.
A version of this article first appeared on Medscape.com.
Opioids prescribed for diabetic neuropathy pain, against advice
Prescriptions for opioids as a first-line treatment for painful diabetic peripheral neuropathy (DPN) outnumbered those for other medications between 2014 and 2018, despite the fact that the former is not recommended, new research indicates.
“We know that for any kind of chronic pain, opioids are not ideal. They’re not very effective for chronic pain in general, and they’re definitely not safe,” senior author Rozalina G. McCoy, MD, an endocrinologist and primary care clinician at the Mayo Clinic in Rochester, Minn., told this news organization.
That’s true even for severe DPN pain or painful exacerbations, she added.
“There’s a myth that opioids are the strongest pain meds possible ... For painful neuropathic pain, duloxetine [Cymbalta], pregabalin [Lyrica], and gabapentin [Neurontin] are the most effective pain medications based on multiple studies and extensive experience using them,” she explained. “But I think the public perception is that opioids are the strongest. When a patient comes with severe pain, I think there’s that kind of gut feeling that if the pain is severe, I need to give opioids.”
What’s more, she noted, “evidence is emerging for other harms, not only the potential for dependency and potential overdose, but also the potential for opioid-induced hyperalgesia. Opioids themselves can cause chronic pain. When we think about using opioids for chronic pain, we are really shooting ourselves in the foot. We’re going to harm patients.”
The American Diabetes Association DPN guidelines essentially say as much, advising opioids only as a tertiary option for refractory pain, she observed.
The new findings, from a retrospective study of Mayo Clinic electronic health data, were published online in JAMA Network Open by Jungwei Fan, PhD, also of Mayo Clinic, and colleagues.
Are fewer patients with DPN receiving any treatment now?
The data also reveal that, while opioid prescribing dropped over the study period, there wasn’t a comparable rise in prescriptions of recommended pain medications, suggesting that recent efforts to minimize opioid prescribing may have resulted in less overall treatment of significant pain. (The study had to be stopped in 2018 when Mayo switched to a new electronic health record system, Dr. McCoy explained.)
“The proportion of opioids among new prescriptions has been decreasing. I’m hopeful that the rates are even lower now than they were 2 years ago. What was concerning to me was the proportion of people receiving treatment overall had gone down,” Dr. McCoy noted.
“So, while it’s great that opioids aren’t being used, it’s doubtful that people with DPN are any less symptomatic. So I worry that there’s a proportion of patients who have pain who aren’t getting the treatment they need just because we don’t want to give them opioids. There are other options,” Dr. McCoy said, including nonpharmacologic approaches.
Opioids dominated in new-onset DPN prescribing during 2014-2018
The study involved 3,495 adults with newly diagnosed DPN from all three Mayo Clinic locations in Rochester, Minn.; Phoenix, Ariz.; and Jacksonville, Fla. during the period 2014-2018. Of those, 40.2% (1,406) were prescribed a new pain medication after diagnosis. However, that proportion dropped from 45.6% in 2014 to 35.2% in 2018.
The odds of initiating any treatment were significantly greater among patients with depression (odds ratio, 1.61), arthritis (OR, 1.21), and back pain (OR, 1.34), but decreased over time among all patients.
Among those receiving drug treatment, opioids were prescribed to 43.8%, whereas guideline-recommended medications (gabapentin, pregabalin, and serotonin norepinephrine reuptake inhibitors including duloxetine) were prescribed to 42.9%.
Another 20.6% received medications deemed “acceptable” for treating neuropathic pain, including topical analgesics, tricyclic antidepressants, and other anticonvulsants.
Males were significantly more likely than females to receive opioids (OR, 1.26), while individuals diagnosed with comorbid fibromyalgia were less likely (OR, 0.67). Those with comorbid arthritis were less likely to receive recommended DPN medications (OR, 0.76).
Use of opioids was 29% less likely in 2018, compared with 2014, although this difference did not achieve significance. Similarly, use of recommended medications was 25% more likely in 2018, compared with 2014, also not a significant difference.
Dr. McCoy offers clinical pearls for treating pain in DPN
Clinically, Dr. McCoy said that she individualizes treatment for painful DPN.
“I tend to use duloxetine if the patient also has a mood disorder including depression or anxiety, because it can also help with that. Gabapentin can also be helpful for radiculopathy or for chronic low-back pain. It can even help with degenerative joint disease like arthritis of the knees. So, you maximize benefit if you use one drug to treat multiple things.”
All three recommended medications are generic now, although pregabalin still tends to be more expensive, she noted. Gabapentin can cause drowsiness, which makes it ideal for a patient with insomnia but much less so for a long-haul truck driver. Duloxetine doesn’t cause sleepiness. Pregabalin can, but less so than gabapentin.
“I think that’s why it’s so important to talk to your patient and ask how the neuropathy is affecting them. What other comorbidities do they have? What is their life like? I think you have to figure out what drug works for each individual person.”
Importantly, she advised, if one of the three doesn’t work, stop it and try another. “It doesn’t mean that none of these meds work. All three should be tried to see if they give relief.”
Nonpharmacologic measures such as cognitive behavioral therapy, acupuncture, or physical therapy may help some patients as well.
Supplements such as vitamin B12 – which can also help with metformin-induced B12 deficiency – or alpha-lipoic acid may also be worth a try as long as the patient is made aware of potential risks, she noted.
Dr. McCoy hopes to repeat this study using national data. “I don’t think this is isolated to Mayo ... I think it affects all practices,” she said.
Since the study, “we [Mayo Clinic] have implemented practice changes to limit use of opioids for chronic pain ... so I hope it’s getting better. It’s important to be aware of our patterns in prescribing.”
The study was funded by the National Institute of Diabetes and Digestive and Kidney Diseases. Dr. McCoy reported receiving grants from the AARP Quality Measure Innovation program through a collaboration with OptumLabs and the Mayo Clinic’s Robert D. and Patricia E. Kern Center for the Science of Health Care Delivery.
A version of this article first appeared on Medscape.com.
FDA clears novel daytime device for obstructive sleep apnea
![]()
eXciteOSA (Signifier Medical Technologies) is a prescription-only, neuromuscular stimulation device designed to improve tongue muscle function, which, over time, can help prevent the tongue from collapsing backwards and obstructing the airway during sleep, the FDA said.
The eXciteOSA mouthpiece has four electrodes that deliver a series of electrical pulses with rest periods in between. Two electrodes are located above the tongue and two are located below the tongue.
The patient uses the device for 20 minutes once a day while awake for 6 weeks, and once a week thereafter. It is indicated for adults aged 18 and older with snoring and mild OSA.
OSA is marked by the recurring collapse of the upper airways during sleep, intermittently reducing or completely blocking airflow. Common symptoms include snoring, restless sleep and daytime sleepiness. Untreated OSA can lead to serious complications such as cardiovascular disease and cognitive and behavioral disorders.
Continuous positive airway pressure therapy, administered through a face mask that is worn while asleep, is a first-line treatment for OSA.
The eXciteOSA device “offers a new option for the thousands of individuals who experience snoring or mild sleep apnea,” Malvina Eydelman, MD, director, FDA Office of Ophthalmic, Anesthesia, Respiratory, ENT, and Dental Devices, said in a news release.
The FDA reviewed data on the safety and effectiveness of the eXciteOSA device in 115 patients with snoring, including 48 patients with snoring and mild OSA. All patients used the device for 20 minutes once a day for 6 weeks, then stopped using it for 2 weeks before they were reassessed.
Overall, the percentage of time spent snoring at levels louder than 40 decibels was reduced by more than 20% in 87 out of the 115 patients.
In the subset of patients with snoring and mild OSA, the average apnea-hypopnea index score was reduced by 48%, from 10.21 to 5.27, in 41 of 48 patients. Mild OSA is defined as an AHI score greater than 5 but less than 15.
The most common adverse events were excessive salivation, tongue or tooth discomfort, tongue tingling, dental filling sensitivity, metallic taste, gagging, and tight jaw.
Before using the eXciteOSA device, patients should receive a comprehensive dental examination, the FDA said.
The device should not be used in patients with pacemakers or implanted pacing leads, or women who are pregnant. The device is also contraindicated in patients with temporary or permanent implants, dental braces, intraoral metal prosthesis/restorations, or ulcerations in or around the mouth.
The eXciteOSA device was approved under the de novo premarket review pathway for new low- to moderate-risk devices. More information on the device is available online.
A version of this article first appeared on Medscape.com.