User login
The Journal of Clinical Outcomes Management® is an independent, peer-reviewed journal offering evidence-based, practical information for improving the quality, safety, and value of health care.
div[contains(@class, 'header__large-screen')]
div[contains(@class, 'read-next-article')]
div[contains(@class, 'nav-primary')]
nav[contains(@class, 'nav-primary')]
section[contains(@class, 'footer-nav-section-wrapper')]
footer[@id='footer']
div[contains(@class, 'main-prefix')]
section[contains(@class, 'nav-hidden')]
div[contains(@class, 'ce-card-content')]
nav[contains(@class, 'nav-ce-stack')]
Variant found in NYC, Northeast
, according to CNN.

The variant, called B.1.526, has appeared in diverse neighborhoods in New York City and is “scattered in the Northeast,” the researchers said.
“We observed a steady increase in the detection rate from late December to mid-February, with an alarming rise to 12.7% in the past two weeks,” researchers from Columbia University Medical Center wrote in a report, which was published as a preprint Feb. 25.
On Feb. 22, the team released another preprint about the B.1.1.7 and B.1.351 variants first identified in the United Kingdom and South Africa, respectively, which also mentions the B.1.526 variant in the U.S. Neither report has been peer reviewed.
Viruses mutate often, and several coronavirus variants have been identified and followed during the pandemic. Not all mutations are significant or are necessarily more contagious or dangerous. Researchers have been tracking the B.1.526 variant in the U.S. to find out if there are significant mutations that could be a cause for concern.
In the most recent preprints, the variant appears to have the same mutation found in B.1.351, called E484K, which may allow the virus to evade vaccines and the body’s natural immune response. The E484K mutation has shown up in at least 59 lines of the coronavirus, the research team said. That means the virus is evolving independently across the country and world, which could give the virus an advantage.
“A concern is that it might be beginning to overtake other strains, just like the U.K. and South African variants,” David Ho, MD, the lead study author and director of the Aaron Diamond AIDS Research Center at Columbia, told CNN.
“However, we don’t have enough data to firm up this point now,” he said.
In a separate preprint posted Feb. 23, a research team at the California Institute of Technology developed a software tool that noticed the rise of B.1.526 in the New York region. The preprint hasn’t yet been peer reviewed.
“It appears that the frequency of lineage B.1.526 has increased rapidly in New York,” they wrote.
Both teams also reported on another variant, called B.1.427/B.1.429, which appears to be increasing in California. The variant could be more contagious and cause more severe disease, they said, but the research is still in the early stages.
Researchers at the University of California, San Francisco, have tested virus samples from recent outbreaks in California and also found that the variant is becoming more common. The variant didn’t appear in samples from September but was in half of the samples by late January. It has a different pattern of mutations than other variants, and one called L452R may affect the spike protein on the virus and allow it attach to cells more easily.
“Our data shows that this is likely the key mutation that makes this variant more infectious,” Charles Chiu, MD, associate director of the clinical microbiology lab at UCSF, told CNN.
The team also noticed that patients with a B.1.427/B.1.429 infection had more severe COVID-19 cases and needed more oxygen, CNN reported. The team plans to post a preprint once public health officials in San Francisco review the report.
Right now, the CDC provides public data for three variants: B.1.1.7, B.1.351, and P.1, which was first identified in Brazil. The U.S. has reported 1,881 B.1.1.7 cases across 45 states, 46 B.1.351 cases in 14 states, and five P.1 cases in four states, according to a CDC tally as of Feb. 23.
At the moment, lab officials aren’t able to tell patients or doctors whether someone has been infected by a variant, according to Kaiser Health News. High-level labs conduct genomic sequencing on samples and aren’t able to communicate information back to individual people.
But the Association of Public Health Laboratories and public health officials in several states are pushing for federal authorization of a test that could sequence the full genome and notify doctors. The test could be available in coming weeks, the news outlet reported.
A version of this article first appeared on WebMD.com.
, according to CNN.
The variant, called B.1.526, has appeared in diverse neighborhoods in New York City and is “scattered in the Northeast,” the researchers said.
“We observed a steady increase in the detection rate from late December to mid-February, with an alarming rise to 12.7% in the past two weeks,” researchers from Columbia University Medical Center wrote in a report, which was published as a preprint Feb. 25.
On Feb. 22, the team released another preprint about the B.1.1.7 and B.1.351 variants first identified in the United Kingdom and South Africa, respectively, which also mentions the B.1.526 variant in the U.S. Neither report has been peer reviewed.
Viruses mutate often, and several coronavirus variants have been identified and followed during the pandemic. Not all mutations are significant or are necessarily more contagious or dangerous. Researchers have been tracking the B.1.526 variant in the U.S. to find out if there are significant mutations that could be a cause for concern.
In the most recent preprints, the variant appears to have the same mutation found in B.1.351, called E484K, which may allow the virus to evade vaccines and the body’s natural immune response. The E484K mutation has shown up in at least 59 lines of the coronavirus, the research team said. That means the virus is evolving independently across the country and world, which could give the virus an advantage.
“A concern is that it might be beginning to overtake other strains, just like the U.K. and South African variants,” David Ho, MD, the lead study author and director of the Aaron Diamond AIDS Research Center at Columbia, told CNN.
“However, we don’t have enough data to firm up this point now,” he said.
In a separate preprint posted Feb. 23, a research team at the California Institute of Technology developed a software tool that noticed the rise of B.1.526 in the New York region. The preprint hasn’t yet been peer reviewed.
“It appears that the frequency of lineage B.1.526 has increased rapidly in New York,” they wrote.
Both teams also reported on another variant, called B.1.427/B.1.429, which appears to be increasing in California. The variant could be more contagious and cause more severe disease, they said, but the research is still in the early stages.
Researchers at the University of California, San Francisco, have tested virus samples from recent outbreaks in California and also found that the variant is becoming more common. The variant didn’t appear in samples from September but was in half of the samples by late January. It has a different pattern of mutations than other variants, and one called L452R may affect the spike protein on the virus and allow it attach to cells more easily.
“Our data shows that this is likely the key mutation that makes this variant more infectious,” Charles Chiu, MD, associate director of the clinical microbiology lab at UCSF, told CNN.
The team also noticed that patients with a B.1.427/B.1.429 infection had more severe COVID-19 cases and needed more oxygen, CNN reported. The team plans to post a preprint once public health officials in San Francisco review the report.
Right now, the CDC provides public data for three variants: B.1.1.7, B.1.351, and P.1, which was first identified in Brazil. The U.S. has reported 1,881 B.1.1.7 cases across 45 states, 46 B.1.351 cases in 14 states, and five P.1 cases in four states, according to a CDC tally as of Feb. 23.
At the moment, lab officials aren’t able to tell patients or doctors whether someone has been infected by a variant, according to Kaiser Health News. High-level labs conduct genomic sequencing on samples and aren’t able to communicate information back to individual people.
But the Association of Public Health Laboratories and public health officials in several states are pushing for federal authorization of a test that could sequence the full genome and notify doctors. The test could be available in coming weeks, the news outlet reported.
A version of this article first appeared on WebMD.com.
Core feature of frontotemporal dementia may aid diagnosis
(FTD) in findings that may help physicians make this difficult diagnosis that affects adults in their prime.
“The assessment of WMH can aid differential diagnosis of bvFTD [behavioral-variant FTD] against other neurodegenerative conditions in the absence of vascular risk factors, especially when considering their spatial distribution,” said senior author Ramón Landin-Romero, PhD, Appenzeller Neuroscience Fellow, Frontotemporal Dementia Research Group, University of Sydney.
“Clinicians can ask for specific sequences in routine MRI scans to visually detect WMH,” said Dr. Landin-Romero, who is also a senior lecturer in the School of Psychology and Brain and Mind Center.
The study was published online Feb. 17 in Neurology.
Difficult diagnosis
“FTD is a collection of unrecognized young-onset (before age 65) dementia syndromes that affect people in their prime,” said Dr. Landin-Romero. He added that heterogeneity in progression trajectories and symptoms, which can include changes in behavior and personality, language impairments, and psychosis, make it a difficult disease to diagnose.
“As such, our research was motivated by the need of sensitive and specific biomarkers of FTD, which are urgently needed to aid diagnosis, prognosis, and treatment development,” he said.
Previous research has been limited; there have only been a “handful” of cohort and case studies and studies involving individuals with mutations in one FTD-causative gene.
FTD is genetically and pathologically complex, and there has been no clear correlation between genetic mutations/underlying pathology and clinical presentation, Dr. Landin-Romero said.
WMH are common in older individuals and are linked to increased risk for cognitive impairment and dementia. Traditionally, they have been associated with vascular risk factors, such as smoking and diabetes. “But the presentation of WMH in FTD and its associations with the severity of symptoms and brain atrophy across FTD symptoms remains to be established,” said Dr. Landin-Romero.
Higher disease severity
To explore the possible association, the researchers studied 129 patients with either bvFTD (n = 64; mean age, 64 years) or Alzheimer’s disease (n = 65; mean age, 64.66 years).
Neuropsychological assessments, medical and neurologic examinations, clinical interview, and structural brain MRI were conducted for all patients, who were compared with 66 age-, sex-, and education-matched healthy control persons (mean age, 64.69 years).
Some participants in the FTD, Alzheimer’s disease, and healthy control groups (n = 54, 44, and 26, respectively) also underwent genetic screening. Postmortem pathology findings were available for a small number of FTD and Alzheimer’s disease participants (n = 13 and 5, respectively).
The medical history included lifestyle and cardiovascular risk factors, as well as other health and neurologic conditions and medication history. Hypertension, hypercholesterolemia, diabetes, and smoking were used to assess vascular risk.
The FTD and Alzheimer’s disease groups did not differ with regard to disease duration (3.55 years; standard deviation, 1.75, and 3.24 years; SD, 1.59, respectively). However, disease severity was significantly higher among those with FTD than among those with Alzheimer’s disease, as measured by the FTD Rating Scale Rasch score (–0.52; SD, 1.28, vs. 0.78; SD, 1.55; P < .001).
Compared with healthy controls, patients in the FTD and Alzheimer’s disease groups scored significantly lower on the Addenbrooke’s Cognitive Examination–Revised (ACE-R) or ACE-III scale. Patients with Alzheimer’s disease showed “disproportionately larger deficits” in memory and visuospatial processing, compared with those with FTD, whereas those with FTD performed significantly worse than those with Alzheimer’s disease in the fluency subdomain.
A larger number of patients in the FTD group screened positive for genetic abnormalities than in the Alzheimer’s disease group; no participants in the healthy control group had genetic mutations.
Unexpected findings
Mean WMH volume was significantly higher in participants with FTD than in participants with Alzheimer’s disease and in healthy controls (mean, 0.76 mL, 0.40 mL, and 0.12 mL respectively). These larger volumes contributed to greater disease severity and cortical atrophy. Moreover, disease severity was “found to be a strong predictor of WMH volume in FTD,” the authors stated. Among patients with FTD, WMH volumes did not differ significantly with regard to genetic mutation status or presence of strong family history.
After controlling for age, vascular risk did not significantly predict WMH volume in the FTD group (P = .16); however, that did not hold true in the Alzheimer’s disease group.
Increased WMH were associated with anterior brain regions in FTD and with posterior brain regions in Alzheimer’s disease. In both disorders, higher WMH volume in the corpus callosum was associated with poorer cognitive performance in the domain of attention.
“The spatial distribution of WMH mirrored patterns of brain atrophy in FTD and Alzheimer’s disease, was partially independent of cortical degeneration, and was correlated with cognitive deficits,” said Dr. Landin-Romero.
The findings were not what he and his research colleagues expected. “We were expecting that the amounts of WMH would be similar in FTD and Alzheimer’s disease, but we actually found higher levels in participants with FTD,” he said. Additionally, he anticipated that patients with either FTD or Alzheimer’s disease who had more severe disease would have more WMH, but that finding only held true for people with FTD.
“In sum, our findings show that WMH are a core feature of FTD and Alzheimer’s disease that can contribute to cognitive problems, and not simply as a marker of vascular disease,” said Dr. Landin-Romero.
Major research contribution
Commenting on the study, Jordi Matias-Guiu, PhD, MD, of the department of neurology, Hospital Clinico, San Carlos, Spain, considers the study to be a “great contribution to the field.” Dr. Matias-Guiu, who was not involved with the study, said that WMH “do not necessarily mean vascular pathology, and atrophy may partially explain these abnormalities and should be taken into account in the interpretation of brain MRI.
“WMH are present in both Alzheimer’s disease and FTD and are relevant to cognitive deficits found in these disorders,” he added.
The study was funded by grants from the National Health and Medical Research Council of Australia, the Dementia Research Team, and the ARC Center of Excellence in Cognition and Its Disorders. Dr. Landin-Romero is supported by the Appenzeller Neuroscience Fellowship in Alzheimer’s Disease and the ARC Center of Excellence in Cognition and Its Disorders Memory Program. The other authors’ disclosures are listed on the original article. Dr. Matias-Guiu reports no relevant financial relationships.
A version of this article first appeared on Medscape.com.
Inflammatory immune findings likely in acute schizophrenia, MDD, bipolar
Researchers have come a long way in understanding the link between acute inflammation and treatment-resistant depression, but more work needs to be done, according to Mark Hyman Rapaport, MD.

“Inflammation has been a hot topic in the past decade, both because of its impact in medical disorders and in psychiatric disorders,” Dr. Rapaport, CEO of the Huntsman Mental Health Institute in Salt Lake City, Utah, said during an annual psychopharmacology update held by the Nevada Psychiatric Association. “We run into difficulty with chronic inflammation, which we see with rheumatic disorders, and when we think of metabolic syndrome and obesity.”
The immune system helps to control energy regulation and neuroendocrine function in acute inflammation and chronic inflammatory diseases. “We see a variety of effects on the central nervous system or liver function or on homeostasis of the body,” said Dr. Rapaport, who also chairs the department of psychiatry at the University of Utah, also in Salt Lake City. “These are all normal and necessary to channel energy to the immune system in order to fight what’s necessary in acute inflammatory response.”
A chronic state of inflammation can result in prolonged allocation of fuels to the immune system, tissue inflammation, and a chronically aberrant immune reaction, he continued. This can cause depressive symptoms/fatigue, anorexia, malnutrition, muscle wasting, cachectic obesity, insulin resistance, dyslipidemia, increased adipose tissue in the proximity of inflammatory lesion, alterations of steroid hormone axes, elevated sympathetic tone, hypertension, decreased parasympathetic tone, inflammation-related anemia, and osteopenia. “So, chronic inflammation has a lot of long-term sequelae that are detrimental,” he said.
Both physical stress and psychological stress also cause an inflammatory state. After looking at the medical literature, Dr. Rapaport and colleagues began to wonder whether inflammation and immune activation associated with psychiatric disorders are attributable to the stress of acute illness. To find out, they performed a meta-analysis of blood cytokine network alterations in psychiatric patients and evaluated comparisons between schizophrenia, bipolar disorder, and depression. A total of three meta-analyses were performed: one of acute/inpatient studies, one on the impact of acute treatment, and one of outpatient studies. The researchers hypothesized that inflammatory and immune findings in psychiatric illnesses were tied to two distinct etiologies: the acute stress of illness and intrinsic immune dysfunction.
The meta-analyses included 68 studies: 40 involving patients with schizophrenia, 18 involving those with major depressive disorder (MDD) and 10 involving those with bipolar disorder. The researchers found that levels of four cytokines were significantly increased in acutely ill patients with schizophrenia, bipolar mania, and MDD, compared with controls: interleukin-6, tumor necrosis factor–alpha (TNF-alpha), soluble IL-2 receptor (sIL-2R), and IL-1 receptor antagonist (IL-1RA). “There has not been a consistent blood panel used across studies, be it within a disorder itself like depression, or across disorders,” Dr. Rapaport noted. “This is a challenge that we face in looking at these data.”
Following treatment of acute illness, IL-6 levels significantly decreased in schizophrenia and MDD, but no significant changes in TNF-alpha levels were observed in patients with schizophrenia or MDD. In addition, sIL-2R levels increase in schizophrenia but remained unchanged in bipolar and MDD, while IL-1RA levels in bipolar mania decreased but remained unchanged in MDD. Meanwhile, assessment of the study’s 24 outpatient studies revealed that levels of IL-6 were significantly increased in outpatients with schizophrenia, euthymic bipolar disorder, and MDD, compared with controls (P < .01 for each). In addition, levels of IL-1 beta and sIL-2R were significantly increased in outpatients with schizophrenia and bipolar disorder.
According to Dr. Rapaport, these meta-analyses suggest that there are likely inflammatory immune findings present in acutely ill patients with MDD, schizophrenia, and bipolar disorder.
“Some of this activation decreases with effective acute treatment of the disorder,” he said. “The data suggest that immune changes are present in a subset of patients with all three disorders.”
“We also need to understand the regulatory role that microglia and astroglia play within the brain,” he said. “We need to identify changes in brain circuitry and function associated with inflammation and other immune changes. We also need to carefully scrutinize publications, understand the assumptions behind the statistics, and carry out more research beyond the protein level.”
He concluded his presentation by calling for research to help clinicians differentiate acute from chronic inflammation. “The study of both is important,” he said. “We need to understand the pathophysiology of immune changes in psychiatric disorders. We need to study both the triggers and pathways to resolution.”
Dr. Rapaport disclosed that he has received research support from the National Institutes of Health, the National Institute of Mental Health, and the National Center for Complementary and Integrative Health.
Researchers have come a long way in understanding the link between acute inflammation and treatment-resistant depression, but more work needs to be done, according to Mark Hyman Rapaport, MD.
“Inflammation has been a hot topic in the past decade, both because of its impact in medical disorders and in psychiatric disorders,” Dr. Rapaport, CEO of the Huntsman Mental Health Institute in Salt Lake City, Utah, said during an annual psychopharmacology update held by the Nevada Psychiatric Association. “We run into difficulty with chronic inflammation, which we see with rheumatic disorders, and when we think of metabolic syndrome and obesity.”
The immune system helps to control energy regulation and neuroendocrine function in acute inflammation and chronic inflammatory diseases. “We see a variety of effects on the central nervous system or liver function or on homeostasis of the body,” said Dr. Rapaport, who also chairs the department of psychiatry at the University of Utah, also in Salt Lake City. “These are all normal and necessary to channel energy to the immune system in order to fight what’s necessary in acute inflammatory response.”
A chronic state of inflammation can result in prolonged allocation of fuels to the immune system, tissue inflammation, and a chronically aberrant immune reaction, he continued. This can cause depressive symptoms/fatigue, anorexia, malnutrition, muscle wasting, cachectic obesity, insulin resistance, dyslipidemia, increased adipose tissue in the proximity of inflammatory lesion, alterations of steroid hormone axes, elevated sympathetic tone, hypertension, decreased parasympathetic tone, inflammation-related anemia, and osteopenia. “So, chronic inflammation has a lot of long-term sequelae that are detrimental,” he said.
Both physical stress and psychological stress also cause an inflammatory state. After looking at the medical literature, Dr. Rapaport and colleagues began to wonder whether inflammation and immune activation associated with psychiatric disorders are attributable to the stress of acute illness. To find out, they performed a meta-analysis of blood cytokine network alterations in psychiatric patients and evaluated comparisons between schizophrenia, bipolar disorder, and depression. A total of three meta-analyses were performed: one of acute/inpatient studies, one on the impact of acute treatment, and one of outpatient studies. The researchers hypothesized that inflammatory and immune findings in psychiatric illnesses were tied to two distinct etiologies: the acute stress of illness and intrinsic immune dysfunction.
The meta-analyses included 68 studies: 40 involving patients with schizophrenia, 18 involving those with major depressive disorder (MDD) and 10 involving those with bipolar disorder. The researchers found that levels of four cytokines were significantly increased in acutely ill patients with schizophrenia, bipolar mania, and MDD, compared with controls: interleukin-6, tumor necrosis factor–alpha (TNF-alpha), soluble IL-2 receptor (sIL-2R), and IL-1 receptor antagonist (IL-1RA). “There has not been a consistent blood panel used across studies, be it within a disorder itself like depression, or across disorders,” Dr. Rapaport noted. “This is a challenge that we face in looking at these data.”
Following treatment of acute illness, IL-6 levels significantly decreased in schizophrenia and MDD, but no significant changes in TNF-alpha levels were observed in patients with schizophrenia or MDD. In addition, sIL-2R levels increase in schizophrenia but remained unchanged in bipolar and MDD, while IL-1RA levels in bipolar mania decreased but remained unchanged in MDD. Meanwhile, assessment of the study’s 24 outpatient studies revealed that levels of IL-6 were significantly increased in outpatients with schizophrenia, euthymic bipolar disorder, and MDD, compared with controls (P < .01 for each). In addition, levels of IL-1 beta and sIL-2R were significantly increased in outpatients with schizophrenia and bipolar disorder.
According to Dr. Rapaport, these meta-analyses suggest that there are likely inflammatory immune findings present in acutely ill patients with MDD, schizophrenia, and bipolar disorder.
“Some of this activation decreases with effective acute treatment of the disorder,” he said. “The data suggest that immune changes are present in a subset of patients with all three disorders.”
“We also need to understand the regulatory role that microglia and astroglia play within the brain,” he said. “We need to identify changes in brain circuitry and function associated with inflammation and other immune changes. We also need to carefully scrutinize publications, understand the assumptions behind the statistics, and carry out more research beyond the protein level.”
He concluded his presentation by calling for research to help clinicians differentiate acute from chronic inflammation. “The study of both is important,” he said. “We need to understand the pathophysiology of immune changes in psychiatric disorders. We need to study both the triggers and pathways to resolution.”
Dr. Rapaport disclosed that he has received research support from the National Institutes of Health, the National Institute of Mental Health, and the National Center for Complementary and Integrative Health.
FROM NPA 2021
Myocardial injury seen on MRI in 54% of recovered COVID-19 patients
About half of 148 patients hospitalized with COVID-19 infection and elevated troponin levels had at least some evidence of myocardial injury on cardiac magnetic resonance (CMR) imaging 2 months later, a new study shows.
“Our results demonstrate that in this subset of patients surviving severe COVID-19 and with troponin elevation, ongoing localized myocardial inflammation, whilst less frequent than previously reported, remains present in a proportion of patients and may represent an emerging issue of clinical relevance,” wrote Marianna Fontana, MD, PhD, of University College London, and colleagues.
The cardiac abnormalities identified were classified as nonischemic (including “myocarditis-like” late gadolinium enhancement [LGE]) in 26% of the cohort; as related to ischemic heart disease (infarction or inducible ischemia) in 22%; and as dual pathology in 6%.
Left ventricular (LV) function was normal in 89% of the 148 patients. In the 17 patients (11%) with LV dysfunction, only four had an ejection fraction below 35%. Of the nine patients whose LV dysfunction was related to myocardial infarction, six had a known history of ischemic heart disease.
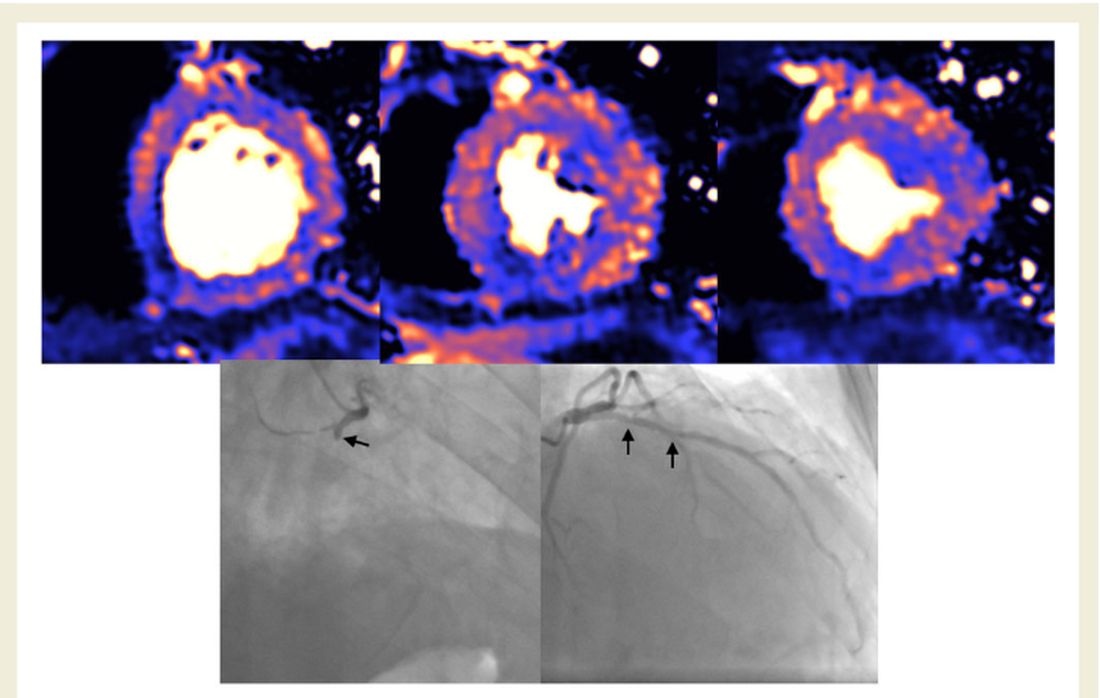
No patients with “myocarditis-pattern” LGE had regional wall motion abnormalities, and neither admission nor peak troponin values were predictive of the diagnosis of myocarditis.
The results were published online Feb. 18 in the European Heart Journal.
Glass half full
Taking a “glass half full” approach, co–senior author Graham D. Cole, MD, PhD, noted on Twitter that nearly half the patients had no major cardiac abnormalities on CMR just 2 months after a bout with troponin-positive COVID-19.
“We think this is important: Even in a group who had been very sick with raised troponin, it was common to find no evidence of heart damage,” said Dr. Cole, of the Royal Free London NHS Foundation Trust.
“We believe our data challenge the hypothesis that chronic inflammation, diffuse fibrosis, or long-term LV dysfunction is a dominant feature in those surviving COVID-19,” the investigators concluded in their report.
In an interview, Dr. Fontana explained further: “It has been reported in an early ‘pathfinder’ study that two-thirds of patients recovered from COVID-19 had CMR evidence of abnormal findings with a high incidence of elevated T1 and T2 in keeping with diffuse fibrosis and edema. Our findings with a larger, multicenter study and better controls show low rates of heart impairment and much less ongoing inflammation, which is reassuring.”
She also noted that the different patterns of injury suggest that different mechanisms are at play, including the possibility that “at least some of the found damage might have been preexisting, because people with heart damage are more likely to get severe disease.”
The investigators, including first author Tushar Kotecha, MBChB, PhD, of the Royal Free London NHS Foundation Trust, also noted that myocarditis-like injury was limited to three or fewer myocardial segments in 88% of cases with no associated ventricular dysfunction, and that biventricular function was no different than in those without myocarditis.
“We use the word ‘myocarditis-like’ but we don’t have histology,” Dr. Fontana said. “Our group actually suspects a lot of this will be microvascular clotting (microangiopathic thrombosis). This is exciting, as newer anticoagulation strategies – for example, those being tried in RECOVERY – may have benefit.”
Aloke V. Finn, MD, of the CVPath Institute in Gaithersburg, Md., wishes researchers would stop using the term myocarditis altogether to describe clinical or imaging findings in COVID-19.
“MRI can’t diagnose myocarditis. It is a specific diagnosis that requires, ideally, histology, as the investigators acknowledged,” Dr. Finn said in an interview.
His group at CVPath recently published data showing pathologic evidence of myocarditis after SARS-CoV-2 infection, as reported by theheart.org | Medscape Cardiology.
“As a clinician, when I think of myocarditis, I look at the echo and an LV gram, and I see if there is a wall motion abnormality and troponin elevation, but with normal coronary arteries. And if all that is there, then I think about myocarditis in my differential diagnosis,” he said. “But in most of these cases, as the authors rightly point out, most patients did not have what is necessary to really entertain a diagnosis of myocarditis.”
He agreed with Dr. Fontana’s suggestion that what the CMR might be picking up in these survivors is microthrombi, as his group saw in their recent autopsy study.
“It’s very possible these findings are concordant with the recent autopsy studies done by my group and others in terms of detecting the presence of microthrombi, but we don’t know this for certain because no one has ever studied this entity before in the clinic and we don’t really know how microthrombi might appear on CMR.”
Largest study to date
The 148 participants (mean age, 64 years; 70% male) in the largest study to date to investigate convalescing COVID-19 patients who had elevated troponins – something identified early in the pandemic as a risk factor for worse outcomes in COVID-19 – were treated at one of six hospitals in London.
Patients who had abnormal troponin levels were offered an MRI scan of the heart after discharge and were compared with those from a control group of patients who had not had COVID-19 and with 40 healthy volunteers.
Median length of stay was 9 days, and 32% of patients required ventilatory support in the intensive care unit.
Just over half the patients (57%) had hypertension, 7% had had a previous myocardial infarction, 34% had diabetes, 46% had hypercholesterolemia, and 24% were smokers. Mean body mass index was 28.5 kg/m2.
CMR follow-up was conducted a median of 68 days after confirmation of a COVID-19 diagnosis.
On Twitter, Dr. Cole noted that the findings are subject to both survivor bias and referral bias. “We didn’t scan frail patients where the clinician felt [CMR] was unlikely to inform management.”
The findings, said Dr. Fontana, “say nothing about what happens to people who are not hospitalized with COVID, or those who are hospitalized but without elevated troponin.”
What they do offer, particularly if replicated, is a way forward in identifying patients at higher or lower risk for long-term sequelae and inform strategies that could improve outcomes, she added.
A version of this article first appeared on Medscape.com.
About half of 148 patients hospitalized with COVID-19 infection and elevated troponin levels had at least some evidence of myocardial injury on cardiac magnetic resonance (CMR) imaging 2 months later, a new study shows.
“Our results demonstrate that in this subset of patients surviving severe COVID-19 and with troponin elevation, ongoing localized myocardial inflammation, whilst less frequent than previously reported, remains present in a proportion of patients and may represent an emerging issue of clinical relevance,” wrote Marianna Fontana, MD, PhD, of University College London, and colleagues.
The cardiac abnormalities identified were classified as nonischemic (including “myocarditis-like” late gadolinium enhancement [LGE]) in 26% of the cohort; as related to ischemic heart disease (infarction or inducible ischemia) in 22%; and as dual pathology in 6%.
Left ventricular (LV) function was normal in 89% of the 148 patients. In the 17 patients (11%) with LV dysfunction, only four had an ejection fraction below 35%. Of the nine patients whose LV dysfunction was related to myocardial infarction, six had a known history of ischemic heart disease.
No patients with “myocarditis-pattern” LGE had regional wall motion abnormalities, and neither admission nor peak troponin values were predictive of the diagnosis of myocarditis.
The results were published online Feb. 18 in the European Heart Journal.
Glass half full
Taking a “glass half full” approach, co–senior author Graham D. Cole, MD, PhD, noted on Twitter that nearly half the patients had no major cardiac abnormalities on CMR just 2 months after a bout with troponin-positive COVID-19.
“We think this is important: Even in a group who had been very sick with raised troponin, it was common to find no evidence of heart damage,” said Dr. Cole, of the Royal Free London NHS Foundation Trust.
“We believe our data challenge the hypothesis that chronic inflammation, diffuse fibrosis, or long-term LV dysfunction is a dominant feature in those surviving COVID-19,” the investigators concluded in their report.
In an interview, Dr. Fontana explained further: “It has been reported in an early ‘pathfinder’ study that two-thirds of patients recovered from COVID-19 had CMR evidence of abnormal findings with a high incidence of elevated T1 and T2 in keeping with diffuse fibrosis and edema. Our findings with a larger, multicenter study and better controls show low rates of heart impairment and much less ongoing inflammation, which is reassuring.”
She also noted that the different patterns of injury suggest that different mechanisms are at play, including the possibility that “at least some of the found damage might have been preexisting, because people with heart damage are more likely to get severe disease.”
The investigators, including first author Tushar Kotecha, MBChB, PhD, of the Royal Free London NHS Foundation Trust, also noted that myocarditis-like injury was limited to three or fewer myocardial segments in 88% of cases with no associated ventricular dysfunction, and that biventricular function was no different than in those without myocarditis.
“We use the word ‘myocarditis-like’ but we don’t have histology,” Dr. Fontana said. “Our group actually suspects a lot of this will be microvascular clotting (microangiopathic thrombosis). This is exciting, as newer anticoagulation strategies – for example, those being tried in RECOVERY – may have benefit.”
Aloke V. Finn, MD, of the CVPath Institute in Gaithersburg, Md., wishes researchers would stop using the term myocarditis altogether to describe clinical or imaging findings in COVID-19.
“MRI can’t diagnose myocarditis. It is a specific diagnosis that requires, ideally, histology, as the investigators acknowledged,” Dr. Finn said in an interview.
His group at CVPath recently published data showing pathologic evidence of myocarditis after SARS-CoV-2 infection, as reported by theheart.org | Medscape Cardiology.
“As a clinician, when I think of myocarditis, I look at the echo and an LV gram, and I see if there is a wall motion abnormality and troponin elevation, but with normal coronary arteries. And if all that is there, then I think about myocarditis in my differential diagnosis,” he said. “But in most of these cases, as the authors rightly point out, most patients did not have what is necessary to really entertain a diagnosis of myocarditis.”
He agreed with Dr. Fontana’s suggestion that what the CMR might be picking up in these survivors is microthrombi, as his group saw in their recent autopsy study.
“It’s very possible these findings are concordant with the recent autopsy studies done by my group and others in terms of detecting the presence of microthrombi, but we don’t know this for certain because no one has ever studied this entity before in the clinic and we don’t really know how microthrombi might appear on CMR.”
Largest study to date
The 148 participants (mean age, 64 years; 70% male) in the largest study to date to investigate convalescing COVID-19 patients who had elevated troponins – something identified early in the pandemic as a risk factor for worse outcomes in COVID-19 – were treated at one of six hospitals in London.
Patients who had abnormal troponin levels were offered an MRI scan of the heart after discharge and were compared with those from a control group of patients who had not had COVID-19 and with 40 healthy volunteers.
Median length of stay was 9 days, and 32% of patients required ventilatory support in the intensive care unit.
Just over half the patients (57%) had hypertension, 7% had had a previous myocardial infarction, 34% had diabetes, 46% had hypercholesterolemia, and 24% were smokers. Mean body mass index was 28.5 kg/m2.
CMR follow-up was conducted a median of 68 days after confirmation of a COVID-19 diagnosis.
On Twitter, Dr. Cole noted that the findings are subject to both survivor bias and referral bias. “We didn’t scan frail patients where the clinician felt [CMR] was unlikely to inform management.”
The findings, said Dr. Fontana, “say nothing about what happens to people who are not hospitalized with COVID, or those who are hospitalized but without elevated troponin.”
What they do offer, particularly if replicated, is a way forward in identifying patients at higher or lower risk for long-term sequelae and inform strategies that could improve outcomes, she added.
A version of this article first appeared on Medscape.com.
Janssen/J&J COVID-19 vaccine cuts transmission, new data show

The single-dose vaccine reduces the risk of asymptomatic transmission by 74% at 71 days, compared with placebo, according to documents released today by the U.S. Food and Drug Administration.
“The decrease in asymptomatic transmission is very welcome news too in curbing the spread of the virus,” Phyllis Tien, MD, told this news organization.
“While the earlier press release reported that the vaccine was effective against preventing severe COVID-19 disease, as well as hospitalizations and death, this new data shows that the vaccine can also decrease transmission, which is very important on a public health level,” said Dr. Tien, professor of medicine in the division of infectious diseases at the University of California, San Francisco.
“It is extremely important in terms of getting to herd immunity,” Paul Goepfert, MD, director of the Alabama Vaccine Research Clinic and infectious disease specialist at the University of Alabama, Birmingham, said in an interview. “It means that this vaccine is likely preventing subsequent transmission after a single dose, which could have huge implications once we get the majority of folks vaccinated.”
The FDA cautioned that the numbers of participants included in the study are relatively small and need to be verified. However, the Johnson & Johnson vaccine might not be the only product offering this advantage. Early data suggest that the Pfizer/BioNTech vaccine also decreases transmission, providing further evidence that the protection offered by immunization goes beyond the individual.
The new analyses were provided by the FDA in advance of its review of the Janssen/Johnson & Johnson vaccine. The agency plans to fully address the Ad26.COV2.S vaccine at its Vaccines and Related Biological Products Advisory Committee Meeting on Friday, including evaluating its safety and efficacy.
The agency’s decision on whether or not to grant emergency use authorization (EUA) to the Johnson & Johnson vaccine could come as early as Friday evening or Saturday.
In addition to the newly released data, officials are likely to discuss phase 3 data, released Jan. 29, that reveal an 85% efficacy for the vaccine against severe COVID-19 illness globally, including data from South America, South Africa, and the United States. When the analysis was restricted to data from U.S. participants, the trial showed a 73% efficacy against moderate to severe COVID-19.
If and when the FDA grants an EUA, it remains unclear how much of the new vaccine will be immediately available. Initially, Johnson & Johnson predicted 18 million doses would be ready by the end of February, but others stated the figure will be closer to 2-4 million. The manufacturer’s contract with the U.S. government stipulates production of 100-million doses by the end of June.
Dr. Tien received support from Johnson & Johnson to conduct the J&J COVID-19 vaccine trial in the SF VA HealthCare System. Dr. Goepfert has disclosed no relevant financial relationships.
A version of this article first appeared on Medscape.com.
Consider connections between depression, chronic medical comorbidities
For many adults, depression and chronic medical conditions are inextricably linked.

In fact, the prevalence of depression is 2-10 times higher among people with chronic medical conditions, particularly in people with chronic pain, where the prevalence reaches 40%-60%, according to Jonathan E. Alpert, MD, PhD.
“About 60% of adults over 65 have two or more chronic conditions, of which depression is the single most common comorbidity,” Dr. Alpert, chair of the department of psychiatry and behavioral sciences at the Montefiore Medical Center and Albert Einstein College of Medicine, both in New York, said during an annual psychopharmacology update held by the Nevada Psychiatric Association.
“Premorbid depression is a risk factor for a number of medical conditions, such as heart disease. We also know that medical illness is a risk factor for depression. Comorbid depression predicts poorer health outcomes, including disability, hospital readmission, and mortality. It is also associated with up to severalfold higher general medical costs.”
Despite the pervasive nature of depression on other medical conditions, a limited evidence base exists to guide clinicians on treatment approaches.
“Most major depressive disorder randomized clinical trials exclude individuals with active medical illness, but we do know that medical comorbidity is associated with poorer depression outcomes,” Dr. Alpert said. For example, the STAR*D trial found that people with major depressive disorder plus medical comorbidity had lower remission rates, compared with those who had MDD alone (P < .001), while a large analysis from University of Pittsburgh researchers found that people with medical comorbidities had higher depression recurrence rates.
An assessment of the relationship between medical conditions and depression should include thinking about the association between the medical illness itself and medications with depressive symptoms.
“Are the medications contributing to depressive symptoms?” he asked. “We also want to be thinking of the impact of medical illness and medications on antidepressant pharmacokinetics and pharmacodynamics. We also want to know about the evidence for antidepressant safety, tolerability, efficacy, and anticipated drug-drug interactions among individuals with the medical illness. You also want to enhance focus on treatment adherence and coordination of care.”
Nontraditional routes of antidepressant administration exist for patients who have difficulty swallowing pills. Food and Drug Administration–approved options include transdermal selegiline; intranasal esketamine; liquid forms of fluoxetine, escitalopram, paroxetine, nortriptyline, doxepin, imipramine, and lithium; and oral disintegrating tablet forms of mirtazapine and selegiline. As for non–FDA-approved forms of antidepressant administration, small studies or case reports have appeared in the medical literature regarding intravenous ketamine, citalopram, amitriptyline, mirtazapine, maprotiline, and lithium; intramuscular ketamine and amitriptyline; and rectal forms of antidepressants such as trazodone, amitriptyline, doxepin, fluoxetine, and lamotrigine.
“It’s good to keep in mind that, when you’re not able to use by mouth antidepressants or typical tablet forms of antidepressants, there are other options available,” said Dr. Alpert, who is also chair of the American Psychiatric Association’s Council on Research.
Metabolism of medications occurs primarily in the liver, he continued, but some metabolic enzymes also line the intestinal tract. The metabolism of a substrate may be inhibited or induced by other drugs.
“If someone is on drug A and we give drug B, and drug B is inhibiting the metabolism of drug A, there will be a very rapid impact – hours to just a few days,” Dr. Alpert said. “The substrate levels rise very quickly, so within hours or days of taking drug B, drug A levels can rise steeply.” On the other hand, if someone is on drug A and you give a drug B – which induces the enzymes that usually metabolize drug A – the impact will be gradual. “That’s because induction requires increased synthesis of the metabolic enzyme responsible for metabolizing drug A,” he said. “That happens over days to weeks.”
Medications that are potential inducers of metabolism include carbamazepine, phenobarbital, phenytoin, primidone, prednisone, ritonavir, rifampin, chronic alcohol use, chronic smoking, St. John’s wort, and consumption of large quantities of cruciferous vegetables and charbroiled meats.
On the other hand, potential inhibitors of metabolism include antifungals, macrolide antibiotics, fluoroquinolones, antiretrovirals, isoniazid, antimalarials, disulfiram, SSRIs, phenothiazines, valproic acid, nefazodone, duloxetine, bupropion, beta-blockers, acute alcohol use, cimetidine, quinidine, calcium channel blockers, grapefruit juice, propafenone, and amiodarone.
“When treating people with significant medical comorbidity, start low and go slow, but persevere,” Dr. Alpert advised. “We want to always think about the risk of treating versus the risk of not treating, or not treating actively enough. Often, people with comorbid medical illness require the same or even more assertive treatment with pharmacotherapy for their depression as people without medical illness. So, we don’t want to make the mistake of undertreating depression. We also want to anticipate and address challenges with adherence.”
He also recommended being mindful of the most salient side effects for a given condition, such as lowered seizure threshold or QT prolongation in populations with brain injury or with cardiovascular disease, and to leverage dual benefits when they might exist, such as using [selective norepinephrine reuptake inhibitors] for depression and pain or hot flashes, or bupropion for depression and smoking cessation, or mirtazapine, which is effective for nausea, cachexia, or insomnia, as well as depression itself.
“We want to collaborate closely and regularly with other treaters, sharing our notes and diagnostic impressions,” Dr. Alpert said. “We want to use all the tools in the box in addition to pharmacotherapy, thinking about psychotherapy, neuromodulation, and peer navigators. We want to strive for measurement-based care using rating scales when we can, to augment our treatment. And
Dr. Alpert reports having received speaker’s honoraria, consulting fees, and research support from numerous pharmaceutical companies.
For many adults, depression and chronic medical conditions are inextricably linked.
In fact, the prevalence of depression is 2-10 times higher among people with chronic medical conditions, particularly in people with chronic pain, where the prevalence reaches 40%-60%, according to Jonathan E. Alpert, MD, PhD.
“About 60% of adults over 65 have two or more chronic conditions, of which depression is the single most common comorbidity,” Dr. Alpert, chair of the department of psychiatry and behavioral sciences at the Montefiore Medical Center and Albert Einstein College of Medicine, both in New York, said during an annual psychopharmacology update held by the Nevada Psychiatric Association.
“Premorbid depression is a risk factor for a number of medical conditions, such as heart disease. We also know that medical illness is a risk factor for depression. Comorbid depression predicts poorer health outcomes, including disability, hospital readmission, and mortality. It is also associated with up to severalfold higher general medical costs.”
Despite the pervasive nature of depression on other medical conditions, a limited evidence base exists to guide clinicians on treatment approaches.
“Most major depressive disorder randomized clinical trials exclude individuals with active medical illness, but we do know that medical comorbidity is associated with poorer depression outcomes,” Dr. Alpert said. For example, the STAR*D trial found that people with major depressive disorder plus medical comorbidity had lower remission rates, compared with those who had MDD alone (P < .001), while a large analysis from University of Pittsburgh researchers found that people with medical comorbidities had higher depression recurrence rates.
An assessment of the relationship between medical conditions and depression should include thinking about the association between the medical illness itself and medications with depressive symptoms.
“Are the medications contributing to depressive symptoms?” he asked. “We also want to be thinking of the impact of medical illness and medications on antidepressant pharmacokinetics and pharmacodynamics. We also want to know about the evidence for antidepressant safety, tolerability, efficacy, and anticipated drug-drug interactions among individuals with the medical illness. You also want to enhance focus on treatment adherence and coordination of care.”
Nontraditional routes of antidepressant administration exist for patients who have difficulty swallowing pills. Food and Drug Administration–approved options include transdermal selegiline; intranasal esketamine; liquid forms of fluoxetine, escitalopram, paroxetine, nortriptyline, doxepin, imipramine, and lithium; and oral disintegrating tablet forms of mirtazapine and selegiline. As for non–FDA-approved forms of antidepressant administration, small studies or case reports have appeared in the medical literature regarding intravenous ketamine, citalopram, amitriptyline, mirtazapine, maprotiline, and lithium; intramuscular ketamine and amitriptyline; and rectal forms of antidepressants such as trazodone, amitriptyline, doxepin, fluoxetine, and lamotrigine.
“It’s good to keep in mind that, when you’re not able to use by mouth antidepressants or typical tablet forms of antidepressants, there are other options available,” said Dr. Alpert, who is also chair of the American Psychiatric Association’s Council on Research.
Metabolism of medications occurs primarily in the liver, he continued, but some metabolic enzymes also line the intestinal tract. The metabolism of a substrate may be inhibited or induced by other drugs.
“If someone is on drug A and we give drug B, and drug B is inhibiting the metabolism of drug A, there will be a very rapid impact – hours to just a few days,” Dr. Alpert said. “The substrate levels rise very quickly, so within hours or days of taking drug B, drug A levels can rise steeply.” On the other hand, if someone is on drug A and you give a drug B – which induces the enzymes that usually metabolize drug A – the impact will be gradual. “That’s because induction requires increased synthesis of the metabolic enzyme responsible for metabolizing drug A,” he said. “That happens over days to weeks.”
Medications that are potential inducers of metabolism include carbamazepine, phenobarbital, phenytoin, primidone, prednisone, ritonavir, rifampin, chronic alcohol use, chronic smoking, St. John’s wort, and consumption of large quantities of cruciferous vegetables and charbroiled meats.
On the other hand, potential inhibitors of metabolism include antifungals, macrolide antibiotics, fluoroquinolones, antiretrovirals, isoniazid, antimalarials, disulfiram, SSRIs, phenothiazines, valproic acid, nefazodone, duloxetine, bupropion, beta-blockers, acute alcohol use, cimetidine, quinidine, calcium channel blockers, grapefruit juice, propafenone, and amiodarone.
“When treating people with significant medical comorbidity, start low and go slow, but persevere,” Dr. Alpert advised. “We want to always think about the risk of treating versus the risk of not treating, or not treating actively enough. Often, people with comorbid medical illness require the same or even more assertive treatment with pharmacotherapy for their depression as people without medical illness. So, we don’t want to make the mistake of undertreating depression. We also want to anticipate and address challenges with adherence.”
He also recommended being mindful of the most salient side effects for a given condition, such as lowered seizure threshold or QT prolongation in populations with brain injury or with cardiovascular disease, and to leverage dual benefits when they might exist, such as using [selective norepinephrine reuptake inhibitors] for depression and pain or hot flashes, or bupropion for depression and smoking cessation, or mirtazapine, which is effective for nausea, cachexia, or insomnia, as well as depression itself.
“We want to collaborate closely and regularly with other treaters, sharing our notes and diagnostic impressions,” Dr. Alpert said. “We want to use all the tools in the box in addition to pharmacotherapy, thinking about psychotherapy, neuromodulation, and peer navigators. We want to strive for measurement-based care using rating scales when we can, to augment our treatment. And
Dr. Alpert reports having received speaker’s honoraria, consulting fees, and research support from numerous pharmaceutical companies.
FROM NPA 2021
Obesity pegged as diabetes cause in almost half of U.S. cases
Roughly 40% of all U.S. cases of incident diabetes during 2013-2016 were directly attributable to obesity, a finding that further solidifies the major etiologic role for obesity in the current American diabetes epidemic.

Researchers used data from a diverse cohort of 4,200 American adults in the MESA study during 2000-2017 to calculate a relative risk for developing diabetes of 2.7 in people with obesity compared with similar participants without obesity.
They then applied this relative risk estimate to obesity prevalence rates during serial iterations of NHANES, the recurring U.S.-wide survey of vital statistics in a representative cross-sectional population.
Their calculations showed that, during 2013-2016, 41% of U.S. adults who developed new onset diabetes did so because of obesity, after the researchers adjusted for potential confounders.
This “population attributable fraction,” or disease burden attributable to obesity, varied somewhat by sex, and by racial and ethnic subgrouping. Obesity was linked with the highest attributable rate among non-Hispanic White women, a rate of 53%, and with the lowest rate among non-Hispanic Black men, with an attributable fraction of 30%, Natalie A. Cameron, MD, and colleagues reported in their study, published online Feb. 10 in the Journal of the American Heart Association.
Potential for “meaningful impact” by reducing obesity
“Our study highlights the meaningful impact that reducing obesity could have on type 2 diabetes prevention in the United States. Decreasing obesity needs to be a priority,” Dr. Cameron, of the McGaw Medical Center of Northwestern University in Chicago, said in a statement issued by the American Heart Association.
“Public health efforts that support healthy lifestyles, such as increasing access to nutritious foods, promoting physical activity, and developing community programs to prevent obesity, could substantially reduce new cases of type 2 diabetes,” she added.
MESA (Multi-Ethnic Study of Atherosclerosis) enrolled adults aged 45-84 years and free from clinical cardiovascular disease at six U.S. sites during 2000-2002, and then followed them with four additional examinations through 2017.
For the current study, researchers narrowed the cohort down to 4,200 participants who were aged 45-79 years and free from diabetes at entry, and also restricted this subgroup to participants classified as non-Hispanic White (54% of the cohort), non-Hispanic Black (33%), or Mexican American (13%). At entry, 34% of the cohort had obesity, with a body mass index of at least 30 kg/m2.
During a median follow-up of just over 9 years, 12% of the cohort developed incident diabetes. After adjustment for possible confounders, a hazard ratio model showed an overall 2.7-fold higher rate of incident diabetes among people with obesity compared to those without.
The researchers then applied this hazard ratio to obesity prevalence statistics from NHANES (National Health and Nutrition Examination Survey) during the same time period, with data from the biennial NHANES project collapsed into four time strata: 2001-2004, 2005-2008, 2009-2012, and 2013-2016. They again limited their analysis to NHANES data collected from people aged 45-79 years who self-reported categorization as non-Hispanic White, non-Hispanic Black, or Mexican American.
During the period from 2001-2004 to 2013-2016, overall obesity prevalence tallied by NHANES data rose from 34% to 41%. Among people with type 2 diabetes during 2013-2016, obesity prevalence was 65%.
To calculate the population attributable fraction researchers combined the MESA and NHANES estimates and adjusted for potential confounders and found that, overall, in 41% of people with incident diabetes during 2013-2016, the disease was attributable to obesity.
The study received no commercial funding, and none of the authors had disclosures.
A version of this article first appeared on Medscape.com.
Roughly 40% of all U.S. cases of incident diabetes during 2013-2016 were directly attributable to obesity, a finding that further solidifies the major etiologic role for obesity in the current American diabetes epidemic.
Researchers used data from a diverse cohort of 4,200 American adults in the MESA study during 2000-2017 to calculate a relative risk for developing diabetes of 2.7 in people with obesity compared with similar participants without obesity.
They then applied this relative risk estimate to obesity prevalence rates during serial iterations of NHANES, the recurring U.S.-wide survey of vital statistics in a representative cross-sectional population.
Their calculations showed that, during 2013-2016, 41% of U.S. adults who developed new onset diabetes did so because of obesity, after the researchers adjusted for potential confounders.
This “population attributable fraction,” or disease burden attributable to obesity, varied somewhat by sex, and by racial and ethnic subgrouping. Obesity was linked with the highest attributable rate among non-Hispanic White women, a rate of 53%, and with the lowest rate among non-Hispanic Black men, with an attributable fraction of 30%, Natalie A. Cameron, MD, and colleagues reported in their study, published online Feb. 10 in the Journal of the American Heart Association.
Potential for “meaningful impact” by reducing obesity
“Our study highlights the meaningful impact that reducing obesity could have on type 2 diabetes prevention in the United States. Decreasing obesity needs to be a priority,” Dr. Cameron, of the McGaw Medical Center of Northwestern University in Chicago, said in a statement issued by the American Heart Association.
“Public health efforts that support healthy lifestyles, such as increasing access to nutritious foods, promoting physical activity, and developing community programs to prevent obesity, could substantially reduce new cases of type 2 diabetes,” she added.
MESA (Multi-Ethnic Study of Atherosclerosis) enrolled adults aged 45-84 years and free from clinical cardiovascular disease at six U.S. sites during 2000-2002, and then followed them with four additional examinations through 2017.
For the current study, researchers narrowed the cohort down to 4,200 participants who were aged 45-79 years and free from diabetes at entry, and also restricted this subgroup to participants classified as non-Hispanic White (54% of the cohort), non-Hispanic Black (33%), or Mexican American (13%). At entry, 34% of the cohort had obesity, with a body mass index of at least 30 kg/m2.
During a median follow-up of just over 9 years, 12% of the cohort developed incident diabetes. After adjustment for possible confounders, a hazard ratio model showed an overall 2.7-fold higher rate of incident diabetes among people with obesity compared to those without.
The researchers then applied this hazard ratio to obesity prevalence statistics from NHANES (National Health and Nutrition Examination Survey) during the same time period, with data from the biennial NHANES project collapsed into four time strata: 2001-2004, 2005-2008, 2009-2012, and 2013-2016. They again limited their analysis to NHANES data collected from people aged 45-79 years who self-reported categorization as non-Hispanic White, non-Hispanic Black, or Mexican American.
During the period from 2001-2004 to 2013-2016, overall obesity prevalence tallied by NHANES data rose from 34% to 41%. Among people with type 2 diabetes during 2013-2016, obesity prevalence was 65%.
To calculate the population attributable fraction researchers combined the MESA and NHANES estimates and adjusted for potential confounders and found that, overall, in 41% of people with incident diabetes during 2013-2016, the disease was attributable to obesity.
The study received no commercial funding, and none of the authors had disclosures.
A version of this article first appeared on Medscape.com.
FDA approves cemiplimab-rwlc for NSCLC with PD-L1 expression

Specifically, the indication is for first-line treatment as monotherapy for patients with locally advanced or metastatic disease who are not candidates for surgical resection or definitive chemoradiotherapy and whose tumors have a high expression of programmed death–ligand 1 (PD-L1) (Tumor Proportion Score >50%), as determined by an FDA-approved test, with no EGFR, ALK, or ROS1 aberrations.
This is the third indication for cemiplimab-rlwc, a monoclonal antibody and PD-1 inhibitor.
In February, it was approved as the first immunotherapy to treat patients with locally advanced or metastatic basal cell carcinoma that was previously treated with a hedgehog pathway inhibitor or for whom a hedgehog inhibitor is inappropriate.
Cemiplimab-rlwc previously received FDA approval in 2018 for locally advanced or metastatic cutaneous squamous cell carcinoma for patients who were not eligible for curative surgery or radiotherapy. At the time, Karl Lewis, MD, a professor at the University of Colorado at Denver, Aurora, and a trial investigator, predicted that the drug “will change the treatment paradigm for patients with advanced basal cell carcinoma.”
Outperforms chemotherapy
The approval for use in NSCLC is based on results from the phase 3, open-label EMPOWER-Lung 1 trial, which randomly assigned 710 patients in a 1:1 ratio to receive either cemiplimab-rwlc or platinum-doublet chemotherapy. Patients had either locally advanced NSCLC and were not candidates for surgical resection or definitive chemoradiotherapy, or they had metastatic NSCLC.
Patients in the experimental arm received cemiplimab-rwlc 350 mg intravenously every 3 weeks. The primary efficacy outcome measures were overall survival (OS) and progression-free survival (PFS), determined on the basis of blinded independent central review.
Results showed statistically significant improvements in both outcomes. Median OS was 22.1 months with cemiplimab-rwlc versus 14.3 months with chemotherapy (hazard ratio, 0.68; P = .0022). Median PFS was 6.2 months versus 5.6 months (HR, 0.59; P < .0001).
The confirmed overall response rate was 37% for the cemiplimab arm versus 21% for the chemotherapy arm.
The most common adverse reactions (>10%) with cemiplimab-rlwc were musculoskeletal pain, rash, anemia, fatigue, decreased appetite, pneumonia, and cough.
This approval “means physicians and patients have a potent new treatment option against this deadly disease,” said Naiyer Rizvi, MD, Price Family Professor of Medicine, director of thoracic oncology, and codirector of cancer immunotherapy at Columbia University Irving Medical Center, New York, in a statement. He was a steering committee member on the EMPOWER-Lung-1 Trial.
“Notably, Libtayo was approved based on a pivotal trial where most chemotherapy patients crossed over to Libtayo following disease progression, and that allowed for frequently underrepresented patients who had pretreated and clinically stable brain metastases or who had locally advanced disease and were not candidates for definitive chemoradiation,” said Dr. Rizvi. “This gives doctors important new data when considering Libtayo for the varied patients and situations they treat in daily clinical practice.”
A version of this article first appeared on Medscape.com.
COVID-19 vaccination recommended for rheumatology patients
People with rheumatic diseases should get vaccinated against SARS-CoV-2 as soon as possible, the American College of Rheumatology (ACR) recommends.

“It may be that people with rheumatic diseases are at increased risk of developing COVID or serious COVID-related complications,” Jonathan Hausmann, MD, assistant professor of medicine at Harvard Medical School, Boston, said in an ACR podcast. “So the need to prevent COVID-19 is incredibly important in this group of patients.”
The guidelines recommend a delay in vaccination only in rare circumstances, such as for patients with very severe illness or who have recently been administered rituximab, Jeffrey R. Curtis, MD, MPH, lead author of the guidelines, said in the podcast.
“Our members have been inundated with questions and concerns from their patients on whether they should receive the vaccine,” ACR President David Karp, MD, PhD, said in a press release.
So the ACR convened a panel of nine rheumatologists, two infectious disease specialists, and two public health experts. Over the course of 8 weeks, the task force reviewed the literature and agreed on recommendations. The organization posted a summary of the guidelines on its website after its board of directors approved it Feb. 8. The paper is pending journal peer review.
Some risks are real
The task force confined its research to the COVID-19 vaccines being offered by Pfizer and Moderna because they are currently the only ones approved by the Food and Drug Administration. It found no reason to distinguish between the two vaccines in its recommendations.
Because little research has directly addressed the question concerning COVID-19 vaccination for patients with rheumatic diseases, the task force extrapolated from data on other vaccinations in people with rheumatic disease and on the COVID-19 vaccinations in other populations.
It analyzed reports that other types of vaccination, such as for influenza, triggered flares of rheumatic conditions. “It is really individual case reports or small cohorts where there may be a somewhat higher incidence of flare, but it’s usually not very large in its magnitude nor duration,” said Dr. Curtis of the University of Alabama at Birmingham.
The task force also considered the possibility that vaccinations could lead to a new autoimmune disorder, such as Guillain-Barré syndrome or Bell palsy. The risk is real, the task force decided, but not significant enough to influence their recommendations.
Likewise, in immunocompromised people, vaccinations with live virus, such as those for shingles, might trigger the infection the vaccination is meant to prevent. But this can’t happen with the Pfizer and Moderna COVID-19 vaccines because they contain messenger RNA instead of live viruses, Dr. Curtis said.

Although it might be optimal to administer the vaccines when rheumatic diseases are quiescent, the urgency of getting vaccinated overrides that consideration, Dr. Curtis said. “By and large, there was a general consensus to not want to delay vaccination until somebody was stable and doing great, because you don’t know how long that’s going to be,” he said.
How well does it work?
One unanswered question is whether the COVID-19 vaccines work as well for patients with rheumatic diseases. The task force was reassured by data showing efficacy across a range of subgroups, including some with immunosenescence, Dr. Curtis said. “But until we have data in rheumatology patients, we’re just not going to know,” he said.
The guidelines specify that some drug regimens be modified when patients are vaccinated.
For patients taking rituximab, vaccination should be delayed, but only for those who are able to maintain safe social distancing to reduce the risk for COVID-19 exposure, Dr. Curtis said. “If somebody has just gotten rituximab recently, it might be more ideal to complete the vaccine series about 2-4 weeks before the next rituximab dose,” he said. “So if you are giving that therapy, say, at 6-month intervals, if you could vaccinate them at around month 5 from the most recent rituximab cycle, that might be more ideal.”
The guidance calls for withholding JAK inhibitors for a week after each vaccine dose is administered.
It calls for holding SQ abatacept 1 week prior and 1 week after the first COVID-19 vaccine dose, with no interruption after the second dose.
For abatacept IV, clinicians should “time vaccine administration so that the first vaccination will occur 4 weeks after abatacept infusion (i.e., the entire dosing interval), and postpone the subsequent abatacept infusion by 1 week (i.e., a 5-week gap in total).” It recommends no medication adjustment for the second vaccine dose.
For cyclophosphamide, the guidance recommends timing administration to occur about a week after each vaccine dose, when feasible.
None of this advice should supersede clinical judgment, Dr. Curtis said.
A version of this article first appeared on Medscape.com.
People with rheumatic diseases should get vaccinated against SARS-CoV-2 as soon as possible, the American College of Rheumatology (ACR) recommends.
“It may be that people with rheumatic diseases are at increased risk of developing COVID or serious COVID-related complications,” Jonathan Hausmann, MD, assistant professor of medicine at Harvard Medical School, Boston, said in an ACR podcast. “So the need to prevent COVID-19 is incredibly important in this group of patients.”
The guidelines recommend a delay in vaccination only in rare circumstances, such as for patients with very severe illness or who have recently been administered rituximab, Jeffrey R. Curtis, MD, MPH, lead author of the guidelines, said in the podcast.
“Our members have been inundated with questions and concerns from their patients on whether they should receive the vaccine,” ACR President David Karp, MD, PhD, said in a press release.
So the ACR convened a panel of nine rheumatologists, two infectious disease specialists, and two public health experts. Over the course of 8 weeks, the task force reviewed the literature and agreed on recommendations. The organization posted a summary of the guidelines on its website after its board of directors approved it Feb. 8. The paper is pending journal peer review.
Some risks are real
The task force confined its research to the COVID-19 vaccines being offered by Pfizer and Moderna because they are currently the only ones approved by the Food and Drug Administration. It found no reason to distinguish between the two vaccines in its recommendations.
Because little research has directly addressed the question concerning COVID-19 vaccination for patients with rheumatic diseases, the task force extrapolated from data on other vaccinations in people with rheumatic disease and on the COVID-19 vaccinations in other populations.
It analyzed reports that other types of vaccination, such as for influenza, triggered flares of rheumatic conditions. “It is really individual case reports or small cohorts where there may be a somewhat higher incidence of flare, but it’s usually not very large in its magnitude nor duration,” said Dr. Curtis of the University of Alabama at Birmingham.
The task force also considered the possibility that vaccinations could lead to a new autoimmune disorder, such as Guillain-Barré syndrome or Bell palsy. The risk is real, the task force decided, but not significant enough to influence their recommendations.
Likewise, in immunocompromised people, vaccinations with live virus, such as those for shingles, might trigger the infection the vaccination is meant to prevent. But this can’t happen with the Pfizer and Moderna COVID-19 vaccines because they contain messenger RNA instead of live viruses, Dr. Curtis said.
Although it might be optimal to administer the vaccines when rheumatic diseases are quiescent, the urgency of getting vaccinated overrides that consideration, Dr. Curtis said. “By and large, there was a general consensus to not want to delay vaccination until somebody was stable and doing great, because you don’t know how long that’s going to be,” he said.
How well does it work?
One unanswered question is whether the COVID-19 vaccines work as well for patients with rheumatic diseases. The task force was reassured by data showing efficacy across a range of subgroups, including some with immunosenescence, Dr. Curtis said. “But until we have data in rheumatology patients, we’re just not going to know,” he said.
The guidelines specify that some drug regimens be modified when patients are vaccinated.
For patients taking rituximab, vaccination should be delayed, but only for those who are able to maintain safe social distancing to reduce the risk for COVID-19 exposure, Dr. Curtis said. “If somebody has just gotten rituximab recently, it might be more ideal to complete the vaccine series about 2-4 weeks before the next rituximab dose,” he said. “So if you are giving that therapy, say, at 6-month intervals, if you could vaccinate them at around month 5 from the most recent rituximab cycle, that might be more ideal.”
The guidance calls for withholding JAK inhibitors for a week after each vaccine dose is administered.
It calls for holding SQ abatacept 1 week prior and 1 week after the first COVID-19 vaccine dose, with no interruption after the second dose.
For abatacept IV, clinicians should “time vaccine administration so that the first vaccination will occur 4 weeks after abatacept infusion (i.e., the entire dosing interval), and postpone the subsequent abatacept infusion by 1 week (i.e., a 5-week gap in total).” It recommends no medication adjustment for the second vaccine dose.
For cyclophosphamide, the guidance recommends timing administration to occur about a week after each vaccine dose, when feasible.
None of this advice should supersede clinical judgment, Dr. Curtis said.
A version of this article first appeared on Medscape.com.
New cases of child COVID-19 drop for fifth straight week
The fifth consecutive week with a decline has the number of new COVID-19 cases in children at its lowest level since late October, according to a report from the American Academy of Pediatrics and the Children’s Hospital Association.
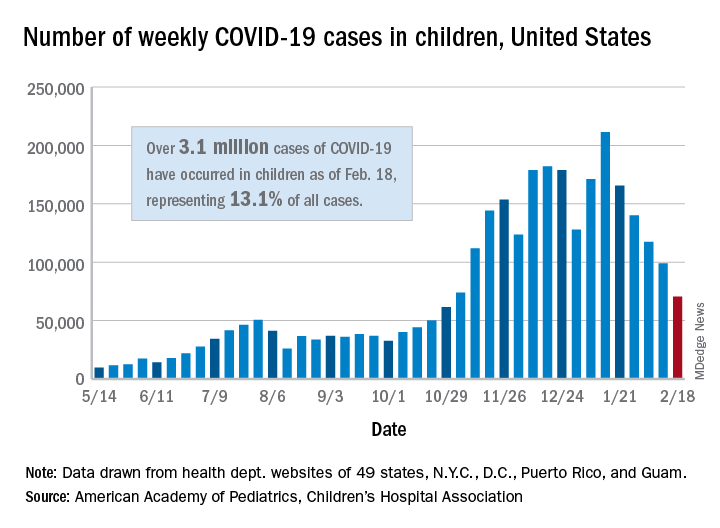
, when 61,000 cases were reported, the AAP and CHA said in their weekly COVID-19 report.
The cumulative number of COVID-19 cases in children is now just over 3.1 million, which represents 13.1% of cases among all ages in the United States, based on data gathered from the health departments of 49 states (excluding New York), the District of Columbia, New York City, Puerto Rico, and Guam.
More children in California (439,000) have been infected than in any other state, while Illinois (176,000), Florida (145,000), Tennessee (137,000), Arizona (127,000), Ohio (121,000), and Pennsylvania (111,000) are the only other states with more than 100,000 cases, the AAP/CHA report shows.
Proportionally, the children of Wyoming have been hardest hit: Pediatric cases represent 19.4% of all cases in the state. The other four states with proportions of 18% or more are Alaska, Vermont, South Carolina, and Tennessee. Cumulative rates, however, tell a somewhat different story, as North Dakota leads with just over 8,500 cases per 100,000 children, followed by Tennessee (7,700 per 100,000) and Rhode Island (7,000 per 100,000), the AAP and CHA said.
Deaths in children, which had not been following the trend of fewer new cases over the last few weeks, dropped below double digits for the first time in a month. The six deaths that occurred during the week of Feb. 12-18 bring the total to 247 since the start of the pandemic in the 43 states, along with New York City and Guam, that are reporting such data, according to the report.
The fifth consecutive week with a decline has the number of new COVID-19 cases in children at its lowest level since late October, according to a report from the American Academy of Pediatrics and the Children’s Hospital Association.
, when 61,000 cases were reported, the AAP and CHA said in their weekly COVID-19 report.
The cumulative number of COVID-19 cases in children is now just over 3.1 million, which represents 13.1% of cases among all ages in the United States, based on data gathered from the health departments of 49 states (excluding New York), the District of Columbia, New York City, Puerto Rico, and Guam.
More children in California (439,000) have been infected than in any other state, while Illinois (176,000), Florida (145,000), Tennessee (137,000), Arizona (127,000), Ohio (121,000), and Pennsylvania (111,000) are the only other states with more than 100,000 cases, the AAP/CHA report shows.
Proportionally, the children of Wyoming have been hardest hit: Pediatric cases represent 19.4% of all cases in the state. The other four states with proportions of 18% or more are Alaska, Vermont, South Carolina, and Tennessee. Cumulative rates, however, tell a somewhat different story, as North Dakota leads with just over 8,500 cases per 100,000 children, followed by Tennessee (7,700 per 100,000) and Rhode Island (7,000 per 100,000), the AAP and CHA said.
Deaths in children, which had not been following the trend of fewer new cases over the last few weeks, dropped below double digits for the first time in a month. The six deaths that occurred during the week of Feb. 12-18 bring the total to 247 since the start of the pandemic in the 43 states, along with New York City and Guam, that are reporting such data, according to the report.