User login
-
div[contains(@class, 'header__large-screen')]
div[contains(@class, 'read-next-article')]
div[contains(@class, 'main-prefix')]
div[contains(@class, 'nav-primary')]
nav[contains(@class, 'nav-primary')]
section[contains(@class, 'footer-nav-section-wrapper')]
footer[@id='footer']
section[contains(@class, 'nav-hidden')]
div[contains(@class, 'ce-card-content')]
nav[contains(@class, 'nav-ce-stack')]
div[contains(@class, 'view-medstat-quiz-listing-panes')]
div[contains(@class, 'pane-article-sidebar-latest-news')]
Fitness trackers: Useful in sleep medicine?
Who doesn’t love data, especially their own? With that thought in mind, over the years I have owned several activity trackers, including at least two Fitbits, and I frequently check my iPhone to see how far I’ve walked or how many steps I have taken. My most recent acquisition is an Oura (smart ring, third generation), which includes my first sleep tracker.
Sleep trackers are not unique to the Oura Ring; they are included on many of the newer activity trackers and smart watches, but the design and breakdown of daily sleep, activity, and readiness scores are hallmarks of Oura Rings.
The ring generates data for different phases of sleep, movements, oxygen saturation, disturbances in breathing, heart rate, and heart rate variability. I began to wonder how useful this information would be clinically and whether it might be helpful in either the diagnosis or treatment of sleep disorders.
David Neubauer, MD, is a psychiatrist at the Johns Hopkins Sleep Disorders Center. “Sleep tracking devices are more than just toys but less than medical devices. They do have clinical utility and might show findings that warrant further medical workup,” Dr. Neubauer said. “It is impressive that these devices estimate sleep as well as they do, but there is a problem with how they divide sleep stages that can lead people to believe their sleep is worse than it really is.”
For more than 50 years, he explained, sleep researchers and clinicians have categorized sleep as non–rapid eye movement (NREM) sleep stages 1-4 and REM sleep. More recently, sleep was reorganized to N1, N2, and N3 (which combines the older stages 3 and 4, representing “deep sleep” or “slow wave sleep”) and REM sleep. We normally spend more time in N2 than the other stages. However, the device companies often categorize their sleep estimates as “light sleep,” “deep sleep,” or “REM.” With “light sleep,” they are lumping together N1 and N2 sleep, and this is misleading, said Dr. Neubauer. “Understandably, people often think that there is something wrong if their tracker reports they are spending a lot of time in light sleep, when actually their sleep may be entirely normal.”
Sleep tracker validity
A study by Massimiliano de Zambotti, PhD, and colleagues, “The Sleep of the Ring: Comparison of the ŌURA Sleep Tracker Against Polysomnography”, looked at sleep patterns of 41 adolescents and young adults and concluded that the second-generation tracker was accurate in terms of total sleep but underestimated time spent in N3 stage sleep by approximately 20 minutes while overestimating time spent in REM sleep by 17 minutes. They concluded that the ring had potential to be clinically useful but that further studies and validation were needed.
A larger study of the newest, third-generation Oura tracker, conducted by Altini and Kinnunen at Oura Health, found that the added sensors with the newer-generation ring led to improved accuracy, but they noted that the study was done with a healthy population and might not generalize to clinical populations.
Fernando Goes, MD, and Matthew Reid, PhD, both at Johns Hopkins, are working on a multicenter study using the Oura Ring and the mindLAMP app to look at the impact of sleep on mood in people with mood disorders as well as healthy controls. Dr. Reid said that “validation of sleep stages takes a hit when the ring is used in people with insomnia. We find it useful for total sleep time, but when you look at sleep architecture, the concordance is only 60%. And oxygen saturation measures are less accurate in people with dark skin.”
Clinical uses for sleep trackers
More accurate information might prove reassuring to patients. Dr. Goes added, “One use, for example, might be to help patients to limit or come off of long-term hypnotics with a more benign intervention that incorporates passive monitoring such as that in the Oura Ring. Some patients worry excessively about not being able to sleep, and sleep monitoring data can be helpful to reduce some of these concerns so patients can focus on safer interventions, such as cognitive behavioral therapy for insomnia.” Dr. Reid believes that wearable trackers have potential usefulness in monitoring sleep in patients with insomnia. “In insomnia, sleep state misperception is common. They are hyper-aroused, and they perceive that they are awake when in fact they are sleeping.”
Dr. Goes mentioned another use for sleep trackers in clinical settings: “In our inpatient units, the nurses open the door to look in on patients every hour to monitor and document if they are sleeping. If they look in and the patient isn’t moving, they will ask the patient to raise their hand, which of course is not going to help someone to fall back asleep.” Wearable devices might provide data on sleep without the risk of waking patients every hour through the night.
Not medical devices
However, Dr. Neubauer emphasized that current sleep trackers are not medical devices, saying “they may be measuring the same parameters that are measured with medical devices, for example pulse oximetry or sleep states, but there’s no simple answer yet to the question of whether the devices provide reliable data for clinical decision-making.”
Dr. Neubauer is skeptical about the accuracy of some of the measures the device provides. “I would not use the information from a consumer device to rule out obstructive sleep apnea based on good oxygen saturation numbers. So much depends on the history – snoring, gasping awakenings, reports from bed partners, and daytime sleepiness. These devices do not measure respiratory effort or nasal airflow as sleep studies do. But big drops in oxygen saturation from a consumer device certainly warrant attention for further evaluation.” Dr. Neubauer also noted that the parameters on sleep trackers do not differentiate between central or obstructive sleep apnea and that insurers won’t pay for continuous positive airway pressure to treat sleep apnea without a sleep study.
I enjoy looking at the data, even knowing that they are not entirely accurate. and we may find more clinical uses for these devices. For now, I’m off to get more exercise, at the suggestion of my tracker!
Dinah Miller, MD, is assistant professor of psychiatry and behavioral sciences, Johns Hopkins Medicine, Baltimore.
A version of this article first appeared on Medscape.com.

The truth of alcohol consequences
Bad drinking consequence No. 87: Joining the LOTME team
Alcohol and college students go together like peanut butter and jelly. Or peanut butter and chocolate. Or peanut butter and toothpaste. Peanut butter goes with a lot of things.
Naturally, when you combine alcohol and college students, bad decisions are sure to follow. But have you ever wondered just how many bad decisions alcohol causes? A team of researchers from Penn State University, the undisputed champion of poor drinking decisions (trust us, we know), sure has. They’ve even conducted a 4-year study of 1,700 students as they carved a drunken swath through the many fine local drinking establishments, such as East Halls or that one frat house that hosts medieval battle–style ping pong tournaments.
The students were surveyed twice a year throughout the study, and the researchers compiled a list of all the various consequences their subjects experienced. Ultimately, college students will experience an average of 102 consequences from drinking during their 4-year college careers, which is an impressive number. Try thinking up a hundred consequences for anything.
Some consequences are less common than others – we imagine “missing the Renaissance Faire because you felt drunker the morning after than while you were drinking” is pretty low on the list – but more than 96% of students reported that they’d experienced a hangover and that drinking had caused them to say or do embarrassing things. Also, more than 70% said they needed additional alcohol to feel any effect, a potential sign of alcohol use disorder.
Once they had their list, the researchers focused on 12 of the more common and severe consequences, such as blacking out, hangovers, and missing work/class, and asked the study participants how their parents would react to their drinking and those specific consequences. Students who believed their parents would disapprove of alcohol-related consequences actually experienced fewer consequences overall.
College students, it seems, really do care what their parents think, even if they don’t express it, the researchers said. That gives space for parents to offer advice about the consequences of hard drinking, making decisions while drunk, or bringing godawful Fireball whiskey to parties. Seriously, don’t do that. Stuff’s bad, and you should feel bad for bringing it. Your parents raised you better than that.
COVID ‘expert’ discusses data sharing
We interrupt our regularly scheduled programming to bring you this special news event. Elon Musk, the world’s second-most annoying human, is holding a press conference to discuss, of all things, COVID-19.
Reporter: Hey, Mr. Musketeer, what qualifies you to talk about a global pandemic?
EM: As the official king of the Twitterverse, I’m pretty much an expert on any topic.
Reporter: Okay then, Mr. Muskmelon, what can you tell us about the new study in Agricultural Economics, which looked at consumers’ knowledge of local COVID infection rates and their willingness to eat at restaurants?

EM: Well, I know that one of the investigators, Rigoberto Lopez, PhD, of the University of Connecticut, said “no news is bad news.” Restaurants located in cities where local regulations required COVID tracking recovered faster than those in areas that did not, according to data from 87 restaurants in 10 Chinese cities that were gathered between Dec. 1, 2019, and March 27, 2020. Having access to local infection rate data made customers more comfortable going out to eat, the investigators explained.
Second reporter: Interesting, Mr. Muskox, but how about this headline from CNN: “Workers flee China’s biggest iPhone factory over Covid outbreak”? Do you agree with analysts, who said that “the chaos at Zhengzhou could jeopardize Apple and Foxconn’s output in the coming weeks,” as CNN put it?
EM: I did see that a manager at Foxconn, which owns the factory and is known to its friends as Hon Hai Precision Industry, told a Chinese media outlet that “workers are panicking over the spread of the virus at the factory and lack of access to official information.” As we’ve already discussed, no news is bad news.
That’s all the time I have to chat with you today. I’m off to fire some more Twitter employees.
In case you hadn’t already guessed, Vlad Putin is officially more annoying than Elon Musk. We now return to this week’s typical LOTME shenanigans, already in progress.
The deadliest month
With climate change making the world hotter, leading to more heat stroke and organ failure, you would think the summer months would be the most deadly. In reality, though, it’s quite the opposite.

There are multiple factors that make January the most deadly month out of the year, as LiveScience discovered in a recent analysis.
Let’s go through them, shall we?
Respiratory viruses: Robert Glatter, MD, of Lenox Hill Hospital in New York, told LiveScence that winter is the time for illnesses like the flu, bacterial pneumonia, and RSV. Millions of people worldwide die from the flu, according to the CDC. And the World Health Organization reported lower respiratory infections as the fourth-leading cause of death worldwide before COVID came along.
Heart disease: Heart conditions are actually more fatal in the winter months, according to a study published in Circulation. The cold puts more stress on the heart to keep the body warm, which can be a challenge for people who already have preexisting heart conditions.
Space heaters: Dr. Glatter also told Live Science that the use of space heaters could be a factor in the cold winter months since they can lead to carbon monoxide poisoning and even fires. Silent killers.
Holiday season: A time for joy and merriment, certainly, but Christmas et al. have their downsides. By January we’re coming off a 3-month food and alcohol binge, which leads to cardiac stress. There’s also the psychological stress that comes with the season. Sometimes the most wonderful time of the year just isn’t.
So even though summer is hot, fall has hurricanes, and spring tends to have the highest suicide rate, winter still ends up being the deadliest season.
Bad drinking consequence No. 87: Joining the LOTME team
Alcohol and college students go together like peanut butter and jelly. Or peanut butter and chocolate. Or peanut butter and toothpaste. Peanut butter goes with a lot of things.
Naturally, when you combine alcohol and college students, bad decisions are sure to follow. But have you ever wondered just how many bad decisions alcohol causes? A team of researchers from Penn State University, the undisputed champion of poor drinking decisions (trust us, we know), sure has. They’ve even conducted a 4-year study of 1,700 students as they carved a drunken swath through the many fine local drinking establishments, such as East Halls or that one frat house that hosts medieval battle–style ping pong tournaments.
The students were surveyed twice a year throughout the study, and the researchers compiled a list of all the various consequences their subjects experienced. Ultimately, college students will experience an average of 102 consequences from drinking during their 4-year college careers, which is an impressive number. Try thinking up a hundred consequences for anything.
Some consequences are less common than others – we imagine “missing the Renaissance Faire because you felt drunker the morning after than while you were drinking” is pretty low on the list – but more than 96% of students reported that they’d experienced a hangover and that drinking had caused them to say or do embarrassing things. Also, more than 70% said they needed additional alcohol to feel any effect, a potential sign of alcohol use disorder.
Once they had their list, the researchers focused on 12 of the more common and severe consequences, such as blacking out, hangovers, and missing work/class, and asked the study participants how their parents would react to their drinking and those specific consequences. Students who believed their parents would disapprove of alcohol-related consequences actually experienced fewer consequences overall.
College students, it seems, really do care what their parents think, even if they don’t express it, the researchers said. That gives space for parents to offer advice about the consequences of hard drinking, making decisions while drunk, or bringing godawful Fireball whiskey to parties. Seriously, don’t do that. Stuff’s bad, and you should feel bad for bringing it. Your parents raised you better than that.
COVID ‘expert’ discusses data sharing
We interrupt our regularly scheduled programming to bring you this special news event. Elon Musk, the world’s second-most annoying human, is holding a press conference to discuss, of all things, COVID-19.
Reporter: Hey, Mr. Musketeer, what qualifies you to talk about a global pandemic?
EM: As the official king of the Twitterverse, I’m pretty much an expert on any topic.
Reporter: Okay then, Mr. Muskmelon, what can you tell us about the new study in Agricultural Economics, which looked at consumers’ knowledge of local COVID infection rates and their willingness to eat at restaurants?
EM: Well, I know that one of the investigators, Rigoberto Lopez, PhD, of the University of Connecticut, said “no news is bad news.” Restaurants located in cities where local regulations required COVID tracking recovered faster than those in areas that did not, according to data from 87 restaurants in 10 Chinese cities that were gathered between Dec. 1, 2019, and March 27, 2020. Having access to local infection rate data made customers more comfortable going out to eat, the investigators explained.
Second reporter: Interesting, Mr. Muskox, but how about this headline from CNN: “Workers flee China’s biggest iPhone factory over Covid outbreak”? Do you agree with analysts, who said that “the chaos at Zhengzhou could jeopardize Apple and Foxconn’s output in the coming weeks,” as CNN put it?
EM: I did see that a manager at Foxconn, which owns the factory and is known to its friends as Hon Hai Precision Industry, told a Chinese media outlet that “workers are panicking over the spread of the virus at the factory and lack of access to official information.” As we’ve already discussed, no news is bad news.
That’s all the time I have to chat with you today. I’m off to fire some more Twitter employees.
In case you hadn’t already guessed, Vlad Putin is officially more annoying than Elon Musk. We now return to this week’s typical LOTME shenanigans, already in progress.
The deadliest month
With climate change making the world hotter, leading to more heat stroke and organ failure, you would think the summer months would be the most deadly. In reality, though, it’s quite the opposite.
There are multiple factors that make January the most deadly month out of the year, as LiveScience discovered in a recent analysis.
Let’s go through them, shall we?
Respiratory viruses: Robert Glatter, MD, of Lenox Hill Hospital in New York, told LiveScence that winter is the time for illnesses like the flu, bacterial pneumonia, and RSV. Millions of people worldwide die from the flu, according to the CDC. And the World Health Organization reported lower respiratory infections as the fourth-leading cause of death worldwide before COVID came along.
Heart disease: Heart conditions are actually more fatal in the winter months, according to a study published in Circulation. The cold puts more stress on the heart to keep the body warm, which can be a challenge for people who already have preexisting heart conditions.
Space heaters: Dr. Glatter also told Live Science that the use of space heaters could be a factor in the cold winter months since they can lead to carbon monoxide poisoning and even fires. Silent killers.
Holiday season: A time for joy and merriment, certainly, but Christmas et al. have their downsides. By January we’re coming off a 3-month food and alcohol binge, which leads to cardiac stress. There’s also the psychological stress that comes with the season. Sometimes the most wonderful time of the year just isn’t.
So even though summer is hot, fall has hurricanes, and spring tends to have the highest suicide rate, winter still ends up being the deadliest season.
Race and gender: Tailoring treatment for sleep disorders is preferred and better
While trials of various interventions for obstructive sleep apnea and insomnia were effective, there was a strong suggestion that tailoring them according to the race/gender of the target populations strengthens engagement and improvements, according to a presentation by Dayna A. Johnson, PhD, MPH, at the annual meeting of the American College of Chest Physicians (CHEST).
Dr. Johnson, assistant professor at Emory University in Atlanta, stated that determinants of sleep disparities are multifactorial across the lifespan, from in utero to aging, but it was also important to focus on social determinants of poor sleep.
The complexity of factors, she said, calls for multilevel interventions beyond screening and treatment. In addition, neighborhood factors including safety, noise and light pollution, ventilation, and thermal comfort come into play.
Dr. Johnson cited the example of parents who work multiple jobs to provide for their families: “Minimum wage is not a livable wage, and parents may not be available to ensure that children have consistent bedtimes.” Interventions, she added, may have to be at the neighborhood level, including placing sleep specialists in the local neighborhood “where the need is.” Cleaning up a neighborhood reduces crime and overall health, while light shielding in public housing can lower light pollution.
Observing that African Americans have higher rates of obstructive sleep apnea, Dr. Johnson and colleagues designed a screening tool specifically for African Americans with five prediction models with increasing levels of factor measurements (from 4 to 10). The prediction accuracy across the models ascended in lockstep with the number of measures from 74.0% to 76.1%, with the simplest model including only age, body mass index, male sex, and snoring. The latter model added witnessed apneas, high depressive symptoms, two measures of waist and neck size, and sleepiness. Dr. Johnson pointed out that accuracy for well-established predictive models is notably lower: STOP-Bang score ranges from 56% to 66%; NoSAS ranges from 58% to 66% and the HCHS prediction model accuracy is 70%. Dr. Johnson said that a Latino model they developed was more accurate than the traditional models, but not as accurate as their model for African Americans.
Turning to specific interventions, and underscoring higher levels of stress and anxiety among African American and Hispanic populations, Dr. Johnson cited MINDS (Mindfulness Intervention to Improve Sleep and Reduce Diabetes Risk Among a Diverse Sample in Atlanta), her study at Emory University of mindfulness meditation. Although prior studies have confirmed sleep benefits of mindfulness meditation, studies tailored for African American or Hispanic populations have been lacking.
The MINDS pilot study investigators enrolled 17 individuals (mostly women, with a mixture of racial and ethnic groups comprising Black, White, Asian and Hispanic patients) with poor sleep quality as measured by the Pittsburgh Sleep Quality Index (PSQI). Most patients, Dr. Johnson said, were overweight. Because of COVID restrictions on clinic visits, the diabetes portion of the study was dropped. All participants received at least 3 days of instruction on mindfulness meditation, on dealing with stress and anxiety, and on optimum sleep health practices. While PSQI scores higher than 5 are considered to indicate poor sleep quality, the mean PSQI score at study outset in MINDS was 9.2, she stated.
After 30 days of the intervention, stress (on a perceived stress scale) was improved, as were PSQI scores and actigraphy measures of sleep duration, efficiency and wakefulness after sleep onset, Dr. Johnson reported. “Participants found the mindfulness app to be acceptable and appropriate, and to reduce time to falling asleep,” Dr. Johnson said.
Qualitative data gathered post intervention from four focus groups (two to six participants in each; 1-1.5 hours in length), revealed general acceptability of the MINDS app. It showed also that among those with 50% or more adherence to the intervention, time to falling asleep was reduced, as were sleep awakenings at night. The most striking finding, Dr. Johnson said, was that individuals from among racial/ethnic minorities expressed appreciation of the diversity of the meditation instructors, and said that they preferred instruction from a person of their own race and sex. Findings would be even more striking with a larger sample size, Dr. Johnson speculated.
Citing TASHE (Tailored Approach to Sleep Health Education), a further observational study on obstructive sleep apnea knowledge conducted at New York University, Dr. Johnson addressed the fact that current messages are not tailored to race/ethnic minorities with low-to-moderate symptom knowledge. Also, a 3-arm randomized clinical trial of Internet-delivered treatment (Sleep Healthy or SHUTI) with a version revised for Black women (SHUTI-BWHS) showed findings similar to those of other studies cited and suggested: “Tailoring may be necessary to increase uptake and sustainability and to improve sleep among racial/ethnic minorities.”
Dr. Johnson noted, in closing, that Black/African American individuals have higher risk for obstructive sleep apnea than that of their White counterparts and lower rates of screening for treatment.
Dr. Johnson’s research was funded by the National Institutes of Health; National Heart, Lung, and Blood Institute; Woodruff Health Sciences Center; Synergy Award; Rollins School of Public Health Dean’s Pilot and Innovation Award; and Georgia Center for Diabetes Translation Research Pilot and Feasibility award program. She reported no relevant conflicts.
FROM CHEST 2022
Mid-October flulike illness cases higher than past 5 years
Outpatient visits for influenzalike illness (ILI), which includes influenza, SARS-CoV-2, and RSV, were higher after 3 weeks than for any of the previous five flu seasons: 3.3% of visits reported through the CDC’s Outpatient Influenza-like Illness Surveillance Network involved ILI as of Oct. 22. The highest comparable rate in the previous 5 years was the 1.9% recorded in late October of 2021, shortly after the definition of ILI was changed to also include illnesses other than influenza.
This season’s higher flu activity is in contrast to the previous two, which were unusually mild. The change, however, is not unexpected, as William Schaffner, MD, an infectious disease expert and professor of preventive medicine at Vanderbilt University, recently told CNN.
“Here we are in the middle of October – not the middle of November – we’re already seeing scattered influenza cases, even hospitalized influenza cases, around the country,” he said. “So we know that this virus is now spreading out in the community already. It’s gathering speed already. It looks to me to be about a month early.”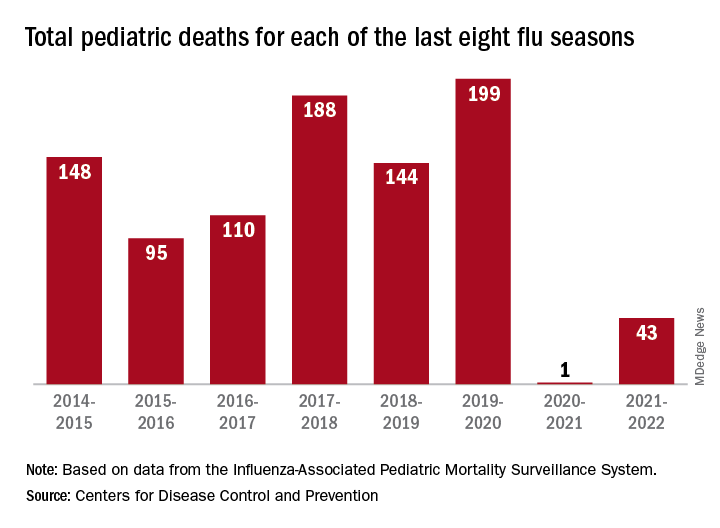
One indication of the mildness of the previous two flu seasons was the number of deaths, both pediatric and overall. Influenza-associated pediatric deaths had averaged about 110 per season over the previous eight seasons, compared with just 1 for 2020-2021 and 43 in 2021-2022. Overall flu deaths never reached 1% of all weekly deaths for either season, well below baseline levels for the flu, which range from 5.5% to 6.8%, CDC data show.
Other indicators of early severity
This season’s early rise in viral activity also can be seen in hospitalizations. The cumulative rate of flu-related admissions was 1.5 per 100,000 population as of Oct. 22, higher than the rate observed in the comparable week of previous seasons going back to 2010-2011, according to the CDC’s Influenza Hospitalization Surveillance Network.
A look at state reports of ILI outpatient visit rates shows that the District of Columbia and South Carolina are already in the very high range of the CDC’s severity scale, while 11 states are in the high range. Again going back to 2010-2011, no jurisdiction has ever been in the very high range this early in the season, based on data from the Outpatient Influenza-like Illness Surveillance Network.
‘Unappreciated’ ties between COVID and gut dysbiosis
(BSIs), new research suggests.
“Collectively, these results reveal an unappreciated link between SARS-CoV-2 infection, gut microbiome dysbiosis, and a severe complication of COVID-19, BSIs,” the study team reported in Nature Communications.
“Our findings suggest that coronavirus infection directly interferes with the healthy balance of microbes in the gut, further endangering patients in the process,” microbiologist and co–senior author Ken Cadwell, PhD, New York University, added in a news release. “Now that we have uncovered the source of this bacterial imbalance, physicians can better identify those coronavirus patients most at risk of a secondary bloodstream infection.”
In a mouse model, the researchers first demonstrated that the SARS-CoV-2 infection alone induces gut microbiome dysbiosis and gut epithelial cell alterations, which correlate with markers of gut barrier permeability.
Next, they analyzed the bacterial composition of stool samples from 96 adults hospitalized with COVID-19 in 2020 in New York and New Haven, Conn.
In line with their observations in mice, they found that the SARS-CoV-2 infection is associated with “severe microbiome injury,” characterized by the loss of gut microbiome diversity.
They also observed an increase in populations of several microbes known to include antibiotic-resistant species. An analysis of stool samples paired with blood cultures found that antibiotic-resistant bacteria in the gut migrated to the bloodstream in 20% of patients.
This migration could be caused by a combination of the immune-compromising effects of the viral infection and the antibiotic-driven depletion of commensal gut microbes, the researchers said.
However, COVID-19 patients are also uniquely exposed to other potential factors predisposing them to bacteremia, including immunosuppressive drugs, long hospital stays, and catheters, the investigators noted. The study is limited in its ability to investigate the individual effects of these factors.
“Our findings support a scenario in which gut-to-blood translocation of microorganisms following microbiome dysbiosis leads to dangerous BSIs during COVID-19, a complication seen in other immunocompromised patients, including patients with cancer, acute respiratory distress syndrome, and in ICU patients receiving probiotics,” the researchers wrote.
Investigating the underlying mechanism behind their observations could help inform “the judicious application of antibiotics and immunosuppressives in patients with respiratory viral infections and increase our resilience to pandemics,” they added.
Funding for the study was provided by the National Institutes of Health, the Yale School of Public Health, and numerous other sources. Dr. Cadwell has received research support from Pfizer, Takeda, Pacific Biosciences, Genentech, and AbbVie; consulted for or received an honoraria from PureTech Health, Genentech, and AbbVie; and is named as an inventor on US patent 10,722,600 and provisional patents 62/935,035 and 63/157,225.
A version of this article first appeared on Medscape.com.
FROM NATURE COMMUNICATIONS
Children and COVID: Weekly cases can’t sustain downward trend
New COVID-19 cases in children inched up in late October, just 1 week after dipping to their lowest level in more than a year, and some measures of pediatric emergency visits and hospital admissions rose as well.
There was an 8% increase in the number of cases for the week of Oct. 21-27, compared with the previous week, but this week’s total was still below 25,000, and the overall trend since the beginning of September is still one of decline, based on data from the American Academy of Pediatrics and the Children’s Hospital Association.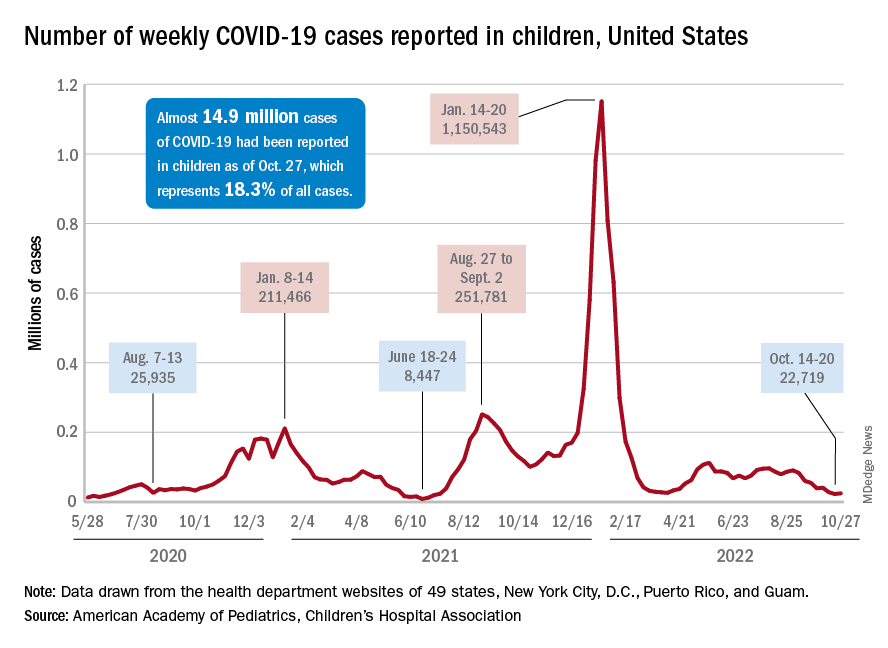
A similar increase can be seen for hospitalizations with confirmed COVID. The rate for children aged 0-17 years fell from 0.44 admissions per 100,000 population at the end of August to 0.16 per 100,000 on Oct. 23. Hospitalizations have since ticked up to 0.17 per 100,000, according to the Centers for Disease Control and Prevention.
Emergency department visits with diagnosed COVID among children aged 16-17 years, as a percentage of all ED visits, rose from 0.6% on Oct. 21 to 0.8% on Oct. 26. ED visits for 12- to 15-year-olds rose from 0.6% to 0.7% at about the same time, with both increases coming after declines that started in late August. No such increase has occurred yet among children aged 0-11 years, the CDC reported on its COVID Data Tracker.
One small milestone reached in the past week involved the proportion of all COVID cases that have occurred in children. The total number of child cases as of Oct. 27 was almost 14.9 million, which represents 18.3% of cases in all Americans, according to the AAP and CHA. That figure had been sitting at 18.4% since mid-August after reaching as high as 19.0% during the spring.
The CDC puts total COVID-related hospital admissions for children aged 0-17 at 163,588 since Aug. 1, 2020, which is 3.0% of all U.S. admissions. Total pediatric deaths number 1,843, or just about 0.2% of all COVID-related fatalities since the start of the pandemic, the CDC data show.
The latest vaccination figures show that 71.3% of children aged 12-17 years have received at least one dose, as have 38.8% of 5- to 11-year-olds, 8.4% of 2- to 4-year-olds, and 5.5% of those under age 2. Full vaccination by age group looks like this: 60.9% (12-17 years), 31.7% (5-11 years), 3.7% (2-4 years), and 2.1% (<2 years), the CDC reported. Almost 30% of children aged 12-17 have gotten a first booster dose, as have 16% of 5- to 11-year-olds.
Best anticoagulant for minimizing bleeding risk identified
A commonly prescribed direct oral anticoagulant (DOAC) has the lowest risk of bleeding, say researchers. Used to prevent strokes in those with atrial fibrillation (AFib), DOACs have recently become more common than warfarin, the previous standard treatment, as they do not require as much follow-up monitoring – which was “particularly valuable” during the COVID-19 pandemic – and have “less risk” of side effects, highlighted the authors of a new study, published in Annals of Internal Medicine.
However, the authors explained that, although current guidelines recommend using DOACs over warfarin in patients with AFib, “head-to-head trial data do not exist to guide the choice of DOAC.” So, they set out to try and fill this evidence gap by doing a large-scale comparison between all DOACs – apixaban, dabigatran, edoxaban, and rivaroxaban – in routine clinical practice.
Wallis Lau, PhD, University College London, and co–lead author, said: “Direct oral anticoagulants have been prescribed with increasing frequency worldwide in recent years, but evidence comparing them directly has been limited.”
One drug stood out
For the multinational population-based cohort study the researchers compared the efficacy and risk of side effects for the four most common DOACs. They reviewed data – from five standardized electronic health care databases that covered 221 million people in the United Kingdom, France, Germany, and the United States – of 527,226 patients who had been newly diagnosed with AFib between 2010 and 2019, and who had received a new DOAC prescription. The study included 281,320 apixaban users, 61,008 dabigatran users, 12,722 edoxaban users, and 172,176 rivaroxaban users.
Database-specific hazard ratios of ischemic stroke or systemic embolism, intracranial hemorrhage, gastrointestinal bleeding, and all-cause mortality between DOACs were estimated using a Cox regression model stratified by propensity score and pooled using a random-effects model.
In total, 9,530 ischemic stroke or systemic embolism events, 841 intercranial hemorrhage events, 8,319 gastrointestinal bleeding events, and 1,476 deaths were identified over the study follow-up. The researchers found that all four drugs were comparable on outcomes for ischemic stroke, intercranial hemorrhage, and all-cause mortality.
However, they identified a difference in the risk of gastrointestinal bleeding, which they highlighted “is one of the most common and concerning side effects of DOACs.”
“Apixaban stood out as having lower risk of gastrointestinal bleeding,” said the authors, with a 19%-28% lower risk when compared directly with each of the other three DOACs. Specifically, apixaban use was associated with lower risk for gastrointestinal bleeding than use of dabigatran (HR, 0.81; 95% confidence interval, 0.70-0.94), edoxaban (HR, 0.77; 95% CI, 0.66-0.91), or rivaroxaban (HR, 0.72; 95% CI, 0.66-0.79).
The researchers also highlighted that their findings held true when looking at data only from those aged over 80, and those with chronic kidney disease, two groups that are “often underrepresented” in clinical trials.
Apixaban may be preferable
The researchers concluded that, compared with dabigatran, edoxaban, and rivaroxaban.
“Our results indicate that apixaban may be preferable to other blood thinners because of the lower rate of gastrointestinal bleeding and similar rates of stroke, a finding that we hope will be supported by randomized controlled trials,” said Dr. Lau.
However, he emphasized that, “as with all medications, potential risks and benefits can differ between people, so considering the full spectrum of outcomes and side effects will still be necessary for each individual patient.”
The authors all declared no conflicting interests.
A version of this article first appeared on Medscape UK.
FROM ANNALS OF INTERNAL MEDICINE
Metabolites may distinguish severe subtypes of PAH
, based on data from approximately 1,500 individuals.
The overall prognosis and therapeutic response for patients with pulmonary arterial hypertension associated with systemic sclerosis (SSc-PAH) tends to be worse than for patients with other types of PAH, such as idiopathic pulmonary arterial hypertension (IPAH), but the impact of different metabolite profiles among subtypes of disease has not been explored, wrote Mona Alotaibi, MD, of the University of California, San Diego, and colleagues.
“Recently, metabolic dysregulation has been proposed as a key mechanism by which IPAH and SSc-PAH differ and could control such disparities,” they noted. Clarifying the molecular mechanisms of SSc-PAH could inform management and treatment, they added.
In a study published in the journal Chest, the researchers sought to identify a bioactive lipid signature unique to SSc-PAH. They identified 400 patients with SSc-PAH and 1,082 with IPAH. An additional 100 patients with scleroderma but no PH and 44 patients with scleroderma who had PH were included for external validation. The mean ages of the patients with IPAH and SSc-PAH in the discovery and validation cohorts ranged from approximately 51 to 65 years; more than 75% of patients across the groups were women.
The researchers tested more than 700 bioactive lipid metabolites using liquid chromatography/mass spectrometry. They found five metabolites that distinguished SSc-PAH and IPAH that were significantly associated with markers of disease severity: 17-beta estradiol, novel Eic, nervonic acid, fatty acid esters of hydroxy fatty acids, and prostaglandin F2 alpha (PGF 2 alpha).
The biomarkers were increased in SSc-PAH patients compared to patients with SSC alone, which suggests that the biomarkers are related to PAH and not to scleroderma alone, the researchers noted.
In particular, nervonic acid was associated with worse functional capacity, in SSc-PAH patients, as were higher levels of 17-beta estradiol and prostaglandin F2 alpha. Also, 17-beta estradiol was associated with lower cardiac impairment (CI) and stroke volume index (SVI) in SSc-PAH patients, but higher SVI in IPAH patients. PGF 2 alpha was associated with lower CI and SVI and higher pulmonary vascular resistance in SSc-PAH and IPAH combined.
The study findings were limited by several factors including the inability to adjust for all potential confounders between IPAH and SSc-PAH, and the fact that a clear causal relationship could not be determined, the researchers noted. Inadequate statistical power to analyze SSc-PAH data was another limitation, and studies with detailed scleroderma phenotypes are needed to validate the results, they said.
However, the current study provides insight on the metabolic differences in SSc-PAH and the potential impact on disease pathology that may inform diagnosis, prognosis, and treatment strategies for SSc-PAH patients, they concluded.
The study was supported by the National Institutes of Health. Several individual investigators received support from organizations including the American Heart Association and the Chest Foundation, and from companies including Livanova, Equillium, Corvus, Bayer, and Actelion, but the authors had no relevant financial conflicts to disclose.
FROM CHEST
Thyroid dysfunction may linger a year after severe COVID-19
MONTREAL – Patients hospitalized with severe COVID-19 and no prior history of thyroid dysfunction show signs of thyroiditis that, although asymptomatic, continue to persist for up to a year after infection, according to research that adds to evidence on the complex involvement of the thyroid in COVID-19.
“To our knowledge these findings are novel,” first author Ilaria Muller, MD, PhD, an assistant professor in endocrinology in the department of clinical sciences and community health, University of Milan, told this news organization.
“Little has been written about the long-term follow-up of thyroid function after severe COVID-19 disease, and we have followed patients up to 1 year after infection.”
The effects are seen in about 10%-15% of patients, and “[while] the thyroid dysfunction is transient, ultrasound areas of thyroiditis may persist after 1 year, even if they progressively shrink,” said Dr. Muller, who presented the findings at the American Thyroid Association annual meeting.
Immunological scars? Clinical implications unclear
The nature and implications of the persistent thyroiditis areas are uncertain, Dr. Muller noted. “These areas of thyroiditis are likely a sort of ‘immunologic scar’ of the previous SARS-CoV-2 infection,” she explained. “We still don’t know if there are clinical implications, even if they seem unlikely.”
Of note, increases in autoimmune processes or a higher incidence of thyroid dysfunction after COVID-19 have not been observed, and the shrinkage of the areas of thyroiditis over time is encouraging, she said.
The reasons why some patients develop atypical thyroiditis and others don’t are also unclear, with Dr. Muller’s team investigating further. Importantly, similar effects have been associated with other severe infections, not just COVID-19. “It is well known that in classic subacute thyroiditis due to other viral infections, the areas of thyroiditis persist for months, so this phenomenon might not be unique to COVID-19,” she explained.
Commenting on the story, Jeffrey R. Garber, MD, also noted that such thyroiditis areas stemming from other types of infection may persist – but go unnoticed.
“Resolution is the clinical rule, [and] we generally do not restudy in detail those who clinically recover,” he said in an interview. “However, there is evidence of impaired thyroid reserve in those who recover from viral thyroiditis due to other sources.”
“Thyroid symptoms are often not specific, so ‘atypical’ [cases] are common, [and] resolution with restoring thyroid status to normal is mixed,” noted Dr. Garber, an associate professor of medicine at Harvard Medical School and chief of the division of endocrinology at Atrius Health, Boston.
In terms of clinical practice, while such issues should be kept in mind when evaluating abnormal thyroid tests during severe COVID-19, “it is not a call for routinely checking it in the absence of clinical suspicion,” he observed.
Study details
Dr. Muller and her team previously observed that patients hospitalized in intensive care with COVID-19 often had low or suppressed serum thyroid-stimulating hormone (TSH) levels, with and without elevated free thyroxine (FT4) concentrations, suggestive of thyrotoxicosis.
Upon investigating those cases, they found, as in their previous study reported by this news organization, that a painless, atypical thyroiditis occurs with nonthyroidal illness syndrome among patients hospitalized with severe COVID-19. The atypical thyroiditis was slightly more common in men and was associated with lymphopenia.
To further investigate those cases and follow patients up to 1 year, the team conducted a longitudinal study of 183 patients hospitalized with severe COVID-19 in Italy. The patients, who had no known prior history of thyroid dysfunction, were assessed for serum thyroid function, autoantibodies, and inflammatory markers.
At baseline, 10% of the patients were found to have thyrotoxicosis, and ultrasound performed within 2-3 months postinfection on 65 patients showed that 18 (28%) had areas of thyroiditis.
Importantly, 60% of those patients with the areas of thyroiditis had low TSH levels, while 25% had normal TSH levels (P = .034).
In addition, those showing the presence of thyroiditis on ultrasound at 23 months were more likely to have elevated serum concentrations of FT4 (P = .018) and higher levels of interleukin-26 (P = .016), compared with those with normal ultrasound readings.
In a longitudinal analysis further following patients post infection, among 15 patients who were evaluated at 6 months, most, 13 (87%), still had areas of thyroiditis, and 6 of 12 (50%) had thyroiditis areas that, though reduced in size, still persisted even at 12 months.
In terms of thyroid uptake, at 3 months, 14 of 17 patients (82%) had diffused or focal areas of a reduction of uptake. After 6 months, there was a recovery, with a median of 28% of thyroid uptake recovered, however, 67% of patients still had some focal or diffused reduction in thyroid uptake.
Of note, the indications of thyroiditis on imaging persisted even though patients’ TSH levels had quickly normalized at the end of infection and remained normal up to 1 year of follow-up.
The patients showed no apparent development of thyroglobulin antibody, thyroid peroxidase antibodies, or TSH receptor antibodies.
A further fine needle aspiration analysis of eight patients with atypical thyroiditis at 3 months after infection showed that those patients had tissue resident memory T cells (CD4+/CD8+/CD103+/CD69+) within the thyroid, but not in the blood as expected.
Additional assessments at 8 months after infection showed those tissue resident memory T cells continued to be present on imaging.
The results showed “SARS-CoV-2–specific T cells were enriched within the thyroid compared with the blood, many with a tissue resident phenotype,” Dr. Muller explained.
The findings are notable in that “such an in-depth characterization of areas of thyroiditis triggered by SARS-CoV-2 infection combining ultrasound, scintigraphy, and immunological phenotyping has not been performed so far,” she said.
“In particular, SARS-CoV-2–specific tissue-resident memory T lymphocytes have not been described before in the thyroid gland.”
Dr. Muller and Dr. Garber have reported no relevant financial relationships.
A version of this article first appeared on Medscape.com.
AT ATA 2022
Younger doctors call for more attention to patients with disabilities
As an undergraduate student at Northeastern University in Boston, Meghan Chin spent her summers working for a day program in Rhode Island. Her charges were adults with various forms of intellectual and developmental disabilities (IDD).
“I was very much a caretaker,” Ms. Chin, now 29, said. “It was everything from helping them get dressed in the morning to getting them to medical appointments.”
During one such visit Ms. Chin got a lesson about how health care looks from the viewpoint of someone with an IDD.
The patient was a woman in her 60s and she was having gastrointestinal issues; symptoms she could have articulated, if asked. “She was perfectly capable of telling a clinician where it hurt, how long she had experienced the problem, and what she had done or not done to alleviate it,” Ms. Chin said.
And of comprehending a response. But she was not given the opportunity.
“She would explain what was going on to the clinician,” Ms. Chin recalled. “And the clinician would turn to me and answer. It was this weird three-way conversation – as if she wasn’t even there in the room with us.”
Ms. Chin was incensed at the rude and disrespectful way the patient had been treated. But her charge didn’t seem upset or surprised. Just resigned. “Sadly, she had become used to this,” Ms. Chin said.
For the young aide, however, the experience was searing. “It didn’t seem right to me,” Ms. Chin said. “That’s why, when I went to medical school, I knew I wanted to do better for this population.”
Serendipity led her to Georgetown University, Washington, where she met Kim Bullock, MD, one of the country’s leading advocates for improved health care delivery to those with IDDs.
Dr. Bullock, an associate professor of family medicine, seeks to create better training and educational opportunities for medical students who will likely encounter patients with these disabilities in their practices.
When Dr. Bullock heard Ms. Chin’s story about the patient being ignored, she was not surprised.
“This is not an unusual or unique situation,” said Dr. Bullock, who is also director of Georgetown’s community health division and a faculty member of the university’s Center for Excellence for Developmental Disabilities. “In fact, it’s quite common and is part of what spurred my own interest in educating pre-med and medical students about effective communication techniques, particularly when addressing neurodiverse patients.”
More than 13% of Americans, or roughly 44 million people, have some form of disability, according to the National Institute on Disability at the University of New Hampshire, a figure that does not include those who are institutionalized. The Centers for Disease Control and Prevention estimates that 17% of children aged 3-17 years have a developmental disability.
Even so, many physicians feel ill-prepared to care for disabled patients. A survey of physicians, published in the journal Health Affairs, found that some lacked the resources and training to properly care for patients with disabilities, or that they struggled to coordinate care for such individuals. Some said they did not know which types of accessible equipment, like adjustable tables and chair scales, were needed or how to use them. And some said they actively try to avoid treating patients with disabilities.
Don’t assume
The first step at correcting the problem, Dr. Bullock said, is to not assume that all IDD patients are incapable of communicating. By talking not to the patient but to their caregiver or spouse or child, as the clinician did with Ms. Chin years ago, “we are taking away their agency, their autonomy to speak for and about themselves.”
Change involves altering physicians’ attitudes and assumptions toward this population, through education. But how?
“The medical school curriculum is tight as it is,” Dr. Bullock acknowledged. “There’s a lot of things students have to learn. People wonder: where we will add this?”
Her suggestion: Incorporate IDD all along the way, through programs or experiences that will enable medical students to see such patients “not as something separate, but as people that have special needs just as other populations have.”
Case in point: Operation House Call, a program in Massachusetts designed to support young health care professionals, by building “confidence, interest, and sensitivity” toward individuals with IDD.
Eight medical and allied health schools, including those at Harvard Medical School and Yale School of Nursing, participate in the program, the centerpiece of which is time spent by teams of medical students in the homes of families with neurodiverse members. “It’s transformational,” said Susan Feeney, DNP, NP-C, director of adult gerontology and family nurse practitioner programs at the graduate school of nursing at the University of Massachusetts, Worcester. “They spend a few hours at the homes of these families, have this interaction with them, and journal about their experiences.”
Dr. Feeney described as “transformational” the experience of the students after getting to know these families. “They all come back profoundly changed,” she told this news organization. “As a medical or health care professional, you meet people in an artificial environment of the clinic and hospital. Here, they become human, like you. It takes the stigma away.”
One area of medicine in which this is an exception is pediatrics, where interaction with children with IDD and their families is common – and close. “They’re going to be much more attuned to this,” Dr. Feeney said. “The problem is primary care or internal medicine. Once these children get into their mid and later 20s, and they need a practitioner to talk to about adult concerns.”
And with adulthood come other medical needs, as the physical demands of age fall no less heavily on individuals with IDDs than those without. For example: “Neurodiverse people get pregnant,” Dr. Bullock said. They also can get heart disease as they age; or require the care of a rheumatologist, a neurologist, an orthopedic surgeon, or any other medical specialty.
Generation gap
Fortunately, the next generation of physicians may be more open to this more inclusionary approach toward a widely misunderstood population.
Like Ms. Chin, Sarah Bdeir had experience with this population prior to beginning her training in medicine. She had volunteered at a school for people with IDD.
“It was one of the best experiences I’ve ever had,” Ms. Bdeir, now 23 and a first-year medical student at Wayne State University, Detroit, said. She found that the neurodiverse individuals she worked with had as many abilities as disabilities. “They are capable of learning, but they do it differently,” she said. “You have to adjust to the way they learn. And you have to step out of your own box.”
Ms. Bdeir also heard about Dr. Bullock’s work and is assisting her in a research project on how to better improve nutritional education for people with IDDs. And although she said it may take time for curriculum boards at medical schools to integrate this kind of training into their programs, she believes they will, in part because the rising cohort of medical students today have an eagerness to engage with and learn more about IDD patients.
As does Ms. Chin.
“When I talk to my peers about this, they’re very receptive,” Ms. Chin said. “They want to learn how to better support the IDD population. And they will learn. I believe in my generation of future doctors.”
A version of this article first appeared on Medscape.com.