User login
Richard Franki is the associate editor who writes and creates graphs. He started with the company in 1987, when it was known as the International Medical News Group. In his years as a journalist, Richard has worked for Cap Cities/ABC, Disney, Harcourt, Elsevier, Quadrant, Frontline, and Internet Brands. In the 1990s, he was a contributor to the ill-fated Indications column, predecessor of Livin' on the MDedge.
Hydroxychloroquine use rising in SLE pregnancies
but its use “remains low, and that is concerning for maternal and fetal well-being,” said investigators who analyzed one public and one private database.
The two databases showed increases of somewhat different scale. According to Medicaid data on 3,045 pregnancies among SLE women, initiation of hydroxychloroquine rose from 2.7% in 2001 to 7.5% (P = .0002) in 2010. The analysis of data for 2,255 SLE pregnancies from a large commercial insurance database (Optum Clinformatics) showed an increase from 4.9% in 2003 to 13.6% (P = .0001) in 2015, wrote Bonnie L. Bermas, MD, of Brigham and Women’s Hospital, Boston, and her associates. The report was published in Lupus.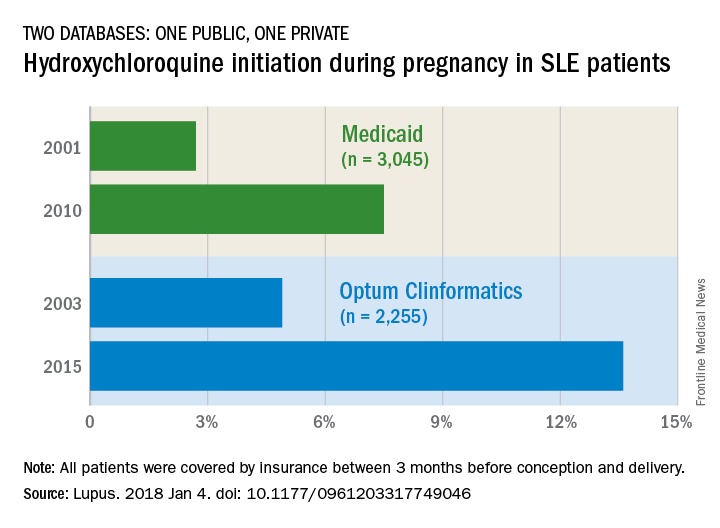
The study was funded by Brigham and Women’s Hospital and Harvard Medical School. Dr. Bermas did not report any conflicts. Her associates reported unrelated projects with a number of pharmaceutical companies.
SOURCE: Bermas BL et al. Lupus. 2018 Jan 4. doi: 10.1177/0961203317749046.
FROM LUPUS
More savings available from generic oral contraceptives
, according to an analysis of almost 20,000 OC-prescribing events.
Brand OCs with available generics represented 44% of expenditures for all OCs in both 2010 and 2014, while generics had 56% and 55% of spending in 2010 and 2014 and brand names without generics took 0% and 1%, respectively, Mark Chee and his associates wrote in a report published in JAMA Internal Medicine.
For the whole 4-year period, brand OCs accounted for 24% of all prescriptions and 42% of all expenditures for the 19,944 OC prescribing events included in the analysis of data from the Medical Expenditure Panel Survey.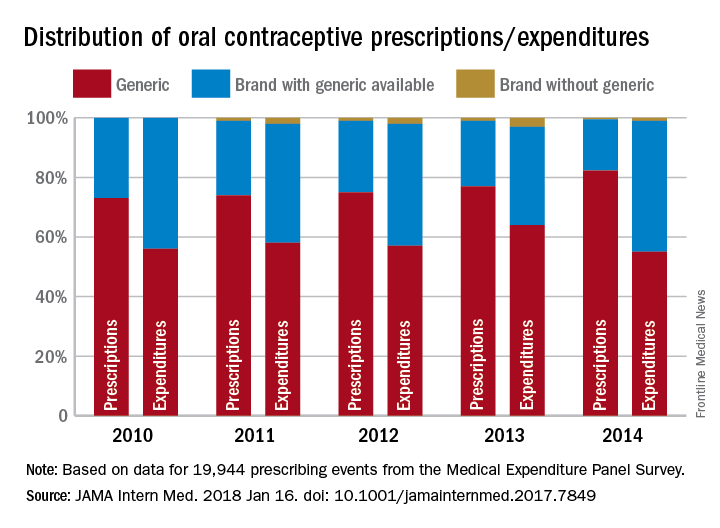
The study was funded by a National Institutes of Health grant to Mr. Chee. All of his five associates have received a grant from the Food and Drug Administration to improve prescription of generic drugs.
SOURCE: Chee M. et al. JAMA Intern Med. 2018 Jan 16. doi: 10.1001/jamainternmed.2017.7849.
FROM JAMA INTERNAL MEDICINE
U.S. influenza activity widespread to start 2018
As far as the influenza virus is concerned, the new year started in the same way as the old one ended: with almost half of the states at the highest level of flu activity, according to the Centers for Disease Control and Prevention.
For the week ending Jan. 6, 2018, there were 23 states – including California, Illinois, and Texas – at level 10 on the CDC’s 1-10 scale for influenza-like illness (ILI) activity, which was up from 22 for the last full week of 2017. Joining the 23 states in the “high” range were New Jersey and Ohio at level 9 and Colorado at level 8, the CDC’s influenza division reported Jan. 12.
Seven flu-related pediatric deaths were reported during the week ending Jan. 6, although one occurred during the week ending Dec. 16 and two were during the week ending Dec. 23. There have been a total of 20 pediatric deaths related to influenza so far for the 2017-2018 season, the CDC said. In 2016-2017, there were 110 pediatric deaths from the flu.
Young e-cigarette users graduating to the real thing
Children who use noncigarette forms of tobacco are significantly more likely to try cigarettes in the future, according to survey data from over 10,000 young people aged 12-17 years.
An initial survey (wave 1) was conducted as part of the nationally representative Population Assessment of Tobacco and Health (PATH) study, with a follow-up (wave 2) administered to participants a year later. The analysis by Shannon L. Watkins, PhD, of the University of California, San Francisco, and her associates was based on data for 10,384 respondents who reported never smoking a cigarette in wave 1 and whose later cigarette use, which occurred in less than 5% overall, was reported in wave 2.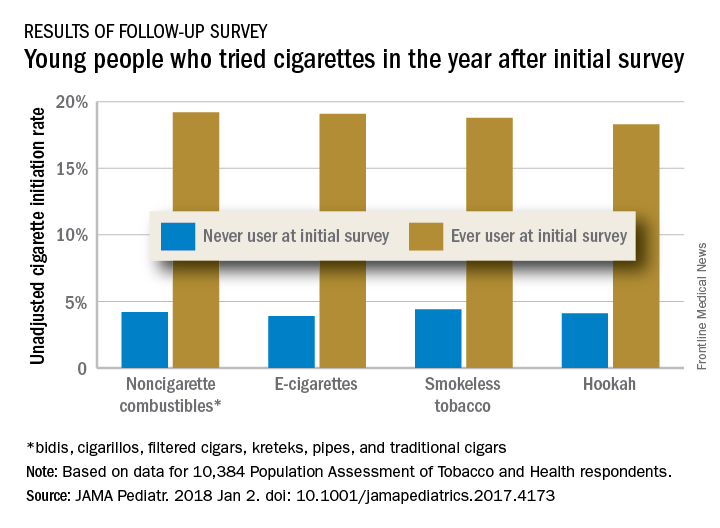
Those who used multiple noncigarette products were more likely than users of a single product to initiate cigarette use by wave 2. With never use of any tobacco as the reference, one model used by the investigators put the odds ratios of cigarette ever use at 4.98 for e-cigarettes only, 3.57 for combustibles only, and 8.57 for use of multiple products.
This study was supported by grants from the National Cancer Institute, Food and Drug Administration Center for Tobacco Products, National Institute on Drug Abuse, and National Center for Advancing Translational Sciences. No conflicts of interest were reported.
SOURCE: Watkins S et al. JAMA Pediatr. 2018 Jan 2. doi: 10.1001/jamapediatrics.2017.4173.
FROM JAMA PEDIATRICS
Office visits have a chronic problem
according to the National Center for Health Statistics.
That year, chronic problems were the major reason for 40% of all office-based physician visits, making them significantly more common than the other four broad categories of visit types: new problem (26%), preventive care (19%), injury (9%), and pre- or postsurgery care (6%), the NCHS said in a recent Data Brief.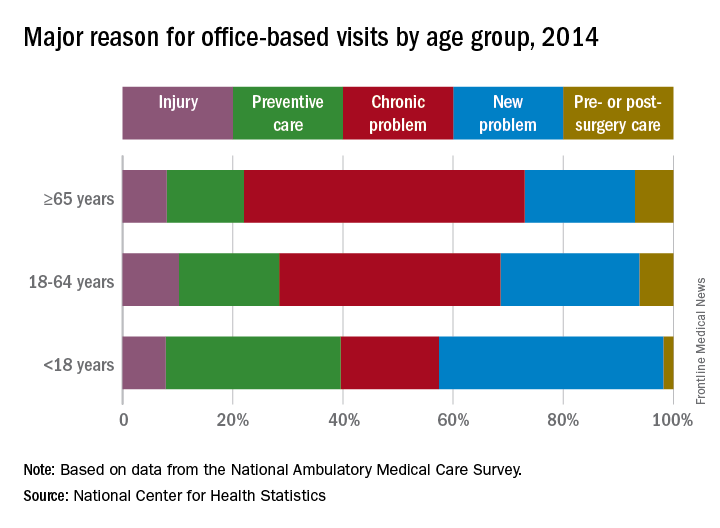
Children were significantly more likely to have a new problem (41% of visits) or get preventive care (32%) than were the other age groups and were significantly less likely to have a chronic problem (18%) or to receive pre- or postsurgery care (2%), according to data from the 2014 National Ambulatory Medical Care Survey, which included 45,710 visit records from 9,989 physicians.
SOURCE: Ashman JJ et al. NCHS Data Brief. 2017;(292):1-8e.
Normal prepregnancy weight becoming less normal
according to the Centers for Disease Control and Prevention.
The overall prevalence of normal prepregnancy weight declined from 47.3% to 45.1% over that period in 36 states, the District of Columbia, and New York City, which reports natality data separately from New York state. The decreases were statistically significant in 26 states and New York City, the CDC investigators reported (MMWR. 2018 Jan 5;66[51-2]:1402-7).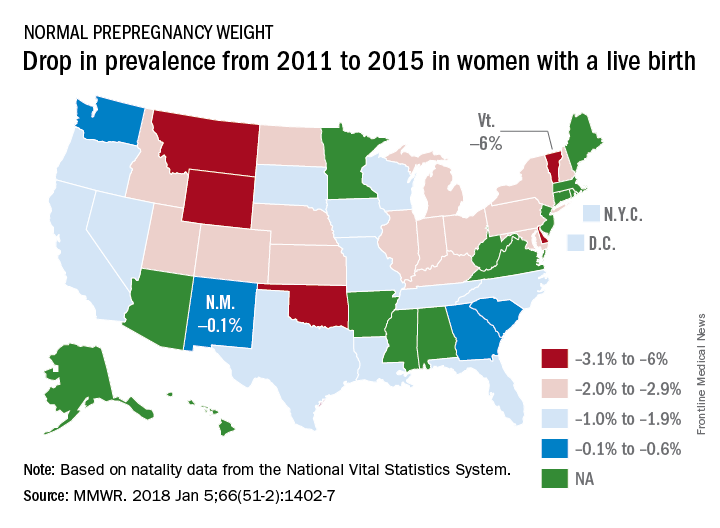
Based on data from 48 states, D.C., and New York City, the distribution of prevalence for the BMI categories in 2015 was 3.6% underweight, 45% normal weight, 25.8% overweight, and 25.6% obese, the investigators said.
The CDC analysis was based on natality data from the National Vital Statistics System. The standard birth certificate was revised in 2003 to include maternal height and prepregnancy weight, but only 38 jurisdictions were using it by 2011. By 2015, all states except Connecticut and New Jersey had adopted its use.
FROM MMWR
California tops state tobacco prevention spending
California will spend almost as much money on tobacco prevention and smoking cessation as the other states combined in 2018, putting it closest to the spending level recommended for each state by the Centers for Disease Control and Prevention, according to a report on the effects of the 1998 tobacco settlement.
The Golden State has budgeted almost $328 million for tobacco prevention and cessation this year, which amounts to just over 45% of all states’ total spending of $722 million and 94% of the CDC’s recommendation of $348 million. Alaska is the only state close to that in terms of the CDC-recommended level, reaching 93% of its spending target of $10.2 million. In third place for recommended spending is North Dakota, which has budgeted $5.3 million for 2018, or 54% of its CDC target, the report said. 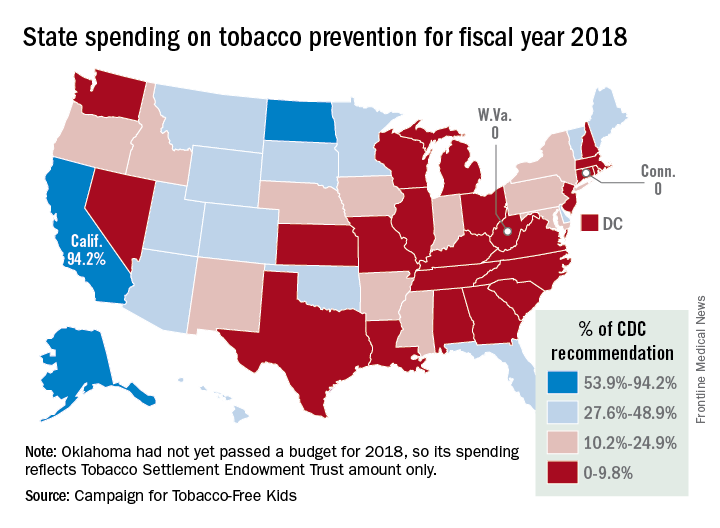
“Broken Promises to Our Children: A State-by-State Look at the 1998 Tobacco Settlement 19 Years Later” was released by the Campaign for Tobacco-Free Kids, American Cancer Society Cancer Action Network, American Heart Association, American Lung Association, Robert Wood Johnson Foundation, Americans for Nonsmokers’ Rights, and Truth Initiative.
As for actual spending, Florida is second behind California with almost $69 million – 35% of its CDC-recommended level – budgeted for tobacco prevention and smoking cessation in 2018, and New York is third at just over $39 million, which is 19.4% of the CDC recommendation. Two states – Connecticut and West Virginia – will spend no money on such programs this year, the report noted.
The CDC has said that all states combined should be spending $3.3 billion for the year on prevention and cessation efforts, which is about 4.5 times higher than actual budgeted spending. The report also pointed out that the $722 million the states will spend this year amounts to just 2.6% of the $27.5 billion they will collect from the 1998 tobacco settlement and tobacco taxes. By comparison, the report cited data from the Federal Trade Commission showing that the tobacco companies spent $8.9 billion on marketing in 2015.
California will spend almost as much money on tobacco prevention and smoking cessation as the other states combined in 2018, putting it closest to the spending level recommended for each state by the Centers for Disease Control and Prevention, according to a report on the effects of the 1998 tobacco settlement.
The Golden State has budgeted almost $328 million for tobacco prevention and cessation this year, which amounts to just over 45% of all states’ total spending of $722 million and 94% of the CDC’s recommendation of $348 million. Alaska is the only state close to that in terms of the CDC-recommended level, reaching 93% of its spending target of $10.2 million. In third place for recommended spending is North Dakota, which has budgeted $5.3 million for 2018, or 54% of its CDC target, the report said.
“Broken Promises to Our Children: A State-by-State Look at the 1998 Tobacco Settlement 19 Years Later” was released by the Campaign for Tobacco-Free Kids, American Cancer Society Cancer Action Network, American Heart Association, American Lung Association, Robert Wood Johnson Foundation, Americans for Nonsmokers’ Rights, and Truth Initiative.
As for actual spending, Florida is second behind California with almost $69 million – 35% of its CDC-recommended level – budgeted for tobacco prevention and smoking cessation in 2018, and New York is third at just over $39 million, which is 19.4% of the CDC recommendation. Two states – Connecticut and West Virginia – will spend no money on such programs this year, the report noted.
The CDC has said that all states combined should be spending $3.3 billion for the year on prevention and cessation efforts, which is about 4.5 times higher than actual budgeted spending. The report also pointed out that the $722 million the states will spend this year amounts to just 2.6% of the $27.5 billion they will collect from the 1998 tobacco settlement and tobacco taxes. By comparison, the report cited data from the Federal Trade Commission showing that the tobacco companies spent $8.9 billion on marketing in 2015.
Massachusetts named healthiest state for 2017
A year of surprises ended with one more bit of unexpected news:
Massachusetts’ win may have knocked Hawaii out of the top spot for the first time since 2011, but the Aloha State was still second out of 50 in 2017. Two other New England states were in the top five: Vermont in third and Connecticut in fifth, with Utah sandwiched between them in fourth, the United Health Foundation said in its latest report.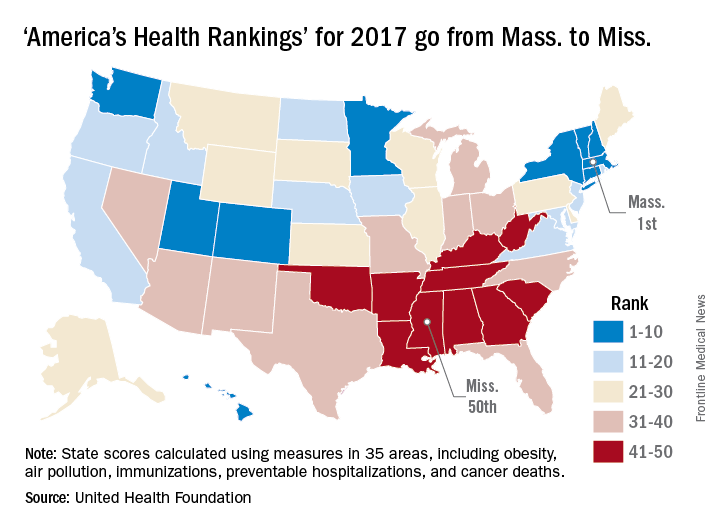
The report ranks states using 35 measures in five broad areas: behaviors, community and environment, policy, clinical care, and outcomes. The measures include drug-related death rate, percentage of children in poverty, public health funding per person, mental health provider rate, and diabetes rate.
“America’s Health Rankings” is funded entirely by the private, not-for-profit United Health Foundation, founded by UnitedHealth Group, which operates UnitedHealthcare.
Drug price increases far outpaced inflation in 2015
The retail price for a set of 768 prescription drugs rose by 6.4% in 2015, while the general inflation rate increased by just 0.1%, according to the AARP Public Policy Institute and the PRIME Institute at the University of Minnesota in Minneapolis.
One year, of course, does not make a trend, but how about 10 years? The average increase in the price of the “market basket” of 768 drugs widely used by older Americans has exceeded the rate of inflation every year since the AARP started tracking costs in 2004. This is “attributable entirely to drug price growth among brand name and specialty drugs, which more than offset often substantial price decreases among generic drugs,” Leigh Purvis of AARP and Stephen Schondelmeyer, PharmD, PhD, of the Prime Institute, said in an Rx Price Watch report.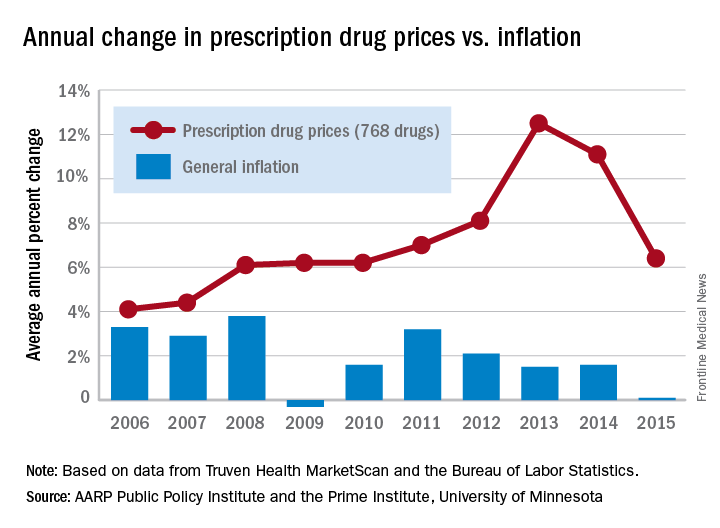
In terms of actual cost, however, the specialty drugs were far ahead of the other two segments. The average cost of a year of treatment with a specialty drug was more than $52,000 in 2015, which was nine times higher than the brand-name drugs ($5,800) and 100 times higher than the generics ($523), they said.
The Rx Price Watch reports are based on retail-level prescription prices from the Truven Health MarketScan Research Databases. The general inflation rate is based on the Consumer Price Index–All Urban Consumers for All Items, which is measured by the Bureau of Labor Statistics.
HealthCare.gov enrollment for 2018 nearly doubled in final week
A busy final week of open enrollment at HealthCare.gov almost doubled the total number of health insurance plans selected and nearly equaled the total for last year’s much longer period, according to data from the Centers for Medicare & Medicaid Services.
After the first 6 weeks of enrollment, the total number of plans selected for 2018 stood at 4.68 million. Just 1 week later, . That works out to 6.43 million plans selected by consumers who renewed their coverage on 1 of the 39 state exchanges that use the HealthCare.gov platform and 2.39 million plans selected by new consumers (those who did not have coverage in 2017), the CMS reported.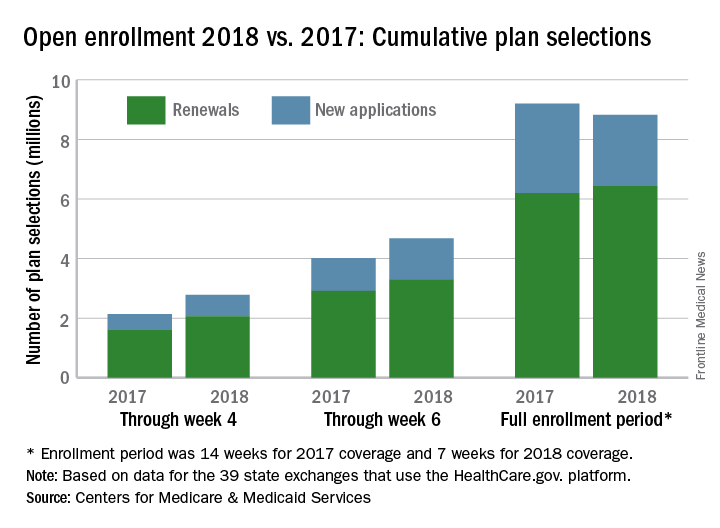
The CMS noted that the numbers for 2018 are estimates that represent plans selected and not the number of consumers who have paid premiums to effectuate their enrollment.
SOURCE: CMS.gov Fact Sheet