User login
according to the Centers for Disease Control and Prevention.
The overall prevalence of normal prepregnancy weight declined from 47.3% to 45.1% over that period in 36 states, the District of Columbia, and New York City, which reports natality data separately from New York state. The decreases were statistically significant in 26 states and New York City, the CDC investigators reported (MMWR. 2018 Jan 5;66[51-2]:1402-7).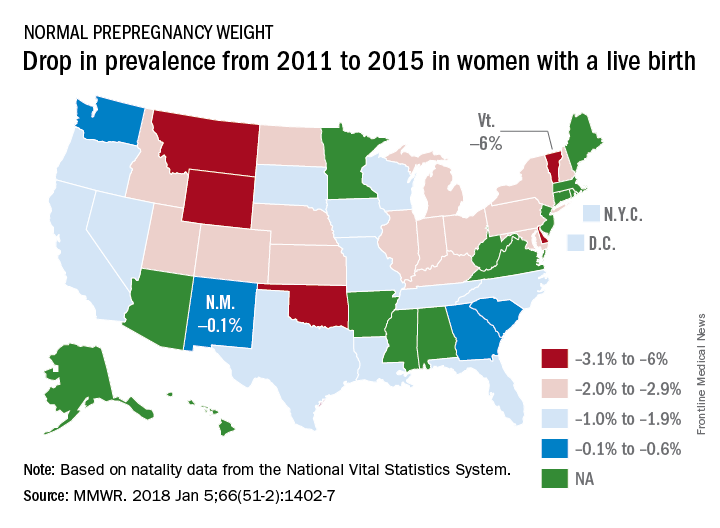
Based on data from 48 states, D.C., and New York City, the distribution of prevalence for the BMI categories in 2015 was 3.6% underweight, 45% normal weight, 25.8% overweight, and 25.6% obese, the investigators said.
The CDC analysis was based on natality data from the National Vital Statistics System. The standard birth certificate was revised in 2003 to include maternal height and prepregnancy weight, but only 38 jurisdictions were using it by 2011. By 2015, all states except Connecticut and New Jersey had adopted its use.
FROM MMWR