User login
Richard Franki is the associate editor who writes and creates graphs. He started with the company in 1987, when it was known as the International Medical News Group. In his years as a journalist, Richard has worked for Cap Cities/ABC, Disney, Harcourt, Elsevier, Quadrant, Frontline, and Internet Brands. In the 1990s, he was a contributor to the ill-fated Indications column, predecessor of Livin' on the MDedge.
Baby boomers are the hepatitis C generation
Increases in hepatitis C–related inpatient stays for baby boomers from 2005 to 2014 far outpaced those of older adults, while younger adults saw their admissions drop over that period, according to the Agency for Healthcare Research and Quality.
For the baby boomers (adults aged 52-72 years), the rate of inpatient stays involving hepatitis C with or without hepatitis B, HIV, or alcoholic liver disease rose from 300.7 per 100,000 population in 2005 to 503.1 per 100,000 in 2014 – an increase of over 67%. For patients aged 73 years and older, that rate went from 104.4 in 2005 to 117.1 in 2014, which translates to a 12% increase, and for patients aged 18-51 years, it dropped 15%, from 182.5 to 155.4, the AHRQ said in a statistical brief.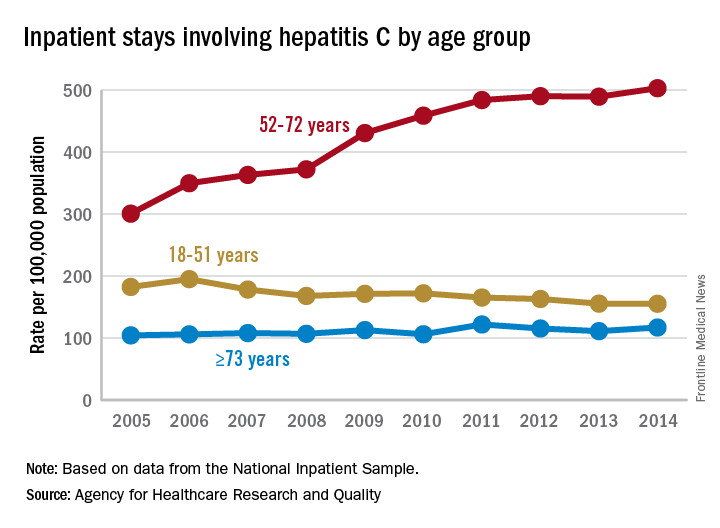
Along with the increased hospitalizations, “acute hepatitis C cases nearly tripled from 2010 through 2015,” the report noted, which was “likely the result of increasing injection drug use due to the growing opioid epidemic.”
AGA offers tools to help you become more efficient, understand quality standards, and improve the process of care for your hepatitis C patients.
Baby boomers are the hepatitis C generation
Increases in hepatitis C–related inpatient stays for baby boomers from 2005 to 2014 far outpaced those of older adults, while younger adults saw their admissions drop over that period, according to the Agency for Healthcare Research and Quality.
For the baby boomers (adults aged 52-72 years), the rate of inpatient stays involving hepatitis C with or without hepatitis B, HIV, or alcoholic liver disease rose from 300.7 per 100,000 population in 2005 to 503.1 per 100,000 in 2014 – an increase of over 67%. For patients aged 73 years and older, that rate went from 104.4 in 2005 to 117.1 in 2014, which translates to a 12% increase, and for patients aged 18-51 years, it dropped 15%, from 182.5 to 155.4, the AHRQ said in a statistical brief.
Along with the increased hospitalizations, “acute hepatitis C cases nearly tripled from 2010 through 2015,” the report noted, which was “likely the result of increasing injection drug use due to the growing opioid epidemic.”
CDC’s Fitzgerald resigns amid tobacco stock brouhaha
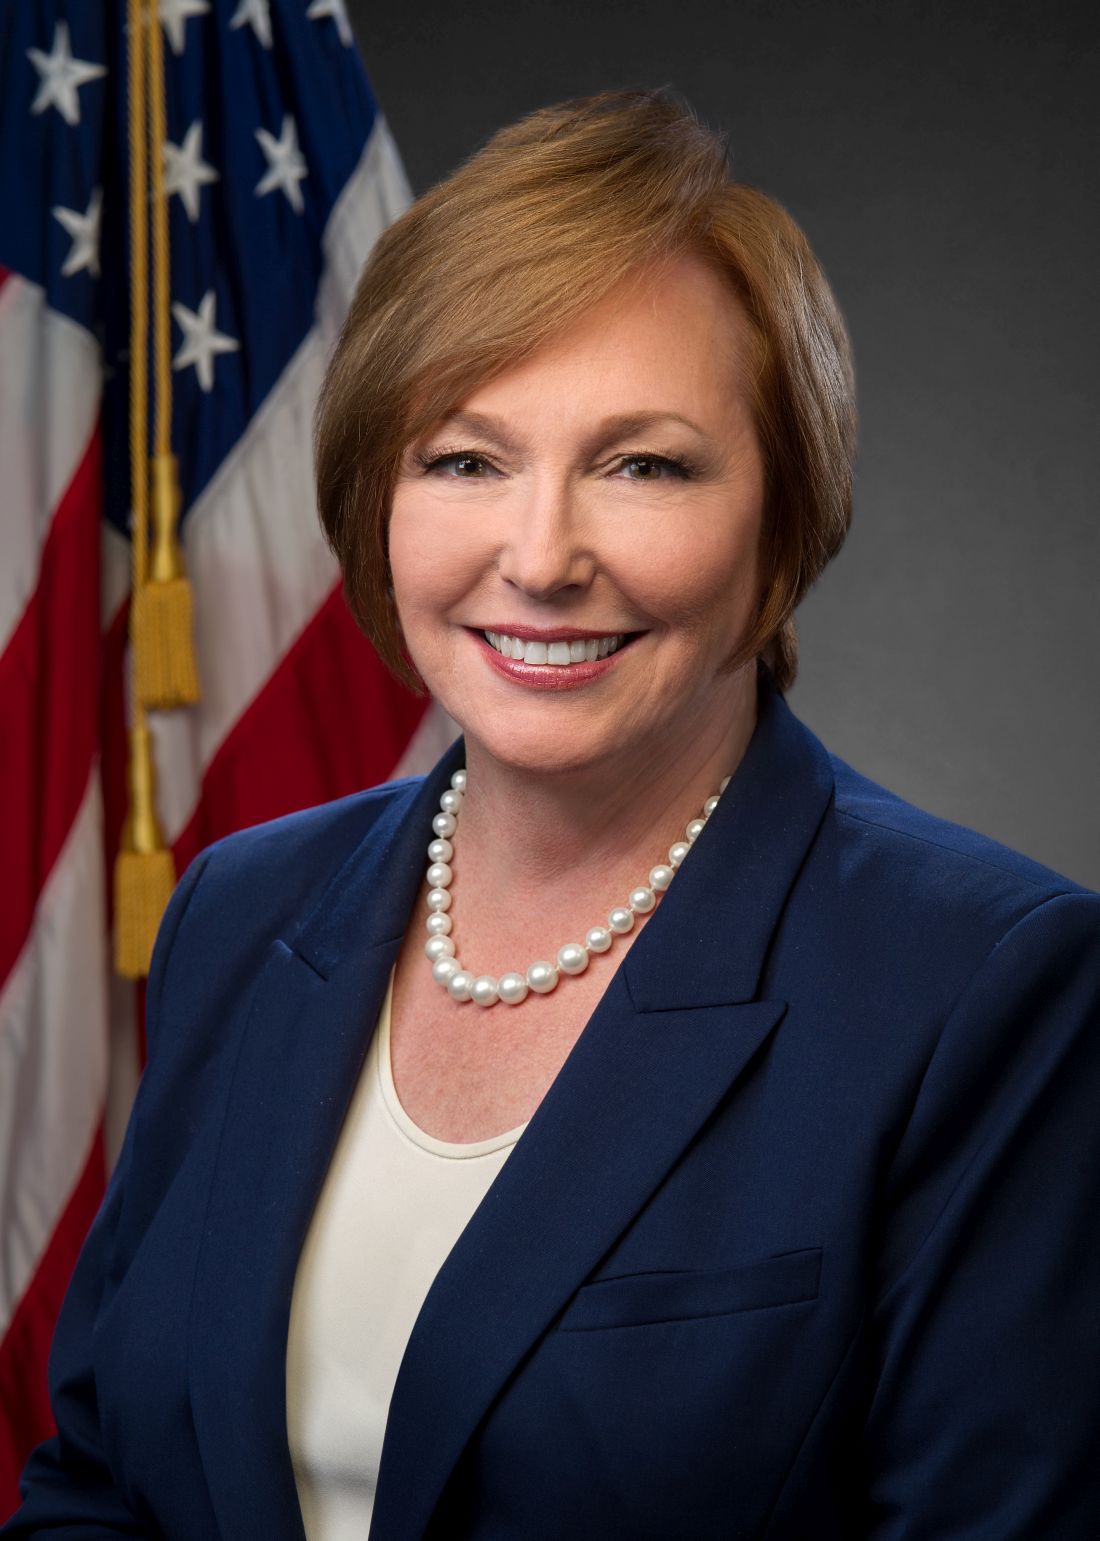
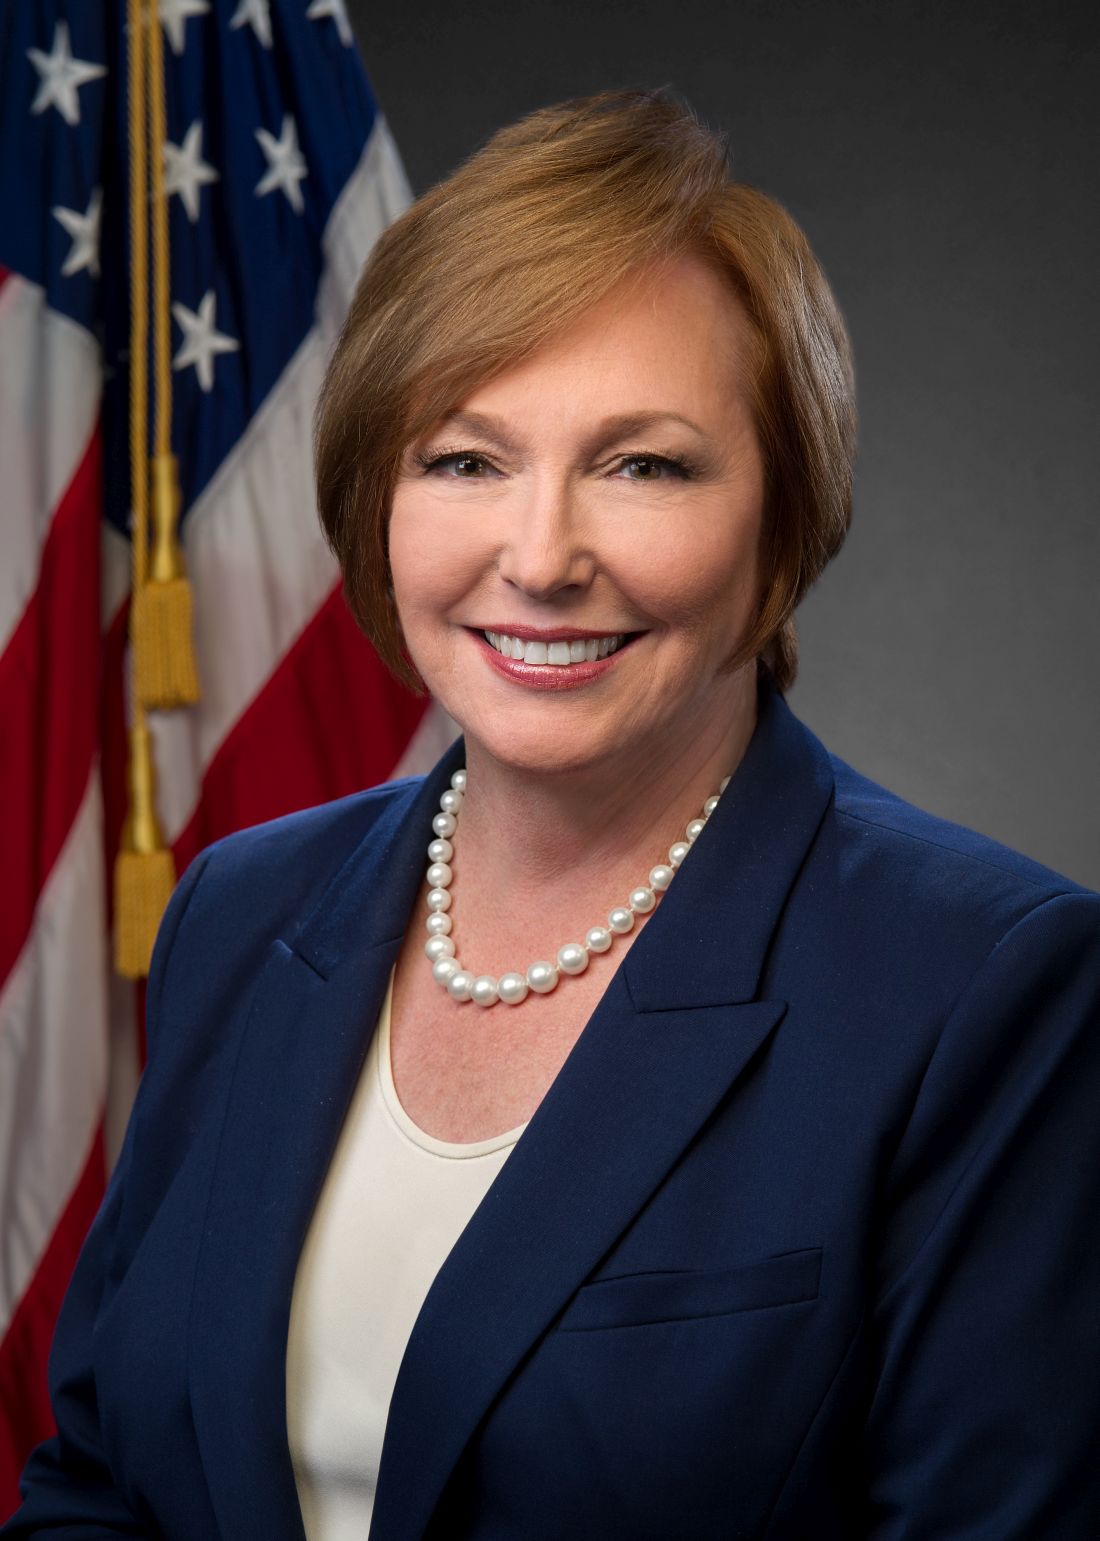
Brenda Fitzgerald, MD, director of the Centers for Disease Control and Prevention, resigned Jan. 31 after reports surfaced on the public affairs website Politico that she purchased shares of Japan Tobacco about 1 month after becoming the agency’s director.
Dr. Fitzgerald, an ob.gyn., also bought stock in Merck & Co., Bayer, and Humana after joining the Trump Administration in July 2017, according to the report. Financial disclosure records confirm that she sold the tobacco stock in October and “all of her stock holdings above $1,000 by Nov. 21, more than 4 months after she became CDC director,” according to the Politico report.
According to a spokesperson for the Health and Human Services department, “This morning Secretary Azar accepted Dr. Brenda Fitzgerald’s resignation as Director of the Centers for Disease Control and Prevention.
“Dr. Fitzgerald owns certain complex financial interests that have imposed a broad recusal limiting her ability to complete all of her duties as the CDC Director. Due to the nature of these financial interests, Dr. Fitzgerald could not divest from them in a definitive time period. After advising Secretary Azar of both the status of the financial interests and the scope of her recusal, Dr. Fitzgerald tendered, and the Secretary accepted, her resignation. The Secretary thanks Dr. Brenda Fitzgerald for her service and wishes her the best in all her endeavors,” according to a report on CNBC.
States judged on smoking cessation services
Minnesota and South Carolina are at the top of the class for access to shows that the treatment coverage in most states earned barely passable or failing grades.
In fact, 31 states received either a D (11 states) or an F (20 states) on the grading system. There were also 11 C’s and 7 B’s to go along with the two A’s, the ALA said in “State of Tobacco Control 2018.”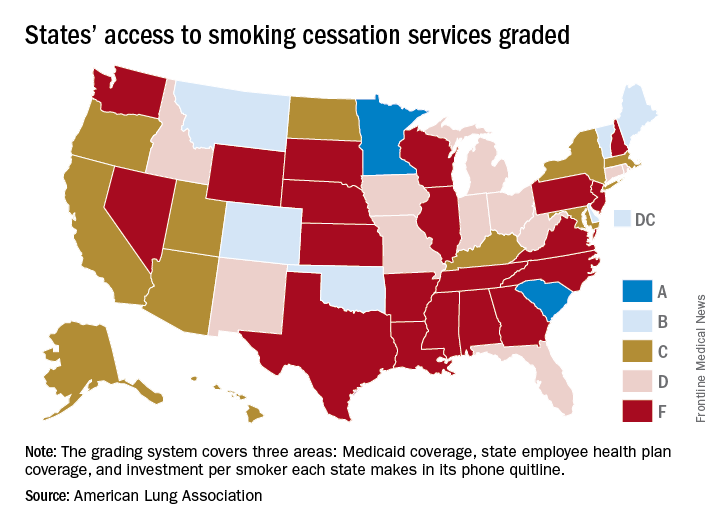
Minnesota received 66 points and South Carolina earned 63 after a 5-point deduction for not expanding Medicaid up to Affordable Care Act standards. The highest-finishing states with B’s were Vermont with 62 points and Maine with 61, and the lowest total score was the 23 points earned by Virginia and Washington, although Washington’s grade did not include the state employee category since the state did not provide data on its plan, the ALA noted.
The Department of Health & Human Services recommends that tobacco cessation coverage include the use of five nicotine-replacement therapies (gum, patch, lozenge, nasal spray, inhaler), bupropion and varenicline (nonnicotine medications), and three types of counseling (individual, group, and phone), the report said.
“It’s imperative that all state Medicaid programs cover a comprehensive tobacco cessation benefit, with no barriers, to help smokers quit, including all seven [Food and Drug Administration]–approved medications and three forms of counseling for Medicaid enrollees. In 2017, only Kentucky, Missouri, and South Carolina provided this coverage,” wrote Harold P. Wimmer, national president and CEO of the ALA.
CDC: Flu levels highest since pandemic year 2009
according to data from the Centers for Disease Control and Prevention.
That season was dominated by influenza A (H3N2), and the 2017-2018 season seems to be going down that same path. For the week ending Jan. 20, the proportion of outpatient visits for influenza-like illness increased to 6.6%, which is, for the second consecutive week, the highest level reported since October of – you guessed it – 2009, when it hit 7.7%, the CDC said in its weekly flu surveillance report.
The level reported last week, 6.3%, has been revised downward and now stands at an even 6%.
It turns out that 2018 is something of a milestone for the H3N2 virus. The virus first emerged in 1968, so it has reached its 50th anniversary, Dan Jernigan, MD, director of the influenza division at the CDC’s National Center for Immunization and Respiratory Diseases, Atlanta, said on Jan. 26 in a weekly briefing.
H3N2 must not be happy about hitting the big 5-0, however, because the map of influenza-like illness activity looks pretty red and angry. For the week ending Jan. 20, there were 30 states at the highest level of flu activity on the CDC’s 1-10 scale, with another nine in the “high” range at levels 8 and 9.
Dr. Jernigan did suggest that activity may have peaked in some areas of the country, with California among them.
There were seven pediatric deaths reported for the week ending Jan. 20, although six occurred in previous weeks. There have been 37 flu-related deaths among children so far during the 2017-2018 season, the CDC said.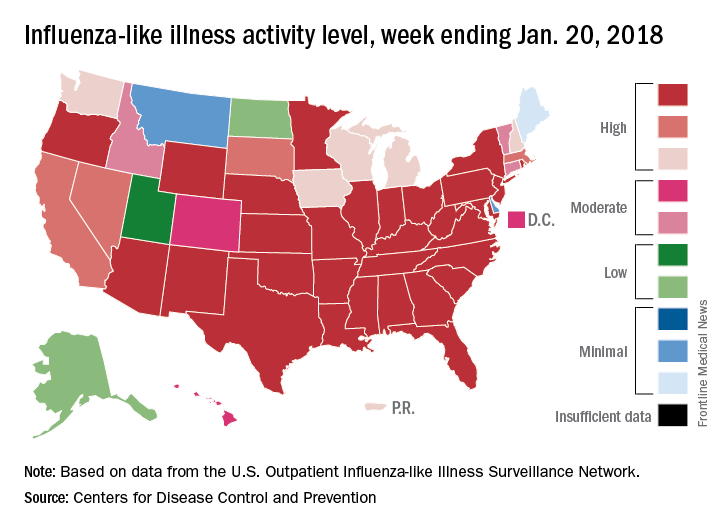
Women filling more ADHD prescriptions
, according to the Centers for Disease Control and Prevention.
In 2003, 0.9% of women aged 15-44 years with private employer–sponsored insurance filled a prescription for an ADHD medication. By 2015, that figure had gone up to 4.0% for an increase of 344% that was unevenly split by medication class: prescriptions for stimulants were up by 388%, but nonstimulants had no change, wrote Kayla N. Anderson, PhD, and her associates in the Morbidity and Mortality Weekly Report.
“The substantial increase in the percentage of reproductive-aged women filling ADHD medication prescriptions from 2003 to 2015 ... is of public health concern given the high percentage of unintended pregnancies and uncertainty concerning the safety of ADHD medication exposure before and during pregnancy,” they wrote.
This analysis was restricted to women with at least 11 months of enrollment in a private health insurance plan that included prescription drug coverage during the year of interest. The sample included a median of 4.6 million women each year.
SOURCE: Anderson K et al. MMWR. 2018 Jan 19;76(2):66-70.
FROM MMWR
Influenza: All that and MI too
Myocardial infarction admissions were six times more likely to occur in the week after a positive test for influenza than in the year before or the 51 weeks after the infection, according to analysis of a Canadian cohort that links laboratories with administrative databases.
The investigators used this cohort data to define definitions of “risk interval” – the first 7 days after flu detection – and a combined “control interval” – 52 weeks before the flu detection and 51 weeks after the end of the risk interval.
Among the total of 364 hospital admissions for MI in patients with confirmed influenza, 20 occurred during the defined 1-week risk interval (20 admissions/week) and 344 occurred during the control interval (3.3 admissions/week), giving an incidence ratio (IR) of 6.05, Jeffrey C. Kwong, MD, of the University of Toronto and his associates reported in the New England Journal of Medicine.
There was little difference between days 1 and 3 after flu confirmation (IR, 6.3) and days 4-7 (IR, 5.8), but risk dropped off quickly after that, with IRs of 0.6 at days 8-14 and 0.75 at days 15-28. Risk was increased for older adults, those with influenza B infection, and those who had their first MI, the investigators said.
MI incidence also was elevated after infection with noninfluenza respiratory viruses, although to a lesser extent than with influenza, which suggests that “influenza is illustrative of the role that acute respiratory infections have in precipitating acute myocardial infarction,” Dr. Kwong and his associates wrote.
The study was supported by the Canadian Institutes of Health Research, by Public Health Ontario, and by the Institute for Clinical Evaluative Sciences. Dr. Kwong reported grants from Canadian Institutes of Health Research during the conduct of the study, as well as grants from Canadian Institutes of Health Research and University of Toronto.
SOURCE: Kwong JC et al. N Engl J Med. 2018. 378(4):345-53. doi: 10.1056/NEJMoa1702090.
FROM THE NEW ENGLAND JOURNAL OF MEDICINE
Sex disparities seen in surgical professorships
Female surgeons were less likely than were male surgeons to be full professors in 2014, according to an analysis that adjusted for a number of “factors known to influence academic rank independently of sex.”
The overall , after adjustment for such factors as age, years since residency, subspecialty, total publications, and clinical trial participation. “This methodological rigor is a central and unique strength of this analysis and bolsters the validity of the study findings,” wrote Daniel M. Blumenthal, MD, of Massachusetts General Hospital and Harvard Medical School, Boston, and his associates. The report was published in Annals of Surgery (2018 Jan 12. doi: 10.1097/SLA.0000000000002662).
Differences favoring men were seen in eight of the nine subspecialties included in the study, with vascular surgery being the exception (adjusted odds ratio, 1.63). Of the other eight, however, only in general surgery (adjusted odds ratio, 0.68) was the difference significant, the investigators said.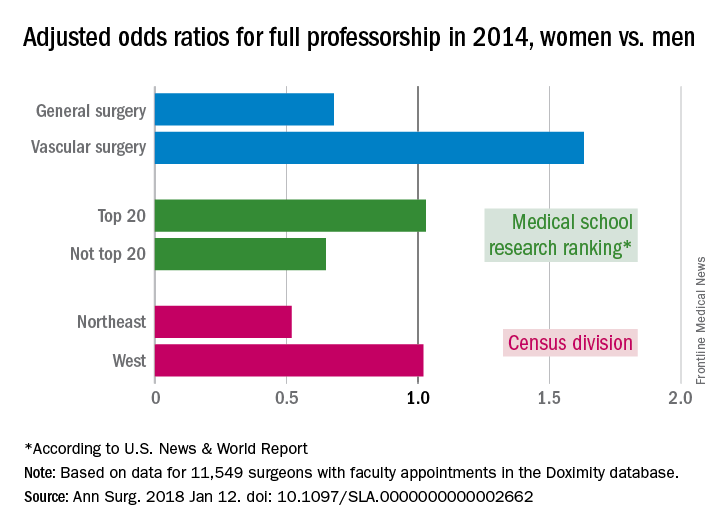
Another factor included in the analysis was the research ranking of the medical schools. There was no significant sex disparity for faculty members at medical schools ranked in the top 20 by U.S. News & World Report (adjusted odds ratio, 1.03), but schools outside the top 20 had an adjusted odds ratio (AOR) of 0.65 for women, compared with men. Geographically speaking, the largest disadvantage for female surgeons among the four main census divisions was in the Northeast (AOR, 0.52), with the West generating relative equality (AOR, 1.02) and the South (AOR, 0.83) and the Midwest (AOR, 0.87) in between, they reported.
Dr. Blumenthal and his associates used a cross-sectional database maintained by Doximity, an online networking company. The analysis included data for 11,549 surgeons with faculty appointments in 2014: 3,080 were full professors (7% were women), 2,931 were associate professors (13.8% were women), and 5,538 were assistant professors (19.4% were women).
Dr. Blumenthal reported research funding from a fellowship at Harvard. The investigators declared no conflict of interests.
SOURCE: Blumenthal DM et al. Ann Surg. 2018 Jan 12. doi: 10.1097/SLA.0000000000002662.
FROM ANNALS OF SURGERY
Flu season takes another turn for the worse
By one measure at least – the proportion of outpatient visits for influenza-like illness (ILI) – this flu season is now the worst in almost a decade, according to data from the Centers for Disease Control and Prevention.
which hit an early peak of 7.7% in October of 2009. The slight pause that occurred in the first week of January as the rate only rose from 5.7% to 5.8% now looks more like the earlier trend from December, when the level of outpatient visits more than doubled over a 3-week period, data from the CDC FluView website show.
“The geographic spread of influenza in Puerto Rico and 49 states was reported as widespread” for the week ending Jan. 13, and 24 states had the highest level of ILI activity on the CDC’s 1-10 scale, the CDC influenza division reported Jan 19.
There were 10 flu-related pediatric deaths reported during the week, with two occurring in the week ending Jan. 13. A total of 30 deaths in children have been associated with influenza so far for the 2017-2018 season, the CDC said.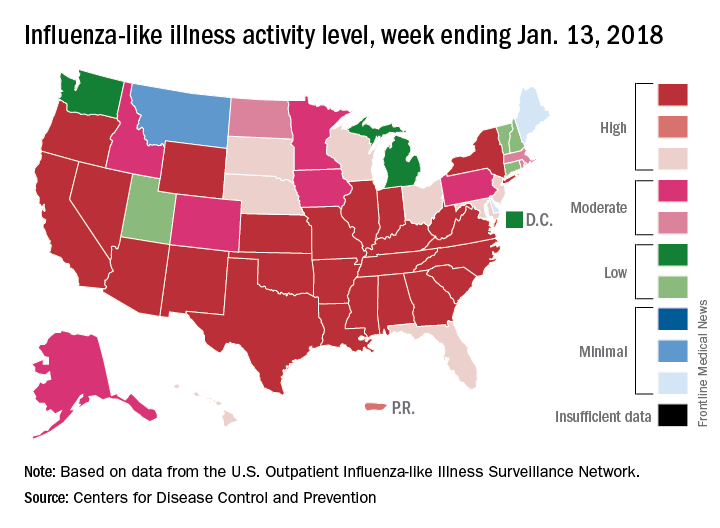
Putting a number on biologic DMARD costs
Annual medical costs for patients with rheumatoid arthritis were almost three times higher for those who used biologic disease-modifying antirheumatic drugs (bDMARDs), compared with those who used any treatment regimen, according to meta-analysis of 12 studies conducted since bDMARDs were introduced in 1999.
RA patients who used bDMARDs had an average direct cost of $36,053 per year, which was 2.9 times higher than the $12,509 in annual direct medical costs for all RA patients on any treatment regimen. Proportionately, the difference was even greater for RA-specific care, with the annual cost of bDMARD care ($20,262) 5.4 times higher than that of all treatment regimens ($3,723), reported Andrew Hresko and his associates at Brigham and Women’s Hospital, Boston.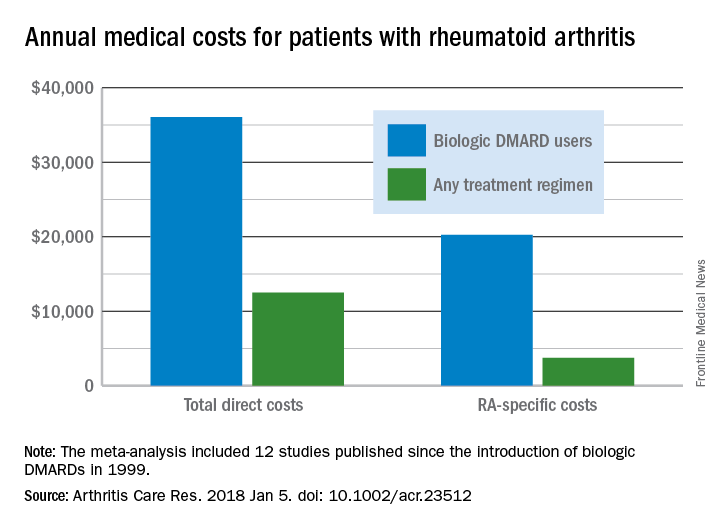
Funding for the study was supported through a grant from the National Institutes of Health. Mr. Hresko was supported by a fellowship from Tufts University. One of his associates receives research support from grants to his hospital from Amgen, Pfizer, Eli Lilly, AstraZeneca, Genentech, Bristol Myers Squibb, and Corrona. The third investigator is now an employee of Amgen but was not during the study.
SOURCE: Hresko A et al. Arthritis Care Res. 2018 Jan 5. doi: 10.1002/acr.23512.
FROM ARTHRITIS CARE & RESEARCH