User login
Richard Franki is the associate editor who writes and creates graphs. He started with the company in 1987, when it was known as the International Medical News Group. In his years as a journalist, Richard has worked for Cap Cities/ABC, Disney, Harcourt, Elsevier, Quadrant, Frontline, and Internet Brands. In the 1990s, he was a contributor to the ill-fated Indications column, predecessor of Livin' on the MDedge.
Liver cancer deaths expected to increase again in 2018
Liver cancer mortality for 2018 is expected to be lowest in Utah and highest in Hawaii.
A total of 30,200 deaths from liver and intrahepatic bile duct cancer are predicted for the year in the United States by the American Cancer Society (ACS) in its Cancer Facts & Figures 2018, based on analysis of 2001-2015 data from the National Center for Health Statistics. That’s up from the 28,920 predicted by the ACS for 2017.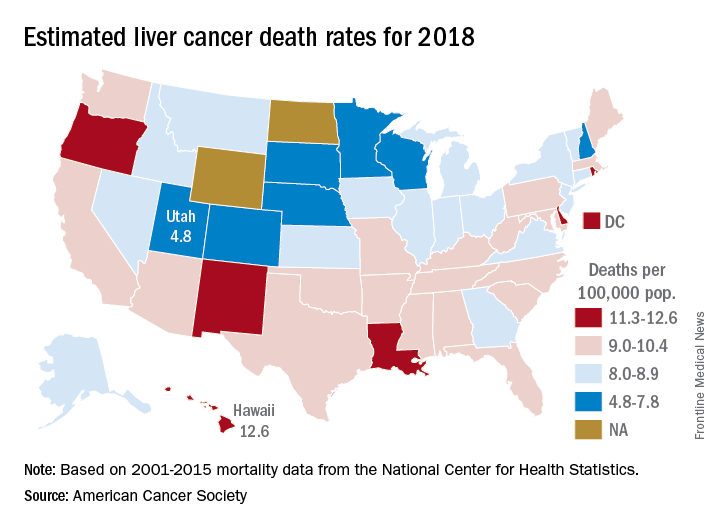
Mortality from liver cancer has been rising since the early 1980s, and in the last 10 years for which data are available (2006-2015), it increased by 2.5% per year. Over almost the same period (2005-2014), incidence rose by approximately 3% a year, and 42,220 new cases are expected in 2018, the ACS noted.
Over the most recent 5 years with available data (2011-2015), racial and ethnic disparities put American Indian/Alaska Natives at the highest mortality risk – 14.8 per 100,000 for men and 7.0 for women – followed by Asian/Pacific Islanders at 14.0 and 6.0, respectively. Non-Hispanic whites had the lowest rates: 8.2 for men and 3.4 for women, according to the ACS report.
Read more about the ACS’s research and estimates here.
Colorectal cancer deaths projected for 2018
Approximately 50,630 deaths from colorectal cancer are predicted for the year in the United States by the American Cancer Society (ACS) in its Cancer Facts & Figures 2018, based on analysis of 2001-2015 data from the National Center for Health Statistics.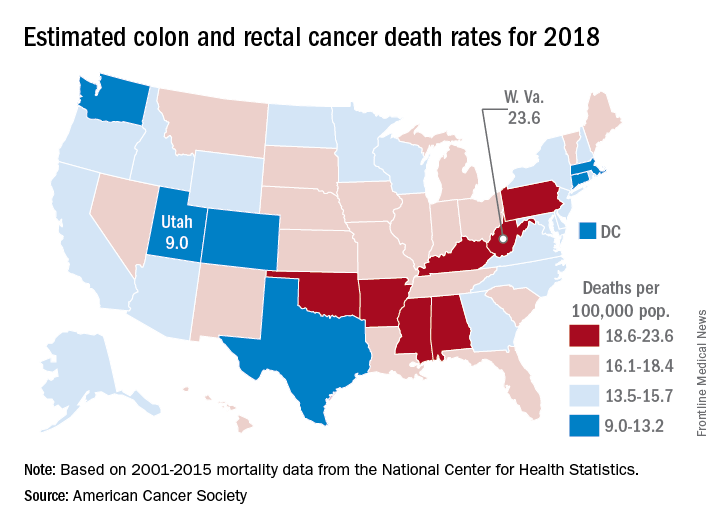
March is Colorectal Cancer Awareness Month. Visit www.gastro.org/CRC for tools you can use to help educate your patients about the importance of colorectal cancer screening.
Colorectal cancer deaths projected for 2018
Approximately 50,630 deaths from colorectal cancer are predicted for the year in the United States by the American Cancer Society (ACS) in its Cancer Facts & Figures 2018, based on analysis of 2001-2015 data from the National Center for Health Statistics.
Nationally, the colorectal cancer death rate has been declining for decades, but hidden inside that long-term trend are a couple of competing ones: From 2006 to 2015, mortality dropped 2.9% a year for those aged 55 years and older but increased by 1% annually for adults aged 55 and under, the ACS said.
Incidence rates for colon cancer and rectal cancer showed a similar trend: From 2005 to 2015 they were down by 3.8% (colon) and 3.5% (rectal) a year for adults aged 55 and older but rose 1.4% and 2.4%, respectively, for adults younger than 55. Accurate statistics on colon and rectal cancer deaths are not available separately “because many deaths from rectal cancer are misclassified as colon cancer on death certificates,” the ACS said.
Minority of dermatologists prescribe majority of opioids
Opioid prescribing among dermatologists is concentrated among a relative few, with surgeons and those in Southern states overrepresented, according to a study of Medicare Part D data for 2014.
“A small number of dermatologists account for a large percentage of the prescriptions. And it’s concentrated among dermatology surgeons, who are likely giving a standard prescription for a 4-day course of opioids after surgery,” senior author Arash Mostaghimi, MD, the director of inpatient services in the dermatology department at Brigham and Women’s Hospital, Boston, said in a press release issued by the hospital.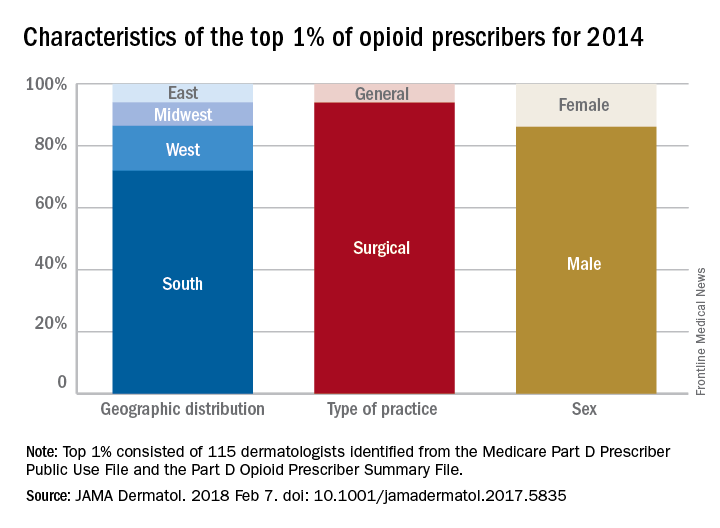
A closer look at those 115 top prescribers shows that 108, or 94%, worked in a surgical practice, 72% were located in Southern states, and 86% were male. Among all the dermatologists in the study, those in the South also had an opioid prescribing rate (2.77 claims/1,000 Medicare beneficiaries) that was more than triple the rate in the Northeast (0.83 claims/1,000 beneficiaries), the investigators said.
they noted, and may have created, based on consumption habits after Mohs microsurgery, a reservoir of more than 490,000 unused pills “that poses a substantial risk for future misuse.”
The study was supported by the National Institutes of Health’s National Center for Advancing Translational Sciences. The investigators did not report any conflicts of interest.
SOURCE: Cao S et al. JAMA Dermatol. 2018 Feb 7. doi: 10.1001/jamadermatol.2017.5835.
FROM JAMA DERMATOLOGY
This is what a flu pandemic looks like
For the week ending Feb. 3, 2018, the proportion of outpatient visits for influenza-like illness (ILI) was 7.7%, which would appear to equal the mark of 7.7% set in October of 2009. The earlier 7.7%, however, is rounded down from 7.715%, while the current mark is rounded up from 7.653%, data from the CDC’s Fluview website show.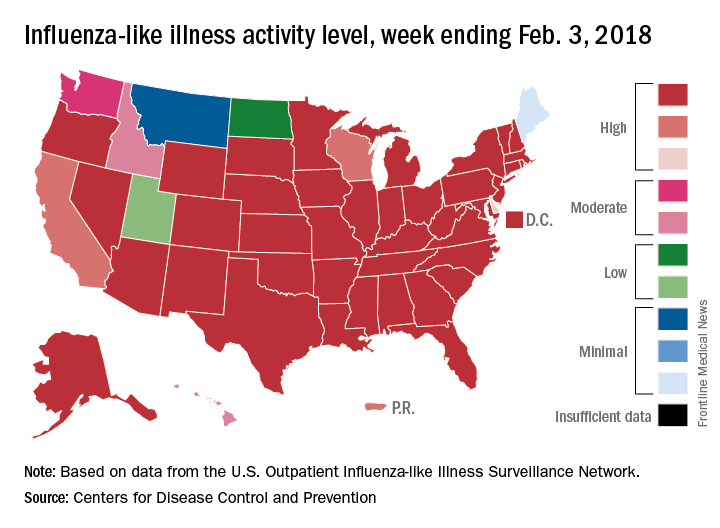
Deaths attributed to pneumonia and influenza were above the epidemic threshold set by the National Center for Health Statistics Mortality Surveillance system, acting CDC director Anne Schuchat, MD, said in a teleconference sponsored by the agency.
ILI activity was at level 10 on the CDC’s 1-10 scale in 41 states, compared with 34 the week before, and was categorized in the “high” range (levels 8-10) in another 3 states and Puerto Rico, according to data from the CDC’s Outpatient Influenza-like Illness Surveillance Network. In California, which was noted as a possible bright spot last week by Dr. Schuchat because activity there had been decreasing, the ILI level went back up to level 9 after being at 7 the week before.
Flu-related hospitalizations are continuing to rise at a record clip, with the cumulative rate for the week of Feb. 3 at 59.9 per 100,000 population, the CDC reported. A total of 1 in 10 hospital-based deaths last week were related to influenza. At this point in the 2014-2015 flu season – which has the highest number of hospitalizations at 710,000 – the hospitalization rate was only 50.9 per 100,000 population.
There were 10 pediatric deaths reported for the week ending Feb. 3, although 9 occurred in previous weeks. There have been 63 flu-related deaths among children so far during the 2017-2018 season.
Dr. Schuchat continued to recommend members of the public to get a flu shot and to stay home if they are feeling sick.
“What could be mild symptoms for you could be deadly for someone else,” Dr. Schuchat said, adding that antiviral medications remain important. “Physicians do not have to wait for confirmatory flu testing. They should begin treatment with antiviral drugs immediately in they suspect they have a severely ill or a high risk patient.”
“Flu vaccines often have lower effectiveness against H3N1 viruses. However, some protection is better than none. The vaccine’s effectiveness against other flu viruses, like B and H1N1, is better. Because of the ongoing intensity of the flu season and the increasing circulation of influenza B and h1n1, we do continue to recommend vaccination even this late in the season.”
Dr. Schuchat stressed the importance of the pneumococcal pneumonia vaccine. “Flu can make people more vulnerable to secondary infections like bacterial pneumonia. We recommend people aged 65 and over get a pneumococcal pneumonia vaccine,” she said.
FROM A CDC TELECONFERENCE
States show large disparities in lung cancer mortality
, with the highest rate in West Virginia and the lowest in Utah.
Approximately 154,050 deaths from lung cancer – three times as many as any other cancer – are predicted for the year in the United States by the American Cancer Society in its Cancer Facts & Figures 2018, based on analysis of 2001-2015 data from the National Center for Health Statistics. That figure is down from the 155,870 predicted for 2017, as the most recent trend (2011-2015) in the death rate has been a decline of about 2.3% per year for women and 3.8% per year for men, the ACS noted.
The expected number of deaths for 2018, coupled with a current population estimate of nearly 326 million, works out to an expected death rate of 47.3 per a population of 100,000. The Census Bureau estimates for the state populations and the deaths projected by the ACS produce expected death rates of 80.8 per 100,000 for West Virginia and 15.2 for Utah. Kentucky’s rate of 79.3 is just behind West Virginia, but Colorado, the next-lowest state after Utah, has an estimated rate that’s almost twice as high at 28.5.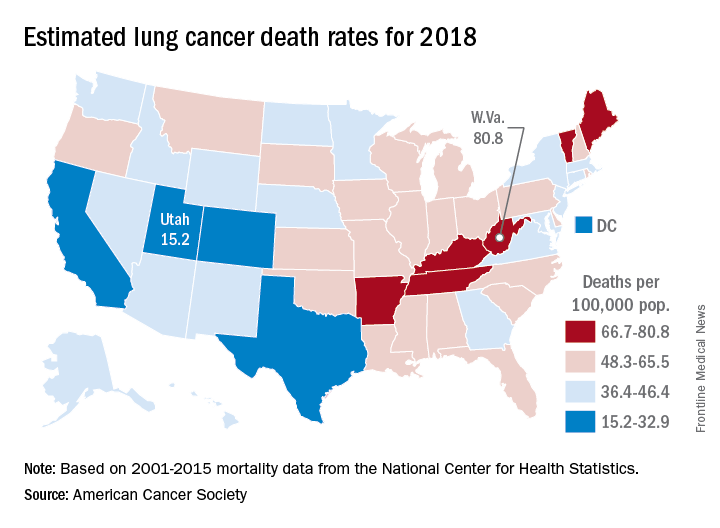
Nationally, death rates for lung cancer were 53.8 per 100,000 for males and 35.4 for females for 2011-2015, and incidence rates were 73 per 100,000 for males and 52.8 for females for 2010-2014, the ACS reported.
Among racial and ethnic groups, in men, the mortality was highest for those who were both non-Hispanic and black (66.9 per 100,00) during 2011-2015. Of the racial and ethnic groups of women for the same period, white women had the highest death rate (39). Hispanic/Latino men (26.4) and Hispanic/Latino women (13.3) had the lowest deaths rates, according to the report.
Decline in non-Hodgkin lymphoma deaths to continue in 2018
Mortality from non-Hodgkin lymphoma is expected to be about 6.1 per 100,000 population in 2018, with the highest rate in Maine and West Virginia and the lowest in Utah.
in its Cancer Facts & Figures 2018, based on analysis of 2001-2015 data from the National Center for Health Statistics. That figure is down from the 20,140 predicted for 2017, as the trend in the death rate since 2006 has been a decline of about 2% per year.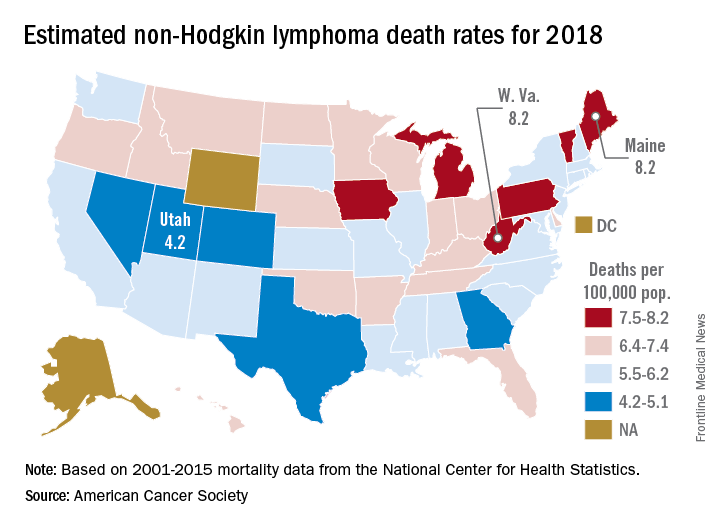
Nationally, death rates for NHL were 7.4 per 100,000 for males and 4.5 for females for 2011-2015, and incidence rates were 22.9 per 100,000 for males and 15.8 for females for 2010-2014, the ACS reported.
Over time, the relative survival rate for NHL has gone from 47% in 1975-1977 to 51% in 1987-1989 to 73% in 2007-2013, although there is some disparity between whites, whose respective rates are 47%, 51%, and 74%, and blacks, who have rates of 49%, 46%, and 67%, respectively, the ACS said.
Psychiatric issues common among hepatitis C inpatients
Adult inpatients with hepatitis C are much more likely to have mental health comorbidities, compared with those who do not have hepatitis C, according to the Agency for Healthcare Research and Quality.
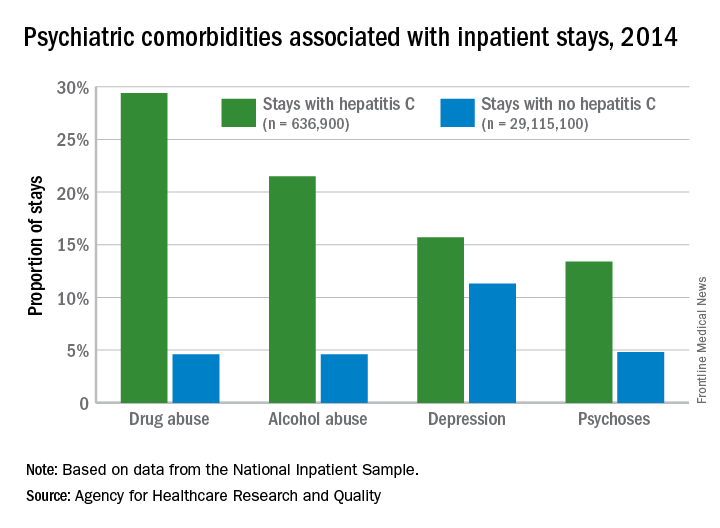
All four comorbidities skewed younger, and the oldest patients (73 years and older) with hepatitis C presented with each condition at about the same rate as the non–hepatitis C population. The proportions of hepatitis C–related inpatient stays with alcohol abuse by age, for example, were 20.5% for 18-51 years, 23.3% for those aged 52-72, and 5.8% for the 73-and-older group, according to data from the National Inpatient Sample, which includes more than 95% of all discharges from community (short-term, nonfederal, nonrehabilitation) hospitals in the United States.
Adult inpatients with hepatitis C are much more likely to have mental health comorbidities, compared with those who do not have hepatitis C, according to the Agency for Healthcare Research and Quality.
All four comorbidities skewed younger, and the oldest patients (73 years and older) with hepatitis C presented with each condition at about the same rate as the non–hepatitis C population. The proportions of hepatitis C–related inpatient stays with alcohol abuse by age, for example, were 20.5% for 18-51 years, 23.3% for those aged 52-72, and 5.8% for the 73-and-older group, according to data from the National Inpatient Sample, which includes more than 95% of all discharges from community (short-term, nonfederal, nonrehabilitation) hospitals in the United States.
Drugs identified after suicide deaths
Antidepressants and alcohol were each identified in more than 40% of tests performed after suicide deaths in 2014, according to data from the Centers for Disease Control and Prevention’s National Violent Death Reporting System.
Of the 14,834 suicide deaths reported that year in the system’s 18 participating states, tests for alcohol – conducted for 53% (7,883) of decedents – were the most commonly performed and were the second most likely to be positive among drugs with data available: The rate was 40.2%. Among the tests for blood alcohol concentration, a level of 0.08 g/dL or higher, which is over the legal limit in all states, was seen in almost 70% of positive results, Katherine A. Fowler, PhD, and her associates at the CDC’s National Center for Injury Prevention and Control reported in Morbidity and Mortality Weekly Report Surveillance Summaries.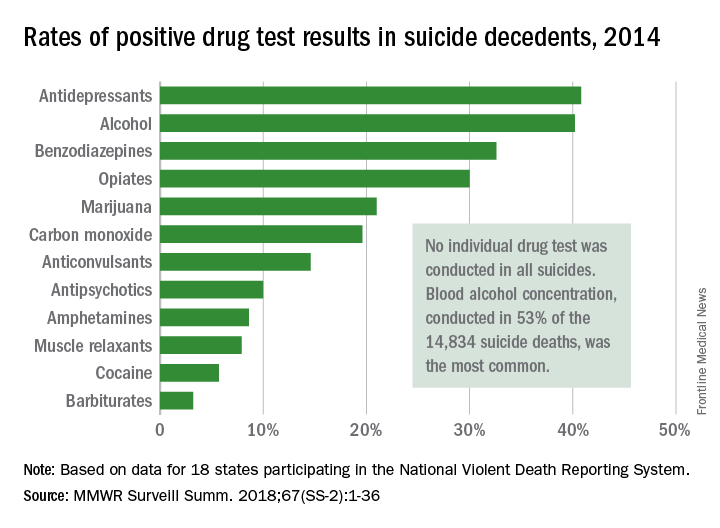
The 18 states that collected statewide data for 2014 – Alaska, Colorado, Georgia, Kentucky, Maryland, Massachusetts, Michigan, New Jersey, New Mexico, North Carolina, Ohio, Oklahoma, Oregon, Rhode Island, South Carolina, Utah, Virginia, and Wisconsin – represent just over 33% of the U.S. population.
SOURCE: Fowler KA et al. MMWR Surveill Summ. 2018;67(SS-2):1-36. doi: 10.15585/mmwr.ss6702a1.
FROM MMWR
Hospitals filling as flu season worsens
Through the last full week of January, the cumulative “hospitalization rate is the highest we’ve seen,” acting Centers for Disease Control and Prevention director Anne Schuchat, MD, said. For the current season so far, the hospitalization rate stands at 51.4 per 100,000 population, putting it on pace to top the total of 710,000 flu-related admissions that occurred during the 2014-2015 season, she said in a weekly briefing Feb. 2.
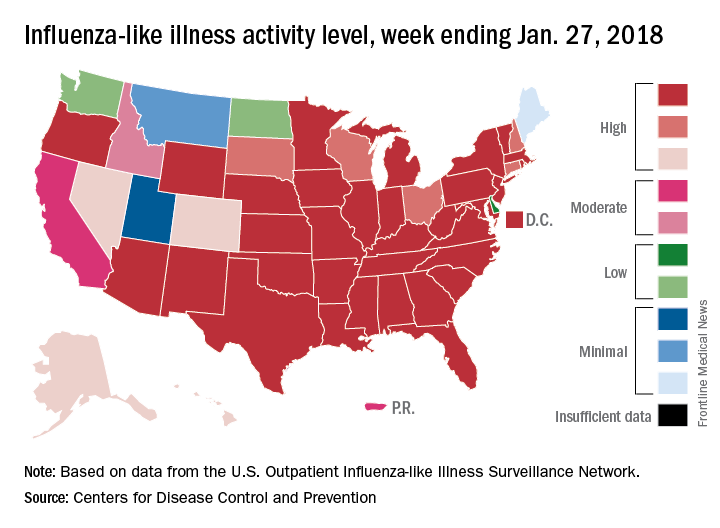
Flu-related pediatric deaths also took a big jump for the week as another 16 were reported, which brings the total for the season to 53. Of the children who have died so far, only 20% were vaccinated, said Dan Jernigan, MD, MPH, director of the influenza division at the CDC’s National Center for Immunization and Respiratory Diseases, Atlanta. He also noted that half of the children who have been hospitalized did not had an underlying condition.
The one bit of good news for the week was that activity in the West seems to be easing up, Dr. Schuchat said. The geographic spread of ILI was reported as widespread in 48 states, which is down from 49 the previous week because Oregon dropped off the list. To go along with that, the ILI activity level in California has dropped 2 weeks in a row and now stands at level 7, the CDC data show.
Through the last full week of January, the cumulative “hospitalization rate is the highest we’ve seen,” acting Centers for Disease Control and Prevention director Anne Schuchat, MD, said. For the current season so far, the hospitalization rate stands at 51.4 per 100,000 population, putting it on pace to top the total of 710,000 flu-related admissions that occurred during the 2014-2015 season, she said in a weekly briefing Feb. 2.
Flu-related pediatric deaths also took a big jump for the week as another 16 were reported, which brings the total for the season to 53. Of the children who have died so far, only 20% were vaccinated, said Dan Jernigan, MD, MPH, director of the influenza division at the CDC’s National Center for Immunization and Respiratory Diseases, Atlanta. He also noted that half of the children who have been hospitalized did not had an underlying condition.
The one bit of good news for the week was that activity in the West seems to be easing up, Dr. Schuchat said. The geographic spread of ILI was reported as widespread in 48 states, which is down from 49 the previous week because Oregon dropped off the list. To go along with that, the ILI activity level in California has dropped 2 weeks in a row and now stands at level 7, the CDC data show.