User login
Richard Franki is the associate editor who writes and creates graphs. He started with the company in 1987, when it was known as the International Medical News Group. In his years as a journalist, Richard has worked for Cap Cities/ABC, Disney, Harcourt, Elsevier, Quadrant, Frontline, and Internet Brands. In the 1990s, he was a contributor to the ill-fated Indications column, predecessor of Livin' on the MDedge.
Buy the IBD, get the comorbidity for free
Chronic conditions, such as arthritis and respiratory disease, are significantly more common in adults with inflammatory bowel disease than in those without IBD, according to the Centers for Disease Control and Prevention.
The age-adjusted prevalence of arthritis in adults with IBD is 36.3%, compared with 21.1% for those without IBD, and the prevalence of respiratory disease is 27.3% for IBD patients and 16.6% for non-IBD patients, CDC investigators reported in the Morbidity and Mortality Weekly Report.
Other comorbid chronic conditions with a significantly higher prevalence in patients with IBD than in those without were ulcer (26% vs. 5.5%), cardiovascular disease (19.2% vs. 12%), and cancer (13.7% vs. 8.1%), said Fang Xu, PhD, of the CDC’s National Center for Chronic Disease Prevention and Health Promotion and associates.
Serious psychological distress in the past 30 days was significantly more prevalent in adults with IBD (7.4%) than in those without it (3.4%), and those with IBD were also significantly more likely to report averaging less than 7 hours of sleep than were those without IBD (38.2% vs. 32.2%), according to their analysis of the 2015 and 2016 National Health Interview Surveys.
“Given the disease’s complexity and the effects of chronic conditions and symptoms, optimal IBD care might require a multidisciplinary approach that includes gastroenterologists, preventive medicine specialists, and other medical practitioners,” the investigators wrote.
SOURCE: Xu F et al. MMWR. 2018 Feb 16;67(6);190-5.
FROM MMWR
Opioid prescriptions got shorter in 2017
Use of opioids was down among enrollees of all types of payers in 2017, while the use of drugs to treat opioid dependence went up for three of the four payer categories, according to pharmacy benefits manager Express Scripts.
The days’ worth of opioids dispensed per person per year was down 16.6% from 2016 to 2017 for enrollees with plans on the health exchanges received managed by Express Scripts. Medicaid patients received 16% fewer days’ worth, patients with commercial plans received 10.3% fewer days’ worth, and Medicare patients received 4.9% fewer days’ worth, Express Scripts said in its 2017 Drug Trend Report, which was based on data for 34.3 million members of pharmacy benefits plans the company administers.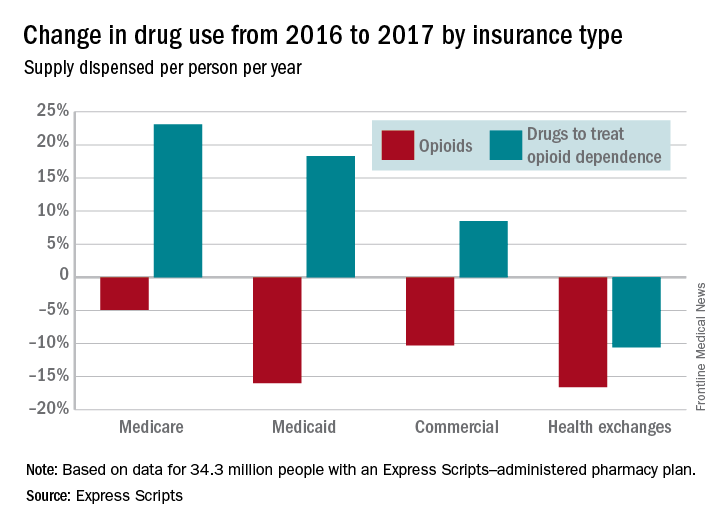
Plans that participated in Express Scripts’ Advanced Opioid Management solution, which was launched in September, experienced “a 60% reduction in the average days’ supply per initial fill, from 18.6 days to just 7.5 days,” according to the report.
Age at time of breast cancer diagnosis differs by race/ethnicity
according to an analysis of Surveillance, Epidemiology, and End Results (SEER) Program data for almost 750,000 women.
“Our finding challenges established norms with regard to screening practices and provides empirical evidence that race-based screening should be considered,” Sahael M. Stapleton, MD, and his associates at Massachusetts General Hospital, Boston, wrote in a research letter published online March 7 by JAMA Surgery.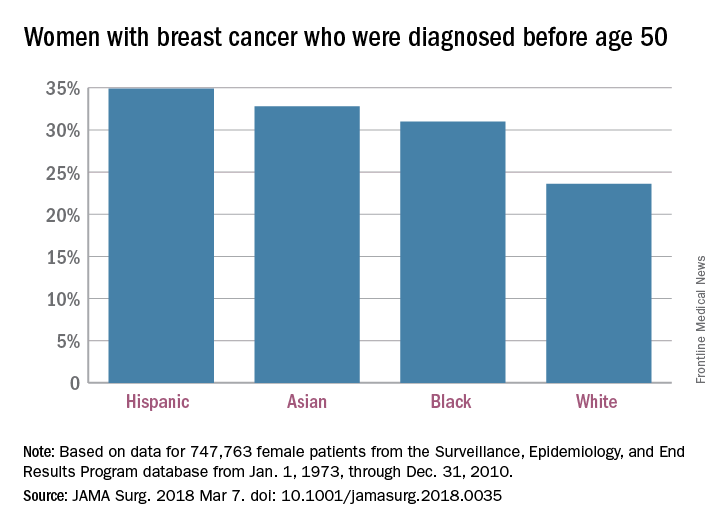
The researchers charted age at diagnosis and race/ethnicity for the 747,763 women in the SEER database from Jan. 1, 1973, through Dec. 31, 2010; this revealed “two distinct distribution patterns of age at diagnosis for female breast cancers: White patients peak in their 60s, whereas nonwhite patients peak in their 40s,” the investigators wrote.
Their calculations show that “screening ages would need to decrease to 47 years for black, 46 years for Hispanic, and 47 years for Asian patients ... to achieve a similar capture rate for nonwhite patients as current guidelines do for white patients” at 50 years of age.
Dr. Stapleton reported receiving support from two Massachusetts General Hospital fellowships. No other disclosures were reported.
SOURCE: Stapleton SM et al. JAMA Surg. 2018 Mar 7. doi: 10.1001/jamasurg.2018.003.
FROM JAMA SURGERY
Flu activity takes another turn for the better
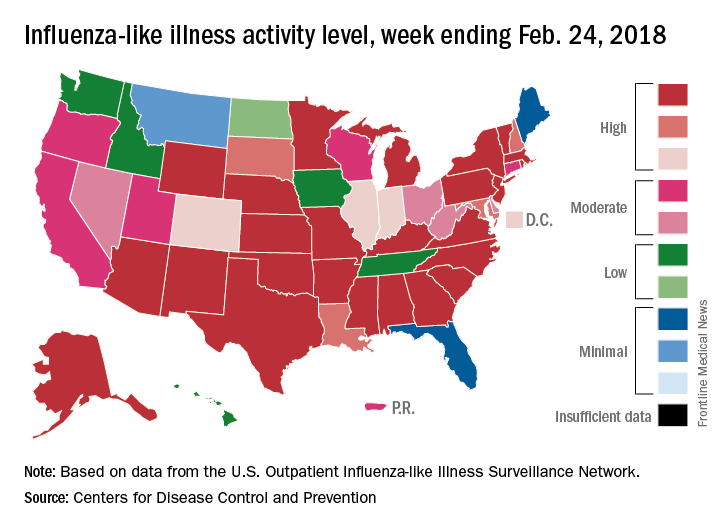
Outpatient influenza-like illness activity continues to drop, but pediatric deaths for 2017-2018 are already higher than either of the last two entire seasons, according to the Centers for Disease and Prevention.

An additional 17 influenza-like illness-related (ILI) pediatric deaths were reported during the week ending Feb. 24, eight of which occurred in previous weeks. That brings the total to 114 for the 2017-2018 flu season so far, compared with 110 for the entire 2016-2017 season and 93 for the 2015-2016 season, the CDC reported Mar. 2.
The proportion of outpatient visits for ILI took another big drop, falling to 5.0% for the week, which was down from 6.4% the previous week and the seasonal high of 7.4% the 2 weeks before that (Feb. 10 and Feb. 3), CDC data show.
Flu-related hospitalizations, however, continued to rise to new highs, as the cumulative rate hit 81.7 per 100,000 population. In 2014-2015, the season with the highest number of hospitalizations since the CDC started keeping track, the cumulative rate for the corresponding week was 55.9 per 100,000, according to the CDC’s Fluview website.
The map of state-reported ILI activity shows that 25 states are at level 10 on the CDC’s 1-10 scale, which is down from 33 the week before. Eight other states and the District of Columbia were in the “high” range with activity at levels 8 and 9 for the week ending Feb. 24, the CDC said.
Outpatient influenza-like illness activity continues to drop, but pediatric deaths for 2017-2018 are already higher than either of the last two entire seasons, according to the Centers for Disease and Prevention.
An additional 17 influenza-like illness-related (ILI) pediatric deaths were reported during the week ending Feb. 24, eight of which occurred in previous weeks. That brings the total to 114 for the 2017-2018 flu season so far, compared with 110 for the entire 2016-2017 season and 93 for the 2015-2016 season, the CDC reported Mar. 2.
The proportion of outpatient visits for ILI took another big drop, falling to 5.0% for the week, which was down from 6.4% the previous week and the seasonal high of 7.4% the 2 weeks before that (Feb. 10 and Feb. 3), CDC data show.
Flu-related hospitalizations, however, continued to rise to new highs, as the cumulative rate hit 81.7 per 100,000 population. In 2014-2015, the season with the highest number of hospitalizations since the CDC started keeping track, the cumulative rate for the corresponding week was 55.9 per 100,000, according to the CDC’s Fluview website.
The map of state-reported ILI activity shows that 25 states are at level 10 on the CDC’s 1-10 scale, which is down from 33 the week before. Eight other states and the District of Columbia were in the “high” range with activity at levels 8 and 9 for the week ending Feb. 24, the CDC said.
200 cardiovascular drugs now in development
, according to Pharmaceutical Research and Manufacturers of America.
One of those 42 treatments is “a nonviral gene therapy that targets a tissue repair and regeneration pathway in the body,” PhRMA noted. A total of 200 medicines, including those for lipid disorders and hypertension, were either in clinical trials or undergoing regulatory review as of Jan. 24, 2018, the group reported. Some treatments are being considered for more than one condition.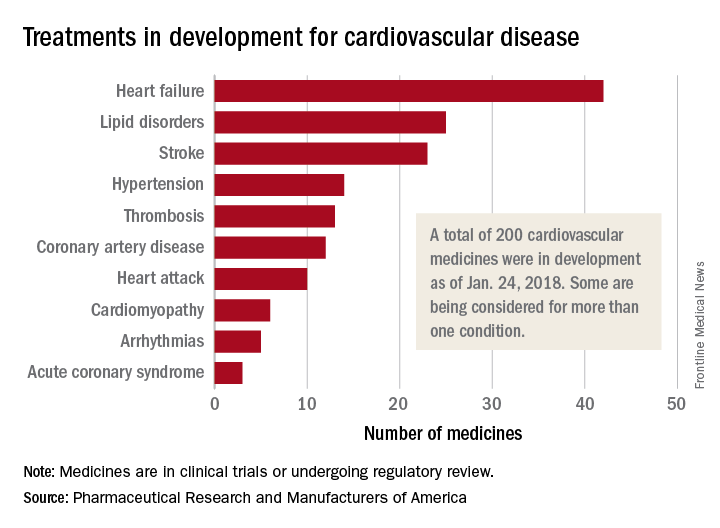
Americans support the right to affordable health care
Despite the rhetorical winds blowing out of Washington, 92% of Americans believe that they have the right to affordable health care, according to a recent survey by the Commonwealth Fund.
Political affiliation, it turns out, does not appear to determine support for such a right. Democrats aged 19-64 years voiced their support to the tune of 99% in favor of a right to affordable care, compared with 82% of Republicans and 92% of independents, the Commonwealth Fund said in a survey brief released March 1.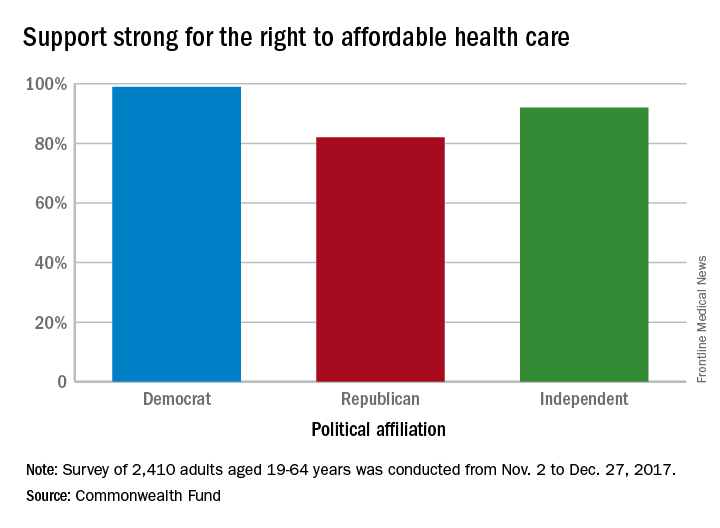
“This survey’s finding that strong majorities of U.S. adults, regardless of party affiliation, believe that all Americans should have a right to affordable health care suggests there may be popular support for a discussion over our preferred path,” the report’s authors wrote.
The survey showed that 36% of those who have health care insurance through the Affordable Care Act marketplaces are pessimistic about their chances of keeping that coverage, compared with 27% of those with Medicaid and 9% of adults with employer-sponsored health benefits.
Among those who lacked confidence about maintaining their coverage, the largest proportion (32%) of respondents believe that they will lose it because the “Trump administration will not carry out the law” and 19% think that they won’t be able to afford it in the future, they said.
“ Such a shift also would provide a more stable regulatory environment for insurers participating in both the marketplaces and Medicaid,” according to the report.
The Commonwealth Fund’s sixth Affordable Care Act Tracking Survey was conducted by the research firm SSRS between Nov. 2 and Dec. 27, 2017, with responses from 2,410 adults aged 19-64 years. The overall margin of error was ±2.7 percentage points at the 95% confidence level.
Breast cancer deaths projected for 2018
Female breast cancer mortality is expected to be about 25.3 per 100,000 women in 2018, with the highest rate in the District of Columbia and the lowest in Utah.
Approximately 40,920 deaths from invasive female breast cancer are predicted in the United States by the American Cancer Society (ACS) in its Cancer Facts & Figures 2018, which is based on analysis of 2001-2015 data from the National Center for Health Statistics. The death rate has declined 39% since its peak in 1989, and over the last 10 years, the annual decline has been 1.8% for white women and 1.5% for black women per year, the ACS said.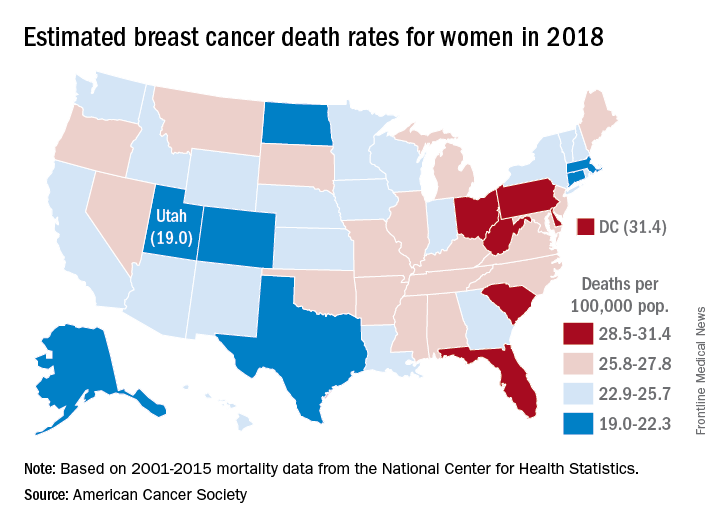
Breast cancer is the most common cancer in women, as it is expected to account for 30% of the almost 880,000 new cancer cases in 2018, compared with 13% for lung cancer, which is second. Lung cancer, however, is projected to cause more deaths among women – 70,500 – than any other cancer, the ACS reported.
Flu season shows signs of slowing
Flu-related outpatient activity dropped for the second week in a row as the cumulative hospitalization rate continues to rise, according to data from the Centers for Disease Control and Prevention.
For the week ending Feb. 17, the proportion of outpatient visits for influenza-like illness (ILI) was 6.4%, which was down from 7.4% the previous week (Feb. 10) and down from the seasonal high of 7.5% set 2 weeks earlier, the CDC said in its weekly flu surveillance report. The rate for the week ending Feb. 10 was reported last week as 7.5%, but it has been revised downward.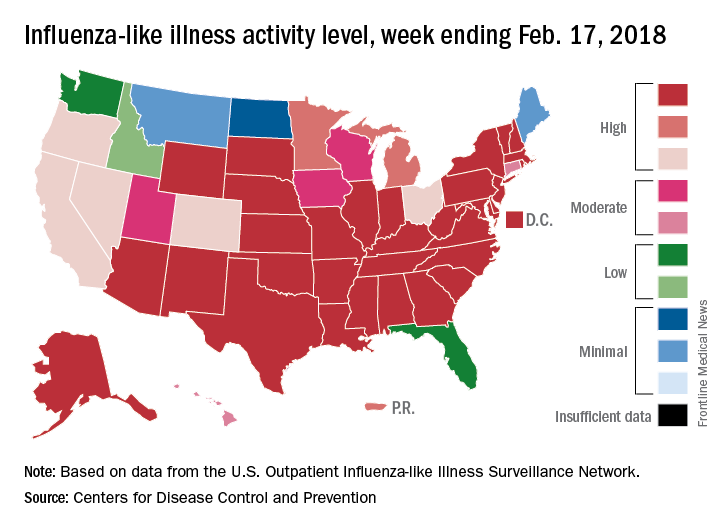
State reports of ILI activity support the decreases seen in the national outpatient rate. There were 33 states at level 10 on the CDC’s 1-10 scale for the week ending Feb. 17 – down from 39 the week before – and a total of 41 states in the “high” range from levels 8-10, compared with 45 the previous week, CDC’s FluView website shows.
Reports of flu-related pediatric deaths continued: 13 deaths were reported during the week, although 9 occurred in previous weeks. The total for the 2017-2018 season is now 97. There were 110 pediatric deaths in the entire 2016-2017 season, 93 during the 2015-2016 season, and 149 in 2014-2015, the CDC said.
Mortality estimates put pancreatic cancer on the map
The alphabet may put Vermont right after Utah, but pancreatic cancer mortality has them on opposite sides of the country.
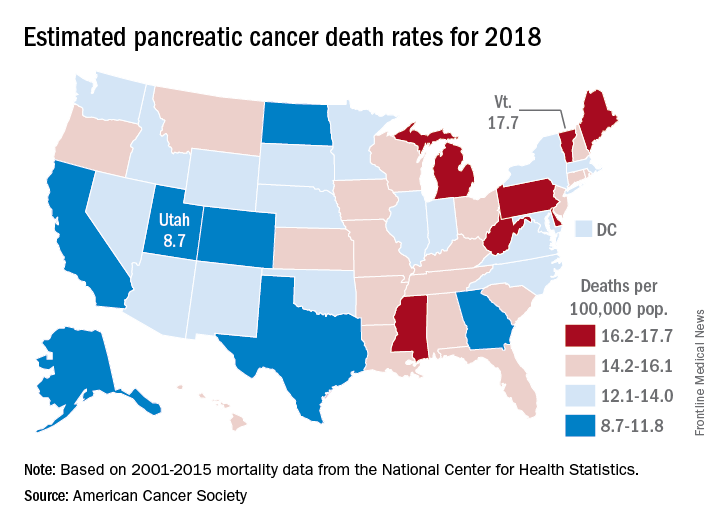
The expected number of deaths for 2018 and the current U.S. population estimate of nearly 326 million produce an expected death rate of 13.6 per 100,000 population. The Census Bureau estimates for the state populations, the deaths projected by the ACS, and a little math result in expected death rates of 8.7 per 100,000 for Utah and 17.7 for Vermont.
The incidence of pancreatic cancer increased by about 1% per year in whites and was stable in blacks from 2005 to 2014, although the rate of new cases in blacks is still about 25% higher than it is for whites. An estimated 55,440 new cases are expected in the United States in 2018, the ACS reported.
Although the survival rate for cancer of the pancreas has tripled since the mid-1970s, it is still much lower than for any other cancer. Five-year relative survival went from 3% in 1975-1977 to 9% in 2007-2013 for pancreatic cancer, while liver and intrahepatic bile duct cancer, which had the next-lowest survival rate, went from 3% to 19%, the ACS said.
The alphabet may put Vermont right after Utah, but pancreatic cancer mortality has them on opposite sides of the country.
The expected number of deaths for 2018 and the current U.S. population estimate of nearly 326 million produce an expected death rate of 13.6 per 100,000 population. The Census Bureau estimates for the state populations, the deaths projected by the ACS, and a little math result in expected death rates of 8.7 per 100,000 for Utah and 17.7 for Vermont.
The incidence of pancreatic cancer increased by about 1% per year in whites and was stable in blacks from 2005 to 2014, although the rate of new cases in blacks is still about 25% higher than it is for whites. An estimated 55,440 new cases are expected in the United States in 2018, the ACS reported.
Although the survival rate for cancer of the pancreas has tripled since the mid-1970s, it is still much lower than for any other cancer. Five-year relative survival went from 3% in 1975-1977 to 9% in 2007-2013 for pancreatic cancer, while liver and intrahepatic bile duct cancer, which had the next-lowest survival rate, went from 3% to 19%, the ACS said.
Flu increase may be slowing
A bit of revisionist history has outpatient influenza activity at a lower level than was reported last week, even though it hasn’t dropped.
The proportion of outpatient visits for influenza-like illness (ILI) for the week ending Feb. 10 was 7.5%, according to the Centers for Disease Control. That is lower than the 7.7% previously reported for the week ending Feb. 3, which would seem to be a drop, but the CDC also has revised that earlier number to 7.5%, so there is no change. (This is not the first time an earlier ILI level has been retroactively lowered: The figure reported for the week ending Jan. 13 was revised in the following report from 6.3% down to 6.0%.)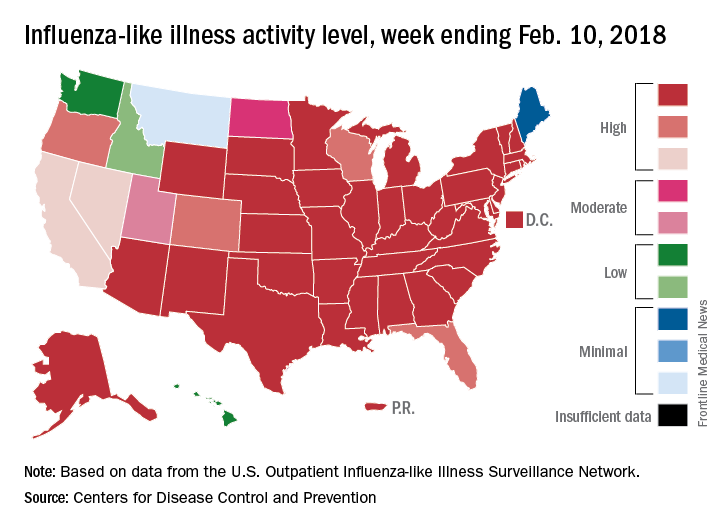
Hospital visits, however, continue to rise at record levels. The cumulative rate for the week ending Feb. 10 was 67.9 visits per 100,000 population, which is higher than the same week for the 2014-2015 (52.9 per 100,000) when flu hospitalizations for the season hit a high of 710,000. Flu-related pediatric deaths also went up, with 22 new reports; this brings the total to 84 for the 2017-2018 season.
FROM THE CDC WEEKLY U.S. INFLUENZA SURVEILLANCE REPORT