User login
Richard Franki is the associate editor who writes and creates graphs. He started with the company in 1987, when it was known as the International Medical News Group. In his years as a journalist, Richard has worked for Cap Cities/ABC, Disney, Harcourt, Elsevier, Quadrant, Frontline, and Internet Brands. In the 1990s, he was a contributor to the ill-fated Indications column, predecessor of Livin' on the MDedge.
Match Day 2018: Internal medicine increases positions, matches
Internal medicine helped to make the 2018 Main Residency Match the largest ever as the specialty offered and filled about 4% more residency slots than in 2017, according to the National Resident Matching Program (NRMP).
Internal medicine brought 7,542 PGY-1 positions – more than any other specialty – to the Match Day party this year and filled 44.9% of them with U.S. graduates and 96.7% overall. Despite the increase in IM residency slots, however, the number and percentage of U.S. seniors matching declined, as it has done each year since 2015. For all specialties, U.S. graduates filled 58.7% of the record-high 30,232 available spots, and the overall fill rate was 96.1%, the NRMP said in its 2018 Main Residency Match report.
The 2018 Match also set new highs for total positions offered (up 4.4% over last year), total (up 4.7%) and PGY-1 positions (up 4.9%) filled, and total applicants (up 1.7%). “The results of the Match are closely watched because they can be predictors of future physician workforce supply. There also is significant interest in the competitiveness of specialties, as measured by the percentage of positions filled overall and the percentage filled by senior students in U.S. allopathic medical schools,” the NRMP said.
Match Day 2018: Psychiatry increases positions and matches
as the specialty increased residency slots by 4.1% and accepted 3.3% more applicants, compared with 2017, according to the National Resident Matching Program.
Psychiatry brought 1,556 PGY-1 positions to the Match Day table this year and filled 63.1% of them with U.S. graduates – up for the fourth consecutive year – and 99.0% overall. For all specialties, U.S. graduates filled 58.7% of the record-high 30,232 available spots, and the overall fill rate was 96.1%, the NRMP said in its 2018 Main Residency Match report.
Match Day 2018: Big increases for neurology
Neurology helped to make the 2018 Main Residency Match the largest ever as the specialty offered and filled over 12% more residency slots than in 2017, according to the National Resident Matching Program (NRMP).
The third consecutive year with a double-digit increase in PGY-1 positions enabled neurology to bring 552 slots to the Match Day party this year: 50.7% were filled with U.S. graduates and the overall fill rate was 97.6%. For all specialties, U.S. graduates filled 58.7% of the record-high 30,232 available spots, and the overall fill rate was 96.1%, the NRMP said in its 2018 Main Residency Match report.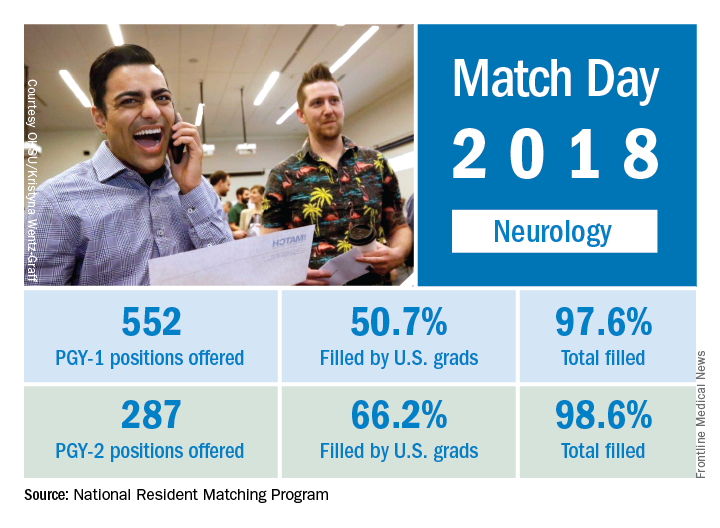
The total number of child neurology PGY-1 positions offered rose to 134, of which 96.3% were filled (75.4% by U.S. graduates). Another seven of eight PGY-2 child neurology positions were filled. Of 26 PGY-2 physician positions offered for child neurology, 12 were filled.
The 2018 Match also set new highs for total positions offered (up 4.4% over last year), total (up 4.7%) and PGY-1 positions (up 4.9%) filled, and total applicants (up 1.7%). “The results of the Match are closely watched because they can be predictors of future physician workforce supply. There also is significant interest in the competitiveness of specialties, as measured by the percentage of positions filled overall and the percentage filled by senior students in U.S. allopathic medical schools,” the NRMP said.
Match Day 2018: A slow year for pediatrics
Pediatrics saw modest gains in residency slots and matches in what was the largest Match Day on record, according to the National Resident Matching Program (NRMP).

The 2018 Match also set new highs for total positions offered (up 4.4% over last year), total positions and PGY-1 positions filled (up 4.7% and 4.9%, respectively), and total applicants (up 1.7%). “The results of the Match are closely watched because they can be predictors of future physician workforce supply. There also is significant interest in the competitiveness of specialties, as measured by the percentage of positions filled overall and the percentage filled by senior students in U.S. allopathic medical schools,” the NRMP said.
Pediatrics saw modest gains in residency slots and matches in what was the largest Match Day on record, according to the National Resident Matching Program (NRMP).
The 2018 Match also set new highs for total positions offered (up 4.4% over last year), total positions and PGY-1 positions filled (up 4.7% and 4.9%, respectively), and total applicants (up 1.7%). “The results of the Match are closely watched because they can be predictors of future physician workforce supply. There also is significant interest in the competitiveness of specialties, as measured by the percentage of positions filled overall and the percentage filled by senior students in U.S. allopathic medical schools,” the NRMP said.
Match Day 2018: Surgery increases positions and matches
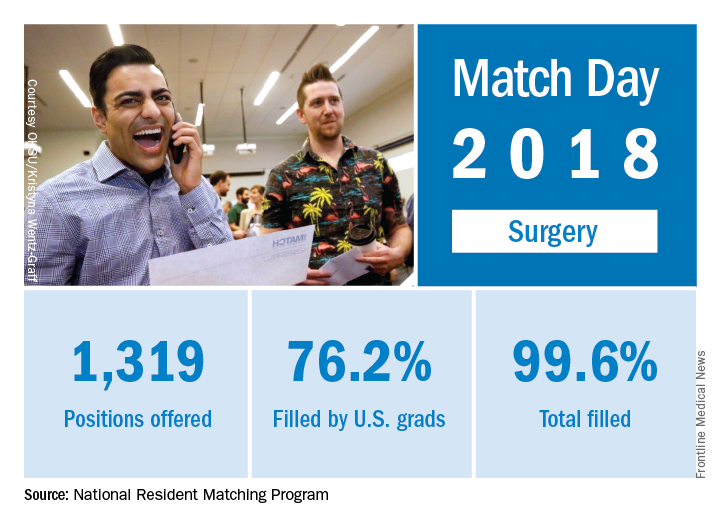
Surgery helped to make the 2018 Main Residency Match the largest ever as the specialty offered and filled 3% more residency slots than it did in 2017, according to the National Resident Matching Program (NRMP).
The 2018 Match also set new highs for total positions offered (up 4.4% over last year), total positions and PGY-1 positions filled (up 4.7% and 4.9%, respectively), and total applicants (up 1.7%). “The results of the Match are closely watched because they can be predictors of future physician workforce supply. There also is significant interest in the competitiveness of specialties, as measured by the percentage of positions filled overall and the percentage filled by senior students in U.S. allopathic medical schools,” the NRMP said.
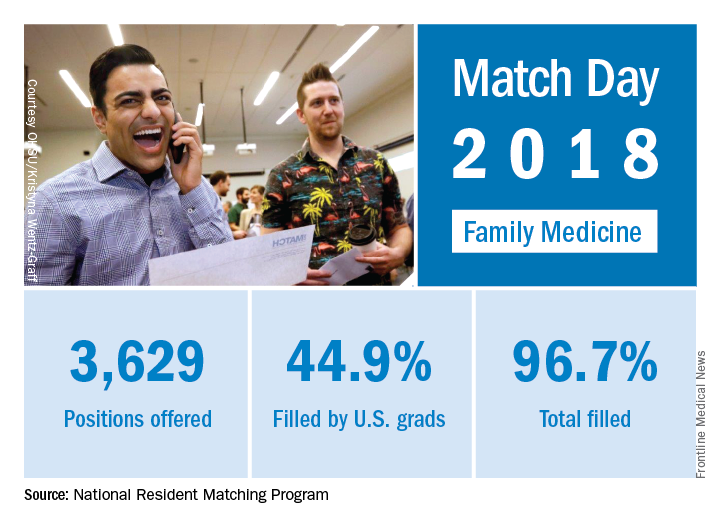
Match Day 2018: Family medicine increases positions, matches
as the specialty increased residency slots by 8% and accepted 9% more applicants, compared with 2017, according to the National Resident Matching Program (NRMP).
The 2018 Match also set new highs for total positions offered (up 4.4% over last year), total positions and PGY-1 positions filled (up 4.7% and 4.9%, respectively), and total applicants (up 1.7%). “The results of the Match are closely watched because they can be predictors of future physician workforce supply. There also is significant interest in the competitiveness of specialties, as measured by the percentage of positions filled overall and the percentage filled by senior students in U.S. allopathic medical schools,” the NRMP said.
Depression risks identified in women
The same group of women was significantly more likely to have minor depression, compared with those who were not depressed, if they had less than a high school education or asthma or if they smoked, reported Nan Guo, PhD, and her associates at Stanford (Calif.) University.
The adjusted relative risk for major depression was a significant 2.49 for women if they had government, state, or military insurance, compared with the reference group – those who had private insurance. Women with no insurance had an adjusted RR of 1.84, which did not reach statistical significance, they said.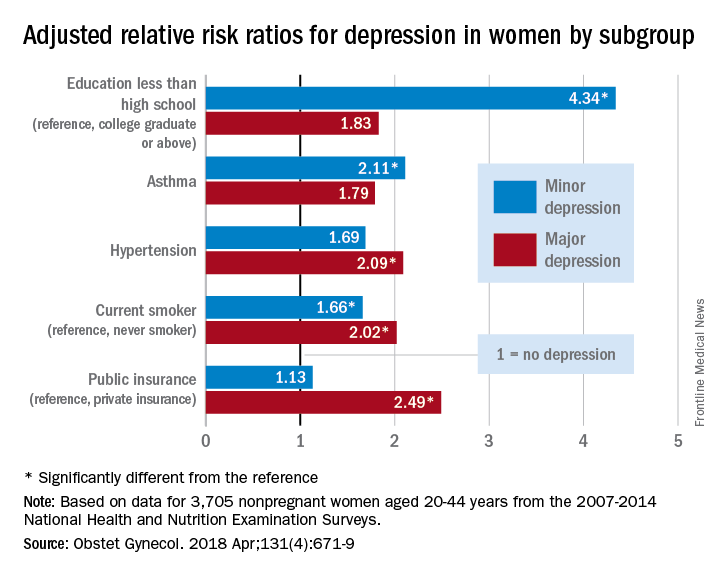
Education was a major area of difference between women with minor depression and those with no depression. Compared with the reference group – college graduate or above – adjusted RRs for minor depression were 4.34 for those with less than a high school education, 2.92 for those with a high school education, and 2.59 for women with some college or an associate degree. Women with asthma were 2.11 times as likely to have minor depression as those without asthma, and current smokers had an RR of 1.66 for minor depression, compared with never smokers, the investigators said.
The study was supported by funding from Stanford University. One investigator received an award from the National Institute of Child Health and Human Development. The investigators did not report any potential conflicts of interest.
FROM OBSTETRICS & GYNECOLOGY
A global snapshot of leukemia incidence
, according to an analysis of World Health Organization cancer databases.
Incidence also is generally higher in males, with a global male to female ratio of 1.4. For men, the highest regional leukemia rate – estimated at 11.3 per 100,000 population for 2012 – was found in Australia and New Zealand, with northern America (the United States and Canada) next at 10.5 per 100,000. Australia/New Zealand and northern America had the highest rate for women at 7.2 per 100,000, followed by western Europe and northern Europe at 6.0 per 100,000, reported Adalberto Miranda-Filho, PhD, of the WHO’s International Agency for Research on Cancer in Lyon, France, and his associates.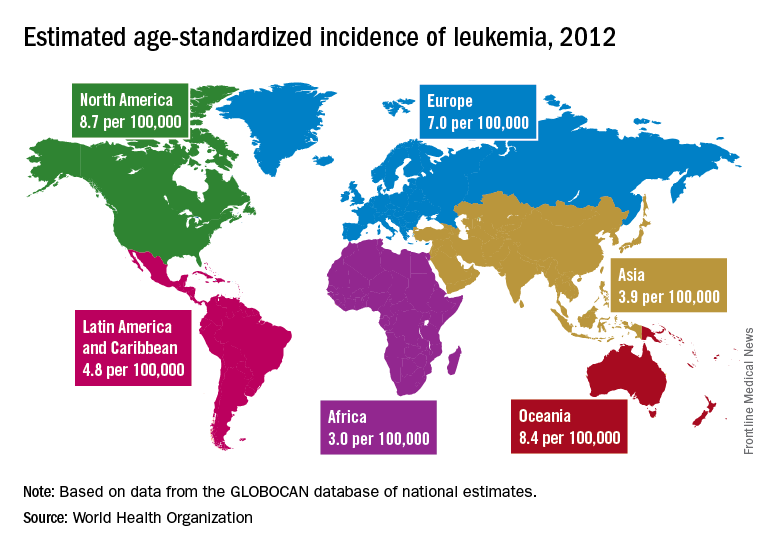
The lowest regional rates for women were found in western Africa (1.2 per 100,000), middle Africa (1.8), and Micronesia/Polynesia (2.1). For men, leukemia incidence was lowest in western Africa (1.4 per 100,000), middle Africa (2.6), and south-central Asia (3.4), according to data from the WHO’s GLOBOCAN database. The report was published in The Lancet Haematology.
Estimates for leukemia subtypes in 2003-2007 – calculated for 54 countries, not regions – also showed a great deal of variation. For acute lymphoblastic leukemia, Ecuador had the highest rates for both males (2.8 per 100,000) and females (3.3), with high rates seen in Costa Rica, Columbia, and Cyprus. Rates in the United States were near the top: 2.1 for males and 1.6 for females. Rates were lowest for men in Jamaica (0.4) and Serbia (0.6) and for women in India (0.5) and Serbia and Cuba (0.6), Dr. Miranda-Filho and his associates said.
Incidence rates for acute myeloid leukemia were highest in Australia for men (2.8 per 100,000) and Austria for women (2.2), with the United States near the top for both men (2.6) and women (1.9). The lowest rates occurred in Cuba and Egypt for men (0.9 per 100,000) and Cuba for women (0.4), data from the WHO’s Cancer Incidence in Five Continents Volume X show.
Chronic lymphocytic leukemia incidence was highest for men in Canada (4.5 per 100,000), Ireland and Lithuania (4.4), and Slovakia (4.3). The incidence was highest for women in Lithuania (2.5), Canada (2.3), and Slovakia and Denmark (2.1). Incidence in the United States was 3.5 for men and 1.8 for women. At the other end of the scale, the lowest rates for both men and women were in Japan and Malaysia (0.1), the investigators’ analysis showed.
Chronic myeloid leukemia rates were the lowest of the subtypes, and Tunisia was the lowest for men at 0.4 per 100,000 and tied for lowest with Serbia, Slovenia, and Puerto Rico for women at 0.3. Incidence was highest for men in Australia at 1.8 per 100,000 and highest for women in Uruguay at 1.1. Rates in the United States were 1.3 for men and 0.8 for women, Dr. Miranda-Filho and his associates said.
“The higher incidence of acute lymphoblastic leukaemia in parts of South America, as well as of chronic lymphocytic leukaemia in populations across North America and Oceania, alongside a lower incidence in Asia, might be important markers for further epidemiological study, and a means to better understand the underlying factors to support future cancer prevention strategies,” the investigators wrote.
SOURCE: Miranda-Filho A et al. Lancet Haematol. 2018;5:e14-24.
FROM THE LANCET HAEMATOLOGY
Top-selling drugs going to patients with diabetes
, and more than half of the 20 biggest-selling drugs for the year are regularly prescribed to patients with diabetes, according to the Agency for Healthcare Research and Quality.
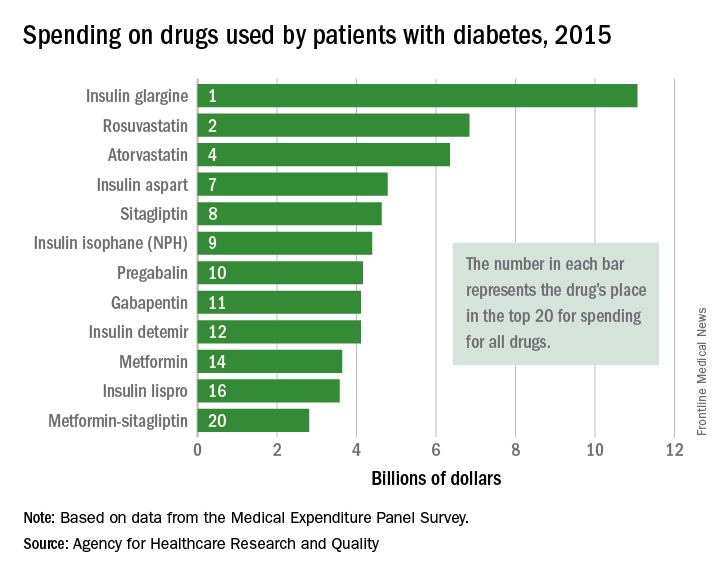
Drugs used by patients with diabetes also took up half of the next 10 spots in the list: gabapentin was 11th, insulin detemir was 12th, metformin was 14th, insulin lispro was 16th, and metformin-sitagliptin was 20th, according to the MEPS data.
The drugs in the MEPS top 10 for 2015 – the most recent year for which data are available – that are not commonly prescribed for diabetes were the asthma/chronic obstructive pulmonary drug fluticasone-salmeterol (third at $6.7 billion), the gastroesophageal reflux disease drug esomeprazole (fifth at $5.3 billion), and aripiprazole (sixth at $5.2 billion), which is used to treat schizophrenia and bipolar disorder.
, and more than half of the 20 biggest-selling drugs for the year are regularly prescribed to patients with diabetes, according to the Agency for Healthcare Research and Quality.
Drugs used by patients with diabetes also took up half of the next 10 spots in the list: gabapentin was 11th, insulin detemir was 12th, metformin was 14th, insulin lispro was 16th, and metformin-sitagliptin was 20th, according to the MEPS data.
The drugs in the MEPS top 10 for 2015 – the most recent year for which data are available – that are not commonly prescribed for diabetes were the asthma/chronic obstructive pulmonary drug fluticasone-salmeterol (third at $6.7 billion), the gastroesophageal reflux disease drug esomeprazole (fifth at $5.3 billion), and aripiprazole (sixth at $5.2 billion), which is used to treat schizophrenia and bipolar disorder.
Flu activity continues to decline
The 2017-2018 flu season continued to loosen its grip on the country as both outpatient activity and pediatric deaths dropped during the week ending March 3, according to the Centers for Disease Control and Prevention.
After five consecutive weeks of double-digit pediatric deaths related to influenza-like illness (ILI), five deaths were reported for the week ending March 3, four of which occurred in previous weeks. The total for the 2017-2018 season is now 119, the CDC said in its weekly surveillance report.
The proportion of outpatient visits for ILI was 3.7% for the week, which is down from 4.9% the week before and less than half of the seasonal high of 7.5% that was recorded for the week of Feb. 3, CDC data show. The national baseline level of outpatient activity is 2.2%.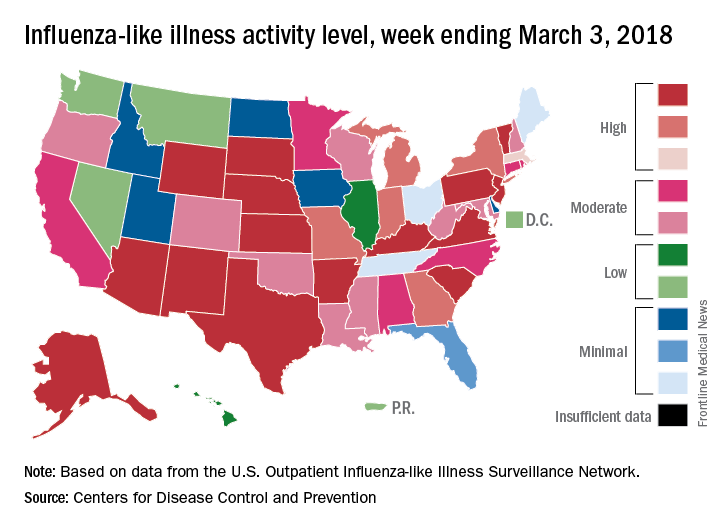
The cumulative hospitalization rate for the 2017-2018 flu season climbed from 84.2 the previous week to 86.3 per 100,000 population – well above the rate of 57.2 per 100,000 that was recorded for the corresponding week of the hospitalization-record-setting 2014-2015 season, FluView data show.