User login
Richard Franki is the associate editor who writes and creates graphs. He started with the company in 1987, when it was known as the International Medical News Group. In his years as a journalist, Richard has worked for Cap Cities/ABC, Disney, Harcourt, Elsevier, Quadrant, Frontline, and Internet Brands. In the 1990s, he was a contributor to the ill-fated Indications column, predecessor of Livin' on the MDedge.
Synthetic opioids drive increase in overdose deaths
Opioid-related drug overdose deaths jumped 28% from 2015 to 2016, with the largest increase coming from synthetic opioids, such as illicitly manufactured fentanyl, according to the Centers for Disease Control and Prevention.
The age-adjusted death rate for opioid overdoses increased from 10.4 per 100,000 population in 2015 to 13.3 per 100,000 in 2016, and the 42,249 opioid deaths in 2016 represented more than 66% of all overdose deaths that year, Puja Seth, PhD, and her associates at the CDC reported in the Morbidity and Mortality Weekly Report.
Illegally manufactured fentanyl “is now being mixed into counterfeit opioid and benzodiazepine pills, heroin, and cocaine, likely contributing to increases in overdose death rates involving other substances,” they wrote. To illustrate that point, they reported that cocaine overdose deaths increased 52.4% from 2.1 per 100,000 in 2015 to 3.2 in 2016. The death rate for the other drug category covered in the report – psychostimulants with abuse potential – climbed from 1.8 per 100,000 in 2015 to 2.4 in 2016, for an increase of 33.3%, Dr. Seth and her associates noted.
Data presented from 31 states and the District of Columbia show that
CDC Principal Deputy Director Anne Schuchat, MD, said in a written statement.
Death rates from overdoses involving synthetic opioids increased in 21 states, with 10 states doubling their rates from 2015 to 2016, and 14 states had significant increases in death rates involving heroin. In D.C., for example, the death rate increased 392% (3.9 per 100,000 to 19.2) from synthetic opioid overdoses and 75% (9.9 per 100,000 to 17.3) for deaths related to heroin, the report showed.
“Effective, synchronized programs to prevent drug overdoses will require coordination of law enforcement, first responders, mental health/substance-abuse providers, public health agencies, and community partners,” Dr. Seth and her associates said.
SOURCE: Seth P et al. MMWR. 2018 Mar 30;67(12):349-58.
FROM MMWR
Ranking points physicians toward South Dakota
South Dakota’s nickname may be the Mount Rushmore State, but for physicians it’s the land of opportunity, according to personal finance website WalletHub.
South Dakota took the top spot in the 2018 list of the “best states to practice medicine” with 75.97 out of a possible 100 points while New Jersey took up residence at the other end of the list by finishing 51st (the District of Columbia was included) with a score of 40.24, WalletHub reported.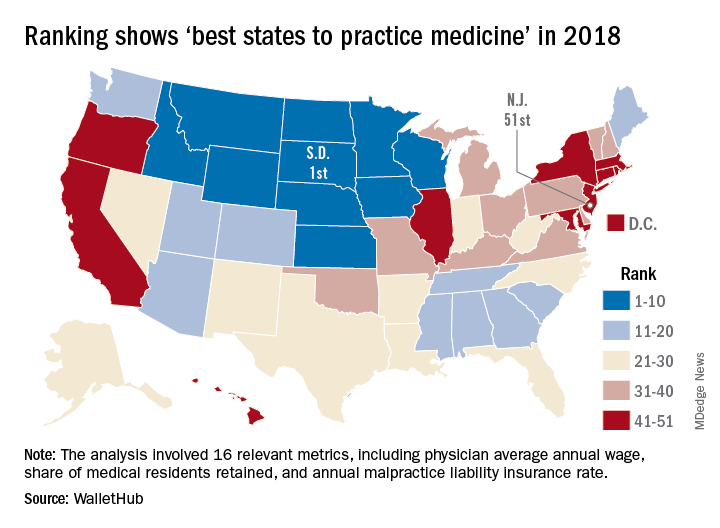
South Dakota headed a solid block of states in the upper Midwest and Rocky Mountain regions that made up the entire top 10, with Nebraska second overall, Idaho third, Iowa (last year’s winner) fourth, and Minnesota fifth. Finishing just above New Jersey were Rhode Island in 50th, New York in 49th, Hawaii in 48th, and D.C. in 47th.
WalletHub compared the 50 states and D.C. using 16 different metrics across two broad categories: “opportunity and competition” (11 metrics worth 70 points) and “medical environment” (5 metrics worth 30 points). Metrics included physicians’ average annual wage (adjusted for cost of living), employer-based insurance rates, projected share of elderly population, physician assistants per capita, and malpractice award payout amount per capita.
South Dakota, which ranked first in the medical environment category and third in opportunity and competition, posted top-5 scores in such areas as adjusted physician annual wage, lowest projected competition, and annual malpractice liability insurance rate, according to the survey.
Diabetes does its part to increase health care costs
, which was enough to make it “the most costly chronic illness in the country,” the American Diabetes Association said.
The estimated total economic burden of diabetes went from an inflation-adjusted estimate of $261 billion in 2012 to $327 billion – $237 billion in direct medical costs and $90 billion in indirect costs such as absenteeism, reduced productivity, and premature mortality – in 2017, according to a new report from the ADA published in Diabetes Care.
“One of every four health care dollars is incurred by someone with diagnosed diabetes, and one of every seven health care dollars is spent directly treating diabetes and its complications,” the ADA said in a written statement.
The study used data from a large number of sources, including the American Community Survey, the OptumInsight de-identified Normative Health Information database, the Medical Expenditure Panel Survey, and the Medicare 5% sample Standard Analytical Files. All cost estimates were extrapolated to the 2017 U.S. population and adjusted to 2017 dollars.
SOURCE: Diabetes Care. 2018 Mar 22. doi: 10.2337/dci18-0007.
FROM DIABETES CARE
TB in 2017: Good news and bad news
according to the Centers for Disease Control and Prevention.
Those new lows – TB incidence of 2.8 per 100,000 persons and 9,093 new cases – continue a downward trend that started in 1993, but the current rate of decline is much lower than the threshold needed to eliminate TB by the year 2100, Rebekah J. Stewart and her associates at the CDC’s Division of Tuberculosis Elimination, Atlanta, wrote in the Morbidity and Mortality Weekly Report.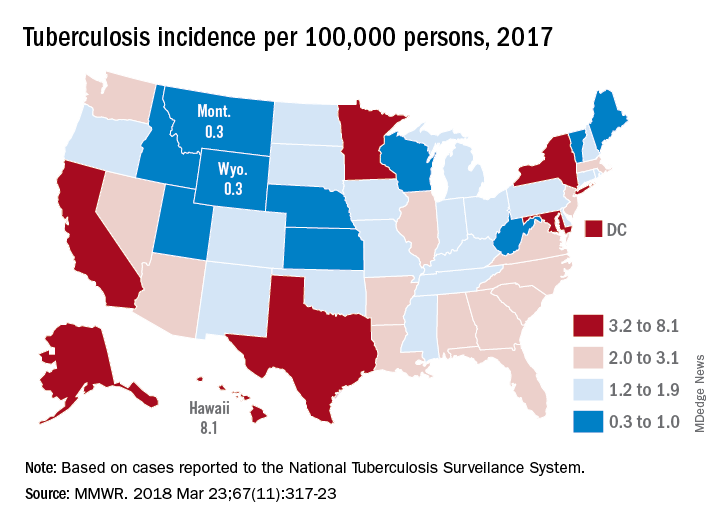
Geographically, at least, the states with populations at the highest risk are Hawaii, which had a TB incidence of 8.1 per 100,000 persons in 2017, and Alaska, with an incidence of 7.0 per 100,000. California and the District of Columbia were next, each with an incidence of 5.2. The states with the lowest rates were Montana and Wyoming at 0.3 per 100,000, the investigators reported, based on data from the National Tuberculosis Surveillance System as of Feb. 12, 2018.
Groups most affected by TB include persons housed in congregate settings – homeless shelters, long-term care facilities, and correctional facilities – and those from countries that have high TB prevalence. Overall incidence for non–U.S. born residents was 14.6 per 100,000 in 2017, compared with 1.0 for the native born, with large discrepancies seen between U.S. and non–U.S. born blacks (2.8 vs. 22.0), native Hawaiian/Pacific Islanders (6.5 vs. 21.0), and Asians (2.0 vs. 27.0), Ms. Stewart and her associates said.
“Increased support of global TB elimination efforts would help to reduce global … prevalence, thereby indirectly reducing the incidence of reactivation TB in the United States among non–U.S. born persons from higher-prevalence countries,” they wrote.
The issue of global action on TB was addressed by the Forum of International Respiratory Societies in a statement recognizing World TB Day (March 24). “TB is the world’s most common infectious disease killer, yet is identifiable, treatable and preventable; what is missing is the political will to dedicate the resources necessary to eradicate it, once and for all,” said Dean E. Schraufnagel, MD, the organization’s executive director.
SOURCE: Stewart RJ et al. MMWR 2018 Mar 23;67(11):317-23.
FROM MMWR
Obesity in adults continues to rise
according to data from the National Health and Nutrition Examination Survey.
The age-standardized prevalence of obesity – defined as a body mass index of 30 or more – among adults aged 20 years and over increased from 33.7% for the 2-year period of 2007-2008 to 39.6% in 2015-2016, while the prevalence of severe obesity – defined as a body mass index of 40 kg/m2 or more – went from 5.7% to 7.7% over that same period, Craig M. Hales, MD, and his associates at the Centers for Disease Control and Prevention in Hyattsville, Md., and Atlanta said in a research letter published in JAMA.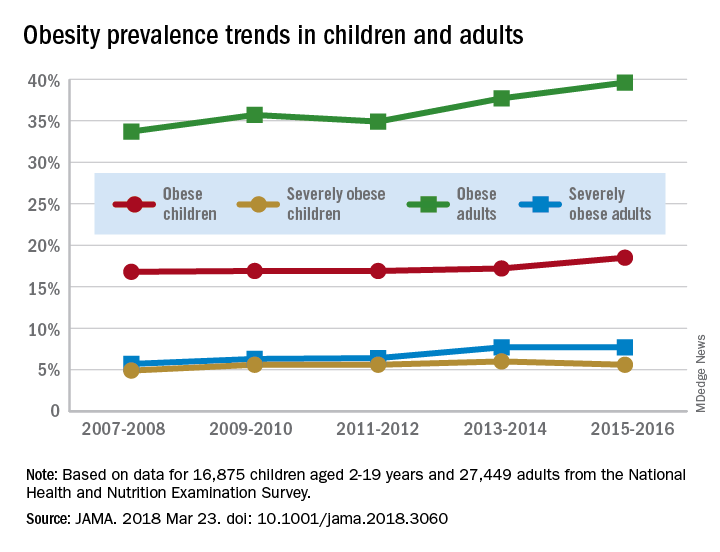
The prevalence of obesity in children aged 2-19 years – defined as BMI at or above the sex-specific 95th percentile – increased, but not significantly, from 16.8% in 2007-2008 to 18.5% in 2015-2016, with most of that increase coming in the last 2 years. Severe obesity – BMI at or above 120% of the sex-specific 95th percentile – rose from 4.9% to 5.6% over those 10 years, but the last 2-year period saw the rate drop from 6% in 2013-2014, the investigators reported.
For the most recent reporting period, boys were more likely than girls to be obese (19.1% vs. 17.8%) and severely obese (6.3% vs. 4.9%), and both obesity and severe obesity were more common with increasing age. Obesity prevalence went from 13.9% in those aged 2-5 years to 20.6% in 12- to 19-year-olds, and severe obesity was 1.8% in the youngest group and 7.7% in the oldest, with the middle-age group (6-11 years) in the middle in both categories, they said
Among the adults, obesity was more common in women than men (41.1% vs. 37.9%) for 2015-2016, as was severe obesity (9.7% vs. 5.6%). Obesity and severe obesity were both highest in those aged 40-59 years, but obesity prevalence was lowest in the younger group (20-39 years) and severe obesity was least common in the older group (60 years and older), Dr. Hales and his associates said.
The analysis involved 16,875 children and 27,449 adults over the 10-year period. The investigators did not report any conflicts of interest.
SOURCE: Hales CM et al. JAMA 2018 Mar 23. doi: 10.1001/jama.2018.3060.
FROM JAMA
Parents surveyed about underage drinking
Most parents of children aged 10-17 years have talked to them about alcohol consumption, but many do not consider brain health to be an important reason to avoid underage drinking, according to a recent survey of 1,000 parents.
The 76% of parents who reported having at least one conversation about alcohol was up by 7% from a survey conducted in 2003, the Foundation for Advancing Alcohol Responsibility said.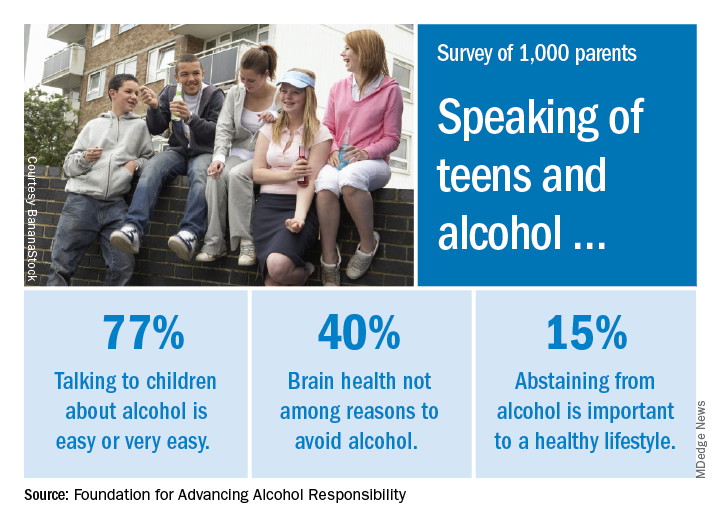
As for the most important reasons to avoid alcohol, 79% said that it interferes with judgment and the ability to make good decisions, and 77% mentioned the unintended consequences of consuming too much. Slightly more than 40% did not include its effects on brain development, the report said.
“Adolescence includes critical phases in brain development. The area of the brain that controls reasoning – helps us think before we act – matures later in the third decade of life. The sooner that parents speak with their children about the dangers of drinking alcohol underage, the better,” said Deborah Gilboa, MD, a Pittsburgh family physician who serves on the foundation’s education advisory board.
The survey was conducted online by GfK between Nov. 10 and 12, 2017, among adults aged 18 years and over with at least one child aged 10-17 years. The margin of error is plus or minus 3 percentage points for the full sample.
Full-term infant mortality: United States versus Europe
according to Neha Bairoliya, PhD, and Günther Fink, PhD.
The United States had an FTIMR of 2.19 per 1,000 full-term live births for that 3-year period, compared with a median of 1.11 for Austria, Denmark, Finland, Norway, Sweden, and Switzerland, said Dr. Bairoliya of the Harvard Center for Population and Development Studies, Cambridge, Mass., and Dr. Fink of the Swiss Tropical and Public Health Institute, Basel, Switzerland.
A classification system for individual states that rated FTIMR scores from poor (greater than or equal to 2.75) to excellent (greater than 1.25) put Connecticut, with a U.S.–low rate of 1.29 per 1,000 births, in the good (greater than or equal to1.25 to 1.75) category, so no state managed to join the excellent group of European countries, whose highest rate was 1.24, they reported in PLOS Medicine.
Missouri’s FTIMR of 3.77 per 1,000 was the highest among the 50 states. Along with Missouri, 12 other states were classified as poor, while 11 were considered fair (less than or equal to 2.25 to less than 2.75), 16 were average (less than or equal to 1.25 to less than 1.75), and 10 states earned a classification of good, the investigators said.
They used National Center for Health Statistics data for 7,431 deaths among 10,175,481 children born full term – defined as 37-42 weeks’ gestation – between Jan. 1, 2010, and Dec. 31, 2012. Data on European births came from the Euro-Peristat database.
Data for preterm births put the United States in a somewhat better light: For births from 32 to 36 weeks, mortality rates were 8.24 per 1,000 in the United States and 8.25 for the six European countries; for births at 24-27 weeks, the rates were 199 in the United States and 213 for the Euro six, Dr. Bairoliya and Dr. Fink said.
The investigators did not receive any specific funding for the study, and they said that they had no relevant conflicts of interest.
SOURCE: Bairoliya N, Fink G. PLOS Med. 2018 Mar 20;15(3):e1002531.
FROM PLOS MEDICINE
Arthritis limits physical activity the most in the South
“Physical activity is a proven strategy for managing arthritis symptoms,” but 35% of Americans with arthritis do not participate in any such activities or exercise, according to investigators who analyzed data from a national survey of more than 440,000 adults.
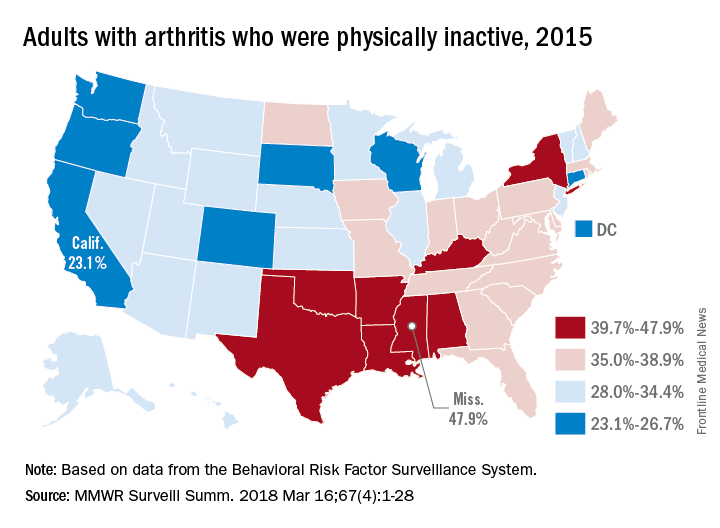
The low rates of inactivity in the western half of the country were topped by California’s 23.1% and South Dakota’s 23.4%, with Oregon (24.0%) and Wisconsin (24.6%) not too far behind, Dr. Barbour and his associates said based on data for 441,456 adults aged 18 years and older who were interviewed for the Behavioral Risk Factor Surveillance System.
Overall prevalence rates show that arthritis has the greatest effect in southern states, which, in addition to high inactivity, had more arthritis-attributable severe joint pain, more arthritis-attributable social participation restriction, and less leisure-time walking among adults with arthritis. This information, the investigators suggested, may help public health professionals “to better understand and target evidence-based nonpharmaceutical interventions, such as arthritis self-management education and physical activity.”
SOURCE: Barbour KE et al. MMWR Surveill Summ. 2018 Mar 16;67(4):1-28.
“Physical activity is a proven strategy for managing arthritis symptoms,” but 35% of Americans with arthritis do not participate in any such activities or exercise, according to investigators who analyzed data from a national survey of more than 440,000 adults.
The low rates of inactivity in the western half of the country were topped by California’s 23.1% and South Dakota’s 23.4%, with Oregon (24.0%) and Wisconsin (24.6%) not too far behind, Dr. Barbour and his associates said based on data for 441,456 adults aged 18 years and older who were interviewed for the Behavioral Risk Factor Surveillance System.
Overall prevalence rates show that arthritis has the greatest effect in southern states, which, in addition to high inactivity, had more arthritis-attributable severe joint pain, more arthritis-attributable social participation restriction, and less leisure-time walking among adults with arthritis. This information, the investigators suggested, may help public health professionals “to better understand and target evidence-based nonpharmaceutical interventions, such as arthritis self-management education and physical activity.”
SOURCE: Barbour KE et al. MMWR Surveill Summ. 2018 Mar 16;67(4):1-28.
FROM MMWR SURVEILLANCE SUMMARIES
Match Day 2018: Ob.gyn. increases positions and matches
compared with 2017, according to the National Resident Matching Program (NRMP).
Ob.gyn. brought 1,336 first-year positions to the Match Day party this year and filled 78.7% of them with U.S. graduates. The overall fill rate of 99.6% is actually down from last year, when the specialty managed to fill all 1,288 positions offered. For all specialties, U.S. graduates filled 58.7% of the record-high 30,232 available spots, and the overall fill rate was 96.1%, the NRMP said in its 2018 Main Residency Match report.
Match Day 2018: A slow year for dermatology
according to the National Resident Matching Program (NRMP).
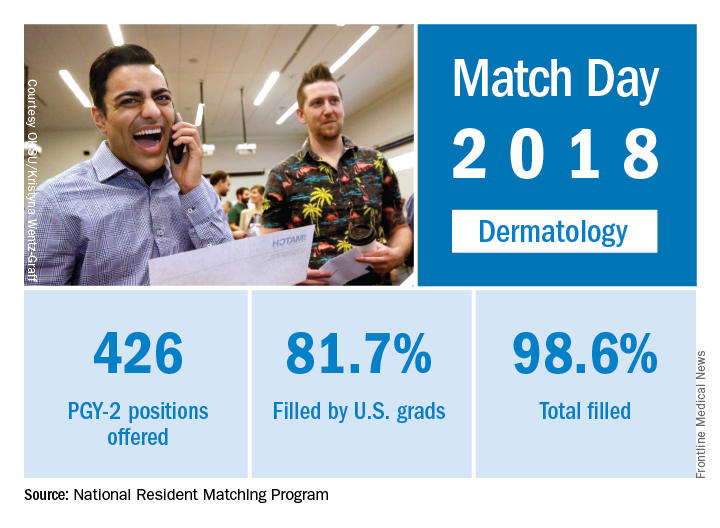
The 2018 Match also set new highs for total positions offered (up 4.4% over last year), total positions filled (up 4.7%), PGY-1 positions (up 4.9%) filled, and total applicants (up 1.7%). “The results of the Match are closely watched because they can be predictors of future physician workforce supply. There also is significant interest in the competitiveness of specialties, as measured by the percentage of positions filled overall and the percentage filled by senior students in U.S. allopathic medical schools,” the NRMP said.
according to the National Resident Matching Program (NRMP).
The 2018 Match also set new highs for total positions offered (up 4.4% over last year), total positions filled (up 4.7%), PGY-1 positions (up 4.9%) filled, and total applicants (up 1.7%). “The results of the Match are closely watched because they can be predictors of future physician workforce supply. There also is significant interest in the competitiveness of specialties, as measured by the percentage of positions filled overall and the percentage filled by senior students in U.S. allopathic medical schools,” the NRMP said.