User login
Richard Franki is the associate editor who writes and creates graphs. He started with the company in 1987, when it was known as the International Medical News Group. In his years as a journalist, Richard has worked for Cap Cities/ABC, Disney, Harcourt, Elsevier, Quadrant, Frontline, and Internet Brands. In the 1990s, he was a contributor to the ill-fated Indications column, predecessor of Livin' on the MDedge.
Musculoskeletal procedures predominate in top 20 surgeries
The represented almost 55% of the 14.2 million operating room procedures performed during inpatient stays in the United States, according to the Agency for Healthcare Research and Quality (AHRQ).
More than 1.2 million of those procedures involved cesarean sections, making it the most frequently performed in-hospital surgery in 2014 with a rate of 390 per 100,000 population, which works out to 8.8% of all procedures. Circumcision was second with 337 procedures per 100,000, followed by knee arthroplasty (236), total and partial hip replacement (164), and percutaneous coronary angioplasty (146), the AHRQ reported in a statistical brief.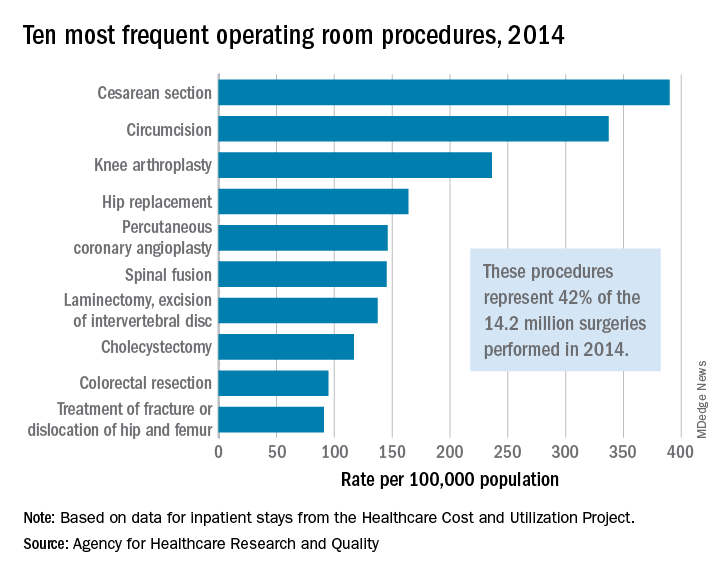
There were four obstetric/gynecologic procedures among the top 20 – namely, cesarean section, ligation of fallopian tubes (ranked 11th), hysterectomy (13th), and oophorectomy (15th) – and these together represented 13.5% of all surgeries that year. The three digestive procedures in the top 20 – cholecystectomy (ranked 8th), colorectal resection (9th), and appendectomy (12th) – made up 6.4% of all operating room procedures, they said based on data from the AHRQ’s Healthcare Cost and Utilization Project.
Cancer clinics continue to close and consolidate
and increased costs in the process, according to the Community Oncology Alliance.
From 2008 to 2018, a total of 1,653 oncology clinics and/or practices were affected in the following ways: 423 clinics closed, 658 practices were acquired by hospitals, 168 practices merged or were acquired by a corporate entity, 359 practices reported that they were struggling financially, and 45 practices sent patients elsewhere for chemotherapy, the COA said its 2018 Practice Impact Report.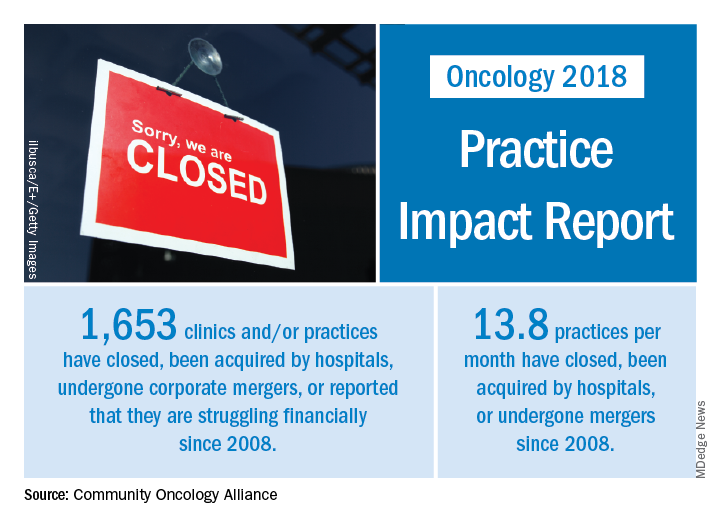
“The shifting and shrinking community cancer care system reduces access to cancer care, inflates spending at the more expensive hospital setting, and is a disservice to patients, their caregivers, and support networks,” Jeff Vacirca, MD, president of COA said in a written statement.
Crunching the numbers another way shows that 13.8 practices a month have closed, been acquired by hospitals, or undergone mergers since 2008. The number of community clinics that have closed increased by 11.3% since the 2016 Practice Impact Report, and consolidations with hospitals rose by 8%. Practices with financial struggles were down by 7.9% from 2016, “which is proportional to the number of practices that have been acquired or moved into the hospital setting,” the COA said in the 2018 report.
“No one can look at [recent] trends and say that there hasn’t been a clear and negative dismantling of our cancer care system over the last decade,” Ted Okon, executive director of COA, said in the statement accompanying the report. “This situation is the direct result of the misguided 340B [drug discount program] and [the 2013] sequester cut allowed to take place by our elected officials in Washington. The pressures of these misguided public policies have been a one-two punch, pushing and pulling community oncology practices to close, consolidate, or be acquired by hospitals, all at the expense of patients.”
Indoor tanning tax revenues continue to fall
since 2011, despite increased overall spending on services by consumers, according to investigators from the University of Pennsylvania.
Since the Affordable Care Act was passed in 2010 with a 10% excise tax on indoor tanning services, consumer spending, as reflected by collections of that tax, has dropped 13% – from $86.3 million in 2011 to $75.1 in 2016. The amount collected actually increased in 2012 and 2013, when revenue was $91.7 million, making the drop since that peak an even larger 18.1%. Overall personal spending on services, in the meantime, rose steadily from $7.1 billion in 2011 to $8.7 billion in 2016, or 22.6%, Kishore L. Jayakumar and Jules B. Lipoff, MD, said in JAMA Dermatology.
These findings, when combined with earlier surveys demonstrating “that the prevalence of indoor tanning had been increasing as late as 2009 [imply] a trend reversal coinciding with the tax’s implementation,” but they do not definitively show causation and should be considered “secondary to the public health objective of deterring indoor tanning,” the investigators wrote.
Mr. Jayakumar reported receiving “enrolled agent” status from the Internal Revenue Service. They did not report any other conflicts.
SOURCE: Jayakumar KL et al. JAMA Dermatol. 2018 Apr 11. doi: 10.1001/jamadermatol.2018.0161.
FROM JAMA DERMATOLOGY
Most physicians support Medicaid work requirements
Almost 75% of physicians support the new federal policy that permits states to attach work requirements to Medicaid participation, according to a survey by physician recruitment firm Merritt Hawkins.
Physicians have to limit the number of Medicaid patients they treat for that reason and want to focus on those who need care the most,” Travis Singleton, executive vice president of Merritt Hawkins, said in a statement.
Kentucky, Indiana, and Arkansas currently are in the process of putting the work requirements into place. Kentucky’s policy will require able-bodied Medicaid applicants aged 19-64 years to do 80 hours of community engagement a month by working, going to school, training for a job, or volunteering, the company said.
The survey, which was conducted by email in early March, had a margin of error of less than 1%.
Asthma flourishing in its medical home
according to the Centers for Disease Control and Prevention.
Current asthma prevalence was 8.8% for adults aged 18 years and older who worked in health care and social assistance in 2011-2016, which put them above those in education services (8.2%); arts, entertainment, and recreation (8.1%); accommodation and food services (7.7%); and finance and insurance (7.5%). The overall rate for all working adults was 6.8%, Jacek M. Mazurek, MD, PhD, and Girija Syamlal, MBBS, reported in the Morbidity and Mortality Weekly Report.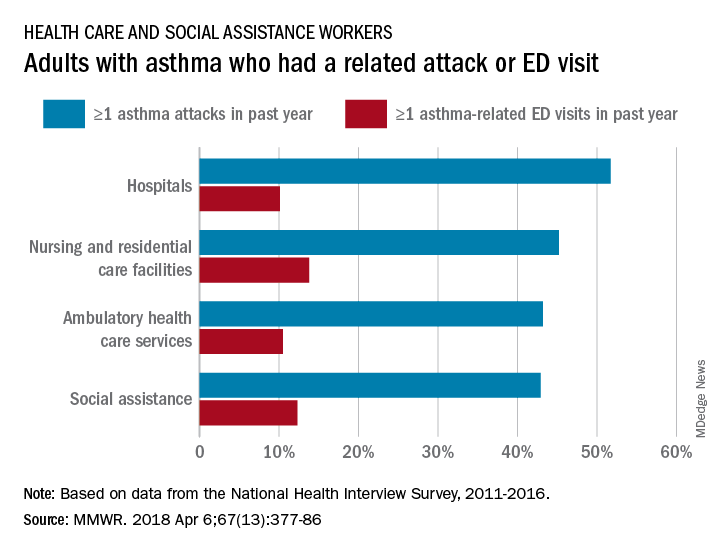
Among persons with asthma who were employed in health care and social assistance, 45.8% reported having at least one asthma attack in the previous year. Among the subgroups of the industry, those working in hospitals were highest with a 51.7% rate of past-year asthma attacks, followed by those working in nursing and residential care facilities at 45.2%, those working in ambulatory health care services at 43.2%, and those working in social assistance at 42.9%. The highest asthma attack rates among all industries were 57.3% for wood product manufacturing and 56.7% for plastics and rubber products manufacturing, the investigators said, based on data from the National Health Interview Survey.
Asthma-related visits to the emergency department in the past year were much less common for those in health care – 11.3% overall – and followed a pattern different from asthma attacks. Those working in nursing and residential care facilities were highest at 13.8%, with those in social assistance at 12.3%, those in ambulatory care at 10.5%, and those in hospitals the lowest at 10.1%. The highest ED-visit rate for any industry, 22.9%, was for workers in private households, said Dr. Mazurek and Dr. Syamlal, both of the respiratory health division at the CDC’s National Institute for Occupational Safety and Health in Morgantown, W.Va.
SOURCE: Mazurek JM, Syamlal G. MMWR. 2018 Apr 6;67(13):377-86.
FROM MMWR
Health IT ‘under-users’ outnumber ‘super-users’
Almost 27% of medical practices are “super-users” of health information technology, but another 39% are “under-users” that may be affecting “the ability of the health system as a whole to provide coordinated and efficient care,” investigators said in the American Journal of Managed Care.
To put it another way, wrote Juliet Rumball-Smith, MBChB, PhD, and her associates, who analyzed data for 30,123 practices from the 2014 Healthcare Information and Management Systems Society (HIMSS) Analytics ambulatory practice survey.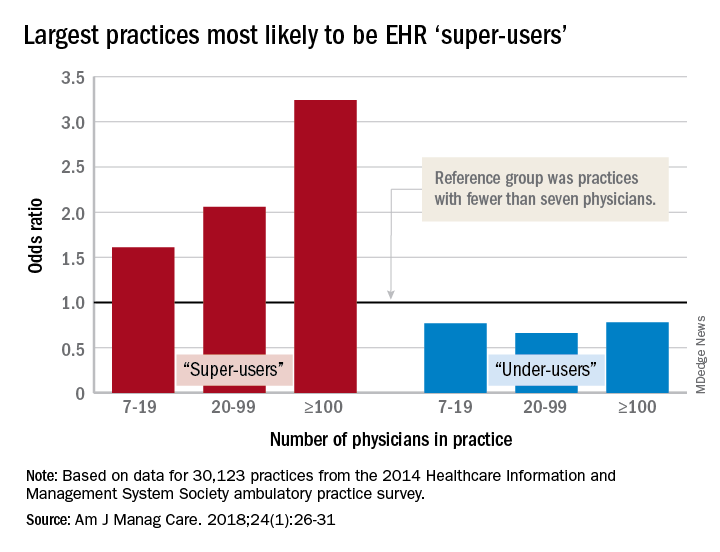
After all the scores were calculated, 8,003 practices (27%) were classified as super-users and 11,706 (39%) as under-users. More specific analysis showed that the smallest practices were least likely to be super-users, and that the likelihood rose with increasing practice size. With practices of fewer than seven physicians as the reference group, odds ratios of being a super-user were 1.61 for practices of 7-19 physicians, 2.06 for those with 20-99 physicians, and 3.24 for those of 100 or more associated physicians, reported Dr. Rumball-Smith and her associates at Rand Health in Santa Monica, Calif.
The situation was not as clear-cut among the technology avoiders, as the odds ratios made practices of 20-99 physicians less likely (0.66) than those of 7-19 (0.77) and 100 or more (0.78) physicians to be under-users, they said.
The super-users also were more likely to located in metropolitan areas (OR, 2.45, compared with rural practices) and in the Midwest (OR, 2.05, compared with the Northeast) or the South (OR, 1.32) and to be primary care/family medicine clinics, which were the reference group for the practice-type comparison (OR, 0.89, for single- or multiple-specialty; 0.64, for specialist services or urgent care), the investigators said.
“It is important that policy makers and health care providers understand the limits of health IT functionality in ambulatory care practices, as strategies aimed at improving the coordination of care or those relying on the EHR as a vehicle for intervention may be hindered by the technological capacity of ambulatory care partners,” they wrote.
The study was funded by the Commonwealth Fund, Rand, and the Agency for Healthcare Research and Quality. The investigators said that they had no conflicts of interest.
SOURCE: Rumball-Smith J et al. Am J Manag Care. 2018;24(1):26-31.
FROM AMERICAN JOURNAL OF MANAGED CARE
Key clinical point: Many medical practices are not prepared to take advantage of EHR-based initiatives.
Major finding: 73% of ambulatory practices are not using EHRs “to their full benefit.”
Study details: HIMSS Analytics 2014 ambulatory practice survey for 30,123 practices.
Disclosures: The study was funded by the Commonwealth Fund, Rand, and the Agency for Healthcare Research and Quality. The investigators said that they had no conflicts of interest.
Source: Rumball-Smith J et al. Am J Manag Care. 2018;24(1):26-31.
Open enrollment 2018: Plan selections down slightly
the Centers for Medicare & Medicaid Services reported.
That’s a drop of 3.3%, compared with the 12.2 million enrollees for 2017, and a drop of 7.1% from the peak year of 2016, according to the 2018 open enrollment final report.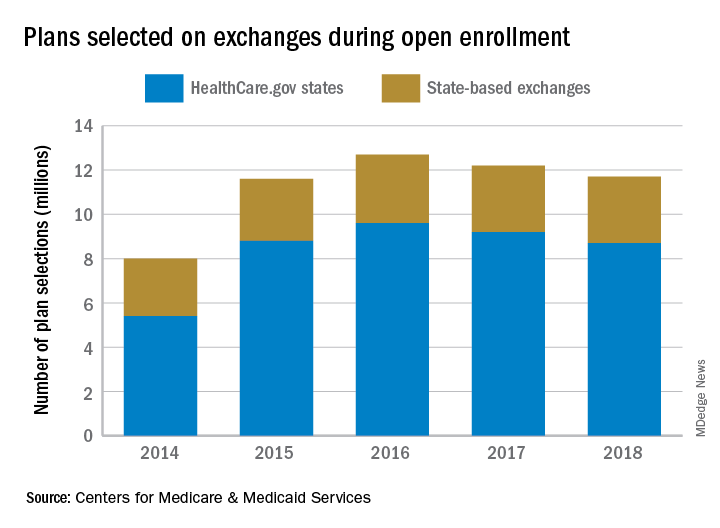
For 2018, the average premium before application of the premium tax credit was $621 in the HealthCare.gov states, which is an increase of 30% from the $476 average for 2017. After the tax credit, the average premium for 2018 was $153.
“Our primary goal this year was to ensure that Americans who wanted coverage through the exchange had a seamless experience,” CMS Administrator Seema Verma said in a statement. “We are pleased that consumer satisfaction was the highest it’s ever been during the 2018 open enrollment period.”
Lower heart disease mortality brings increased disparity
The overall death rate from heart disease is down 68% since 1968 in the United States, but the disparity between blacks and whites has increased over that time, according to the Centers for Disease Control and Prevention.
Overall, heart disease mortality for adults aged 35 years and older went from 1,035 per 100,000 population in 1968 to 327 per 100,000 in 2015, a drop of 68%. For whites, the story was very similar: The death rate dropped from 1,032 to 326, or 68%. For blacks, who had a higher death rate to begin with, at 1,072 per 100,000, the drop was 63% to 396 per 100,000, Miriam Van Dyke, MPH, of Emory University, Atlanta, and her associates reported in MMWR Surveillance Summaries.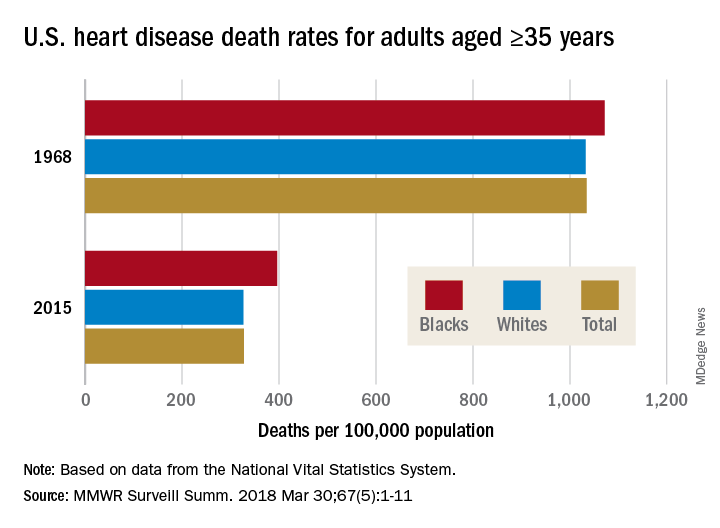
Disparities can be seen at the state level as well. For blacks aged 35 years and older, heart disease death rates ranged from 200 per 100,000 in Oregon to 516 per 100,000 in Arkansas in 2015. For whites in that age group, the death rate was lowest in the District of Columbia (198 per 100,000) and highest in Oklahoma (446 per 100,000), Ms. Van Dyke and her associates wrote.
To help them pinpoint differences by race within geographic areas, the investigators calculated ratios of black to white heart disease death rates. In 1968, the state with the highest ratio, or the largest excess of black mortality, was Rhode Island at 1.38, and the state with the lowest ratio, meaning the largest excess of white mortality, was Minnesota at 0.64. There were 27 states that year with a ratio over 1.0, 12 states with a ratio below 1.0, 1 state with a ratio of 1.0 (Wisconsin), and 11 states that did not have a black population large enough to make a reliable estimate, they said.
In 2015, the jurisdiction with the largest excess of black mortality was D.C., with a ratio of 2.42; the state with the lowest ratio was Rhode Island, at 0.69. That year, there were 34 states with a ratio over 1.0, 6 states with a ratio below 1.0, and 11 states – the same 11 as in 1968 – with black populations too small to reliably estimate death rates, the investigators noted.
“The elimination of racial disparities in heart disease death rates, along with continued decreases in heart disease death rates for all persons in the United States, is important for the overall state of health. The trends in black-white disparities in heart disease death rates … highlight the importance of continued surveillance of these trends at the national and state level,” the investigators wrote.
SOURCE: Van Dyke M et al. MMWR Surveill Summ. 2018 Mar 30;67(5):1-11.
FROM MMWR SURVEILLANCE SUMMARIES
Patients who hide. Patients who seek.
Some people are more likely to seek medical care, and some people are less likely, but which type is more common? The results of a survey of over 14,000 Medicare beneficiaries suggest that the avoid-care type may be a bit more prevalent.
In the survey, 40% of respondents said that they were more likely to keep it to themselves when they got sick, but 36% visit a physician as soon as they feel bad. Almost 29% reported that they avoid going to a physician, but 25% worry about their own health more than others, the Centers for Medicare & Medicaid Services reported based on the results of the 2015 Medicare Current Beneficiary Survey.
Race and ethnicity made a big difference for some questions: 59% of Hispanics said that they visit a doctor as soon as they feel bad, compared with 44% of non-Hispanic blacks and 31% of non-Hispanic whites. That same order was seen for “worry about your health more than others” – 54% Hispanic, 38% black, and 19% white – and for “avoid going to the doctor” – 44% Hispanic, 34% black, and 26% white, the CMS reported.
The three groups, which were the only race/ethnicities included in the report, were all around 40% for “when sick, keep it to yourself,” while two of the three were the same for “had a problem and did not seek a doctor” (blacks and Hispanics at 14% and whites at 10%) and for “ever had a prescription you did not fill” (whites and Hispanics at 7% and blacks at 10%), the report said.
The estimates on propensity to seek care did not include Medicare recipients who lived part or all of the year in a long-term care facility, which was about 4% of the Medicare population in 2015. The survey included a total of 14,068 respondents.
Obesity in adults continues to rise
according to data from the National Health and Nutrition Examination Survey.
The age-standardized prevalence of obesity – defined as a body mass index of 30 or more – among adults aged 20 years and over increased from 33.7% for the 2-year period of 2007-2008 to 39.6% in 2015-2016, while the prevalence of severe obesity – defined as a body mass index of 40 kg/m2 or more – went from 5.7% to 7.7% over that same period, Craig M. Hales, MD, and his associates at the Centers for Disease Control and Prevention in Hyattsville, Md., and Atlanta said in a research letter published in JAMA.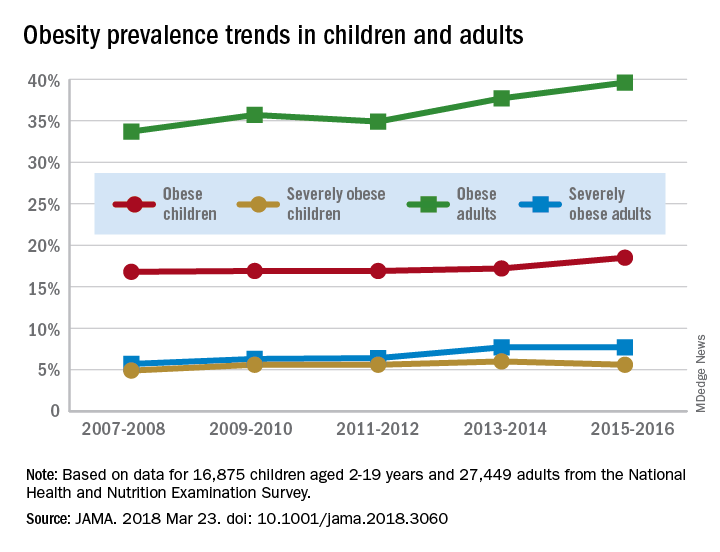
For the most recent reporting period, boys were more likely than girls to be obese (19.1% vs. 17.8%) and severely obese (6.3% vs. 4.9%), and both obesity and severe obesity were more common with increasing age. Obesity prevalence went from 13.9% in those aged 2-5 years to 20.6% in 12- to 19-year-olds, and severe obesity was 1.8% in the youngest group and 7.7% in the oldest, with the middle-age group (6-11 years) in the middle in both categories, they said
Among the adults, obesity was more common in women than men (41.1% vs. 37.9%) for 2015-2016, as was severe obesity (9.7% vs. 5.6%). Obesity and severe obesity were both highest in those aged 40-59 years, but obesity prevalence was lowest in the younger group (20-39 years) and severe obesity was least common in the older group (60 years and older), Dr. Hales and his associates said.
The analysis involved 16,875 children and 27,449 adults over the 10-year period. The investigators did not report any conflicts of interest.
AGA patient education materials can help your patients better understand how to manage and discuss obesity, including lifestyle, pharmacological and endoscopic treatment options. Learn more at www.gastro.org/patientInfo/topic/obesity.
SOURCE: Hales CM et al. JAMA 2018 Mar 23. doi: 10.1001/jama.2018.3060.
FROM JAMA