User login
Richard Franki is the associate editor who writes and creates graphs. He started with the company in 1987, when it was known as the International Medical News Group. In his years as a journalist, Richard has worked for Cap Cities/ABC, Disney, Harcourt, Elsevier, Quadrant, Frontline, and Internet Brands. In the 1990s, he was a contributor to the ill-fated Indications column, predecessor of Livin' on the MDedge.
Zika topped Lyme in 2016
Ticks are the arthropod ride of choice for vector-borne diseases in the United States, but the Zika virus and its mosquito minions gave the ticks and their bacterial passengers a run for their money in 2016, according to the Centers for Disease Control and Prevention.
There were 41,680 cases of Zika virus that year, more than any other vector-borne disease, including Lyme disease, which had been the most common transmissible pathogen going back to at least 2004, when arthropod-borne viral diseases became nationally notifiable, said Ronald Rosenberg, ScD, and his associates at the CDC’s National Center for Emerging and Zoonotic Infectious Diseases in Fort Collins, Colo.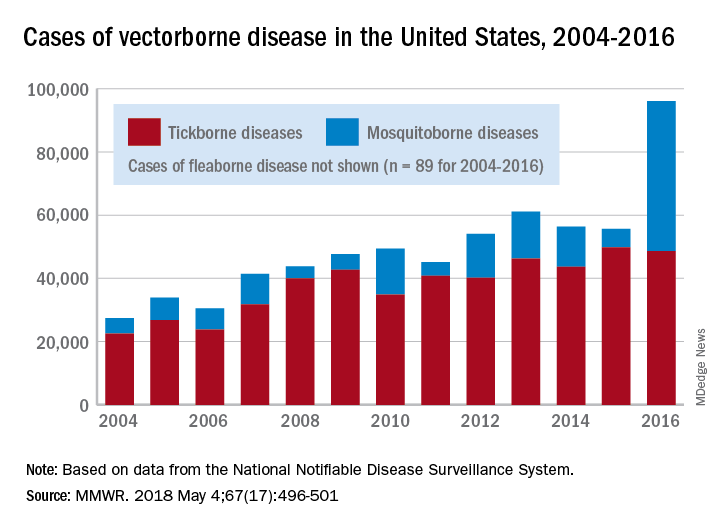
Since 2004, there have been 643,000 reported cases of vector-borne disease in the United States: 492,000 cases of tick-borne disease, of which over 402,000 were Lyme disease; 151,000 cases of mosquito-borne disease; and 89 cases of plague carried by the third type of vector, fleas, Dr. Rosenberg and his associates said based on data from the National Notifiable Disease Surveillance System.
In 2004, there were 22,527 cases of tick-borne disease and 4,858 cases of mosquito-borne disease, and the increases since then reflect the dynamics of the pathogens and vectors involved. Growth of tick-borne disease has been gradual: “Tick-borne pathogens rarely cause sudden epidemics because humans are typically incidental hosts who do not transmit further, and tick mobility is mostly limited to that of its animal hosts,” the researchers explained.
The number of mosquito-borne disease cases, on the other hand, varies considerably from year to year: There were 5,800 cases in 2015, almost 15,000 in 2013, and only 4,400 in 2011. Unlike ticks, which may feed on blood only once in a year, the more mobile mosquitoes feed every 48-72 hours and transmit their pathogens “directly between humans … resulting in explosive epidemics,” the investigators wrote.
SOURCE: Rosenberg R et al. MMWR 2018 May 4;67(17):496-501.
FROM MMWR
Female physicians face enduring wage gap
Male physicians make more money than female physicians, and that seems to be a rule with few exceptions. Among the 50 largest metro areas, there were none where women earn as much as men, according to a new survey by the medical social network Doximity.
The metro area that comes the closest is Las Vegas, where female physicians earned 20% less – that works out to $73,654 – than their male counterparts in 2017. Rochester, N.Y., had the smallest gap in terms of dollars ($68,758) and the second-smallest percent difference (21%), Doximity said in its 2018 Physician Compensation Report.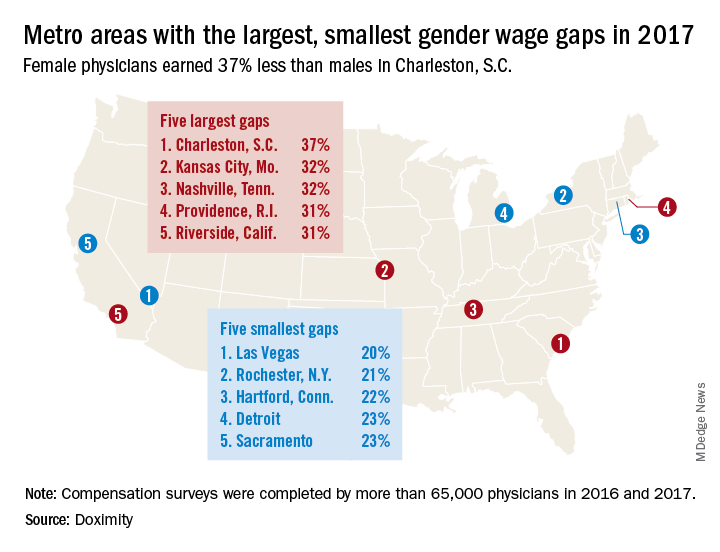
The largest wage gap on both measures can be found in Charleston, S.C., where women earned 37%, or $134,499, less than men in 2017. The other members of the largest-wage-gap club are as follows: Kansas City, Mo., and Nashville, Tenn., both had differences of 32%, and Providence, R.I., and Riverside, Calif., had differences of 31%, Doximity said in the report, which was based on data from “compensation surveys completed in 2016 and 2017 by more than 65,000 full-time, licensed U.S. physicians who practice at least 40 hours per week.”
A quick look at the 2016 data shows that the wage gap between female and male physicians increased from 26.5% to 27.7% in 2017, going from more than $92,000 to $105,000. “Medicine is a highly trained field, and as such, one might expect the gender wage gap to be less prominent here than in other industries. However, the gap endures, despite the level of education required to practice medicine and market forces suggesting that this gap should shrink,” Doximity said.
In a recent issue of AGA Perspectives, Ellen M. Zimmermann, MD, AGAF, chair of the AGA Women’s Committee, wrote about the need for transparent policies at institutions to help close the gender gap. Read more at http://ow.ly/43If30jTlEc.
Interventionalists skeptical about public reporting of PCI
Many interventional cardiologists believe that public reporting of percutaneous coronary intervention (PCI) outcomes leads to avoidance of high-risk procedures and “purposeful upcoding of comorbidities by colleagues,” according to a survey of 149 interventionalists.
Almost 60% of respondents said that they were sometimes or often pressured by other physicians to not perform PCI on patients considered to be at high risk of death, and 95% believed that other interventionalists in their state – the survey was conducted in New York and Massachusetts – would sometimes or often avoid PCI because of “concern that a bad outcome would negatively impact their own or their facility’s publicly reported outcomes,” Daniel M. Blumenthal, MD, MBA, of Massachusetts General Hospital, Boston, and his associates said in an article published online May 9 in JAMA Cardiology.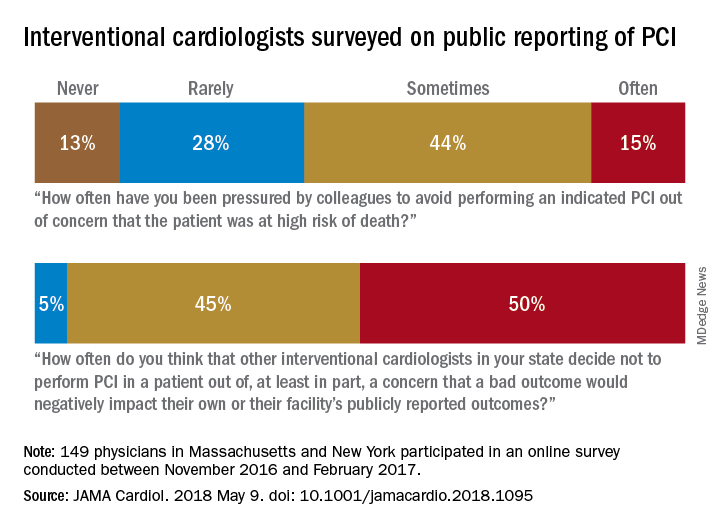
Almost two-thirds of participants said that they had avoided performing PCIs at least twice because they were worried about reporting a negative outcome, which “suggests that PCI avoidance is not concentrated among a few risk-averse interventionalists,” Dr. Blumenthal and his associates wrote.
Their study was supported by an unrestricted research grant from Abiomed to the Smith Center for Outcomes Research in Cardiology at Beth Israel Deaconess Medical Center. Dr. Blumenthal reported consulting fees and/or funding for unrelated work from Devoted Health, Novartis Pharmaceuticals, HLM Venture Partners, and Precision Health Economics.
SOURCE: Blumenthal DM et al. JAMA Cardiol. 2018 May 9. doi: 10.1001/jamacardio.2018.1095.
FROM JAMA CARDIOLOGY
Uninsured rate on the rise
The uninsured rate among Americans aged 19-64 years, which was 12.7% in early 2016, has climbed to 15.5%, according to a survey by the Commonwealth Fund.
Medicaid expansion has had a significant effect on that increase. The uninsured rate among working-age adults living in states that did not expand their Medicaid programs has gone from 16.1% in 2016 to 21.9% in 2018, while the rate in states that did expand Medicaid rose from 10.4% to 11.4% over that same time, Commonwealth Fund researchers said in reporting the results of their latest (Feb. 6, 2018, to March 30, 2018) Affordable Care Act Tracking Survey.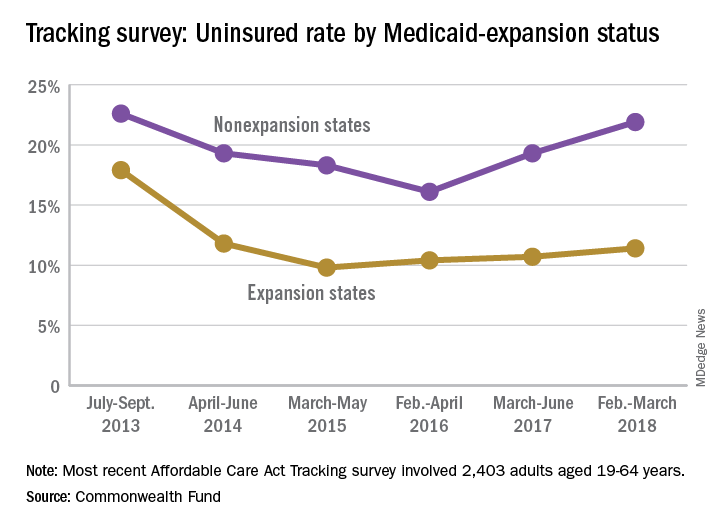
A similar increase/decrease since 2016 was experienced by respondents who identified as Democrats: The rate for the group went from 9.9% in 2016 to 10.4% in 2017 and then dropped to 9.1% in 2018. Those identifying as Republicans started with a lower rate of 7.9% in 2016 but have since seen it rise to 9.9% in 2017 and 13.9% in 2018, results from the survey of 2,403 adults showed.
“In the absence of bipartisan support for federal action [on the ACA], legislative activity has shifted to the states. Eight states have received, or are currently applying for, federal approval to establish reinsurance programs in their states,” the investigators wrote, but “leaving policy innovation to states will ultimately lead to a patchwork quilt of coverage and access to health care across the country, a dynamic that will fuel inequity in overall health, productivity, and well-being.”
Five-year survival for non-Hodgkin lymphoma tops 71%
The overall 5-year survival rate for non-Hodgkin lymphoma (NHL) is 71.4%, according to the National Cancer Institute.
That number falls neatly into the middle of the range for survival by stage at diagnosis, with stage I (81.8%) and stage II (75.3%) disease on the high side and stage III (69.1%) and stage IV (61.7%) on the low side, the most recent data from the Surveillance, Epidemiology, and End Results (SEER) Program show. Five-year survival for NHL of unknown stage at diagnosis is 76.4%.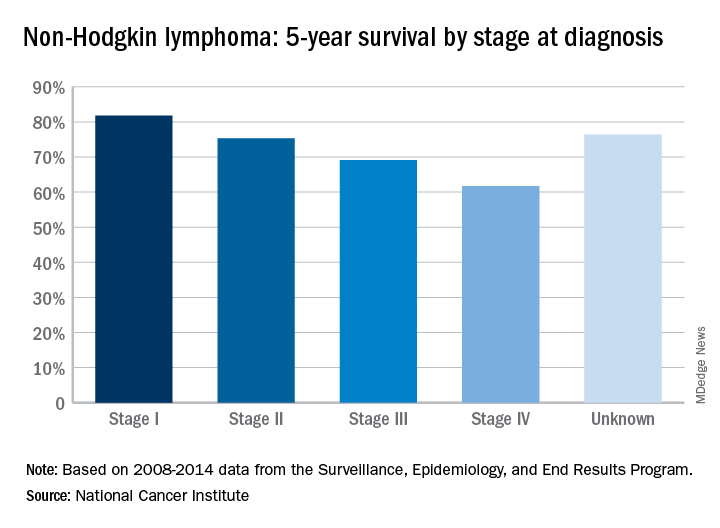
Female physicians face enduring wage gap
Male physicians make more money than female physicians, and that seems to be a rule with few exceptions. Among the 50 largest metro areas, there were none where women earn as much as men, according to a new survey by the medical social network Doximity.
The metro area that comes the closest is Las Vegas, where female physicians earned 20% less – that works out to $73,654 – than their male counterparts in 2017. Rochester, N.Y., had the smallest gap in terms of dollars ($68,758) and the second-smallest percent difference (21%), Doximity said in its 2018 Physician Compensation Report.
A quick look at the 2016 data shows that the wage gap between female and male physicians increased from 26.5% to 27.7% in 2017, going from more than $92,000 to $105,000. “Medicine is a highly trained field, and as such, one might expect the gender wage gap to be less prominent here than in other industries. However, the gap endures, despite the level of education required to practice medicine and market forces suggesting that this gap should shrink,” Doximity said.
Lupus is quietly killing young women
according to researchers at the University of California, Los Angeles.
SLE was either the underlying or a contributing cause of death for 28,411 females from 2000 to 2015, when it was one of the 20 most common causes of death among females aged 5-64 years in the United States, based on an analysis of the Centers for Disease Control and Prevention’s Wide-ranging Online Data for Epidemiologic Research multiple cause-of-death database, the researchers said.
SLE was the 10th-leading cause of death in the 15- to 24-year age group (1,226 deaths), the 14th-leading cause among women aged 25-34 (2,431 deaths) and 35-44 (3,646 deaths), and the 16th-leading cause in those aged 45-54 (5,271 deaths), Eric Y. Yen, MD, and Ram R. Singh, MD, reported in Arthritis & Rheumatology.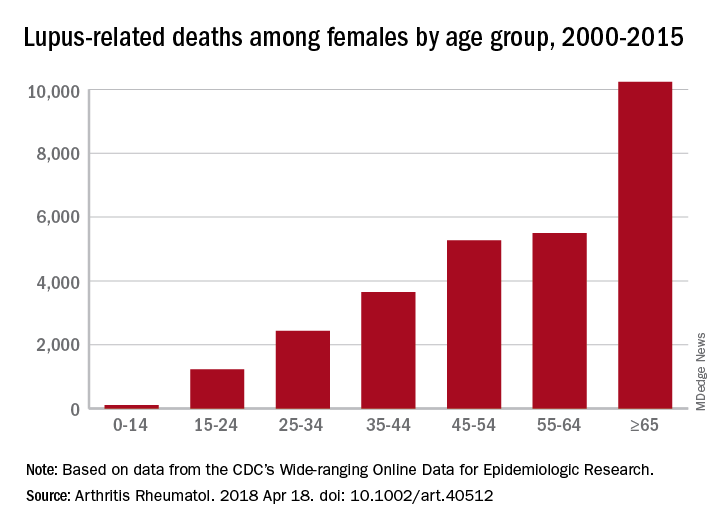
The numbers for SLE could be higher, though, since it is underreported on death certificates – by as much as 40% in one study – and other causes may be overreported. “Patients with SLE die prematurely of complications such as cardiovascular events, infections, renal failure, and respiratory diseases [and] these proximate causes of death may be perceived to be unrelated to SLE, when in fact the disease or the medications used for it predispose to them,” the investigators said.
Dr. Yen was supported by the National Institutes of Health and UCLA Children’s Discovery and Innovation Institute. Dr. Singh was supported by the NIH, the Lupus Foundation of America, and the Rheumatology Research Foundation.
SOURCE: Yen EY and Singh RR. Arthritis Rheumatol. 2018 Apr 18. doi: 10.1002/art.40512.
FROM ARTHRITIS & RHEUMATOLOGY
Suicide on the minds of many Utah teens
according to the Centers for Disease Control and Prevention.
Prevalence of suicidal ideation in 2015 was significantly higher among female students (25.5% vs. 13.7% for males), nonwhite students (23.4% vs. 18.7% for whites), those who were less religious (27.4% vs. 16.1% for religious students), and nonmembers of the Church of Latter Day Saints (27.1% vs. 15.3% for Mormons), Marissa L. Zwald, PhD, of the CDC’s Epidemic Intelligence Service and her associates reported in the Morbidity and Mortality Weekly Report.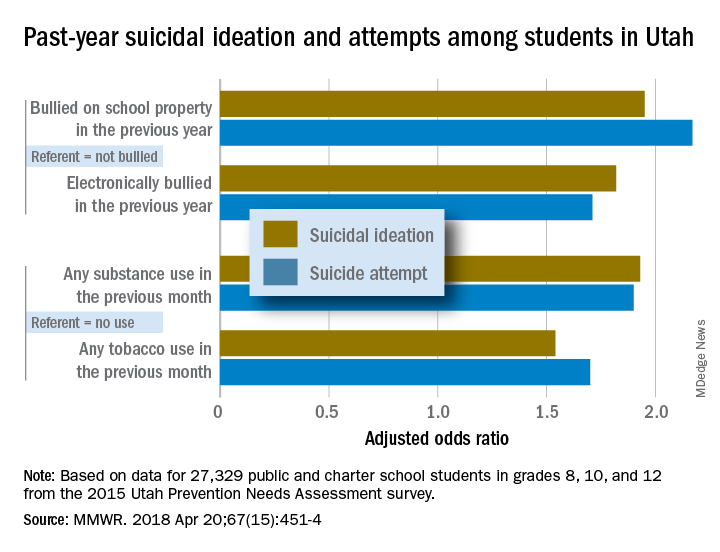
Risk factors included being bullied on school property in the previous year (adjusted odds ratios 1.95 for suicidal ideation and 2.17 for a suicide attempt, compared with those who were not bullied) and being electronically bullied (AOR of 1.82 for suicidal ideation and 1.71 for suicide attempt). Students who reported illicit substance use in the past month were more likely than nonusers to have suicidal ideation (AOR, 1.93) and to make a suicide attempt (AOR, 1.9); past-month use of tobacco, including e-cigarettes, increased risk, compared with no use, with an adjusted odds ratios of 1.54 for suicidal ideation and 1.7 for an attempt, the investigators reported.
They also looked at a number of possible protective factors, with a supportive family environment showing significance for both suicidal ideation and suicide attempts; the same was not true for prosocial behaviors or supportive community, school, or peer environments. “Possible prevention strategies to consider could include integrating family members and the home setting into existing or new interventions and identifying and addressing the needs of youths exhibiting risk factors identified in this investigation,” Dr. Zwald and her associates wrote.
SOURCE: Zwald ML et al. MMWR. 2018 Apr 20;67(15):451-4.
FROM MMWR
New rankings focus on child health care
a personal finance website.
The District of Columbia joined the party and finished second to Vermont, which pushed Nevada down to 51st place, according to WalletHub’s “Best & Worst States for Children’s Health Care” for 2018.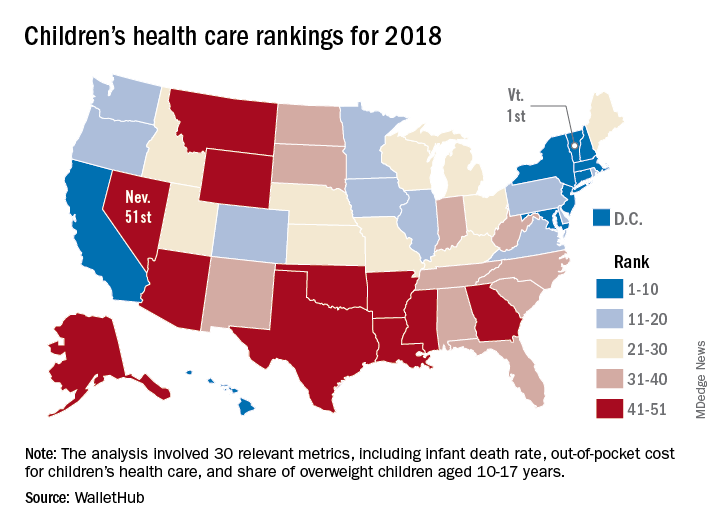
Louisiana’s 50th-ranked health system was just ahead of Nevada’s, and those two were below Texas in 49th, Mississippi in 48th, Arkansas in 47th, and Montana in 46th. The top five had a strong New England flavor (think maple syrup and cranberries), with Vermont joined by Massachusetts in third and Connecticut in fourth, followed by New England’s neighbor New York in fifth, the report showed.
The analysis involved a 100-point system covering three broad areas of health care: health and access to health care (55 points); nutrition, physical activity, and obesity (40 points); and oral health (5 points). Those categories were divided into a total of 30 relevant metrics, including the share of children aged 0-17 years who were in excellent to very good health, pediatricians and family physicians per capita, share of obese children aged 10-17 years, and share of children aged 1-17 years with excellent or very good teeth.
Vermont’s strong showing in WalletHub’s metric system was driven by first-place finishes in lowest infant death rate, pediatricians and family physicians per capita, and percentage of children with recent medical and dental checkups, along with being in third place for percentage of uninsured children and for percentage of overweight children. D.C. had the lowest percentage of children with unaffordable medical bills, and Massachusetts had the lowest percentage of uninsured children, according to data collected by WalletHub from such sources as the U.S. Census Bureau, the Council for Community and Economic research, and the Trust for America’s Health.
“Parents should be supported to learn about and be active in [their] children’s development. … Since our safety net is anemic and our idea of health is about lack of symptoms, this answer challenges us to think more critically about our living conditions and those of our children,” Michael Montoya, PhD, associate professor emeritus in the departments of anthropology, public health, and the program in medical education for the Latino community at the University of California, Irvine, said in the report.
Another respondent to the report, Christina M. Dalton, PhD, of the department of economics at Wake Forest University, Winston-Salem, N.C., said, “Children’s health coverage has important potential to improve health and economic outcomes in the future since early good health enables children to learn better in school. However, any expansion of public options needs to take into account the idea that public insurance can end up taking enrollees away from the private market. … It’s always a trade-off of increasing coverage while not attracting too many of the enrollees that would have already bought insurance without government funding.”
Surgeries account for almost half of hospital costs
according to the Agency for Healthcare Research and Quality (AHRQ).
Of the 35.4 million inpatient stays in 2014 – the last full year of ICD-9-CM coding – 10.1 million (28.6%) involved at least one any-listed surgical procedure, and 25.2 million (71.4%) did not. The total cost of all admissions was $386.2 billion, of which $187.1 billion (48.4%) went for stays with surgeries and $199.1 billion (51.6%) went for nonsurgical stays, the AHRQ reported in a statistical brief.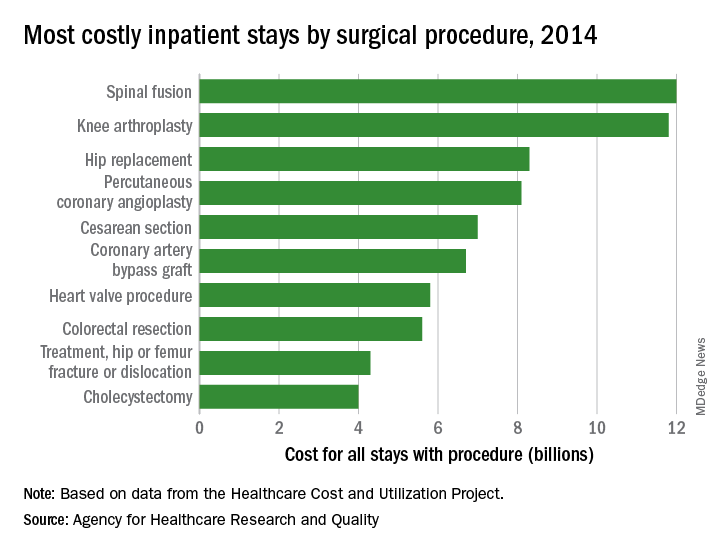
There were five other musculoskeletal procedures among the 20 most costly surgery-related admissions: knee arthroplasty was second at $11.8 billion, hip replacement was third at $8.3 billion, treatment of hip and femur fracture/dislocation was ninth at $4.3 billion, amputation of lower extremity was 13th at $2.5 billion, and treatment of lower extremity (other than hip or femur) fracture/dislocation was 14th at $2.4 billion. Those six procedures combined were $41.2 billion in hospital costs, which was a quarter of the total for all stays with a first-listed OR procedure, the AHRQ said.
The nonmusculoskeletal procedures in the top five were percutaneous coronary angioplasty in fourth, with an aggregate cost of $8.1 billion, and cesarean section in fifth at an even $7 billion. Coronary artery bypass graft, the most expensive procedure per stay ($52,000) among the top 20 procedures, was sixth in aggregate cost at $6.7 billion, according to the AHRQ researchers.