User login
Richard Franki is the associate editor who writes and creates graphs. He started with the company in 1987, when it was known as the International Medical News Group. In his years as a journalist, Richard has worked for Cap Cities/ABC, Disney, Harcourt, Elsevier, Quadrant, Frontline, and Internet Brands. In the 1990s, he was a contributor to the ill-fated Indications column, predecessor of Livin' on the MDedge.
Youth tobacco use shows ‘promising declines’
according to the Centers for Disease Control and Prevention.
The prevalence of current tobacco use – defined as use on 1 or more days in the past 30 days – among high schoolers fell from 24.2% in 2011 to 19.6% in 2017, and middle school use decreased from 7.5% to 5.6% over that same time. That means the number of youth tobacco users went from almost 4.6 million in 2011 to slightly more than 3.6 million in 2017, Teresa W. Wang, PhD, and her associates said in the Morbidity and Mortality Weekly Report.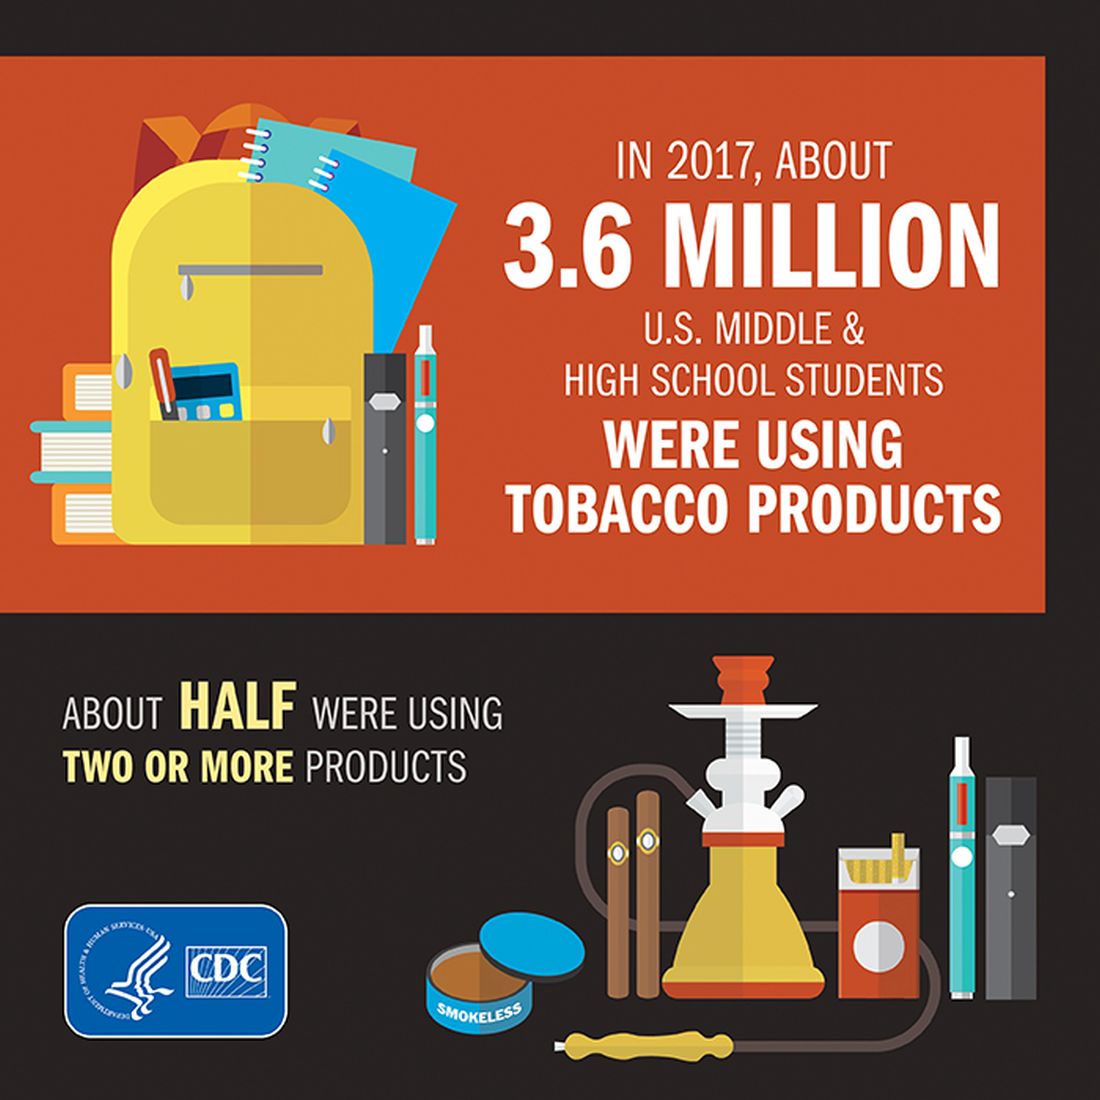
Almost half (47%) of the high school students who used tobacco in 2017 used two or more products, as did two out of five (42%) middle schoolers. That year, black high school students were less likely to use any tobacco product (14.2%) than were whites (22.7%) and Hispanics (16.7%). E-cigarettes were the most popular form of tobacco among white and Hispanic high schoolers, while cigars were the most commonly used form among blacks, they reported based on data from the National Youth Tobacco Surveys, which had sample sizes of 18,766 in 2011 and 17,872 in 2017.
“Despite promising declines in tobacco use, far too many young people continue to use tobacco products, including e-cigarettes,” CDC Director Robert R. Redfield, MD, said in a written statement accompanying the report. “Comprehensive, sustained strategies can help prevent and reduce tobacco use and protect our nation’s youth from this preventable health risk.”
In a separate statement, FDA Commissioner Scott Gottlieb, MD, said, “We are working hard to develop a pathway to put products like e-cigarettes through an appropriate series of regulatory gates to properly evaluate them as an alternative for adults who still want to get access to satisfying levels of nicotine, without all the risks associated with lighting tobacco on fire. And we will continue to encourage the development of potentially less harmful forms of nicotine delivery for currently addicted adult smokers. … But these public health opportunities are put at risk if all we do is hook another generation of kids on nicotine and tobacco products through alternatives like e-cigarettes.”
SOURCE: Wang TW et al. MMWR. 2018;67(22):629-33.
FROM MMWR
Diabetes places burden on patients
according to a new survey by prescription manager UpWell Health.
The time spent on activities that come with diabetes management – blood glucose monitoring, diet planning, medical appointments – can add up to several hours a week. Among the 5,255 respondents to the online survey, 18% said that such tasks took up 5-10 hours each week, 7% said it was 10-15 hours, and 9% said they spent 15 or more hours a week on diabetes-related tasks, UpWell reported.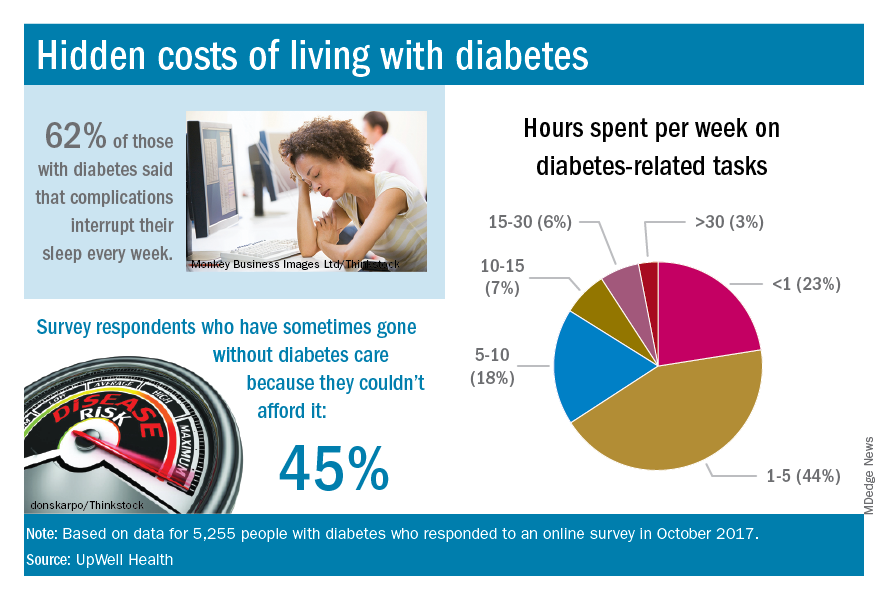
Since medical expenses aren’t always fully covered by insurance, 43% of respondents paid up to $1,000 a year out of pocket to treat diabetes complications, 16% paid $1,000 to $2,000 a year, and 4% paid more than $5,000. Five percent also paid over $5,000 a year out of pocket for diabetes care from a physician and 45% said that they had sometimes gone without diabetes care because they couldn’t afford it, the survey data showed.
“Most people with diabetes are able to manage it successfully and live active, satisfying lives. But doing so requires constant planning, vigilance, and care. They eagerly seek trustworthy resources to help them reduce the burden of living with diabetes,” UpWell said.
Marijuana’s perceived approval ratings on the rise
Parents’ disapproval of marijuana use has dropped since 1979 – at least that’s what their teenage children say, according to results of the 2017 Monitoring the Future survey.
The approximately 13,500 12th graders involved in the 2017 survey believe that their parents are much less likely to disapprove of marijuana use, compared with the students who responded to the survey during 1976-1979. At that time, 15% of the 12th graders said that their parents would not disapprove of using marijuana once or twice, but by 2017 the number had made a statistically significant rise to 23%, Richard A. Miech, PhD, and his associates said in their report on the 2017 survey.
Perceived approval of occasional marijuana use, which had garnered only an 8% share of respondents in 1976-1979, was up to a significantly higher 17% in 2017, and regular use went from 4% to 13%, said Dr. Miech and his associates, of the University of Michigan Institute for Social Research, Ann Arbor.
Parents’ increased acceptance of marijuana, as perceived by the 12th-grade students, was not matched for other substances. Disapproval for smoking one or more packs of cigarettes a day, for example, climbed from 89% in 1976-1979 to 92% in 2017, while disapproval of weekend binge drinking rose just a bit, going from 85% to 86%, they said.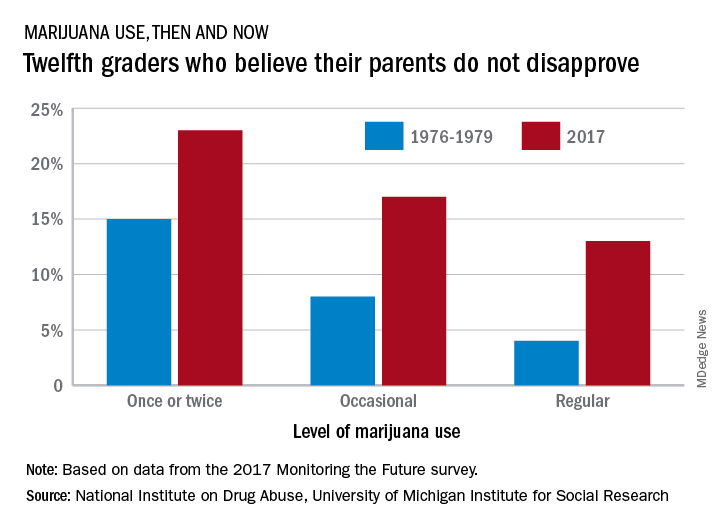
Measures of parental disapproval were reintroduced into the survey in 2017 after being removed in 1979 – the survey began in 1975 – “because students’ responses varied little over time and across drugs,” Dr. Miech and his associates noted. “Today’s parents of 12th graders have more experience with drug use than did parents in the late 1970s [and] population attitudes toward marijuana use across all ages are becoming more lenient,” they wrote.
The 2017 edition of the annual survey, which is funded by the National Institute on Drug Abuse, is based on reports from almost 44,000 students in 8th, 10th, and 12th grade in 360 public and private secondary schools across the country.
AMA: Opioid prescriptions down since 2013
Opioid prescriptions dropped by 22% over the last 5 years, with decreases seen in all 50 states, according to a new report from the American Medical Association’s opioid task force.
“The largest decrease in opioid prescriptions in 25 years reflects the fact that physicians and other health care professionals are increasingly judicious when prescribing opioids,” Patrice A. Harris, MD, chair of the task force, said in the report.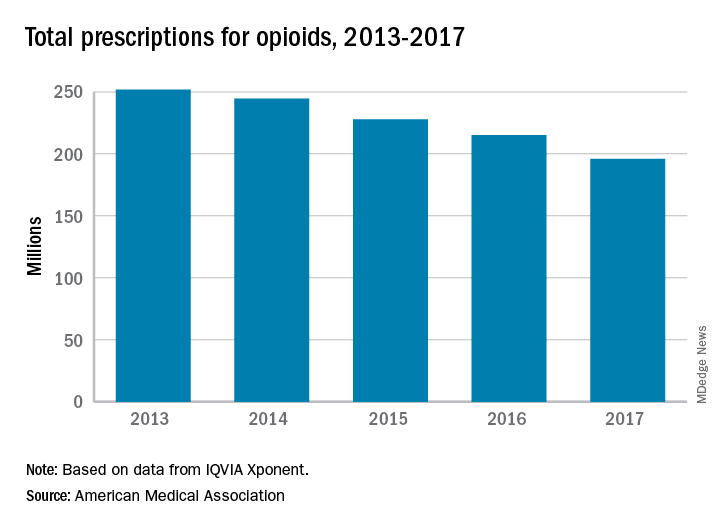
Other signs of progress against the opioid epidemic include the increasing number of health care professionals registered for prescription drug monitoring programs: It has more than tripled, from 472,000 in 2014 to 1.55 million in 2017. Furthermore, the number of naloxone prescriptions in 2017 had more than doubled, from about 3,500 per week to 8,000, the task force reported.
“Unfortunately, deaths related to heroin and illicit fentanyl, and to prescription opioids, continue to rise. We need well-designed initiatives that bring together public and private insurers, policymakers, public health infrastructure, and communities with the shared goal to improve access and coverage for comprehensive pain management and treatment for substance use disorders,” Dr. Harris said.
Cryolipolysis leads surge in body sculpting
during 2012-2017, according to a survey from the American Society for Dermatologic Surgery.
A total of 434,000 body sculpting procedures were performed by ASDS members in 2017, compared with 146,000 in 2012, the ASDS reported based on data from 667 survey respondents, which were generalized to the society’s membership of over 6,400 physicians.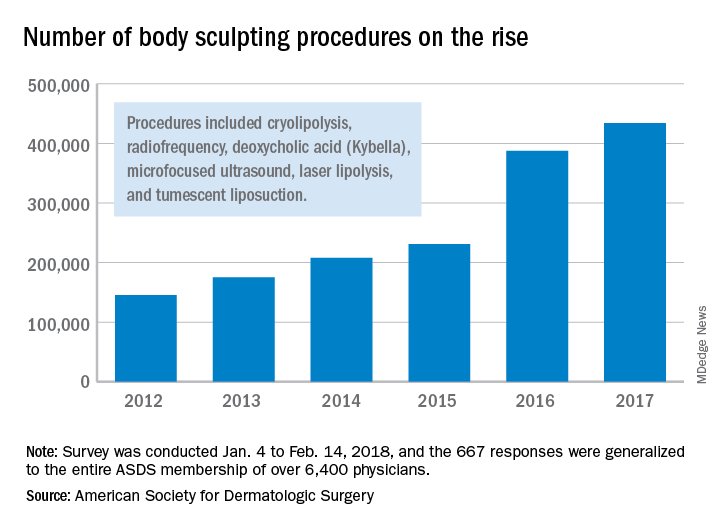
“An increase in media coverage and in celebrities acknowledging their procedures are growing awareness among the general public and improving the comfort level of diverse audiences to explore treatments,” ASDS president Lisa Donofrio, MD, said in a written statement. The survey was conducted from Jan. 4 to Feb. 14, 2018.
Effects of psoriatic arthritis not just physical
conducted by the Harris Poll on behalf of Pfizer.
Over 90% of respondents said that their psoriatic arthritis had negatively impacted their emotional and mental well-being and 75% reported negative effects on their relationships with friends and family, Pfizer reported. Among the 301 adults aged 18 years and older who responded to the survey, 58% had stopped participating in sports or recreational activities and 51% had stopped participating in social activities.
The effects on patients’ professional lives also were considerable: Almost 74% said that it had a negative effect on their career path, 41% had experienced decreased productivity, and 13% had quit or been let go from a job, Pfizer said.
Some of the survey results suggested a disconnect between patients and their physicians. Of the 89% of patients who were very or somewhat satisfied with their prescription medication, 90% said that they would like to make changes to their treatment regimen and 89% described their illness as moderate to severe, Pfizer reported.
The survey was conducted online from Nov. 2 to Dec. 1, 2017.
Multiple myeloma rates rising fastest in East Asia
The global incidence of multiple myeloma rose by 126% from 1990 to 2016, with the largest regional increases occurring in East Asia and tropical Latin America, according to data from the Global Burden of Disease 2016 study.
East Asia (China, North Korea, and Taiwan) saw incident cases of multiple myeloma jump by 262% – up to 1.0 per 100,000 population – from 1990 to 2016, which was the largest increase among any of the 21 global regions; tropical Latin America’s 256% rise took its age-standardized incidence rate to 1.8 per 100,000. Worldwide, incidence of multiple myeloma was 2.1 cases per 100,000 in 2016, Andrew J. Cowan, MD, and his associates reported in JAMA Oncology.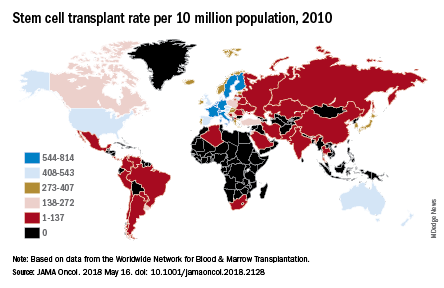
They also looked at treatment availability, with data on stem cell transplants for 2010 coming from the Worldwide Network for Blood & Marrow Transplantation (Lancet Haematol. 2015 Mar;2[3]:e91-100). The countries with the highest rates for all indications that year were Israel (814 per 10 million population), Italy (671), Germany (665), Sweden (625), and the Netherlands (614).
“Some regions of the world lack access to stem cell transplantation entirely, particularly sub-Saharan Africa (with the exception of South Africa),” wrote Dr. Cowan of the University of Washington, Seattle, and his associates.
The approval status of lenalidomide (Revlimid) and bortezomib (Velcade) in 2016 was used as a surrogate for availability of drug treatment: Lenalidomide had been approved in 73 countries out of 195 countries and territories and bortezomib in 103 countries. “On a global level, there are marked discrepancies in the availability of effective therapies. In addition to ensuring universal access to health care … it is imperative to at least ensure access to highly effective medications,” they wrote.
Dr. Cowan reported that he has received research funding from Janssen and AbbVie.
SOURCE: Cowan AJ et al. JAMA Oncol. 2018 May 16. doi: 10.1001/jamaoncol.2018.2128.
FROM JAMA ONCOLOGY
Diabetes spending topped $101 billion in 2013
according to investigators from the University of Washington, Seattle.
The largest share of personal health spending on diabetes in 2013 went for prescribed retail pharmaceuticals, which tallied over $58 billion. That was followed by ambulatory care at $24 billion, inpatient care at just under $10 billion, nursing home care at $9 billion, and emergency department care at $0.4 billion, Ellen Squires and her associates said in Diabetes Care.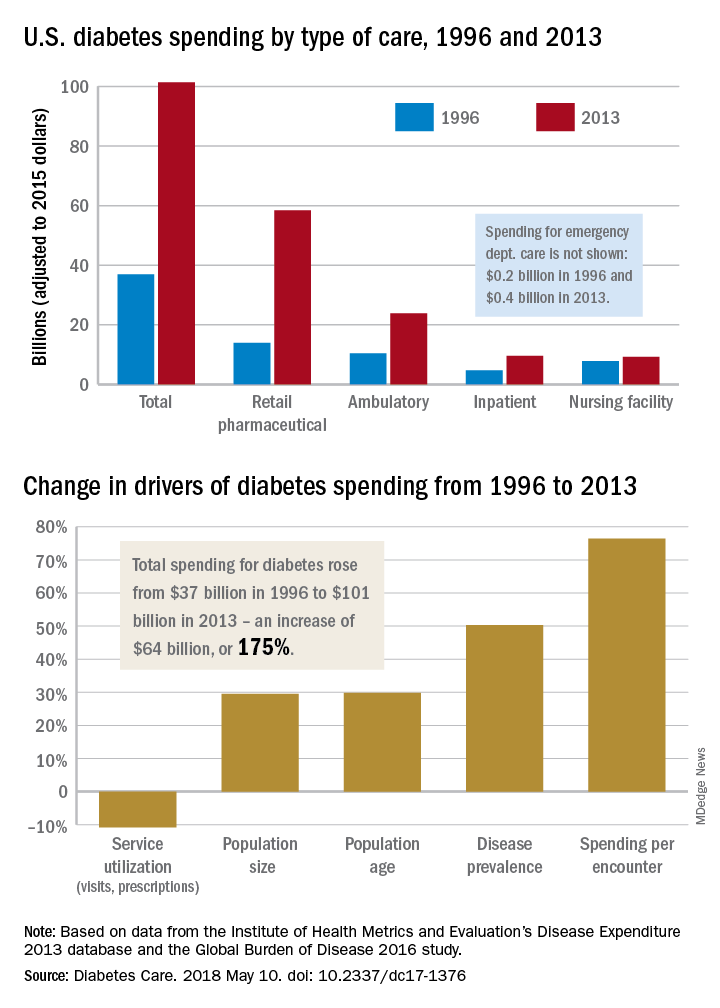
“The rate of increase in pharmaceutical spending was especially drastic from 2008 to 2013, and research suggests that these upward trends have continued in more recent years,” Ms. Squires and her associates wrote.
The analysis used data from the Institute for Health Metrics and Evaluation’s Disease Expenditure 2013 database and the Global Burden of Disease 2016 study. The current study was funded by the Peterson Center on Healthcare and the National Institute on Aging. One investigator receives research support from Medtronic Diabetes and is a consultant for Abbott Diabetes Care, Bigfoot Biomedical, Adocia, and Roche. No other relevant conflicts of interest were reported.
SOURCE: Squires E et al. Diabetes Care. 2018 May 10. doi: 10.2337/dc17-1376.
FROM DIABETES CARE
Surgical specialists are top earners
The five top-earning surgical specialties in 2017 also happened to be the five top-earning specialties, according to a survey by the medical social network Doximity.
Neurosurgery was first among all specialties with an average compensation of $663,000, followed by thoracic surgery ($603,000), orthopedic surgery ($538,000), vascular surgery ($476,000), and plastic surgery ($473,212). Cardiology was just behind plastic surgery at $473,184, which made it the highest-earning nonsurgical specialty, Doximity said in its 2018 Physician Compensation Report, which was based on data from surveys completed by more than 65,000 physicians who practice at least 40 hours a week. Gastroenterologists took in $456,000 and oncologists earned an average of $404,000.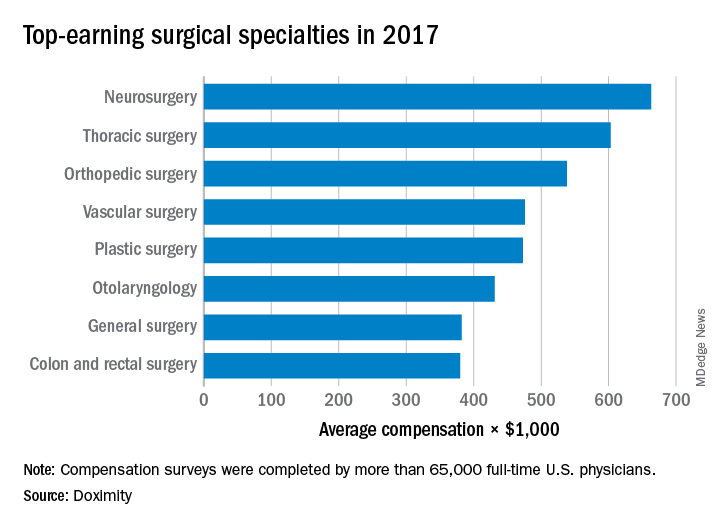
E-cigarette usage has changed
, according to a study published online on May 15 by JAMA.
The prevalence of ever use of e-cigarettes among adults aged 18 years and older rose significantly from 12.6% in 2014 to 15.3% in 2016, while the prevalence of current use (defined as use every day or some days) decreased significantly from 3.7% to 3.2% over that same period, suggesting “that some individuals are trying but not continuing use of e-cigarettes,” Wei Bao, MD, PhD, and his associates said in a research letter.
None of the investigators reported any conflicts of interest.
SOURCE: Bao W et al. JAMA. 2018 May 15;319(19):2039-41.
FROM JAMA