User login
Richard Franki is the associate editor who writes and creates graphs. He started with the company in 1987, when it was known as the International Medical News Group. In his years as a journalist, Richard has worked for Cap Cities/ABC, Disney, Harcourt, Elsevier, Quadrant, Frontline, and Internet Brands. In the 1990s, he was a contributor to the ill-fated Indications column, predecessor of Livin' on the MDedge.
Cost led to missed care for 4.5% of Americans in 2017
The percentage of Americans who went without medical care due to cost rose to 4.5% in 2017, reversing a 6-year trend, the National Center for Health Statistics reported.
The rate was 4.4% in 2016, which represented a slowdown in what had been steady decline over the previous 5 years, according to data from the National Health Interview Survey. Declining rates corresponded with the implementation of early provisions of the Affordable Care Act in 2010.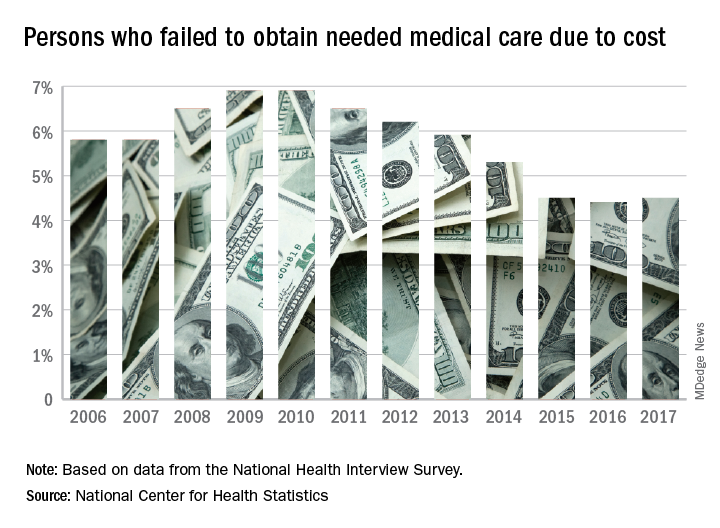
The 2017 rate varied considerably by age group. Not surprisingly, more working-age people – those aged 18-64 years – reported that they did not seek medical care at some point in the previous 12 months due to cost (6.1%). The rate was 1.2% for those under 18 years and 2.7% for the Medicare eligible – those aged 65 years and older.
For 2016, the rates were 6.2% for those aged 18-64 years, 1.2% for the under-18 group, and 2.1% for the 65+ group, the data show.
Among females of all ages in 2017, 4.8% failed to get needed care at some point in the previous year, compared with 4.1% of men. Those numbers were unchanged from 2016 but down from 4.9% for females in 2015 and up from 4.0% for males that year, the NCHS said.
In 2017, the rate also varied by race/ethnicity – 4.1% for whites, 5.3% for Hispanics, 6.1% for blacks – and by location – 4.1% for large metropolitan areas, 4.9% for small metro areas, and 5.5% for rural locales, according to the early release of survey data.
Boston Children’s Hospital named nation’s best
For the fourth consecutive year, Boston Children’s Hospital has been named the top children’s hospital by U.S. News & World Report.
The hospital finished among the top five in all 10 pediatric specialties included in the rankings: cancer (third), cardiology and heart surgery (second), diabetes and endocrinology (second), gastroenterology and GI surgery (second), neonatology (third), nephrology (first), neurology and neurosurgery (first), orthopedics (first), pulmonology (fourth), and urology (third), according to the 2018-2019 Best Children’s Hospitals rankings.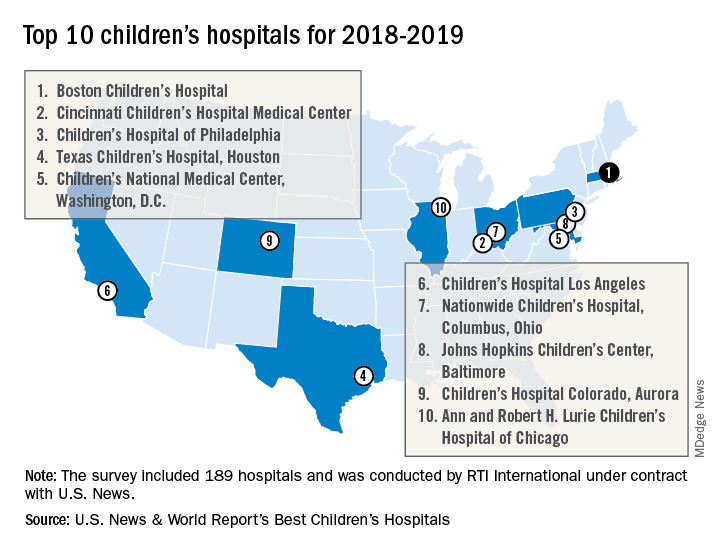
Of the 189 facilities that qualified for inclusion this year, 118 submitted sufficient data to be considered in at least 1 of the 10 specialties and 86 were ranked among the top 50 in at least 1 specialty. In addition, a survey of individuals conducted to establish the hospitals’ reputations – generally worth about 15% of a hospital’s score in each specialty – was completed by 4,165 physicians.
RTI International, a research and consulting firm, conducted the physician survey and produced the methodology and national rankings under contract with U.S. News.
Obesity didn’t just happen overnight
Is it possible to get more exercise and still gain weight? In America it is.
The steady increase in obesity prevalence among adults in the United States has been exceeded over the last decade by the percentage of adults who are getting the recommended amount of exercise, according to the National Center for Health Statistics.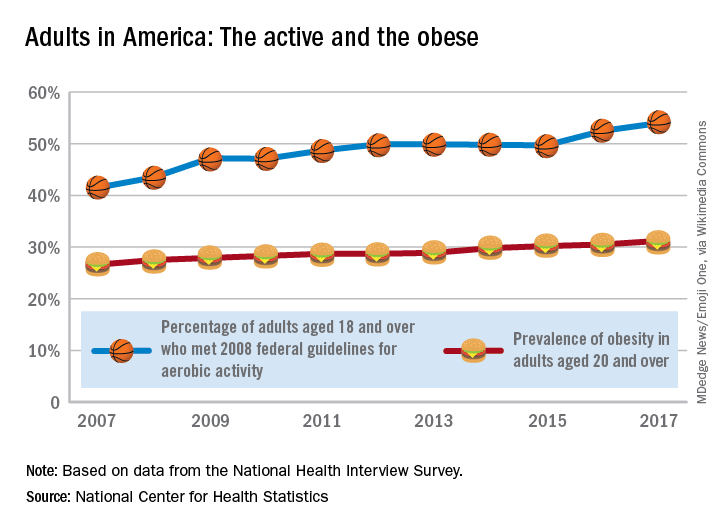
The 2008 guideline, “Physical Activity Guidelines for Americans” recommends that “adults perform at least 150 minutes a week of moderate-intensity aerobic physical activity, 75 minutes a week of vigorous-intensity aerobic physical activity, or an equivalent combination of moderate- and vigorous-intensity aerobic activity, performed in episodes of at least 10 minutes and preferably should be spread throughout the week,” the NCHS noted.
Cosmetic procedures show continued growth
and two declining, according to the American Society of Plastic Surgeons.
The gainers were the three most popular procedures: OnabotulinumtoxinA injections topped the list with 7.23 million anatomic sites injected – an increase of 2% over 2016 – followed by injection of soft tissue fillers with 2.69 million procedures (up 3%) and chemical peels with 1.38 million procedures (an increase of 1%), the ASPS said in its 2017 Plastic Surgery Statistics Report.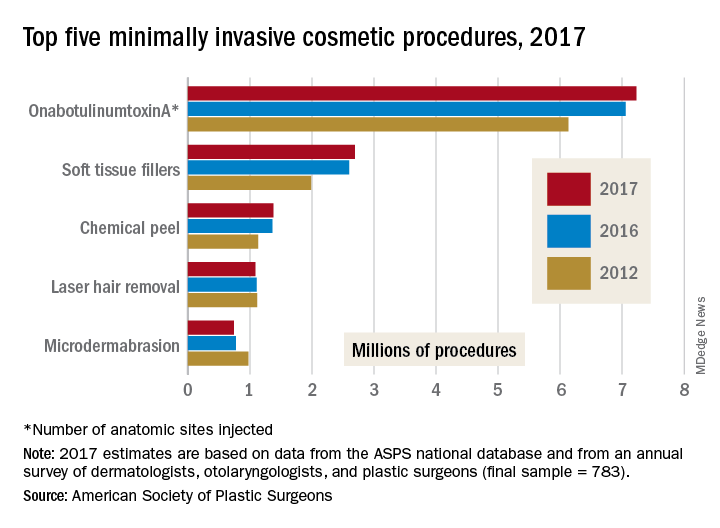
The two decliners among the top five were laser hair removal, which dropped 2% to 1.09 million procedures, and microdermabrasion, which continued a long-term decline by falling 4% to 740,000 procedures in 2017, the ASPS reported.
The minimally invasive cosmetic sector as a whole was up by 2% last year, bringing the number of total procedures to 15.7 million. Cosmetic surgical procedures were up by 1% from 2016 to 2017, reaching a total of 1.79 million. The five most popular cosmetic surgeries were breast augmentation (300,000 performed), liposuction (246,000), rhinoplasty (219,000), blepharoplasty (210,000), and abdominoplasty (130,000), according to the ASPS Tracking Operations and Outcomes for Plastic Surgeons database and an annual survey of board-certified dermatologists, otolaryngologists, and plastic surgeons (final sample = 783).
Postmenopausal estrogen use down since 2006
according to a commercial database with prescription claims for more than 12 million women.
The prevalence of prescriptions for noncontraceptive oral estrogen dropped from 83 per 1,000 women in 2007 to 42 per 1,000 in 2015 for women aged 50 years and older, Joel L. Weissfeld, MD, MPH, of the Office of Surveillance and Epidemiology at the Center for Drug Evaluation and Research at the Food and Drug Administration, and his associates reported based on data from IQVIA Real World Data Adjudicated Claims – U.S. Database.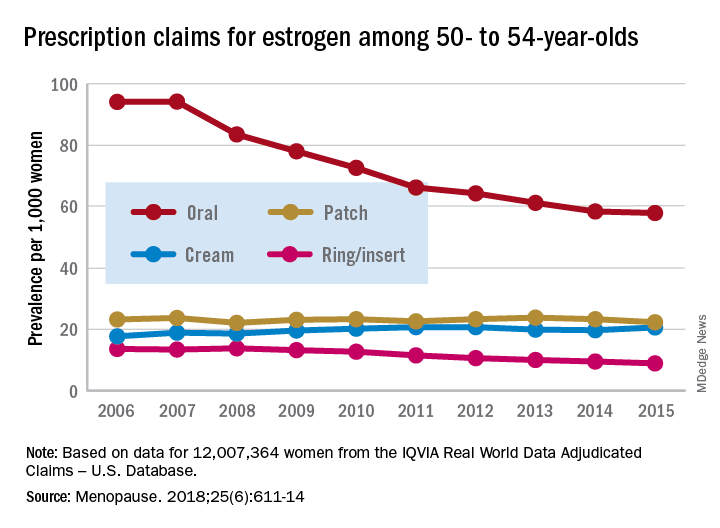
Prescriptions for vaginal forms (creams, rings, and inserts) rose from 27 per 1,000 women in 2006 to 42 per 1,000 in 2011 but declined to 35 per 1,000 by 2017, the investigators reported in Menopause.
For women aged 50-54 years, use of vaginal rings and inserts was steady for 2 years and then dropped every year after 2009, with prevalence lower in 2017 than in 2006. Vaginal ring/insert use increased for the first 2 years among those aged 55-59 years and for the first 5 years for those aged 60-64 years, but then each group started a fairly rapid and ongoing decline that had 2017 levels below those in 2006. Among women aged 65 years and older, however, prevalence of ring/insert use rose for most of the study period, and the declines left prevalences for 2015 above those for 2006, Dr. Weissfeld and his associates wrote.
The data source couldn’t provide reasons for use of vaginal rings or inserts, but the researchers noted that it’s possible that use for vasomotor symptoms “predominated in younger (aged 50-59 years) women closer in age to the onset of menopause. We presume that use for [vulvar and vaginal atrophy] predominated in women 60-65 years of age and older, women who are more distant in age from onset of menopause.”
Trends for use of transdermal patches also varied by age group but with smaller levels of difference. Use among women aged 50-54 years and 55-59 years fluctuated but showed no overall change. Those aged 60-64 years had a gradual decline over the study period, those aged 70-74 years had an initial increase in 2007 and then a decline, and those aged 75 years or older had an increase that lasted until 2011 before use started to fall, they wrote.
SOURCE: Weissfeld JL et al. Menopause. 2018;25(6):611-14.
FROM MENOPAUSE
Invasive cardiology sets starting salary standard
A 5% increase in average starting salary for the 2017-2018 recruiting year enabled invasive cardiologists to replace orthopedic surgeons as the top physician earners, according to physician recruitment firm Merritt Hawkins.
Invasive cardiologists who started new jobs in the past year received an average starting salary of $590,000, compared with $563,000 in 2016-2017, while orthopedic surgeons took an 8% cut as their starting salaries dropped from $579,000 to $533,000, Merritt Hawkins reported in its 2018 Review of Physician and Advanced Practitioners Recruiting Incentives.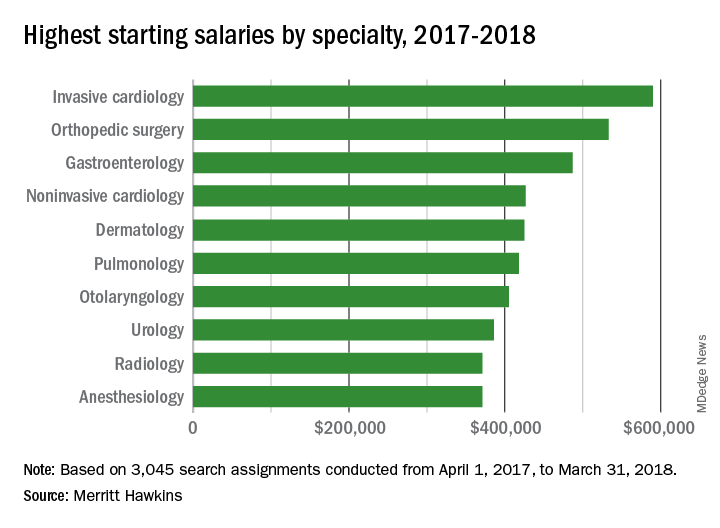
Besides the orthopedic surgeons, specialists who saw considerable drops in pay from 2016 to 2017 included otolaryngologists (–13%), radiologists (–15%), and urologists (–16%), according to the report.
“Demand for specialists is being driven upward by population aging and other factors. Average salaries, however, do not always correspond to increases in demand, at least not initially, as the market needs time to adjust to changing supply and demand dynamics,” Merritt Hawkins noted.
Most Medicaid enrollees exempt from work requirements
Only 6% of the Medicaid population would be unlikely to qualify for an exemption from work requirements for “able-bodied adults” that states are in the process of being implementing, according to a new report from the Kaiser Family Foundation.
Another 15% were in fair or poor health or didn’t work because of illness or disability, 11% didn’t work because they were providing care for family members, and 6% were attending school, Kaiser wrote in an issue brief.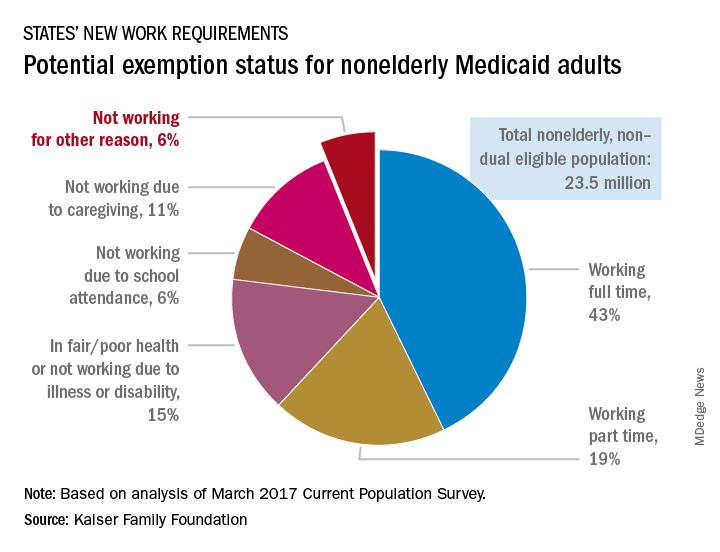
“This target population is much smaller than the groups of enrollees who are already working but would need to comply with new reporting requirements and those who could be exempt and would have to navigate an exemption process,” the Kaiser investigators said.
States will need to set up systems to deal with these issues, but many enrollees face barriers to complying. The waiver program in Arkansas – one of the first four states to receive permission to impose work requirements – “requires beneficiaries to set up an online account and use this account as the sole means of periodic reporting related to work requirements and exemptions,” they noted, but 30% of all nonelderly Medicaid adults say that they have never used a computer, 21% do not use the Internet, and 41% do not use email, based on analysis of 2016 National Health Interview Survey data.
Family medicine remains first in recruiting demand
according to physician recruitment firm Merritt Hawkins.
The company conducted 497 searches for family physicians from April 1, 2017, to March 31, 2018, marking the third straight year of decline for the specialty but still more than double the 243 searches conducted for psychiatrists, the medical specialty that was second more frequently requested for recruitment, Merritt Hawkins wrote in its 2018 Survey of Physician and Advanced Practitioners Recruiting Incentives.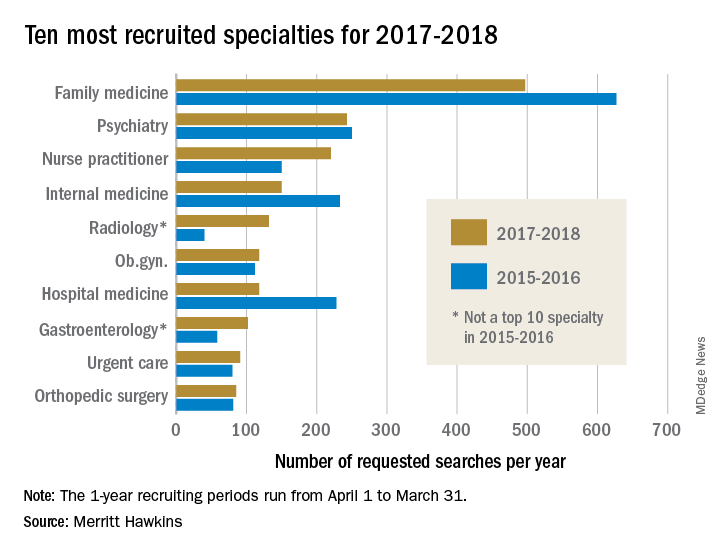
Gastroenterology, with an eighth-place finish in 2017-2018, also showed strong growth by increasing 55% from the year before and rising 137% over the past 3 years. The rise of gastroenterology and radiology over the past 2 years came at the expense of pediatrics, which went from 10th in 2015-2016 to 13th this year, and neurology, which dropped from 7th to 15th, Merritt Hawkins wrote in the report, which was based on a total of 3,045 search assignments conducted in 2017-2018.
“While demand for primary care physicians remains robust, hospitals, medical groups, and other health care facilities are shifting their recruiting efforts to medical specialists,” the company wrote, noting that recruiting assignments for medical specialists have risen from 67% of all searches 3 years ago to 74% in the past year.
“It’s a matter of demographic destiny,” Travis Singleton, senior vice president of Merritt Hawkins, said in a written statement accompanying the report. “Americans are getting older, and it is medical specialists who will be taking care of our aging and ailing bodies and brains. We still need more primary care doctors, but a growing emphasis is being placed on recruiting specialists.”
Vaccine nonmedical exemptions creating metro ‘hotspots’
Recent increases in nonmedical exemptions (NMEs) to vaccination have created metropolitan “hotspots” with large numbers of unvaccinated children, according to a report published June 12 in PLoS Medicine.
although rates seem to have plateaued in some states since 2014. As a result of those increases, there were, during the 2016-2017 school year, 15 metro areas with kindergarten NME populations over 400, reported Jacqueline K. Olive, and her associates at Baylor College of Medicine. Their report was based on data from state health departments and the Centers for Disease Control and Prevention.
Leading the way was Maricopa County, Ariz., home of Phoenix and 2,947 unvaccinated kindergartners, which was more than triple the number in county/city No. 2, Salt Lake County/Salt Lake City (NME total: 956). Close behind in third was King County, Wash. (Seattle) at 940, followed by Multnomah County, Ore. (Portland) at 711 and Oakland County, Mich. (Troy) at 686, the investigators said.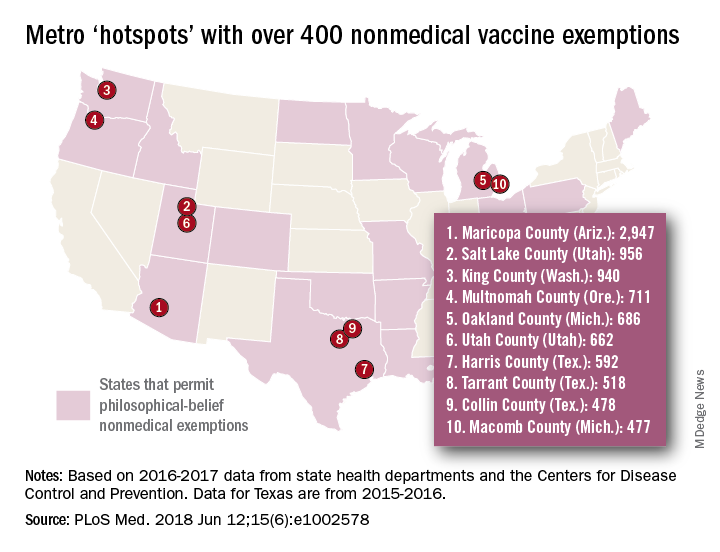
[There was only room for 10 in the map, so here are hotspots 11-15: Wayne County, Mich. (Detroit); Allegheny County, Pa. (Pittsburgh); Travis County, Tex. (Austin); Jackson County, Mo. (Kansas City); and Spokane County, Wash. (Spokane).]
In addition to the large-population hotspots, there are also a number of mainly rural counties with smaller populations but high NME rates. Eight of the 10 highest such rates can be found in Idaho, and at the top of that list is Camas County, which had an NME rate of 27% in 2016-2017, the researchers reported.
Analysis of the relationship between NMEs and MMR vaccination showed that “states with more NME students exhibited lower MMR vaccination rates. In contrast, states that have banned NMEs – Mississippi, California, and West Virginia – exhibit the highest MMR vaccine uptake and lowest incidence of vaccine preventable diseases,” the investigators wrote.
Ms. Olive and her associates said that there was no specific funding for the study and that no conflicts of interest existed.
SOURCE: Olive JK et al. PLoS Med. 2018 Jun 12;15(6): e1002578. doi: 10.1371/journal.pmed.1002578.
FROM PLOS MEDICINE
Sleep apnea treatment may not prevent sleepiness
Physicians who treat obstructive sleep apnea reported that patients with OSA can experience excessive sleepiness despite being on optimized airway treatment, findings from an online surgery of clinicians show.
Jazz Pharmaceuticals and the social media network Sermo conducted an online questionnaire on topics in excessive sleepiness and obstructive sleep apnea. The study was conducted March 30-31, 2018.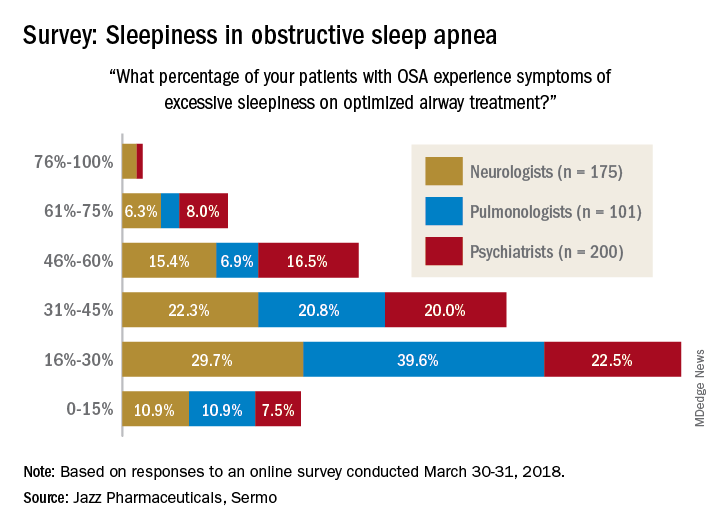
When asked how often they assess their OSA patients’ sleepiness, 46% of respondents said every 3 months, 28% said every 6 months, 19% said once a month, 6% said once a year, and 0.4% (one neurologist and one pulmonologist) said never. The method of evaluation varied by specialty: 82% of pulmonologists most often use the Epworth Sleepiness Scale and 76% of psychiatrists primarily use an informal set of questions, with neurologists in between but leaning toward informal questions, Jazz reported.
“As more scientific evidence emerges around the neuronal injury occurring due to OSA and the potential neurocognitive effects of excessive sleepiness, it’s imperative that pulmonologists, neurologists and psychiatrists understand the impact ES [excessive sleepiness] can have on patients’ lives,” Richard K. Bogan, MD, of the University of South Carolina, Columbia, a paid consultant to Jazz, said in a written statement.