User login
Richard Franki is the associate editor who writes and creates graphs. He started with the company in 1987, when it was known as the International Medical News Group. In his years as a journalist, Richard has worked for Cap Cities/ABC, Disney, Harcourt, Elsevier, Quadrant, Frontline, and Internet Brands. In the 1990s, he was a contributor to the ill-fated Indications column, predecessor of Livin' on the MDedge.
Female authorship rising in cardiology journals
and academic medicine overall, according to a review of content from six prominent cardiology journals.
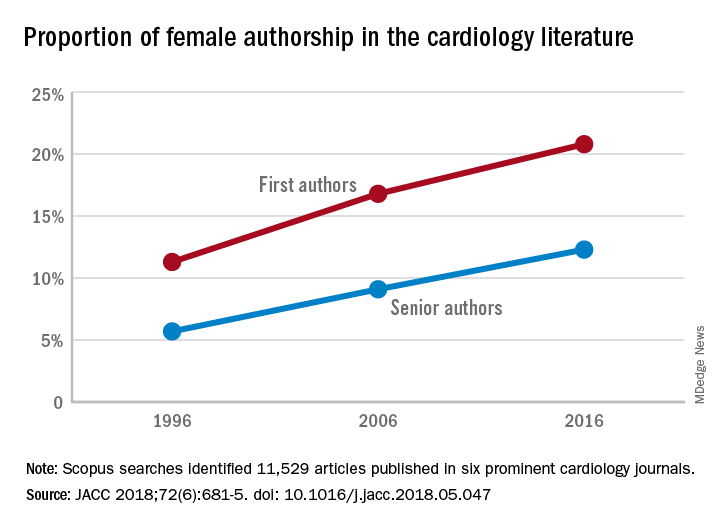
The proportion of female first authors in the six journals – American Journal of Cardiology, Journal of the American College of Cardiology, BMJ Heart, European Heart Journal, Clinical Cardiology, and Circulation – rose from 11.3% in 1996 to 20.8% in 2016, an increase of 9.5 percentage points. Comparable numbers for female senior authors were 5.7% in 1996 and 12.3% in 2016, which works out to an increase of 6.6 percentage points, Mariam Asghar, MBBS, of Dow University of Health Sciences in Karachi, Pakistan, and associates reported in the Journal of the American College of Cardiology.
“The pervasive gender gap in cardiology has been a subject of concern,” they wrote. For academic medicine overall, 37% of first authors are female, and cardiology’s 20.8% is lower than such specialties as radiology (32%), ophthalmology (34%), and emergency medicine (24%), they noted.
The magnitude of the increase varied for each of the six journals over the 20-year period, with Clinical Cardiology having the largest gain for first authors (14.5 percentage points) and JACC the smallest (5.1 percentage points). The largest increase for female senior authors (11.6 points) came from Clinical Cardiology and BMJ Heart, while the smallest increase (2.4 points) was seen at the European Heart Journal, the investigators said.
Dr. Asghar and associates identified 11,529 articles in Scopus for all six journals for the 3 years in question (1996, 2006, and 2016), with sex of the first author determined for 9,749 and senior author for 11,411. Articles with only one author were credited as having a senior author.
The investigators reported having no relevant financial disclosures.
SOURCE: Asghar M et al. JACC 2018;72(6):681-5. doi: 10.1016/j.jacc.2018.05.047.
and academic medicine overall, according to a review of content from six prominent cardiology journals.
The proportion of female first authors in the six journals – American Journal of Cardiology, Journal of the American College of Cardiology, BMJ Heart, European Heart Journal, Clinical Cardiology, and Circulation – rose from 11.3% in 1996 to 20.8% in 2016, an increase of 9.5 percentage points. Comparable numbers for female senior authors were 5.7% in 1996 and 12.3% in 2016, which works out to an increase of 6.6 percentage points, Mariam Asghar, MBBS, of Dow University of Health Sciences in Karachi, Pakistan, and associates reported in the Journal of the American College of Cardiology.
“The pervasive gender gap in cardiology has been a subject of concern,” they wrote. For academic medicine overall, 37% of first authors are female, and cardiology’s 20.8% is lower than such specialties as radiology (32%), ophthalmology (34%), and emergency medicine (24%), they noted.
The magnitude of the increase varied for each of the six journals over the 20-year period, with Clinical Cardiology having the largest gain for first authors (14.5 percentage points) and JACC the smallest (5.1 percentage points). The largest increase for female senior authors (11.6 points) came from Clinical Cardiology and BMJ Heart, while the smallest increase (2.4 points) was seen at the European Heart Journal, the investigators said.
Dr. Asghar and associates identified 11,529 articles in Scopus for all six journals for the 3 years in question (1996, 2006, and 2016), with sex of the first author determined for 9,749 and senior author for 11,411. Articles with only one author were credited as having a senior author.
The investigators reported having no relevant financial disclosures.
SOURCE: Asghar M et al. JACC 2018;72(6):681-5. doi: 10.1016/j.jacc.2018.05.047.
FROM THE JOURNAL OF THE AMERICAN COLLEGE OF CARDIOLOGY
Preterm birth rate ‘is on the rise again’
After several years of decline, the incidence of preterm births in the United States “is on the rise again,” according to the National Center for Health Statistics.
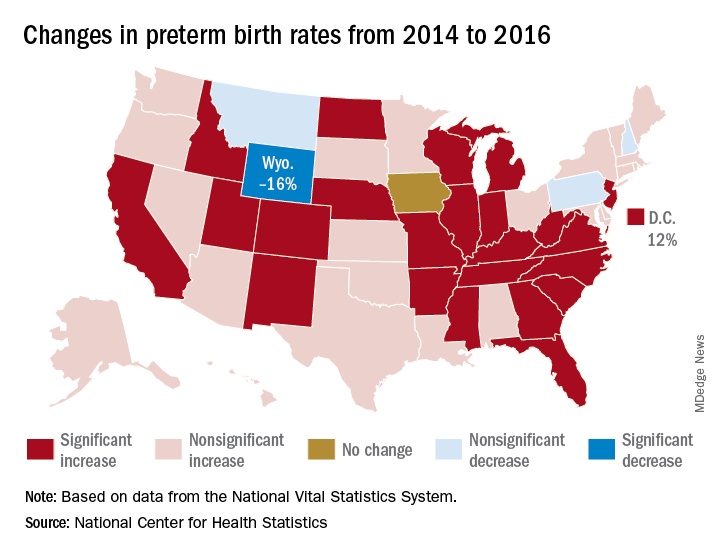
That 3% increase was spread pretty evenly: 23 states and the District of Columbia experienced statistically significant increases from 2014 to 2016, and 22 other states also had increases, although these were not statistically significant. One state, Iowa, had no change; three states – Montana, New Hampshire, and Pennsylvania – had nonsignificant declines, and Wyoming was the only state with a statistically significant drop (16%) in preterm birth incidence, they said based on data from the National Vital Statistics System.
The largest increase, 12%, was seen in the District of Columbia, followed by Idaho and North Dakota at 10% and Arkansas, New Mexico, and West Virginia at 9%, the researchers reported.
After several years of decline, the incidence of preterm births in the United States “is on the rise again,” according to the National Center for Health Statistics.
That 3% increase was spread pretty evenly: 23 states and the District of Columbia experienced statistically significant increases from 2014 to 2016, and 22 other states also had increases, although these were not statistically significant. One state, Iowa, had no change; three states – Montana, New Hampshire, and Pennsylvania – had nonsignificant declines, and Wyoming was the only state with a statistically significant drop (16%) in preterm birth incidence, they said based on data from the National Vital Statistics System.
The largest increase, 12%, was seen in the District of Columbia, followed by Idaho and North Dakota at 10% and Arkansas, New Mexico, and West Virginia at 9%, the researchers reported.
Liver cancer death rates down for Asians and Pacific Islanders
Liver cancer death rates are dropping for Asians/Pacific Islanders, but that is the exception to a larger trend, according to the National Center for Health Statistics.
The age-adjusted death rate for liver cancer is down 22% among Asian or Pacific Islander adults aged 25 years and older since the turn of the century, falling from 17.5 per 100,000 population in 2000 – when it was the highest of the four racial/ethnic groups included in the report – to 13.6 per 100,000 in 2016, by which time it was just middle of the pack, the NCHS reported.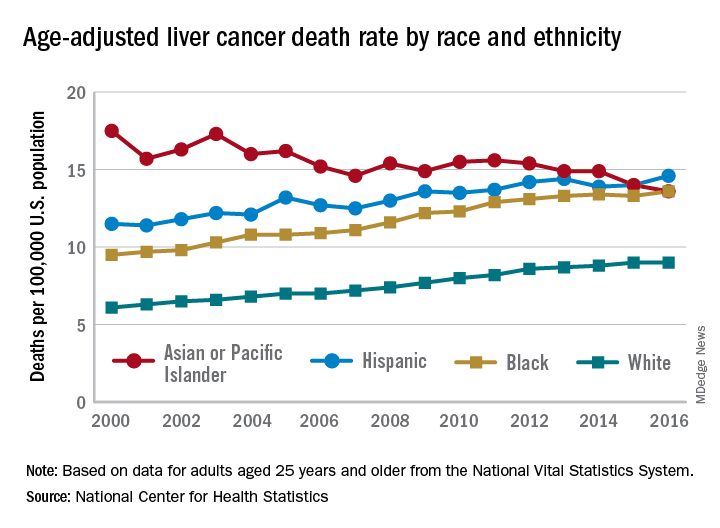
That shift resulted as much from increases for the other groups as from the decreased rate for Asians/Pacific Islanders. White adults were dying of liver cancer at a 48% higher rate in 2016 (9.0 per 100,000) than they were in 2000 (6.1), blacks saw their death rate go from 9.5 to 13.6 – a 43% increase – and the rate for Hispanics rose by 27% from 2000 (11.5) to 2016 (14.6), said Jiaquan Xu, MD, of the NCHS mortality statistics branch.
The adjusted death rate from liver cancer for all adults went from 7.2 per 100,000 in 2000 to 10.3 in 2016 for an increase of 43%. Over that period, the rate for men was always at least twice as high as it was for women: It rose from 10.5 per 100,000 for men and 4.9 for women in 2000 to 15.0 for men and 6.3 for women in 2016, Dr. Xu said based on data from the mortality files of the National Vital Statistics System.
Geographically, the District of Columbia had the highest rate at 16.8 per 100,000 in 2016, followed by Louisiana (13.8), Hawaii (12.7), and Mississippi and New Mexico (12.4 each). Vermont’s rate of 6.0 was the lowest in the country, with Maine second at 7.4, Montana third at 7.7, and Utah and Nebraska tied for fourth at 7.8, according to Dr. Xu.
CDC reports Salmonella outbreak
A total of 90 people in 26 states have been infected with multidrug-resistant Salmonella in an outbreak linked to raw turkey products, according to the Centers for Disease Control and Prevention.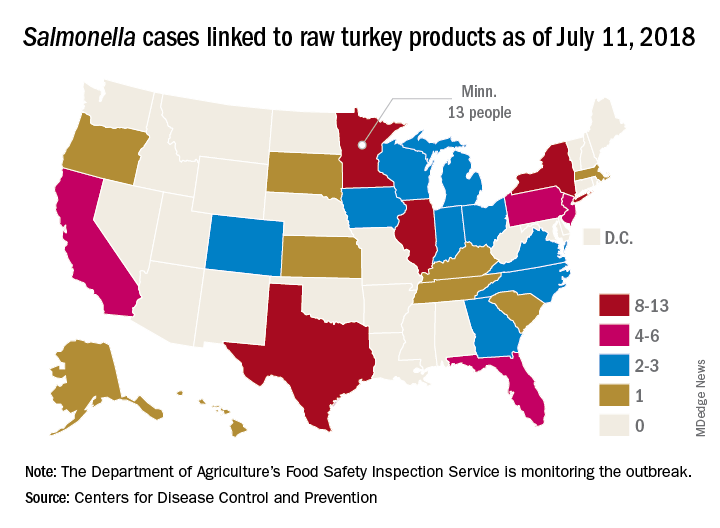
As of July 11, 2018, 40 of the 78 people with available information who were infected with the outbreak strain of Salmonella Reading have been hospitalized, but no deaths have been reported. Of the 61 ill people who have been interviewed, most have reported preparing or eating turkey products from a number of sources, although two lived in households where raw turkey was given to pets: No common supplier has been identified, the CDC reported in an investigation notice posted July 19.
The first illness in this outbreak started on Nov. 20, 2017, and the most recent one started on June 29, 2018. The U.S. Department of Agriculture’s Food Safety Inspection Service is monitoring the outbreak, and public health and regulatory agency efforts are being coordinated by the CDC through its PulseNet national subtyping network. DNA fingerprinting “performed on Salmonella from ill people in this outbreak showed that they are closely related genetically. This means that the ill people are more likely to share a common source of infection,” the CDC said.
Consumers should handle raw turkey carefully and cook it thoroughly to prevent Salmonella, the CDC advised. Raw food of any type should not be given to pets. At this time, the CDC said that it is “not advising that consumers avoid eating properly cooked turkey products, or that retailers stop selling raw turkey products.”
Recommendations aim to reduce pediatric nephrology testing
Evidence-based recommendations for appropriate nephrology testing in children are the latest installment of the American Board of Internal Medicine Foundation’s “Choosing Wisely” campaign.
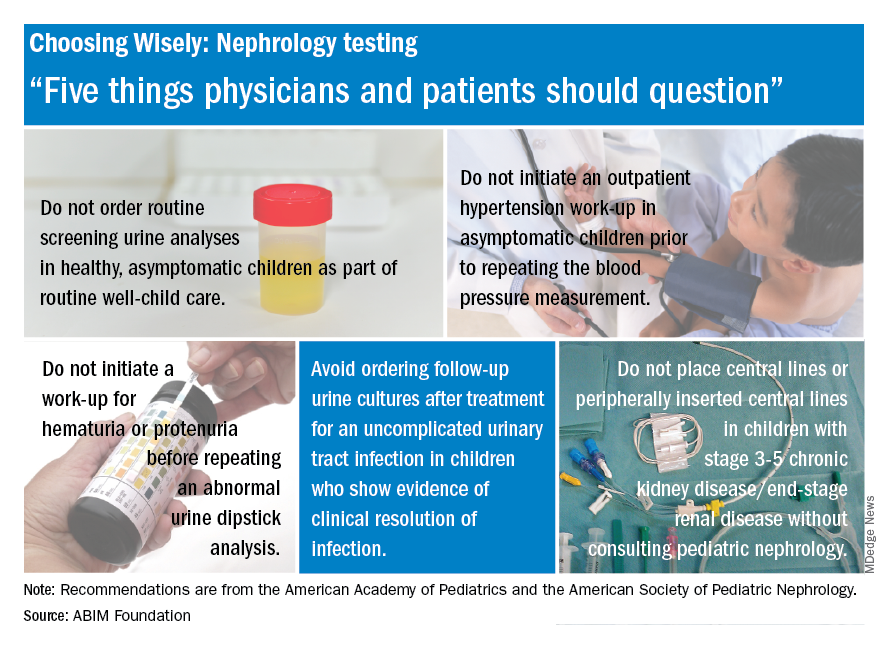
The list includes recommendations on when not to order screening urine analyses and urine cultures, initiate hypertension workups, and place central lines. “Sometimes parents or physicians want to ensure all available testing is done, but unnecessary testing can create more fear, cost, and risk for children. Good communication and discussion of options can help reduce the likelihood of unnecessary testing,” said Doug Silverstein, MD, chairperson of the AAP section on nephrology.
Evidence-based recommendations for appropriate nephrology testing in children are the latest installment of the American Board of Internal Medicine Foundation’s “Choosing Wisely” campaign.
The list includes recommendations on when not to order screening urine analyses and urine cultures, initiate hypertension workups, and place central lines. “Sometimes parents or physicians want to ensure all available testing is done, but unnecessary testing can create more fear, cost, and risk for children. Good communication and discussion of options can help reduce the likelihood of unnecessary testing,” said Doug Silverstein, MD, chairperson of the AAP section on nephrology.
For smokers, the ends may not justify the ENDS
Smokers who used e-cigarettes and other electronic nicotine delivery systems (ENDS) were less likely to quit than were those who did not use such products, according to a 2015 survey and a follow-up conducted a year later.
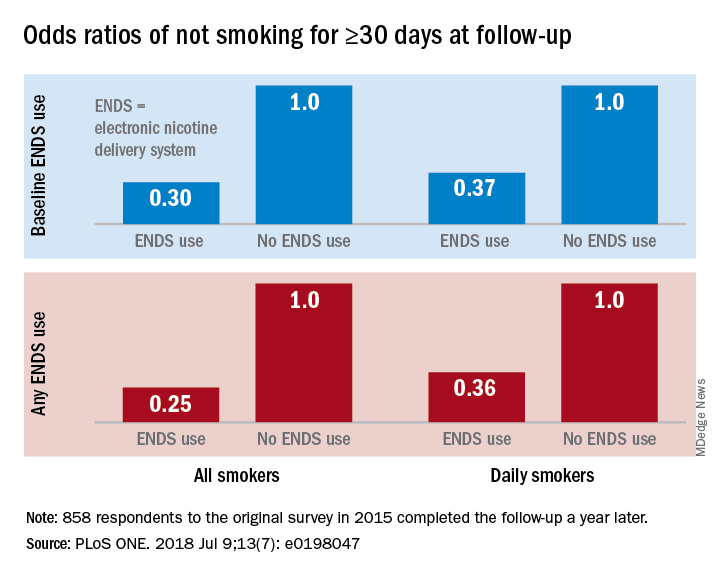
“Under ‘real world’ use and conditions [ENDS] may have suppressed or delayed quitting among some adult smokers,” Scott R. Weaver, PhD, and his associates at Georgia State University, Atlanta, wrote in PLoS One. The original survey, conducted in August and September of 2015, involved 1,284 U.S. adult smokers from the GfK KnowledgePanel, of whom 858 completed the follow-up survey in September 2016.
Smokers who used ENDS at baseline were slightly more likely to attempt to quit (53.7%) than were those who did not (48.6%) but were much less likely to have quit (defined as no smoking for at least 30 days at the time of follow-up): 9.4% vs. 18.9%, for an adjusted odds ratio of 0.30. Those who used ENDS at any time during the study were much more likely than were non-ENDS users to make an attempt (58.5% vs. 44.4%), but they were, again, much less likely to succeed (7.7% vs. 22.2%; AOR, 0.25), the investigators reported.
The results were similar for the subset of respondents who smoked every day: ENDS users were more likely to attempt to quit but less likely to succeed. Odds ratios for quitting were 0.37 for those using ENDS at baseline and 0.36 for those who used ENDS at any time since the first survey, Dr. Weaver and his associates said.
“Use of current ENDS products in real world conditions [does] not seem to improve the chances of quitting for smokers, and, under the current landscape, may not be the disruptive technology that increases the population quit rate and reduces the harm of combustibles,” they wrote.
The study was supported by the National Institute of Drug Abuse and the Food and Drug Administration’s Center for Tobacco Products. One of the investigators has received funding in the form of grant funding from Pfizer and the National Institutes of Health and another has served as a paid consultant to the Centers for Disease Control and Prevention.
SOURCE: Weaver SR et al. PLoS ONE. 2018 Jul 9;13(7): e0198047. doi: 10.1371/journal.pone.0198047.
Smokers who used e-cigarettes and other electronic nicotine delivery systems (ENDS) were less likely to quit than were those who did not use such products, according to a 2015 survey and a follow-up conducted a year later.
“Under ‘real world’ use and conditions [ENDS] may have suppressed or delayed quitting among some adult smokers,” Scott R. Weaver, PhD, and his associates at Georgia State University, Atlanta, wrote in PLoS One. The original survey, conducted in August and September of 2015, involved 1,284 U.S. adult smokers from the GfK KnowledgePanel, of whom 858 completed the follow-up survey in September 2016.
Smokers who used ENDS at baseline were slightly more likely to attempt to quit (53.7%) than were those who did not (48.6%) but were much less likely to have quit (defined as no smoking for at least 30 days at the time of follow-up): 9.4% vs. 18.9%, for an adjusted odds ratio of 0.30. Those who used ENDS at any time during the study were much more likely than were non-ENDS users to make an attempt (58.5% vs. 44.4%), but they were, again, much less likely to succeed (7.7% vs. 22.2%; AOR, 0.25), the investigators reported.
The results were similar for the subset of respondents who smoked every day: ENDS users were more likely to attempt to quit but less likely to succeed. Odds ratios for quitting were 0.37 for those using ENDS at baseline and 0.36 for those who used ENDS at any time since the first survey, Dr. Weaver and his associates said.
“Use of current ENDS products in real world conditions [does] not seem to improve the chances of quitting for smokers, and, under the current landscape, may not be the disruptive technology that increases the population quit rate and reduces the harm of combustibles,” they wrote.
The study was supported by the National Institute of Drug Abuse and the Food and Drug Administration’s Center for Tobacco Products. One of the investigators has received funding in the form of grant funding from Pfizer and the National Institutes of Health and another has served as a paid consultant to the Centers for Disease Control and Prevention.
SOURCE: Weaver SR et al. PLoS ONE. 2018 Jul 9;13(7): e0198047. doi: 10.1371/journal.pone.0198047.
FROM PLOS ONE
Fentanyl analogs nearly double their overdose death toll
, according to preliminary data from 10 states.
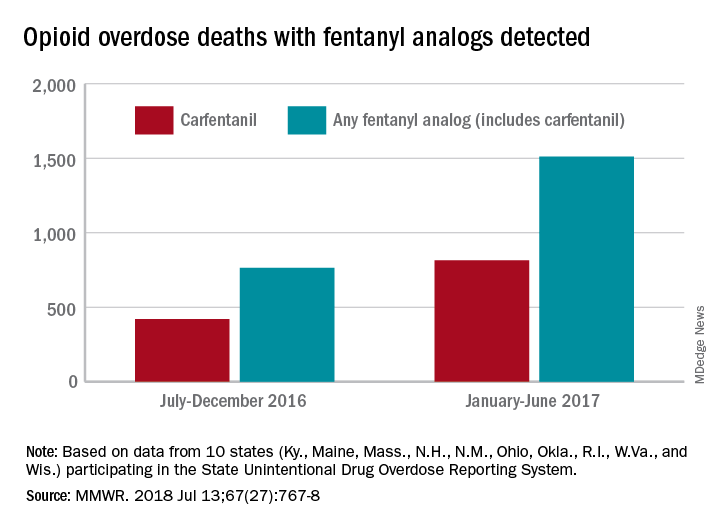
During July 2016 to December 2016, there were 764 opioid overdose deaths that tested positive for any fentanyl analog, with carfentanil being the most common (421 deaths). From January 2017 to June 2017, the respective numbers increased by 98% (1,511) and 94% (815), wrote Julie O’Donnell, PhD, and her associates at the Centers for Disease Control and Prevention’s National Center for Injury Prevention and Control. The report was published in the Morbidity and Mortality Weekly Report.
“The increasing array of fentanyl analogs highlights the need to build forensic toxicological testing capabilities to identify and report emerging threats, and to enhance capacity to rapidly respond to evolving drug trends,” Dr. O’Donnell and her associates said.
Along with carfentanil, 13 other analogs were detected in decedents during the 12-month period: 3-methylfentanyl, 4-fluorobutyrfentanyl, 4-fluorofentanyl, 4-fluoroisobutyrfentanyl, acetylfentanyl, acrylfentanyl, butyrylfentanyl, cyclopropylfentanyl, cyclopentylfentanyl, furanylethylfentanyl, furanylfentanyl, isobutyrylfentanyl, and tetrahydrofuranylfentanyl. Deaths may have involved “more than one analog, as well as ... other opioid and nonopioid substances,” they noted.
The 10 states reporting data to the State Unintentional Drug Overdose Reporting System (SUDORS) were Kentucky, Maine, Massachusetts, New Hampshire, New Mexico, Ohio, Oklahoma, Rhode Island, West Virginia, and Wisconsin. Two other SUDORS-reporting states – Missouri and Pennsylvania – did not have their data ready in time to be included in this analysis.
The increasing availability of fentanyl analogs hit Ohio especially hard: More deaths occurred there than in the other 10 states combined. Of the 421 carfentanil-related deaths in July 2016 to December 2016, nearly 400 were in Ohio, and there were 218 Ohio deaths in April 2017 alone. A look at the bigger picture shows that 3 of the 10 states reported carfentanil-related overdose deaths in the second half of 2016, compared with 7 in the first half of 2017, the investigators said.
Carfentanil, which is the most potent of the 14 fentanyl analogs that have been detected so far, “is intended for sedation of large animals, and is estimated to have 10,000 times the potency of morphine,” Dr. O’Donnell and her associates wrote.
SOURCE: O’Donnell J et al. MMWR. 2018 Jul 13;67(27):767-8.
, according to preliminary data from 10 states.
During July 2016 to December 2016, there were 764 opioid overdose deaths that tested positive for any fentanyl analog, with carfentanil being the most common (421 deaths). From January 2017 to June 2017, the respective numbers increased by 98% (1,511) and 94% (815), wrote Julie O’Donnell, PhD, and her associates at the Centers for Disease Control and Prevention’s National Center for Injury Prevention and Control. The report was published in the Morbidity and Mortality Weekly Report.
“The increasing array of fentanyl analogs highlights the need to build forensic toxicological testing capabilities to identify and report emerging threats, and to enhance capacity to rapidly respond to evolving drug trends,” Dr. O’Donnell and her associates said.
Along with carfentanil, 13 other analogs were detected in decedents during the 12-month period: 3-methylfentanyl, 4-fluorobutyrfentanyl, 4-fluorofentanyl, 4-fluoroisobutyrfentanyl, acetylfentanyl, acrylfentanyl, butyrylfentanyl, cyclopropylfentanyl, cyclopentylfentanyl, furanylethylfentanyl, furanylfentanyl, isobutyrylfentanyl, and tetrahydrofuranylfentanyl. Deaths may have involved “more than one analog, as well as ... other opioid and nonopioid substances,” they noted.
The 10 states reporting data to the State Unintentional Drug Overdose Reporting System (SUDORS) were Kentucky, Maine, Massachusetts, New Hampshire, New Mexico, Ohio, Oklahoma, Rhode Island, West Virginia, and Wisconsin. Two other SUDORS-reporting states – Missouri and Pennsylvania – did not have their data ready in time to be included in this analysis.
The increasing availability of fentanyl analogs hit Ohio especially hard: More deaths occurred there than in the other 10 states combined. Of the 421 carfentanil-related deaths in July 2016 to December 2016, nearly 400 were in Ohio, and there were 218 Ohio deaths in April 2017 alone. A look at the bigger picture shows that 3 of the 10 states reported carfentanil-related overdose deaths in the second half of 2016, compared with 7 in the first half of 2017, the investigators said.
Carfentanil, which is the most potent of the 14 fentanyl analogs that have been detected so far, “is intended for sedation of large animals, and is estimated to have 10,000 times the potency of morphine,” Dr. O’Donnell and her associates wrote.
SOURCE: O’Donnell J et al. MMWR. 2018 Jul 13;67(27):767-8.
FROM MMWR
Pediatric dermatology admissions: Crunching the numbers
according to data from the Agency for Healthcare Research and Quality.
There were 74,229 such admissions in the United States that year – all others totaled 1.77 million – and the children at the highest risk for dermatology hospitalization were those living in communities with the lowest household incomes, the uninsured and those on Medicaid, and those living in the South, Justin D. Arnold of George Washington University, Washington, and his associates said in Pediatric Dermatology.
“Individuals from communities of low socioeconomic status may be more likely to be hospitalized because of gaps in insurance coverage, difficulty with transportation, or inconsistent access to preventative medical care, which for skin disease, would include access to an outpatient pediatric dermatologist,” they wrote.
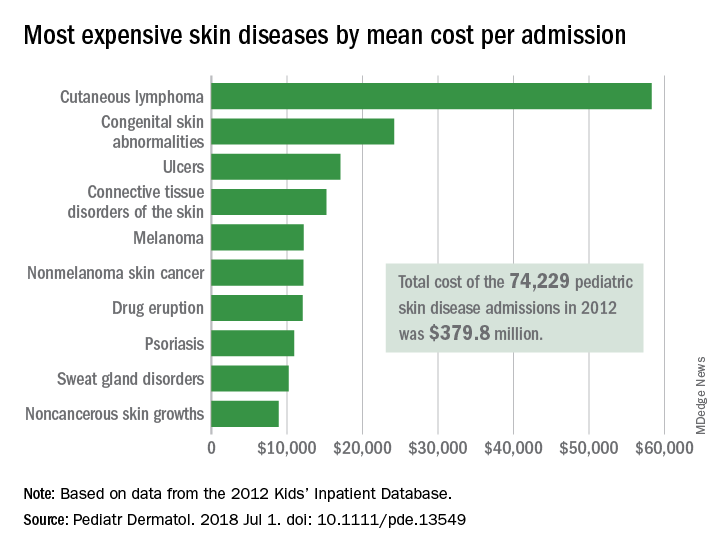
All those admissions for skin diseases cost the health care system $379.8 million in 2012, or 1.9% of the $20.3 billion spent on all pediatric hospitalizations, excluding those related to pregnancy or childbirth. The mean cost of a skin disease admission was $5,211 for a child aged less than 18 years, compared with $11,409 for nondermatology admissions, according to data from the 2012 Kids’ Inpatient Database, which includes records of pediatric discharges from 44 states.
Cutaneous lymphoma was the most expensive skin disease per admission at a mean cost of $58,294, with congenital skin abnormalities second at $24,186, and ulcers third at $17,064. Bacterial skin infections and infestations were only the 19th most expensive admission at $4,135, but it was by far the most common (59,115 admissions) and the most expensive overall, with a total cost of $240 million. The second most common condition was viral diseases with 3,812 admissions and the next most expensive total was $33.5 million for connective tissue disorders, Mr. Arnold and his associates said.
Multivariate models that adjusted for such factors as age, sex, and race revealed that “the risk of hospitalization for skin disease increased as the median income of one’s zip code declined,” the investigators noted. The adjusted odds ratio for hospitalization in the lowest-income quartile (less than $39,000) was 1.22, compared with the highest-income quartile.
Insurance status also affected hospitalization, putting children from families with no insurance (aOR, 1.35) and those on Medicaid (aOR, 1.17) at a disadvantage, compared with those who had private insurance. “Policy makers should consider increasing Medicaid reimbursement rates to outpatient dermatologists, which might encourage more clinicians to accept this form of insurance and thereby expand access to preventative skin care,” they said.
Regional differences also were observed, which put children from the southern states at the highest risk (aOR, 1.32), compared with those in the West, which could be related to access issues. “In 2016, 4 of the 10 communities in the United States with the lowest density of dermatologists were in the South, suggesting that the high rate of hospitalizations there may also be partially attributed to lack of access to dermatologists,” Mr. Arnold and his associates wrote.
The investigators did not report funding or disclose conflicts of interest.
SOURCE: Arnold JD et al. Pediatr Dermatol. 2018 Jul 1. doi: 10.1111/pde.13549.
according to data from the Agency for Healthcare Research and Quality.
There were 74,229 such admissions in the United States that year – all others totaled 1.77 million – and the children at the highest risk for dermatology hospitalization were those living in communities with the lowest household incomes, the uninsured and those on Medicaid, and those living in the South, Justin D. Arnold of George Washington University, Washington, and his associates said in Pediatric Dermatology.
“Individuals from communities of low socioeconomic status may be more likely to be hospitalized because of gaps in insurance coverage, difficulty with transportation, or inconsistent access to preventative medical care, which for skin disease, would include access to an outpatient pediatric dermatologist,” they wrote.
All those admissions for skin diseases cost the health care system $379.8 million in 2012, or 1.9% of the $20.3 billion spent on all pediatric hospitalizations, excluding those related to pregnancy or childbirth. The mean cost of a skin disease admission was $5,211 for a child aged less than 18 years, compared with $11,409 for nondermatology admissions, according to data from the 2012 Kids’ Inpatient Database, which includes records of pediatric discharges from 44 states.
Cutaneous lymphoma was the most expensive skin disease per admission at a mean cost of $58,294, with congenital skin abnormalities second at $24,186, and ulcers third at $17,064. Bacterial skin infections and infestations were only the 19th most expensive admission at $4,135, but it was by far the most common (59,115 admissions) and the most expensive overall, with a total cost of $240 million. The second most common condition was viral diseases with 3,812 admissions and the next most expensive total was $33.5 million for connective tissue disorders, Mr. Arnold and his associates said.
Multivariate models that adjusted for such factors as age, sex, and race revealed that “the risk of hospitalization for skin disease increased as the median income of one’s zip code declined,” the investigators noted. The adjusted odds ratio for hospitalization in the lowest-income quartile (less than $39,000) was 1.22, compared with the highest-income quartile.
Insurance status also affected hospitalization, putting children from families with no insurance (aOR, 1.35) and those on Medicaid (aOR, 1.17) at a disadvantage, compared with those who had private insurance. “Policy makers should consider increasing Medicaid reimbursement rates to outpatient dermatologists, which might encourage more clinicians to accept this form of insurance and thereby expand access to preventative skin care,” they said.
Regional differences also were observed, which put children from the southern states at the highest risk (aOR, 1.32), compared with those in the West, which could be related to access issues. “In 2016, 4 of the 10 communities in the United States with the lowest density of dermatologists were in the South, suggesting that the high rate of hospitalizations there may also be partially attributed to lack of access to dermatologists,” Mr. Arnold and his associates wrote.
The investigators did not report funding or disclose conflicts of interest.
SOURCE: Arnold JD et al. Pediatr Dermatol. 2018 Jul 1. doi: 10.1111/pde.13549.
FROM PEDIATRIC DERMATOLOGY
Key clinical point: Children at the highest risk for dermatology hospitalization lived in communities with the lowest household incomes, were uninsured or on Medicaid, or lived in the South.
Major finding: Admissions for skin diseases cost $379.8 million in 2012, or 1.9% of all spending on pediatric hospitalizations.
Study details: A statistical analysis of the 2012 Kids’ Inpatient Database.
Disclosures: The investigators did not report funding or disclose conflicts of interest.
Source: Arnold JD et al. Pediatr Dermatol. 2018 Jul 1. doi: 10.1111/pde.13549.
Diabetes risk may rise with work hours
Men have a higher risk overall for developing diabetes, 12.2%, compared with 7.5% for women, but the risk for women increases as they work more hours per week, which is not the case for men, according to the results of a 12-year Canadian study that included over 7,000 workers.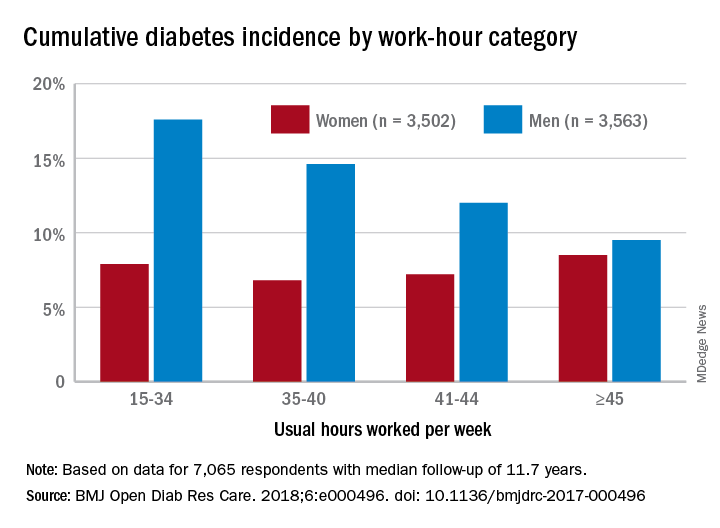
Among the 3,502 women in the study, those who worked 45 or more hours per week had a cumulative diabetes incidence of 8.5% over the median 11.7 years of follow-up. Diabetes incidence was 7.2% for women who worked 41-44 hours a week, 6.8% for those who worked 35-40 hours, and 7.9% among women who worked 15-34 hours weekly, Mahée Gilbert-Ouimet, PhD, of the Institute for Work & Health, Toronto, and her associates reported in BMJ Open Diabetes Research & Care.
For the 3,563 men included in the study, diabetes incidence was 9.5% for those who worked at least 45 hours a week versus 12% for those who worked 41-44 hours, 14.6% for men working 35-40 hours weekly, and 17.6% among those who put in 15-34 hours, the investigators wrote.
Hazard ratios for working 45 or more hours, compared with 35-40 hours, were 1.63 for women and 0.81 for men after adjustment for age, level of education, working conditions, and other factors, although the effect was significant only for women, they noted.
“Considering the rapid and substantial increase of diabetes prevalence in Canada and worldwide, identifying modifiable risk factors, such as long work hours, is of major importance to improve prevention and orient policy making as it could prevent numerous cases of diabetes and diabetes-related chronic diseases,” Dr. Gilbert-Ouimet and her associates wrote.
The study was supported by the Canadian Institutes of Health Research and by the Institute for Clinical Evaluative Sciences, which is funded by an annual grant from the Ontario Ministry of Health and Long-Term Care. None of the investigators declared any conflicts of interest.
SOURCE: Gilbert-Ouimet M et al. BMJ Open Diab Res Care. 2018. doi: 10.1136/bmjdrc-2017-000496.
FROM BMJ OPEN DIABETES RESEARCH & CARE
Death rates rising for 10- to 19-year-olds
Mortality in this age group, which had dropped nearly 33% from 1999 to 2013, climbed from 29.6 per 100,000 population aged 10-19 years in 2013 to 33.1 per 100,000 in 2016, the last year for which data are available. Meanwhile, deaths from injuries – unintentional injuries, suicides, homicides, and legal intervention – went from 19.8 per 100,000 to 23.3, an increase of almost 18%, from 2013 to 2016, and the noninjury death rate “was relatively stable,” Sally C. Curtin and her associates at the NCHS Division of Vital Statistics said in a National Vital Statistics Report.
The recent surge in injury deaths was more substantial in the older half of the age group. The mortality rate for children aged 10-14 years went from a low of 6.4 per 100,000 in 2012 to 7.1 in 2016, an increase of 11%, while the rate for those aged 15-19 rose 19% as it jumped from 32.8 per 100,000 in 2013 to 39.0 in 2016, the investigators wrote in the report.
The rate of unintentional injury deaths in 10- to 19-year-olds shows the same pattern as all deaths and injury deaths: Decline from 1999 to 2013 and then a rise for the last 3 years. That recent rise also can be seen in the most common form of unintentional injury deaths, motor vehicle traffic accidents, and in poisoning deaths, although that uptick began a year later. Homicide deaths declined by one-third from 2007 to 2014 and then increased, while suicide rates have been rising since 2007, the investigators said. Legal intervention deaths, defined as those caused by law enforcement actions, were not included because of relatively small annual numbers.
“Although progress was made in reducing injury deaths among children and adolescents aged 10-19 years during 1999-2013, the recent upturn shows that persistent as well as emerging challenges remain. … Further reductions will require renewed focus and effort,” Ms. Curtin and her associates wrote.
SOURCE: Curtin SC et al. Natl Vital Stat Rep. 2018 Jun;67(4):1-16.
FROM NATIONAL VITAL STATISTICS REPORTS