User login
Richard Franki is the associate editor who writes and creates graphs. He started with the company in 1987, when it was known as the International Medical News Group. In his years as a journalist, Richard has worked for Cap Cities/ABC, Disney, Harcourt, Elsevier, Quadrant, Frontline, and Internet Brands. In the 1990s, he was a contributor to the ill-fated Indications column, predecessor of Livin' on the MDedge.
Medicare donut hole: Fewer enrollees, more spending in 2016

Those 5.2 million enrollees in 2016 represented a reversal from the rising number of those reaching the coverage-gap over the last 3 years and the potential start of a trend toward increasing out-of-pocket costs. The number of part D enrollees without low-income subsidies (the coverage gap does not apply to those who receive the subsidies) had risen from 2013 to 2015 after being fairly stable from 2007 to 2012. The average out-of-pocket cost for enrollees with low-income subsidies, on the other hand, dropped by 20% in 2011 – from $1,858 to $1,485 – with a smaller drop in 2013 before two consecutive years of increases in 2015 and 2016, Kaiser reported.
“As of 2019, there will no longer be a coverage gap for brand-name drugs, as a result of changes in the” Bipartisan Budget Act of 2018, which reduced enrollees’ share of costs and increased the manufacturer discount, Kaiser explained, but a proposal from the Trump administration “to exclude the manufacturer discount from the calculation of out-of-pocket spending would substantially increase part D enrollees’ out-of-pocket costs and would lead to fewer enrollees qualifying for catastrophic coverage.”
Study examines the world of alcohol use
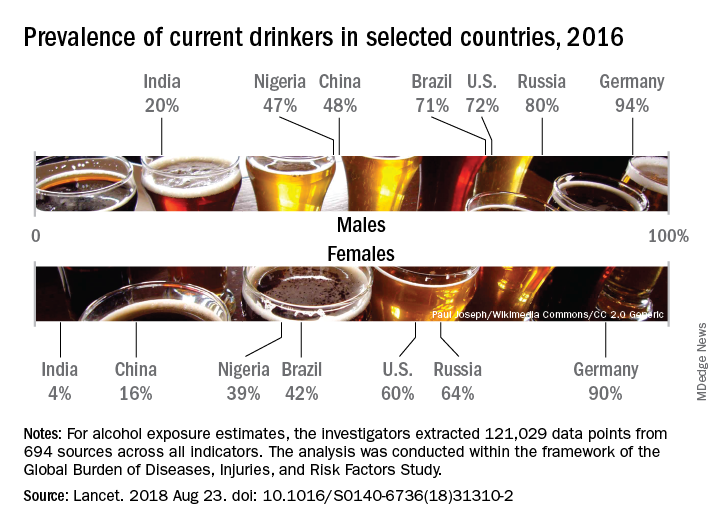
Considerable variations were seen in alcohol consumption. In 2016, males overall consumed more than twice as many standard drinks per day as females: 1.70 versus 0.73. Alcohol consumption in those aged 15-95 years was highest in the top quintile of countries according to sociodemographic development for both males (2.9 drinks per day) and females (1.9) and lowest in the bottom quintile of countries for males (1.4) and the second-lowest quintile for females (0.3), Max G. Griswold, MA, of the University of Washington, Seattle, and his associates said in the Lancet.
Denmark had the highest prevalence of current drinkers of any country for both males (97%) and females (95%) in 2016; Pakistan was lowest for males (0.8%) and Bangladesh was lowest for females (0.3%). The United States had a prevalence of 72% for males and 60% for females, along with consumption rates of 3.2 drinks per day for males and 1.9 for females. Alcohol-related diseases caused 6.7% of male deaths and 2.3% of female deaths in the United States, both close to the global numbers of 6.8% for males and 2.2% for females, the investigators said.
The analysis, conducted within the framework of the Global Burden of Diseases, Injuries, and Risk Factors Study, showed that even a single alcoholic drink a day increases the risk of developing 1 of the 23 alcohol-related health problems by 0.5% a year for people aged 15-95 years, which translates into a rate of 918 per 100,000 population, compared with 914 per 100,000 for nondrinkers. Consuming two drinks a day raises the risk to 7%, which would be an incidence of 977 per 100,000, and those who have five drinks a day increase their risk by 37%, which works out to 1,252 people per 100,000 who would develop an alcohol-related disease, Mr. Griswold and his associates said.
In an editorial comment, Robyn Burton, PhD, of King’s College London and Nick Sheron, MD, of the University of Southampton (England), wrote that “the conclusions of the study are clear and unambiguous: Alcohol is a colossal global health issue and small reductions in health-related harms at low levels of alcohol intake are outweighed by the increased risk of other health-related harms, including cancer. … These diseases of unhealthy behaviors, facilitated by unhealthy environments and fueled by commercial interests putting shareholder value ahead of the tragic human consequences, are the dominant health issue of the 21st century. The solutions are straightforward: Increasing taxation creates income for hard-pressed health ministries, and reducing the exposure of children to alcohol marketing has no downsides.”
The study was funded by the Bill and Melinda Gates Foundation. Mr. Griswold did not have any conflicts to disclose, but six of his several hundred coauthors did make such disclosures.
SOURCE: Griswold MG et al. Lancet. 2018 Aug 23. doi: 10.1016/S0140-6736(18)31310-2.
FROM THE LANCET
Earnings gap seen among Maryland physicians
Male physicians in Maryland reported higher earnings than did female physicians, even when they all worked 41 or more hours a week, according to a 2018 survey of physicians in the state.
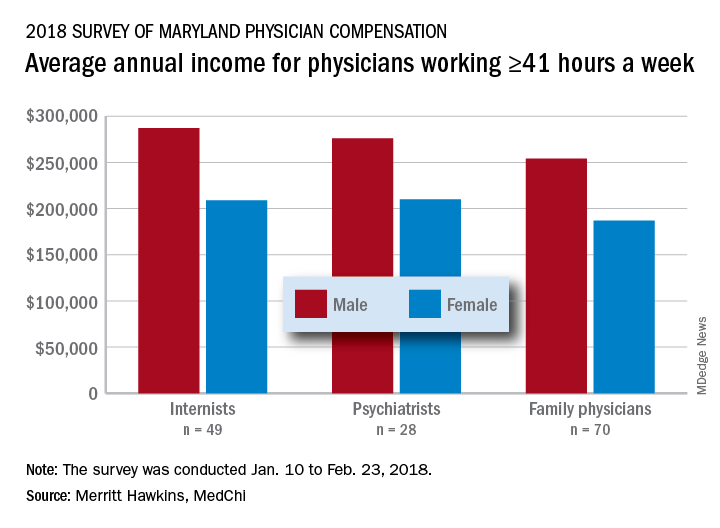
The average pretax income for all 508 respondents was $299,000 in 2016: Male physicians (66.6% of the sample) had an average of $335,000 and women averaged 33% lower at $224,000, MedChi (the Maryland State Medical Society) and Merritt Hawkins reported on July 31. Men did report working a longer week: Their average of 50.5 hours was 11% more than the 45.4-hour average for women.
“The biggest disparities we see in compensation are between male and female physicians in Maryland,” Gene Ransom, MedChi’s chief executive officer, said in a written statement. “Though such disparities have been noted in other research, it is still surprising to see the extent to which they persist.”
Of the respondents who worked an average of 41 or more hours per week – an analysis conducted only for the three largest specialties in the survey – female internists earned 27% less than their male counterparts, female psychiatrists earned 24% less, and female family physicians earned 26% less, the survey results showed.
Earnings were structured somewhat differently for Maryland’s male and female physicians. Women were more likely to be compensated in the form of a straight salary than men (35.0% vs. 30.3%), and men were more likely to paid based on production (22.7% vs. 16.9%) or in the form of an income guarantee (0.9% vs. 0.0%). Proportions receiving a salary with a production bonus were 42.7% for men and 42.5% for women, according to the survey.
The survey was commissioned by MedChi and conducted by Merritt Hawkins from Jan. 10 to Feb. 23, 2018. The margin of error was plus or minus 4.4%.
Male physicians in Maryland reported higher earnings than did female physicians, even when they all worked 41 or more hours a week, according to a 2018 survey of physicians in the state.
The average pretax income for all 508 respondents was $299,000 in 2016: Male physicians (66.6% of the sample) had an average of $335,000 and women averaged 33% lower at $224,000, MedChi (the Maryland State Medical Society) and Merritt Hawkins reported on July 31. Men did report working a longer week: Their average of 50.5 hours was 11% more than the 45.4-hour average for women.
“The biggest disparities we see in compensation are between male and female physicians in Maryland,” Gene Ransom, MedChi’s chief executive officer, said in a written statement. “Though such disparities have been noted in other research, it is still surprising to see the extent to which they persist.”
Of the respondents who worked an average of 41 or more hours per week – an analysis conducted only for the three largest specialties in the survey – female internists earned 27% less than their male counterparts, female psychiatrists earned 24% less, and female family physicians earned 26% less, the survey results showed.
Earnings were structured somewhat differently for Maryland’s male and female physicians. Women were more likely to be compensated in the form of a straight salary than men (35.0% vs. 30.3%), and men were more likely to paid based on production (22.7% vs. 16.9%) or in the form of an income guarantee (0.9% vs. 0.0%). Proportions receiving a salary with a production bonus were 42.7% for men and 42.5% for women, according to the survey.
The survey was commissioned by MedChi and conducted by Merritt Hawkins from Jan. 10 to Feb. 23, 2018. The margin of error was plus or minus 4.4%.
Feds take baseline on EHR interoperability
Office-based physicians who have electronic health records are most likely to send patient health information (PHI) in the form of referrals and laboratory results and receive it as lab results and imaging reports, according to national estimates of electronic PHI using four aspects of interoperability.
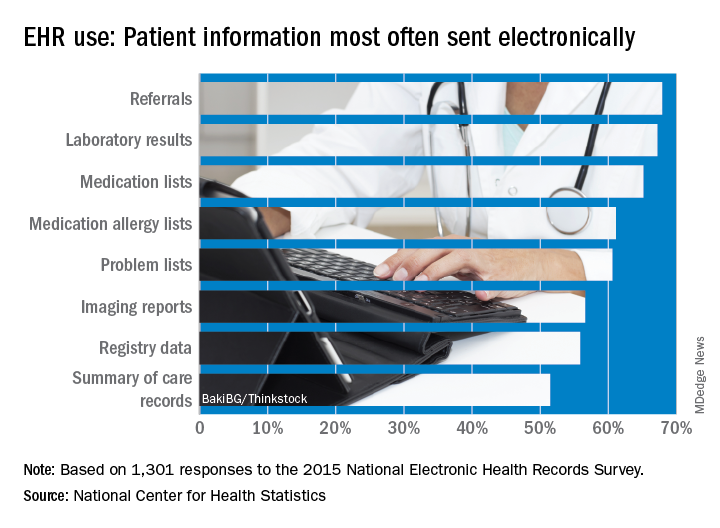
Those aspects of sharing PHI are sending, receiving, integrating, and searching. With federal estimates of EHR adoption at 78% for office-based physicians, data from the 2015 National Electronic Health Records Just over 65% are sending medication lists electronically, 61% are sending medication allergy lists, and almost 61% are sending problem lists, Ninee S. Yang, PhD, and her associates at the Centers for Disease Control and Prevention said in National Health Statistics Reports.
Communication in the other direction showed a somewhat different distribution. Of the 1,525 physicians who reported receiving PHI electronically, 79% were the recipients of laboratory results, with imaging reports well behind at 61%, followed by medication lists and referrals at 54% and summary of care records at 52%, the investigators reported.
The ability to integrate information into an EHR – reported by 959 survey respondents – is another key element of interoperability, and 73% of those physicians said that they could integrate lab results into their systems. Other types of PHI, however, did not fare as well: imaging reports came in at 50%, hospital discharge summaries at 49%, summary of care records at 41%, and emergency department notifications at 40%, Dr. Yang and her associates said.
The fourth aspect of interoperability, ability to search for PHI from sources outside the practice, was reported by 1,335 respondents in 2015, with 90% looking for medication lists, 88% for medication allergy lists, 80% for hospital discharge summaries, 59% for imaging reports, and 49% for lab results, they said.
These first national estimates of PHI type will be used as baseline data “in tracking progress outlined in the federal plan for achieving interoperability” among physicians with EHR systems, Dr. Yang and her associates wrote.
SOURCE: Yang NS et al. Natl Health Stat Report. 2018 Aug 15;(115):1-9.
Office-based physicians who have electronic health records are most likely to send patient health information (PHI) in the form of referrals and laboratory results and receive it as lab results and imaging reports, according to national estimates of electronic PHI using four aspects of interoperability.
Those aspects of sharing PHI are sending, receiving, integrating, and searching. With federal estimates of EHR adoption at 78% for office-based physicians, data from the 2015 National Electronic Health Records Just over 65% are sending medication lists electronically, 61% are sending medication allergy lists, and almost 61% are sending problem lists, Ninee S. Yang, PhD, and her associates at the Centers for Disease Control and Prevention said in National Health Statistics Reports.
Communication in the other direction showed a somewhat different distribution. Of the 1,525 physicians who reported receiving PHI electronically, 79% were the recipients of laboratory results, with imaging reports well behind at 61%, followed by medication lists and referrals at 54% and summary of care records at 52%, the investigators reported.
The ability to integrate information into an EHR – reported by 959 survey respondents – is another key element of interoperability, and 73% of those physicians said that they could integrate lab results into their systems. Other types of PHI, however, did not fare as well: imaging reports came in at 50%, hospital discharge summaries at 49%, summary of care records at 41%, and emergency department notifications at 40%, Dr. Yang and her associates said.
The fourth aspect of interoperability, ability to search for PHI from sources outside the practice, was reported by 1,335 respondents in 2015, with 90% looking for medication lists, 88% for medication allergy lists, 80% for hospital discharge summaries, 59% for imaging reports, and 49% for lab results, they said.
These first national estimates of PHI type will be used as baseline data “in tracking progress outlined in the federal plan for achieving interoperability” among physicians with EHR systems, Dr. Yang and her associates wrote.
SOURCE: Yang NS et al. Natl Health Stat Report. 2018 Aug 15;(115):1-9.
FROM NATIONAL HEALTH STATISTICS REPORTS
Cosmetic surgery patients want beauty ... and more
but motives involving mental and social well-being and physical health are common as well, according to a prospective national study involving more than 500 patients.
“Cosmetic procedures may also be necessary to correct significant physical disfigurement interfering with work or daily living. Most patients were concerned with how they looked at work and in protecting their physical health, and for some, this motive was the most important. Together, these data add to the growing body of evidence that treatments aimed at improving physical appearance can treat significant physical and psychological illness,” Amanda L. Maisel, of Northwestern University, Chicago, and her associates wrote in JAMA Dermatology.
Among the motives related to appearance, 88.5% of patients said that they “wanted to look better, prettier, or more attractive for themselves,” compared with 64.4% who wanted to look good for others. Patients also were interested in “looking younger or fresher” (83.4%) and having “clear-looking or beautiful skin” (81.4%), the investigators said.
The most common mental or emotional motive was increased self-confidence (69.5%), followed by the desire to “feel happier or better overall or improve quality of life” at 67.2% and to “treat oneself, feel rewarded, or celebrate” at 61.3%. As for social well-being, 56.6% of patients “reported wanting to look good when running into people they knew” and 50.3% reported that they wanted “to feel less self-conscious around others.”
The leading motive involving physical health was “preventing worsening of their condition/symptoms,” which was reported by 53.3% of patients, the investigators reported.
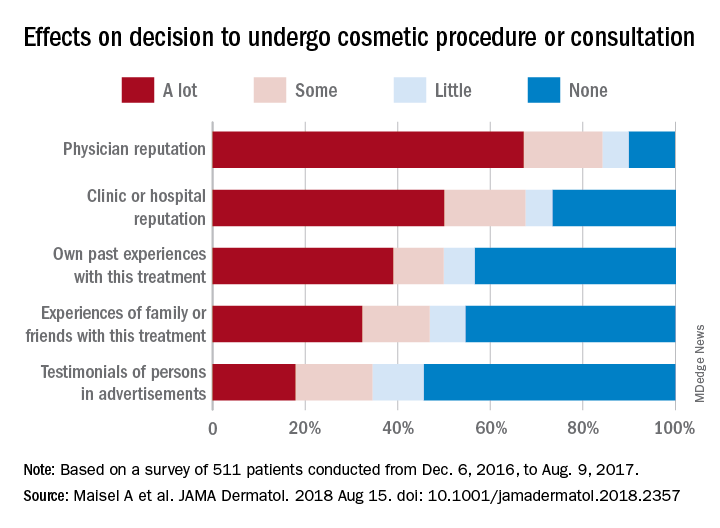
They also examined how reputation and experience influenced patients’ decision to have cosmetic surgery. When asked to what degree a physician’s reputation affected their decision, 67.2% of respondents said a lot, 17% said that it had some effect, 5.7% said it had little effect, and 10% said none. Half of the patients surveyed said the clinic or hospital’s reputation had a lot of influence on their decision, compared with 39% for their own past experiences, 32.2% for experiences of family or friends, and 17.9% for testimonials of persons in advertisements, the researchers said.
The survey was conducted from Dec. 4, 2016, to Aug. 9, 2017, at 2 academic and 11 private dermatology practices. A total of 511 patients were involved, although not all individuals answered every question, so sample sizes varied. The study was supported by a research grant from the American Society for Dermatologic Surgery. The senior investigator reported consulting for Pulse Biosciences that was unrelated to this research and being principal investigator for studies funded in part by Regeneron.
SOURCE: Maisel A et al. JAMA Dermatol. 2018 Aug 15. doi: 10.1001/jamadermatol.2018.2357.
but motives involving mental and social well-being and physical health are common as well, according to a prospective national study involving more than 500 patients.
“Cosmetic procedures may also be necessary to correct significant physical disfigurement interfering with work or daily living. Most patients were concerned with how they looked at work and in protecting their physical health, and for some, this motive was the most important. Together, these data add to the growing body of evidence that treatments aimed at improving physical appearance can treat significant physical and psychological illness,” Amanda L. Maisel, of Northwestern University, Chicago, and her associates wrote in JAMA Dermatology.
Among the motives related to appearance, 88.5% of patients said that they “wanted to look better, prettier, or more attractive for themselves,” compared with 64.4% who wanted to look good for others. Patients also were interested in “looking younger or fresher” (83.4%) and having “clear-looking or beautiful skin” (81.4%), the investigators said.
The most common mental or emotional motive was increased self-confidence (69.5%), followed by the desire to “feel happier or better overall or improve quality of life” at 67.2% and to “treat oneself, feel rewarded, or celebrate” at 61.3%. As for social well-being, 56.6% of patients “reported wanting to look good when running into people they knew” and 50.3% reported that they wanted “to feel less self-conscious around others.”
The leading motive involving physical health was “preventing worsening of their condition/symptoms,” which was reported by 53.3% of patients, the investigators reported.
They also examined how reputation and experience influenced patients’ decision to have cosmetic surgery. When asked to what degree a physician’s reputation affected their decision, 67.2% of respondents said a lot, 17% said that it had some effect, 5.7% said it had little effect, and 10% said none. Half of the patients surveyed said the clinic or hospital’s reputation had a lot of influence on their decision, compared with 39% for their own past experiences, 32.2% for experiences of family or friends, and 17.9% for testimonials of persons in advertisements, the researchers said.
The survey was conducted from Dec. 4, 2016, to Aug. 9, 2017, at 2 academic and 11 private dermatology practices. A total of 511 patients were involved, although not all individuals answered every question, so sample sizes varied. The study was supported by a research grant from the American Society for Dermatologic Surgery. The senior investigator reported consulting for Pulse Biosciences that was unrelated to this research and being principal investigator for studies funded in part by Regeneron.
SOURCE: Maisel A et al. JAMA Dermatol. 2018 Aug 15. doi: 10.1001/jamadermatol.2018.2357.
FROM JAMA DERMATOLOGY
COPD opposites: Utah and West Virginia
New estimates of chronic obstructive pulmonary disease (COPD) may have Utah residents breathing a sigh of relief. West Virginians, not so much.
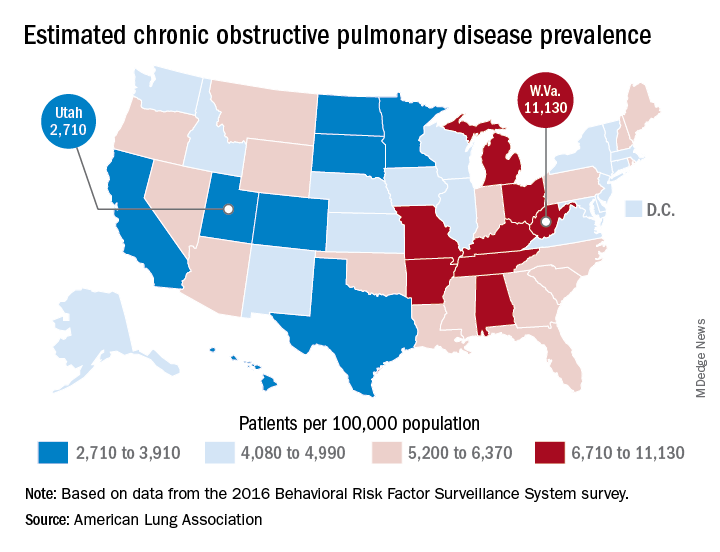
The Beehive State has the lowest prevalence of COPD in the country at 2,710 per 100,000 population, while the Mountain State tops the charts at 11,130 per 100,000, according to estimates from the American Lung Association. (Crude rates were calculated by MDedge News using the ALA’s estimates for total persons with COPD in each state and Census Bureau estimates for population.)
Other states with freer-breathing residents include Minnesota, which was just behind Utah with an estimated rate of 3,000 per 100,000 population, Hawaii (3,182), Colorado (3,334), and California (3,409). West Virginia’s rate, however, seems to be an outlier. The state with the next-highest rate, Kentucky, has a calculated prevalence of 8,890 per 100,000 population, followed by Tennessee at 7,880, Alabama at 7,400, and Arkansas at 7,330, using the ALA’s estimates, which were based on data from the 2016 Behavioral Risk Factor Surveillance System survey.
New estimates of chronic obstructive pulmonary disease (COPD) may have Utah residents breathing a sigh of relief. West Virginians, not so much.
The Beehive State has the lowest prevalence of COPD in the country at 2,710 per 100,000 population, while the Mountain State tops the charts at 11,130 per 100,000, according to estimates from the American Lung Association. (Crude rates were calculated by MDedge News using the ALA’s estimates for total persons with COPD in each state and Census Bureau estimates for population.)
Other states with freer-breathing residents include Minnesota, which was just behind Utah with an estimated rate of 3,000 per 100,000 population, Hawaii (3,182), Colorado (3,334), and California (3,409). West Virginia’s rate, however, seems to be an outlier. The state with the next-highest rate, Kentucky, has a calculated prevalence of 8,890 per 100,000 population, followed by Tennessee at 7,880, Alabama at 7,400, and Arkansas at 7,330, using the ALA’s estimates, which were based on data from the 2016 Behavioral Risk Factor Surveillance System survey.
More deliveries now include opioid use disorder
according to the Centers for Disease Control and Prevention.
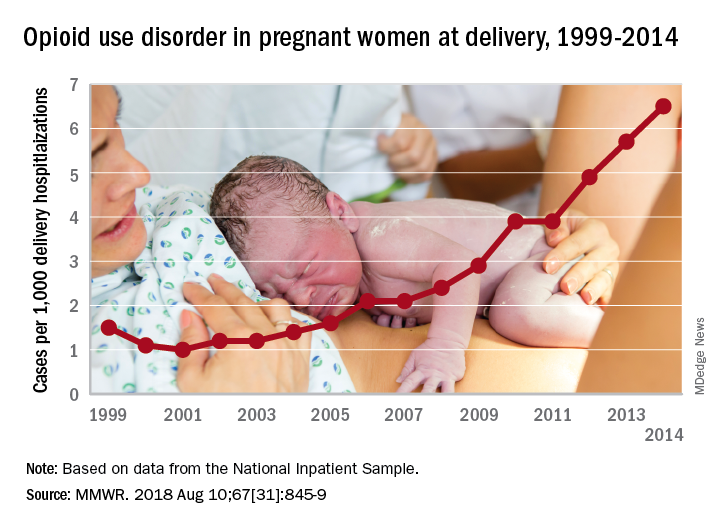
The national prevalence of opioid use disorder increased by 333% as it went from 1.5 cases per 1,000 delivery hospitalizations in 1999 to 6.5 cases per 1,000 in 2014. At the state level, there were significant increases in all 28 states with data available for at least 3 consecutive years during the study period, Sarah C. Haight, MPH, and her associates at the CDC in Atlanta said in the Morbidity and Mortality Weekly Report.
Average annual rate changes for those states ranged from a low of 0.01 per 1,000 delivery hospitalizations per year in California to 5.37 per year in Vermont, with the national rate change coming in at 0.39 per year. Of the 14 states with data available in 1999, Iowa had the lowest rate at 0.1 per 1,000 deliveries and Maryland had the highest at 8.2. In 2014, when data were available for 26 states and the District of Columbia, the highest rate was Vermont’s 48.6 per 1,000 deliveries and the lowest was 0.7 in Washington, D.C., the investigators reported.
Although “increasing trends might represent actual increases in prevalence or improved screening and diagnosis,” Ms. Haight and her associates added that “these estimates also correlate with state opioid prescribing rates in the general population. West Virginia, for example, had a prescribing rate estimated at 138 opioid prescriptions per 100 persons in 2012.”
“These findings illustrate the devastating impact of the opioid epidemic on families across the U.S., including on the very youngest,” said CDC Director Robert R. Redfield, MD. “Untreated opioid use disorder during pregnancy can lead to heartbreaking results. Each case represents a mother, a child, and a family in need of continued treatment and support.”
Data for the analysis came from the Agency for Healthcare Research and Quality’s National Inpatient Sample and State Inpatient Databases.
SOURCE: Haight SC et al. MMWR. 2018 Aug 10;67[31]:845-9.
according to the Centers for Disease Control and Prevention.
The national prevalence of opioid use disorder increased by 333% as it went from 1.5 cases per 1,000 delivery hospitalizations in 1999 to 6.5 cases per 1,000 in 2014. At the state level, there were significant increases in all 28 states with data available for at least 3 consecutive years during the study period, Sarah C. Haight, MPH, and her associates at the CDC in Atlanta said in the Morbidity and Mortality Weekly Report.
Average annual rate changes for those states ranged from a low of 0.01 per 1,000 delivery hospitalizations per year in California to 5.37 per year in Vermont, with the national rate change coming in at 0.39 per year. Of the 14 states with data available in 1999, Iowa had the lowest rate at 0.1 per 1,000 deliveries and Maryland had the highest at 8.2. In 2014, when data were available for 26 states and the District of Columbia, the highest rate was Vermont’s 48.6 per 1,000 deliveries and the lowest was 0.7 in Washington, D.C., the investigators reported.
Although “increasing trends might represent actual increases in prevalence or improved screening and diagnosis,” Ms. Haight and her associates added that “these estimates also correlate with state opioid prescribing rates in the general population. West Virginia, for example, had a prescribing rate estimated at 138 opioid prescriptions per 100 persons in 2012.”
“These findings illustrate the devastating impact of the opioid epidemic on families across the U.S., including on the very youngest,” said CDC Director Robert R. Redfield, MD. “Untreated opioid use disorder during pregnancy can lead to heartbreaking results. Each case represents a mother, a child, and a family in need of continued treatment and support.”
Data for the analysis came from the Agency for Healthcare Research and Quality’s National Inpatient Sample and State Inpatient Databases.
SOURCE: Haight SC et al. MMWR. 2018 Aug 10;67[31]:845-9.
FROM MMWR
Ranked: State of the states’ health care
In the wild world of health care rankings, a year can make a big difference … or not.
Iowa fell from second to ninth over the course of the last year while Connecticut and South Dakota moved out of the top 10 to make way for Colorado and Maryland, according to WalletHub.
There was less movement at the other end of the rankings, however, with no change at all in the bottom five: Louisiana finished 51st again (the rankings include the District of Columbia), preceded by fellow repeaters Mississippi (50), Alaska (49), Arkansas (48), and North Carolina (47). Texas and Nevada did manage to move on up out of the bottom 11 – to 38th and 40th, respectively – at the expense of Oklahoma and Tennessee, WalletHub reported.
For 2018, the company compared the states and D.C. “across 40 measures of cost, accessibility and outcome,” which is five more measures than last year and a possible explanation for the changes at the top. The cost dimension’s five metrics included cost of medical visits and share of high out-of-pocket medical spending. The accessibility dimension consisted of 21 metrics, including average emergency department wait time and share of insured children. The outcomes dimension included 14 metrics, among them maternal mortality rate and share of adults with type 2 diabetes.
Vermont did well in both the outcomes (first) and cost (third) dimensions but only middle of the pack (23rd) in access. The District of Columbia was ranked first in cost and Maine was the leader in access. The lowest-ranked states in each category were Alaska (cost), Texas (access), and Mississippi (outcomes), according to the WalletHub analysis, which was based on data from such sources as the Centers for Disease Control and Prevention, the Health Resources & Services Administration, and the United Health Foundation.
PhRMA spending leads health-sector lobbying efforts
The Pharmaceutical Research and Manufacturers of America (PhRMA) led the way on health-sector lobbying in the first half of 2018 with spending that’s on pace to top its previous 1-year high, according to the Center for Responsive Politics.
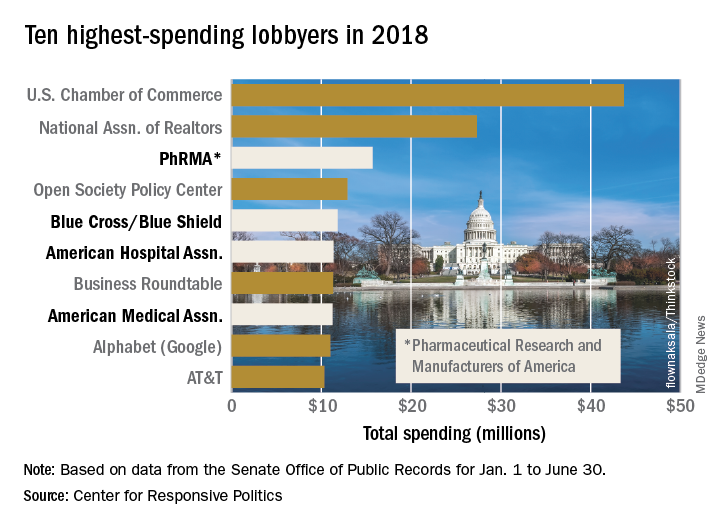
PhRMA spent over $15.7 million on lobbying through the end of June, and equaling that amount over the second half of the year would eclipse the $27.4 million the organization spent in 2009. PhRMA’s total for the year so far puts it third among all entities: The U.S. Chamber of Commerce was first with $43.7 million and the National Association of Realtors was second at $27.3 million, the center reported on OpenSecrets.org. The National Association of Realtors has been second in spending every year since 2012, and the chamber has been first every year since 2001.
The health sector’s three other representatives in the lobbying Top 10 for the first half of this year are Blue Cross/Blue Shield in fifth with $11.8 million in spending, the American Hospital Association in sixth ($11.4 million), and the American Medical Association in eighth ($11.2 million), based on the center’s analysis of data from the Senate Office of Public Records. The four current health sector representatives have all been in the top 10 every year since 2013.
Total spending for the health sector through June was $290.3 million, which was first among the 13 sectors into which the center separates the U.S. economy; spending for lobbying among all sectors was $1.69 billion. The health sector was ranked first in spending each of the 2 previous years and has never been lower than third since the center’s record keeping began in 2000, according to OpenSecrets.org.
The Pharmaceutical Research and Manufacturers of America (PhRMA) led the way on health-sector lobbying in the first half of 2018 with spending that’s on pace to top its previous 1-year high, according to the Center for Responsive Politics.
PhRMA spent over $15.7 million on lobbying through the end of June, and equaling that amount over the second half of the year would eclipse the $27.4 million the organization spent in 2009. PhRMA’s total for the year so far puts it third among all entities: The U.S. Chamber of Commerce was first with $43.7 million and the National Association of Realtors was second at $27.3 million, the center reported on OpenSecrets.org. The National Association of Realtors has been second in spending every year since 2012, and the chamber has been first every year since 2001.
The health sector’s three other representatives in the lobbying Top 10 for the first half of this year are Blue Cross/Blue Shield in fifth with $11.8 million in spending, the American Hospital Association in sixth ($11.4 million), and the American Medical Association in eighth ($11.2 million), based on the center’s analysis of data from the Senate Office of Public Records. The four current health sector representatives have all been in the top 10 every year since 2013.
Total spending for the health sector through June was $290.3 million, which was first among the 13 sectors into which the center separates the U.S. economy; spending for lobbying among all sectors was $1.69 billion. The health sector was ranked first in spending each of the 2 previous years and has never been lower than third since the center’s record keeping began in 2000, according to OpenSecrets.org.
E-cigarettes: Prices down, sales up
Any economist could have predicted it: As the .
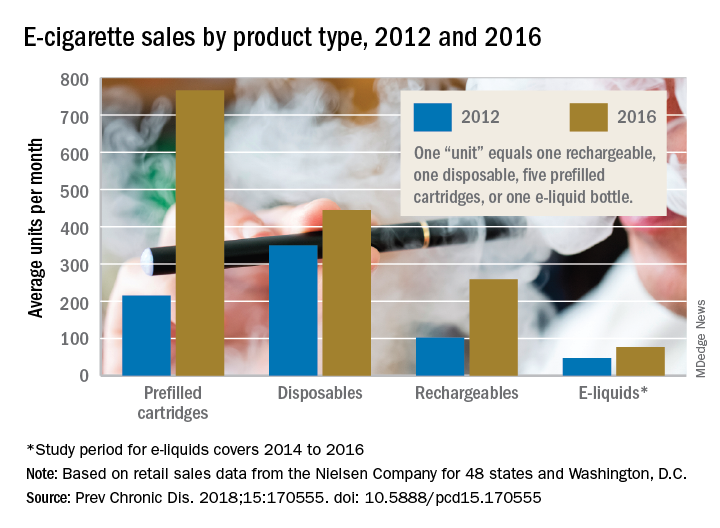
The average prices of three mutually exclusive e-cigarette products – rechargeable devices, disposable devices, and disposable cartridges filled with e-liquid – all dropped from 2012 to 2016, as did that of a fourth product – e-liquid bottles for filling reusable cartridges – not available nationwide until 2014. At the same time, average monthly sales for e-cigarette products overall rose by a statistically significant 132%, Teresa W. Wang, PhD, of the Centers for Disease Control and Prevention, Atlanta, and her associates reported in Preventing Chronic Disease.
Sales of prefilled cartridges, the most popular product by the end of the study period, increased 256%, going from 215 units per 100,000 people each month in 2012 to 766 units. [For the study, a unit was defined as one rechargeable, one disposable, one pack of five prefilled cartridges, or one bottle of e-liquid.] Disposables were the most popular product at the start of the study period but had the smallest relative increase (27%), while monthly sales of rechargeables jumped by 154% and e-liquids saw a 64% rise, the investigators said.
Price decreases for the three products available in 2012 were all significant: The average price per unit was down 48% for rechargeables by 2016, 14% for disposables, and 12% for prefilled cartridges. E-liquids were 9% cheaper by 2016, but that change did not reach significance, they noted.
“Overall, the increase in e-cigarette sales and decrease in price is consistent with previous studies demonstrating that e-cigarette sales are responsive to their own price changes. These trends suggest that, if e-cigarette prices continue to decrease, their sales may also continue to rise,” Dr. Wang and her associates wrote.
The data for the study came from the Nielsen Company and were based on retail sales at convenience stores; supermarkets; drug, dollar, and club stores; and military commissaries in the 48 contiguous states and Washington, D.C. One study limitation was the lack of data from tobacco/vape shops and the Internet.
SOURCE: Wang TW et al. Prev Chronic Dis. 2018;15:170555. doi: 10.5888/pcd15.170555.
Any economist could have predicted it: As the .
The average prices of three mutually exclusive e-cigarette products – rechargeable devices, disposable devices, and disposable cartridges filled with e-liquid – all dropped from 2012 to 2016, as did that of a fourth product – e-liquid bottles for filling reusable cartridges – not available nationwide until 2014. At the same time, average monthly sales for e-cigarette products overall rose by a statistically significant 132%, Teresa W. Wang, PhD, of the Centers for Disease Control and Prevention, Atlanta, and her associates reported in Preventing Chronic Disease.
Sales of prefilled cartridges, the most popular product by the end of the study period, increased 256%, going from 215 units per 100,000 people each month in 2012 to 766 units. [For the study, a unit was defined as one rechargeable, one disposable, one pack of five prefilled cartridges, or one bottle of e-liquid.] Disposables were the most popular product at the start of the study period but had the smallest relative increase (27%), while monthly sales of rechargeables jumped by 154% and e-liquids saw a 64% rise, the investigators said.
Price decreases for the three products available in 2012 were all significant: The average price per unit was down 48% for rechargeables by 2016, 14% for disposables, and 12% for prefilled cartridges. E-liquids were 9% cheaper by 2016, but that change did not reach significance, they noted.
“Overall, the increase in e-cigarette sales and decrease in price is consistent with previous studies demonstrating that e-cigarette sales are responsive to their own price changes. These trends suggest that, if e-cigarette prices continue to decrease, their sales may also continue to rise,” Dr. Wang and her associates wrote.
The data for the study came from the Nielsen Company and were based on retail sales at convenience stores; supermarkets; drug, dollar, and club stores; and military commissaries in the 48 contiguous states and Washington, D.C. One study limitation was the lack of data from tobacco/vape shops and the Internet.
SOURCE: Wang TW et al. Prev Chronic Dis. 2018;15:170555. doi: 10.5888/pcd15.170555.
FROM PREVENTING CHRONIC DISEASE