User login
Richard Franki is the associate editor who writes and creates graphs. He started with the company in 1987, when it was known as the International Medical News Group. In his years as a journalist, Richard has worked for Cap Cities/ABC, Disney, Harcourt, Elsevier, Quadrant, Frontline, and Internet Brands. In the 1990s, he was a contributor to the ill-fated Indications column, predecessor of Livin' on the MDedge.
Confirmed: Growth in overdose deaths is exponential
Overdose death rates for individual drugs show no particular patterns since the turn of the century, but the exponential growth of overall drug mortality actually started before the opioid epidemic, according to an analysis of almost 600,000 unintentional overdose deaths since 1979.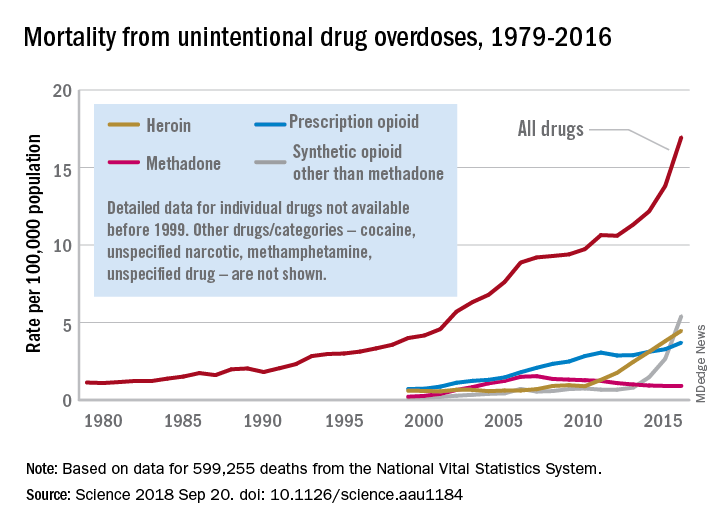
“The current epidemic of overdose deaths due to prescription opioids, heroin, and fentanyl appears to be the most recent manifestation of a more fundamental, longer-term process,” senior author Donald S. Burke, MD, of the University of Pittsburgh, said in a written statement.
Overdose mortality from all types of drugs rose from 1.13 per 100,000 population in 1979 to 16.96 per 100,000 in 2016, based on data for 599,255 deaths from unintentional drug overdoses in the National Vital Statistics System, they reported in Science.
When the investigators plotted annual drug overdose mortality over that 38-year period, they saw a smooth upward exponential curve with a doubling time of about 9 years. “This remarkably smooth, long-term epidemic growth pattern really caught our attention,” Dr. Burke said. “If we can figure it out, we should be able to bend that curve downward.”
The individual drug types that make up the whole, however, are a different story. “There is no regular or predictable pattern to the overdose rates for any of these drugs. Cocaine overdose death rates curved down and up and down and back up over the past 20 years. Methadone deaths have been on a downturn since the mid-2000s. Prescription opioids have been on a fairly steady, steep climb. Heroin deaths shot up in 2010, followed in 2013 by synthetic opioids, such as fentanyl,” lead author Hawre Jalal, MD, PhD, also of the university, said in the statement.
Geographic and demographic analyses produced the same absence of patterns. the researchers wrote.
The study was supported by grants from the Centers for Disease Control and Prevention and the Robert Wood Johnson Foundation. The investigators said they have no competing interests.
SOURCE: Jalal H et al. Science 2018 Sep 20. doi: 10.1126/science.aau1184.
FROM SCIENCE
HIV patients getting younger ... and older
Men who have sex with men (MSM) were younger at HIV diagnosis in 2016 than in 2008, but those living with the disease were older, according to the Centers for Disease Control and Prevention.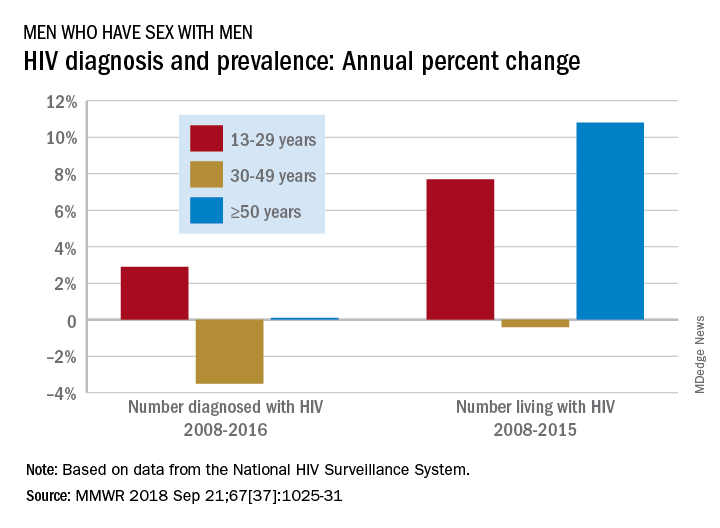
Among MSM aged 13-29 years, the number diagnosed with HIV increased by 2.9% per year from 2008 to 2016 but dropped 3.5% per year for those aged 30-49 and rose just 0.1% annually among those aged 50 and older. Over the period from 2008 to 2015, the number of MSM aged 50 and older who were living with HIV increased by 10.8% per year, compared with an annual percent change of 7.7% for those aged 13-29 and –0.4% for those aged 30-49, Andrew Mitsch, MPH, and his associates at the CDC’s National Center for HIV/AIDS, Viral Hepatitis, STD, and TB Prevention reported in Morbidity and Mortality Weekly Report.
The size of the population of MSM living with HIV went from 384,000 in 2008 to 523,000 in 2016, with 13- to 29-year-olds going from 10.7% of the population to 13.3%, 30- to 49-year-olds dropping from 61% to 44%, and the 50-and-older group increasing from 28.3% to 42.7%, they said.
“The increase in annual diagnosis of HIV infections among younger MSM might reflect increased HIV testing, in addition to ongoing transmission,” they suggested, and increased prevalence among older men is probably the “result of increased survival associated with widespread use of antiretroviral therapy, surviving middle age, and advancing to the older group.”
The investigators also noted the persistence of racial/ethnic disparities over the course of the study. Among the three largest groups, whites had the smallest increase in new diagnoses for 13- to 29-year-olds and the largest decrease for 30- to 49-year-olds, and they were second to blacks in the less-than-or-equal-to-50-years-of-age group, according to data from the National HIV Surveillance System.
“Promotion of care and treatment by public health agencies and private sector partners to achieve viral suppression among MSM with diagnosed HIV infection will improve health outcomes and reduce transmission to others, particularly if prevention efforts are tailored to specific age groups,” the researchers wrote.
SOURCE: Mitsch A et al. MMWR 2018 Sep 21;67(37):1025-31.
FROM MMWR
Decline of infant walker–related injuries continues
but most of that drop occurred before the federal mandatory safety standard went into effect in 2010, according to an analysis of a federal injury database.
In 1990, there were 20,650 walker-related injuries among children younger than 15 months, and by 2003 that number was down to 3,201 – a significant decline of 85%. In 2014, the last year for which data were available, there were 1,995 such injuries, which translates to a nonsignificant decrease of 38% from 2003 to 2014, Ariel Sims, MS, and her associates at the Center for Injury Research and Policy at Nationwide Children’s Hospital, Columbus, Ohio, wrote in Pediatrics.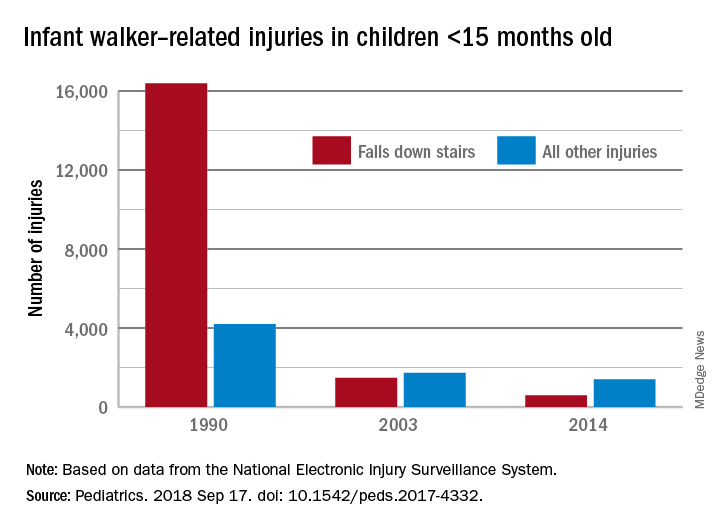
During the study period from 1990 to 2014, a total of 230,676 children aged less than 15 months received treatment in emergency departments after walker-related injuries, with the majority (74%) caused by falls down stairs. That percentage did go down over time, though, with falls down stairs representing more than 80% of all such injuries during 1990-1996, 66% during 1997-2009, and 41% during 2010-2014, Ms. Sims and her associates reported based on data from the National Electronic Injury Surveillance System.
As for the 2010 federal safety standard, the annual average injury total went from 2,801 for the previous 4 years (2006-2009) to 2,165 for the 4 years after (2010-2014) – a decline of 23% (P = .019), they noted.
The federal standard may have contributed to the overall decline, Ms. Sims and her associates suggested, but the “reduction is most likely attributable to … an increase in public awareness of infant walker–related injury risks when advocacy groups petitioned the [Consumer Product Safety Commission] in 1992 to ban infant walker sales in the United States, the increasing use of stationary activity centers as an alternative to infant walkers, and improvements in the voluntary infant walker safety standard.”
In a September 2001 policy statement, the American Academy of Pediatrics recommended a ban on the manufacture and sale of mobile infant walkers (Pediatrics. 2001 Sep. doi: 10.1542/peds.108.3.790). This policy has been reaffirmed every 5 years in accordance with AAP policy.
Ms. Sims received a research stipend from the Research Institute at Nationwide Children’s Hospital and was funded by the Centers for Disease Control and Prevention and the Child Injury Prevention Alliance. The other investigators said that they have no relevant financial disclosures.
SOURCE: Sims A et al. Pediatrics. 2018 Sep 17. doi: 10.1542/peds.2017-4332.
FROM PEDIATRICS
CDC: Obesity affects over 35% in 7 states
Iowa and Oklahoma, the two newest states with prevalences at or exceeding 35%, joined Alabama, Arkansas, Louisiana, Mississippi, and West Virginia, which has the country’s highest rate of adult obesity at 38.1%. Colorado’s 22.6% rate is the lowest prevalence among all states. The District of Columbia and Hawaii also have prevalences under 25%; previously, Massachusetts also was in this group, but its prevalence went up to 25.9% last year, the CDC reported.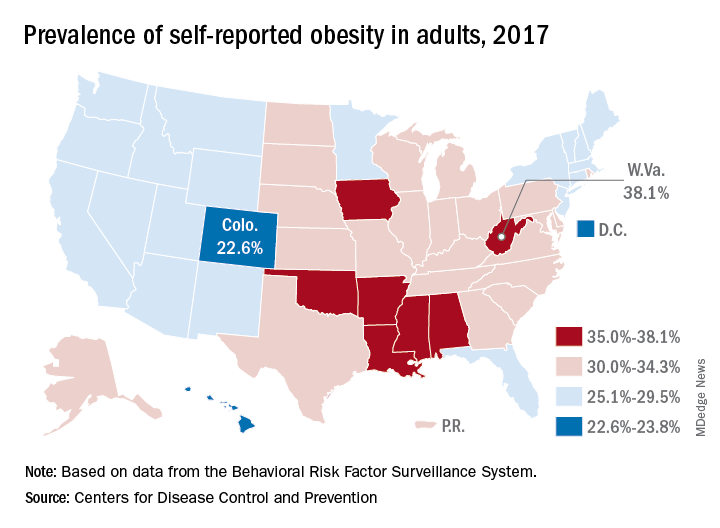
Regional disparities in self-reported adult obesity put the South (32.4%) and the Midwest (32.3%) well ahead of the Northeast (27.7%) and the West (26.1%) in 2017. Racial and ethnic disparities also were seen, with large gaps between blacks, who had a prevalence of 39%, and Hispanics (32.4%) and whites (29.3%). Obesity prevalence was 35% or higher among black adults in 31 states and D.C., while this was true among Hispanics in eight states and among whites in one (West Virginia), although the prevalence was at or above 35% for multiple racial groups in some of these states, the CDC reported based on data from the Behavioral Risk Factor Surveillance System.
“Obesity costs the United States health care system over $147 billion a year [and] research has shown that obesity affects work productivity and military readiness,” the CDC said in a written statement. “To protect the health of the next generation, support for healthy behaviors such as healthy eating, better sleep, stress management, and physical activity should start early and expand to reach Americans across the lifespan in the communities where they live, learn, work, and play.”
Pediatric ED diagnoses vary with the season
The two most common reasons for pediatric emergency department visits exhibit considerable and opposing seasonal variations, according to the Agency for Healthcare Research and Quality.
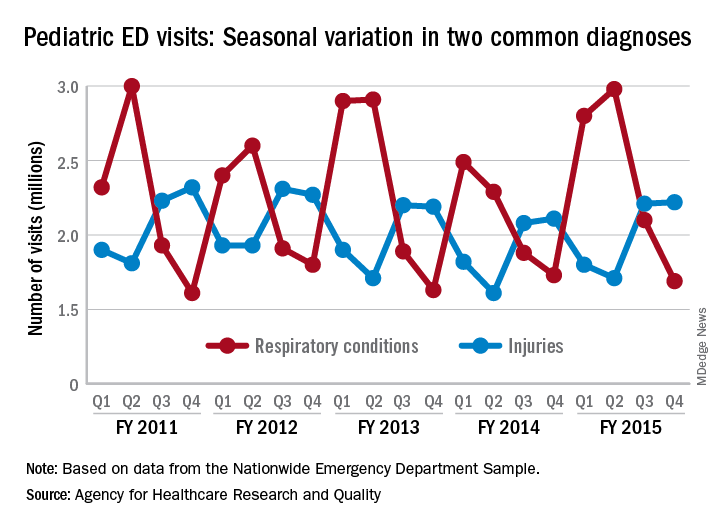
Of the 30 million ED visits by children aged 18 years and younger during fiscal year 2015, about 9.6 million, or just under 24%, were for respiratory disorders, making it the most common diagnosis by body system. The second-most common reason, injuries, was associated with approximately 7.9 million visits in 2015, the AHRQ reported recently in a statistical brief.
Over the 4-year period from 2011 to 2015, pediatric ED visits for respiratory disorders peaked during the months from October to March and dropped during April-September. In 2015, for example, there was a 43% difference between October-December, which was the highest-volume quarter, and July-September, which had the lowest volume of visits, the report showed.
The opposite pattern of seasonality was seen with visits for injury-related visits: The high point each year occurs in April-September, with the low in October-March. In 2015, there was a 30% difference between the lowest-volume quarter of January-March and the highest-volume quarter of July-September, based on the analysis of data from the Nationwide Emergency Department Sample.
The two most common reasons for pediatric emergency department visits exhibit considerable and opposing seasonal variations, according to the Agency for Healthcare Research and Quality.
Of the 30 million ED visits by children aged 18 years and younger during fiscal year 2015, about 9.6 million, or just under 24%, were for respiratory disorders, making it the most common diagnosis by body system. The second-most common reason, injuries, was associated with approximately 7.9 million visits in 2015, the AHRQ reported recently in a statistical brief.
Over the 4-year period from 2011 to 2015, pediatric ED visits for respiratory disorders peaked during the months from October to March and dropped during April-September. In 2015, for example, there was a 43% difference between October-December, which was the highest-volume quarter, and July-September, which had the lowest volume of visits, the report showed.
The opposite pattern of seasonality was seen with visits for injury-related visits: The high point each year occurs in April-September, with the low in October-March. In 2015, there was a 30% difference between the lowest-volume quarter of January-March and the highest-volume quarter of July-September, based on the analysis of data from the Nationwide Emergency Department Sample.
Alabama, Oregon, and pediatric asthma
according to estimates from the American Lung Association.
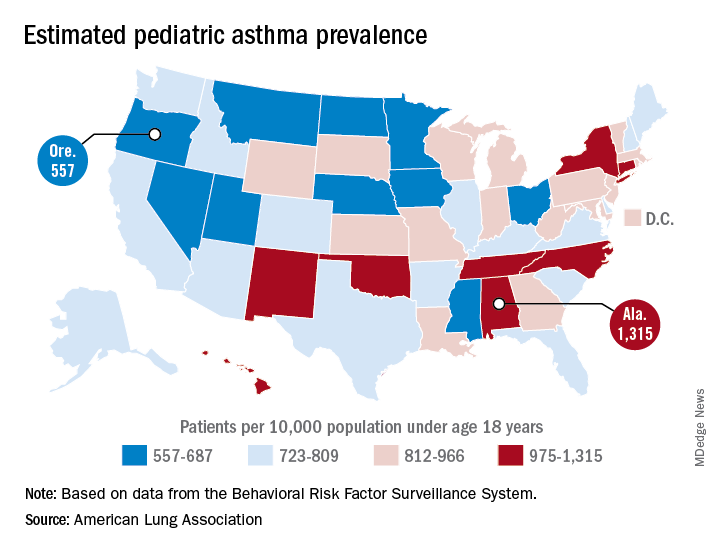
Oregon’s rate comes in at 557 per 10,000 population under the age of 18 years, just ahead of Montana at 574 per 10,000 and Iowa at 577. The prevalence of pediatric asthma in Alabama is 1,315 per 10,000, with North Carolina (1,149), Connecticut (1,107), Hawaii (1,026), and New York (1,005) joining it as members of the over-1,000 club. (MDedge News used the ALA’s estimates for persons under age 18 years with asthma in each state and Census Bureau estimates for population to calculate an unadjusted rate for each state.)
The ALA analysis was based on data from the Behavioral Risk Factor Behavioral System surveys for 2016 (31 states), 2015 (District of Columbia, Louisiana, New Hampshire, Texas), 2014 (Alabama, Maryland, North Carolina, Tennessee, West Virginia), 2012 (North Dakota and Wyoming), and 2011 (Iowa). National data were used for eight states (Alaska, Arkansas, Colorado, Delaware, Idaho, South Carolina, South Dakota, Virginia) that had no data available.
according to estimates from the American Lung Association.
Oregon’s rate comes in at 557 per 10,000 population under the age of 18 years, just ahead of Montana at 574 per 10,000 and Iowa at 577. The prevalence of pediatric asthma in Alabama is 1,315 per 10,000, with North Carolina (1,149), Connecticut (1,107), Hawaii (1,026), and New York (1,005) joining it as members of the over-1,000 club. (MDedge News used the ALA’s estimates for persons under age 18 years with asthma in each state and Census Bureau estimates for population to calculate an unadjusted rate for each state.)
The ALA analysis was based on data from the Behavioral Risk Factor Behavioral System surveys for 2016 (31 states), 2015 (District of Columbia, Louisiana, New Hampshire, Texas), 2014 (Alabama, Maryland, North Carolina, Tennessee, West Virginia), 2012 (North Dakota and Wyoming), and 2011 (Iowa). National data were used for eight states (Alaska, Arkansas, Colorado, Delaware, Idaho, South Carolina, South Dakota, Virginia) that had no data available.
Maryland gets an A on ‘Rheumatic Disease Report Card’
Maryland is alone at the top of the rheumatology care class, but the number of failing states is even smaller, according to the American College of Rheumatology.
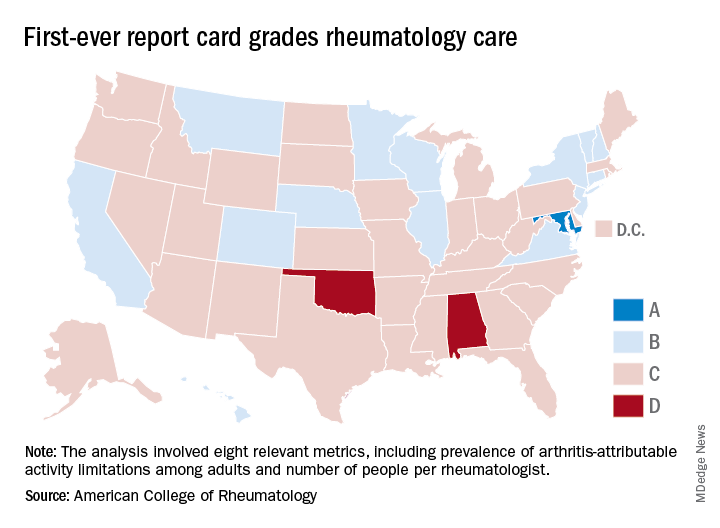
Maryland was the only state to earn an A on the “Rheumatic Disease Report Card,” and while no state failed, two – Alabama and Oklahoma – did receive Ds. Among the 47 other states and the District of Columbia, there were 14 Bs and 34 Cs.
Maryland posted strong scores in all three of the report card’s broad categories of care: 38.25 out of 50 points (third among all states) for access, 35 out of 50 (tied for first with New York) for affordability, and 40 out of 50 (tied for ninth) for activity/lifestyle. Arkansas had the highest score (42.25) for access and Nebraska got 50 out of 50 for activity/lifestyle. Inferiority, however, turned out to be a lot more widespread, as eight states were tied for the low of 10 points in the access category, 26 states got a 0 for affordability, and six states earned 15 points for activity/lifestyle, the ACR said.
Arkansas’s high marks for access were based primarily on “state lawmakers’ recent efforts to address [pharmacy benefit manager] transparency by enacting legislation that should serve as a model for future action in other states looking to address this issue,” ACR officials said in a statement. Nebraska did well in both of the measures used in the activity/lifestyle category – age-adjusted prevalence of arthritis attributable activity limitations among adults and percent of adults who are physically inactive; it also did well because it is home to at least one YMCA-sponsored and one National Recreation and Park Association–sponsored arthritis intervention program funded in part by the Centers for Disease Control and Prevention.
as demand increases and supply decreases. The college’s projections show that almost 6,800 rheumatologists will be needed by 2020 but less than 4,500 will be available, and by 2030 the demand will rise to need for almost 8,200 rheumatologists, while supply is expected to drop below 3,500, according to the report.
“We are at a critical juncture in rheumatology care. The rheumatology workforce is not growing fast enough to keep up with demand and too many of our patients struggle to access and afford the breakthrough therapies they need to manage pain and avoid long-term disability,” ACR President David Daikh, MD, PhD wrote in the report.
Maryland is alone at the top of the rheumatology care class, but the number of failing states is even smaller, according to the American College of Rheumatology.
Maryland was the only state to earn an A on the “Rheumatic Disease Report Card,” and while no state failed, two – Alabama and Oklahoma – did receive Ds. Among the 47 other states and the District of Columbia, there were 14 Bs and 34 Cs.
Maryland posted strong scores in all three of the report card’s broad categories of care: 38.25 out of 50 points (third among all states) for access, 35 out of 50 (tied for first with New York) for affordability, and 40 out of 50 (tied for ninth) for activity/lifestyle. Arkansas had the highest score (42.25) for access and Nebraska got 50 out of 50 for activity/lifestyle. Inferiority, however, turned out to be a lot more widespread, as eight states were tied for the low of 10 points in the access category, 26 states got a 0 for affordability, and six states earned 15 points for activity/lifestyle, the ACR said.
Arkansas’s high marks for access were based primarily on “state lawmakers’ recent efforts to address [pharmacy benefit manager] transparency by enacting legislation that should serve as a model for future action in other states looking to address this issue,” ACR officials said in a statement. Nebraska did well in both of the measures used in the activity/lifestyle category – age-adjusted prevalence of arthritis attributable activity limitations among adults and percent of adults who are physically inactive; it also did well because it is home to at least one YMCA-sponsored and one National Recreation and Park Association–sponsored arthritis intervention program funded in part by the Centers for Disease Control and Prevention.
as demand increases and supply decreases. The college’s projections show that almost 6,800 rheumatologists will be needed by 2020 but less than 4,500 will be available, and by 2030 the demand will rise to need for almost 8,200 rheumatologists, while supply is expected to drop below 3,500, according to the report.
“We are at a critical juncture in rheumatology care. The rheumatology workforce is not growing fast enough to keep up with demand and too many of our patients struggle to access and afford the breakthrough therapies they need to manage pain and avoid long-term disability,” ACR President David Daikh, MD, PhD wrote in the report.
Service, please: Hospital setting matters for pneumonia
the National Center for Health Statistics (NCHS) reported.
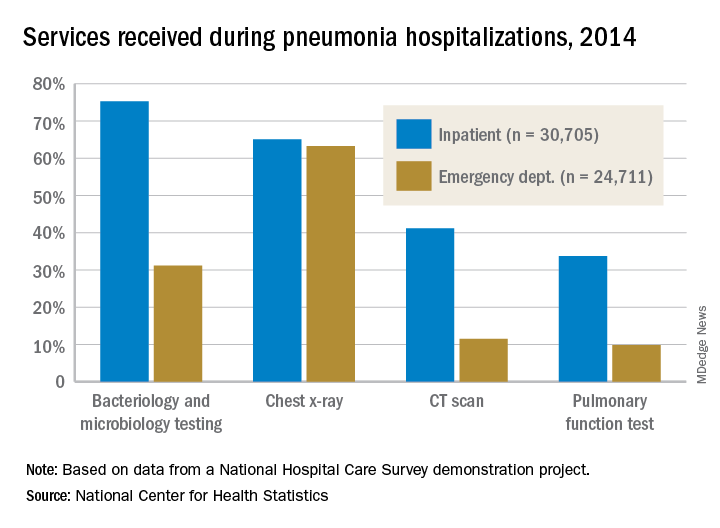
The percentages were not as close, however, for other diagnostic services. Inpatient stays were much more likely than ED encounters to involve bacteriology and microbiology testing (75.3% vs. 31.2%), CT scans (41.2% vs. 11.5%), and pulmonary function tests (33.7% vs. 9.8%), investigators from the NCHS said.
The age distribution of the two patient populations also were quite different, with those aged 65 years and older making up the largest share (46%) of pneumonia inpatients and the 15-and-under group representing the largest proportion (47%) of ED visits. For the inpatient setting, the smallest age group was those aged 15-44 years (10%), and for the ED it was those aged 65 years and older (14%), they reported.
The National Hospital Care Survey “is not yet nationally representative,” the NCHS investigators wrote – the overall sample for 2014 consisted of 581 hospitals – but “the number of encounters and the inclusion of [personally identifiable information] allow an example of analysis that was not previously possible.”
the National Center for Health Statistics (NCHS) reported.
The percentages were not as close, however, for other diagnostic services. Inpatient stays were much more likely than ED encounters to involve bacteriology and microbiology testing (75.3% vs. 31.2%), CT scans (41.2% vs. 11.5%), and pulmonary function tests (33.7% vs. 9.8%), investigators from the NCHS said.
The age distribution of the two patient populations also were quite different, with those aged 65 years and older making up the largest share (46%) of pneumonia inpatients and the 15-and-under group representing the largest proportion (47%) of ED visits. For the inpatient setting, the smallest age group was those aged 15-44 years (10%), and for the ED it was those aged 65 years and older (14%), they reported.
The National Hospital Care Survey “is not yet nationally representative,” the NCHS investigators wrote – the overall sample for 2014 consisted of 581 hospitals – but “the number of encounters and the inclusion of [personally identifiable information] allow an example of analysis that was not previously possible.”
E-cigarette use highest among adults aged under 35 years
Almost 11 million adults use e-cigarettes in the United States, and the majority are under the age of 35 years, according to the American Heart Association.
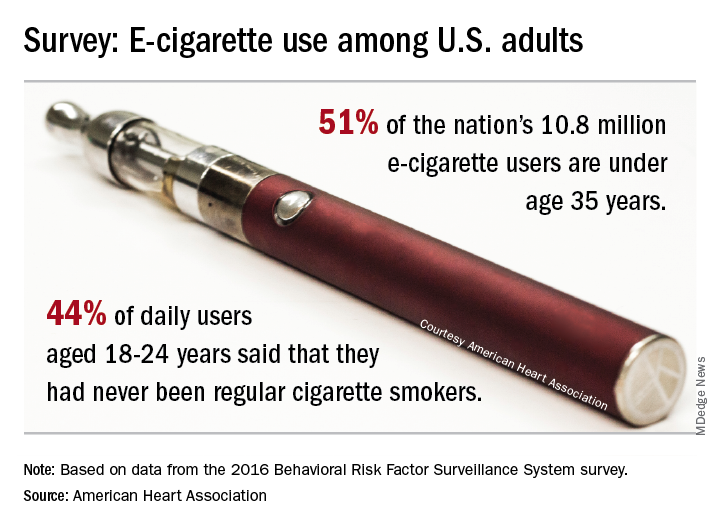
As of 2016, an estimated 4.5% of adults – more than 10.8 million individuals – used e-cigarettes every day or some days, which defined current use for the 466,842 people who responded to the Behavioral Risk Factor Surveillance System survey and were included in the study conducted by the AHA’s Tobacco Regulation and Addiction Center and published in the Annals of Internal Medicine.
Based on that survey data, an estimated 51% of current users were under the age of 35 years in 2016. Daily use was highest among those aged 18-24 years, and of those respondents, 44% said that they had never been regular cigarette users. “It’s particularly disturbing to see these younger people who have never been regular cigarette smokers taking up the use of e-cigarettes, perhaps with the assumption that this alternative nicotine delivery system has been proven to be safe,” said Rose Marie Robertson, MD, who is the AHA’s chief science and medical officer.
The analysis also showed that about 60% of e-cigarette users were men and that use was higher among LGBT people. The first-ever estimates of current use by state put the prevalence highest in Oklahoma at 7.0% and lowest in South Dakota (3.1%) and the District of Columbia (2.3%), the AHA said.
The study was funded through a grant from the National Institutes of Health and the Food and Drug Administration’s Center for Tobacco Products.
[email protected]
SOURCE: Mirbolouk M et al. Ann Intern Med. 2018 Aug 28. doi: 10.7326/M17-3440.
Almost 11 million adults use e-cigarettes in the United States, and the majority are under the age of 35 years, according to the American Heart Association.
As of 2016, an estimated 4.5% of adults – more than 10.8 million individuals – used e-cigarettes every day or some days, which defined current use for the 466,842 people who responded to the Behavioral Risk Factor Surveillance System survey and were included in the study conducted by the AHA’s Tobacco Regulation and Addiction Center and published in the Annals of Internal Medicine.
Based on that survey data, an estimated 51% of current users were under the age of 35 years in 2016. Daily use was highest among those aged 18-24 years, and of those respondents, 44% said that they had never been regular cigarette users. “It’s particularly disturbing to see these younger people who have never been regular cigarette smokers taking up the use of e-cigarettes, perhaps with the assumption that this alternative nicotine delivery system has been proven to be safe,” said Rose Marie Robertson, MD, who is the AHA’s chief science and medical officer.
The analysis also showed that about 60% of e-cigarette users were men and that use was higher among LGBT people. The first-ever estimates of current use by state put the prevalence highest in Oklahoma at 7.0% and lowest in South Dakota (3.1%) and the District of Columbia (2.3%), the AHA said.
The study was funded through a grant from the National Institutes of Health and the Food and Drug Administration’s Center for Tobacco Products.
[email protected]
SOURCE: Mirbolouk M et al. Ann Intern Med. 2018 Aug 28. doi: 10.7326/M17-3440.
FROM ANNALS OF INTERNAL MEDICINE
Earnings gap seen among Maryland physicians
Male physicians in Maryland reported higher earnings than did female physicians, even when they all worked 41 or more hours a week, according to a 2018 survey of physicians in the state.
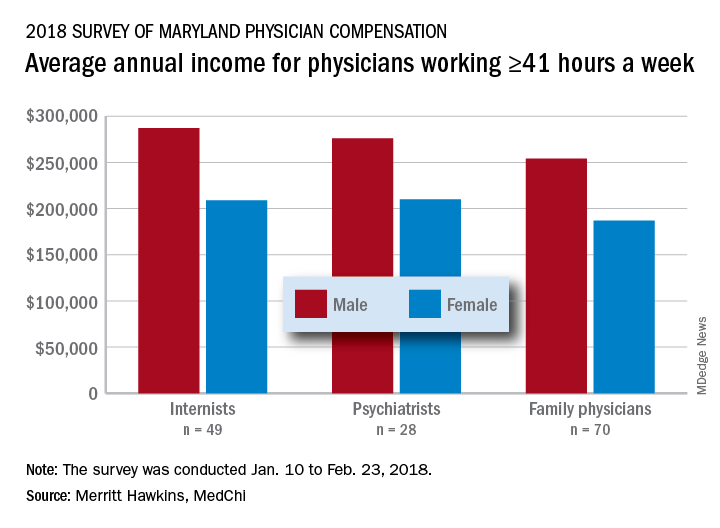
The average pretax income for all 508 respondents was $299,000 in 2016: Male physicians (66.6% of the sample) had an average of $335,000 and women averaged 33% lower at $224,000, MedChi (the Maryland State Medical Society) and Merritt Hawkins reported on July 31. Men did report working a longer week: Their average of 50.5 hours was 11% more than the 45.4-hour average for women.
“The biggest disparities we see in compensation are between male and female physicians in Maryland,” Gene Ransom, MedChi’s chief executive officer, said in a written statement. “Though such disparities have been noted in other research, it is still surprising to see the extent to which they persist.”
Of the respondents who worked an average of 41 or more hours per week – an analysis conducted only for the three largest specialties in the survey – female internists earned 27% less than their male counterparts, female psychiatrists earned 24% less, and female family physicians earned 26% less, the survey results showed.
Earnings were structured somewhat differently for Maryland’s male and female physicians. Women were more likely to be compensated in the form of a straight salary than men (35.0% vs. 30.3%), and men were more likely to paid based on production (22.7% vs. 16.9%) or in the form of an income guarantee (0.9% vs. 0.0%). Proportions receiving a salary with a production bonus were 42.7% for men and 42.5% for women, according to the survey.
Data included in the survey may be of interest to policymakers and media members who track physician compensation trends in Maryland and nationwide.
The survey was commissioned by MedChi and conducted by Merritt Hawkins from Jan. 10 to Feb. 23, 2018. The margin of error was plus or minus 4.4%.
Male physicians in Maryland reported higher earnings than did female physicians, even when they all worked 41 or more hours a week, according to a 2018 survey of physicians in the state.
The average pretax income for all 508 respondents was $299,000 in 2016: Male physicians (66.6% of the sample) had an average of $335,000 and women averaged 33% lower at $224,000, MedChi (the Maryland State Medical Society) and Merritt Hawkins reported on July 31. Men did report working a longer week: Their average of 50.5 hours was 11% more than the 45.4-hour average for women.
“The biggest disparities we see in compensation are between male and female physicians in Maryland,” Gene Ransom, MedChi’s chief executive officer, said in a written statement. “Though such disparities have been noted in other research, it is still surprising to see the extent to which they persist.”
Of the respondents who worked an average of 41 or more hours per week – an analysis conducted only for the three largest specialties in the survey – female internists earned 27% less than their male counterparts, female psychiatrists earned 24% less, and female family physicians earned 26% less, the survey results showed.
Earnings were structured somewhat differently for Maryland’s male and female physicians. Women were more likely to be compensated in the form of a straight salary than men (35.0% vs. 30.3%), and men were more likely to paid based on production (22.7% vs. 16.9%) or in the form of an income guarantee (0.9% vs. 0.0%). Proportions receiving a salary with a production bonus were 42.7% for men and 42.5% for women, according to the survey.
Data included in the survey may be of interest to policymakers and media members who track physician compensation trends in Maryland and nationwide.
The survey was commissioned by MedChi and conducted by Merritt Hawkins from Jan. 10 to Feb. 23, 2018. The margin of error was plus or minus 4.4%.