User login
compared with the total at the end of week 4, according to the Centers for Medicare & Medicaid Services.
The 1.89 million plans that consumers selected over the 2-week period ending Dec. 9 brought this year’s total to 4.68 million after 6 weeks. That’s 16.5% higher than last year’s 6-week total of 4.02 million, but the difference has been getting smaller: After week 2 (enrollment figures were released only biweekly last year), the 2018 open season’s tally was higher than the 2017 open season’s week 2 tally by almost 47%, but after 4 weeks, the difference was only 30%, the CMS data show.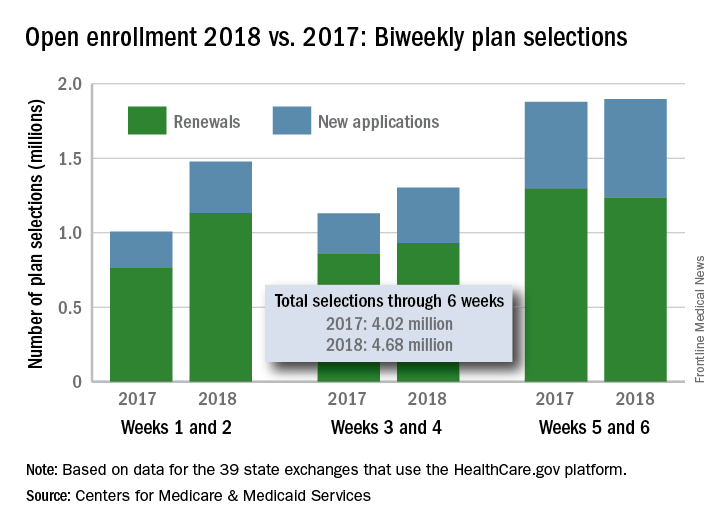