User login
Richard Franki is the associate editor who writes and creates graphs. He started with the company in 1987, when it was known as the International Medical News Group. In his years as a journalist, Richard has worked for Cap Cities/ABC, Disney, Harcourt, Elsevier, Quadrant, Frontline, and Internet Brands. In the 1990s, he was a contributor to the ill-fated Indications column, predecessor of Livin' on the MDedge.
Medicaid’s share of state budgets continues to grow
State spending on Medicaid in fiscal 2017 was up 6.1% over 2016, and the program’s share of state budgets increased for the fifth year in a row, according to the National Association of State Budget Officers.
Total spending by the states on Medicaid benefits for more than 74 million individuals was an estimated $574 billion in 2017, which represented 29% of all expenditures. That compares with 28.7% in 2016 and 23.6% in 2012 – the last year that Medicaid’s share of state spending decreased, NASBO said in its annual State Expenditure Report.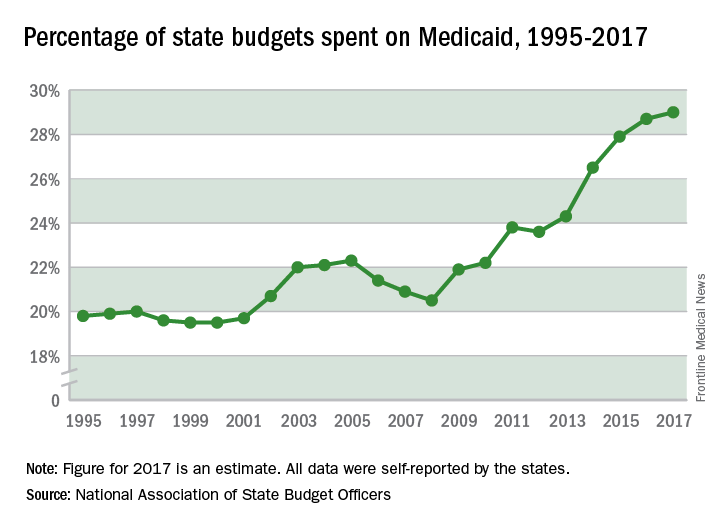
Enrollment rose by 2.9% from 2016 to 2017, which was down from the 3.9% increase seen from 2015 to 2016. Since October 2013, Medicaid enrollment is up 38% in expansion states and 12% in nonexpansion states, the report noted.
Enrollment increases are “the major driver” of spending growth, NASBO said, and “Medicaid’s annual spending growth from all fund sources has averaged 8.1% over the past 5 years, while the rest of total spending growth has averaged 2.2% annually.”
After 6 weeks, HealthCare.gov activity still ahead of last year
compared with the total at the end of week 4, according to the Centers for Medicare & Medicaid Services.
The 1.89 million plans that consumers selected over the 2-week period ending Dec. 9 brought this year’s total to 4.68 million after 6 weeks. That’s 16.5% higher than last year’s 6-week total of 4.02 million, but the difference has been getting smaller: After week 2 (enrollment figures were released only biweekly last year), the 2018 open season’s tally was higher than the 2017 open season’s week 2 tally by almost 47%, but after 4 weeks, the difference was only 30%, the CMS data show.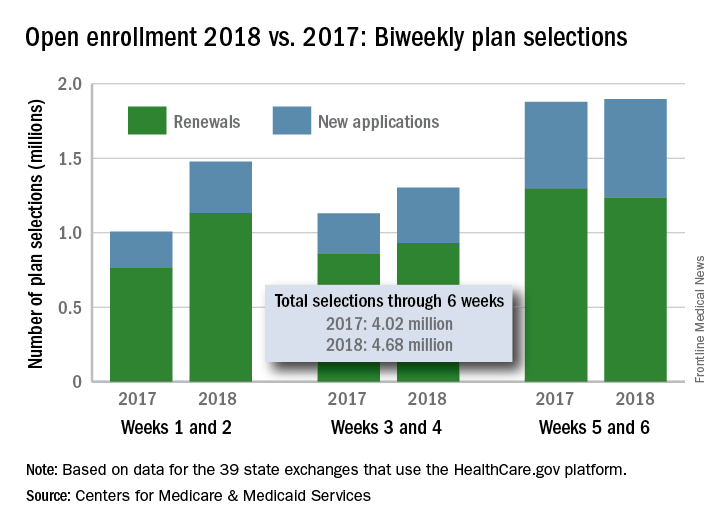
Developmental disabilities up significantly since 2014
In 2016, the prevalence of any diagnosed developmental disability in children aged 3-17 years was 6.99% – a statistically significant increase of 21% over the 5.76% recorded in 2014, the NCHS said in a recent Data Brief.
Autism spectrum disorder was up by a similar amount: 23% from 2014, when prevalence was 2.24%, to 2016, when the prevalence was 2.76% among children aged 3-17 years. Intellectual disability rose in 2015 but dropped in 2016, so the overall increase in prevalence was just 3.6%. The prevalence of other developmental delays, on the other hand, held steady from 2014 to 2015 and then took a big jump, 27.5%, in 2016, the NCHS investigators reported.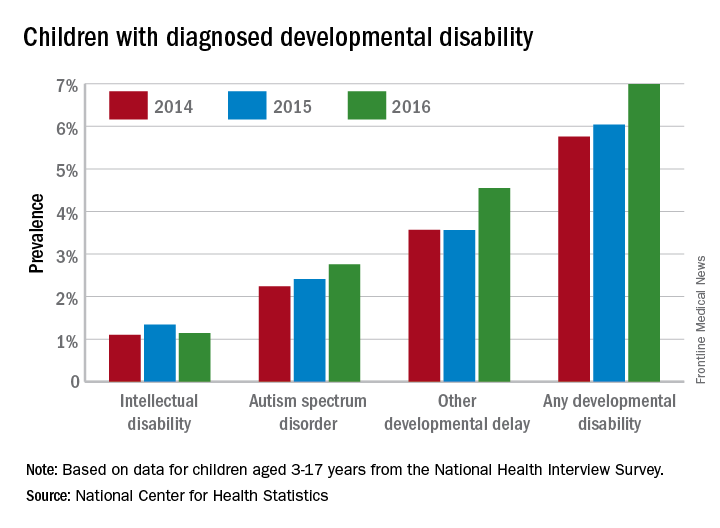
The estimates are based on reports by parents or guardians of ever receiving a diagnosis of each developmental disability from a physician or other medical professional.
Dermatologists paying for errors during procedures
according to a review of over 90,000 lawsuits filed from 2006 to 2015.
Data from the Physician Insurers Association of America Data Sharing Project registry show that dermatologists paid 102 claims for errors that occurred during a procedure over that period. Misdiagnosis, with 62 payments, was the next most common reason, followed by medication errors (23 payments). Failure to supervise or monitor case, failure to instruct or communicate with patients, and failure to recognize a complication of treatment each had 15 payments, Heather Kornmehl and her associates reported (JAMA Dermatol. 2017 Dec 6. doi: 10.1001/jamadermatol.2017.3713).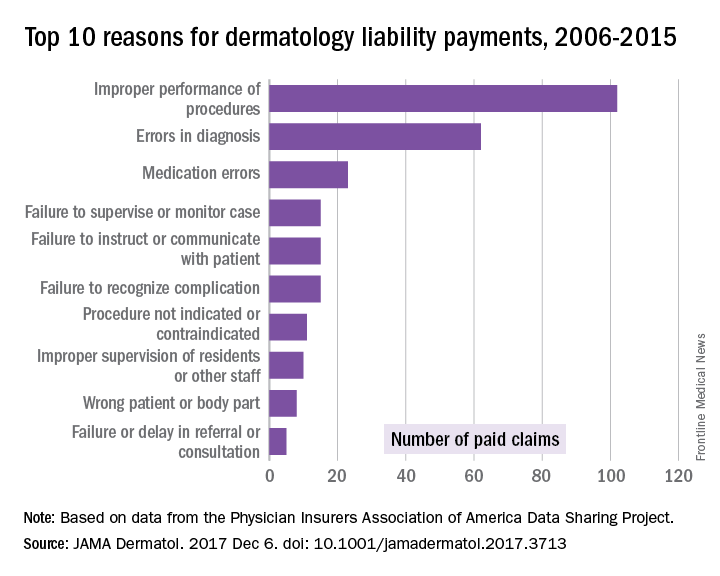
From 2006 to 2015, the total cost of the 281 claims paid by dermatologists was $71.8 million, and dermatologists were involved in 1,084 (1.2%) of the 90,743 closed claims against physicians in all specialties, said Ms. Kornwehl, who is a medical student at Drexel University, Philadelphia, and her associates.
Closed claims include any lawsuit that is subsequently abandoned, withdrawn, or dismissed; is settled; or goes to trial and results in a verdict.
One of Ms. Kornmehl’s coinvestigators has served as an investigator and/or advisor to a number of companies. No other disclosures were reported.
SOURCE: Kornmehl H et al. JAMA Dermatol. 2017 Dec 6. doi: 10.1001/jamadermatol.2017.3713
FROM JAMA DERMATOLOGY
Vaccine exemptions more common in western states
For the 2016-2017 school year, 2% of American kindergarten students had an exemption from one or more vaccines, said Ranee Seither and associates at the National Center of Immunization and Respiratory Disease, Centers for Disease Control and Prevention, Atlanta.
Among the 46 states – including the District of Columbia – that reported data, nine times as many exemptions were granted on religious or philosophical grounds (1.8%) as were granted for medical reasons (0.2%), they said.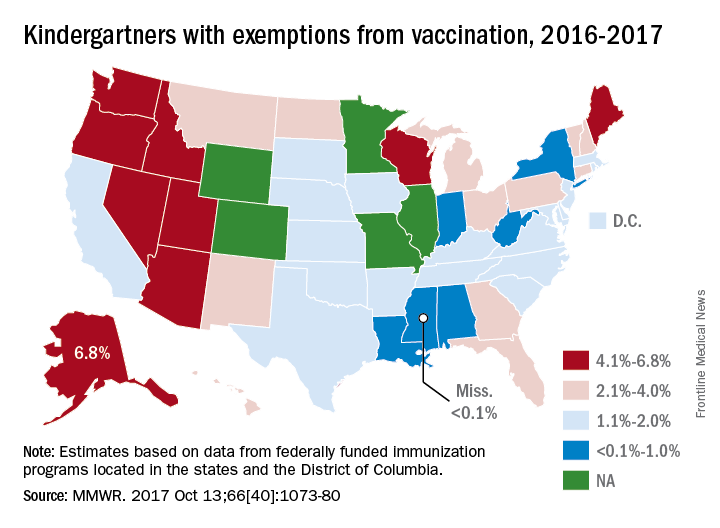
Alaska had the highest rate of medical exemptions at 1.5% and Oregon had the highest rate of religious/philosophical exemptions at 6.5%. Thirty states do not allow philosophical exemptions, Arizona and Mississippi do not allow religious exemptions, and West Virginia does not allow either, they noted.
Exemption data were reported for 3,666,870 kindergartners for the 2016-2017 school year and collected by federally funded immunization programs in the 50 states and D.C.
FROM MMWR
Health disparities in rural America: Chronic conditions
Among rural adults, multiple chronic health conditions are most common in non-Hispanic blacks and American Indians/Alaska Natives (AI/ANs) and least common among Asians and Native Hawaiians/other Pacific Islanders (NHOPIs), according to the Centers for Disease Control and Prevention.
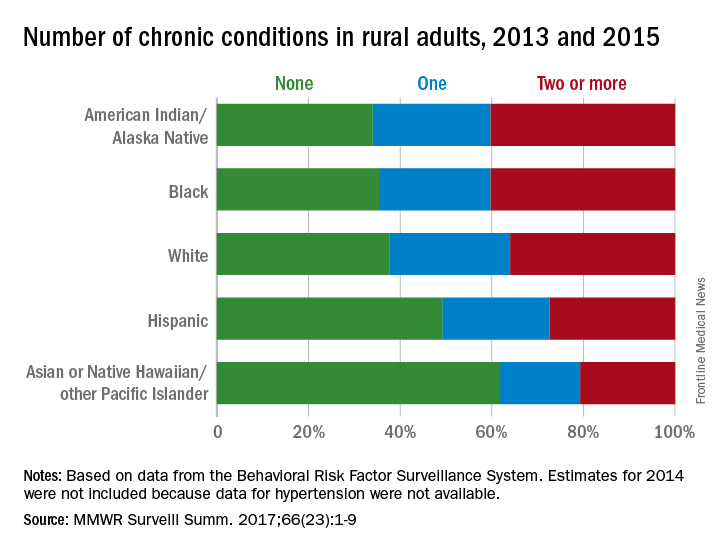
The order was reversed for adults reporting no chronic conditions: Asians and NHOPIs at 61.8%, Hispanics at 49.2%, whites at 37.8%, blacks at 35.4%, and AI/ANs at 34.0%, the researchers said.
For the chronic health conditions included separately in the report, blacks had the highest rate (45.9%) and Asians and NHOPIs had the lowest rate (15.5%) of obesity; AI/ANs were most likely (23.2%) and Asians and NHOPIs were least likely (5.8%) to report depressive disorder. Other conditions considered in the estimates were myocardial infarction; coronary heart disease; stroke; hypertension; asthma; skin cancer; other types of cancer; chronic obstructive pulmonary disease; kidney disease; some form of arthritis, rheumatoid arthritis, gout, lupus, or fibromyalgia; and diabetes. Estimates for 2014 were not included because data for hypertension were not available, the investigators noted.
Of the 3,143 counties categorized by the National Center for Health Statistics’ Urban-Rural Classification Scheme for Counties, a total of 1,325 were considered rural and included 6.1% of the U.S. population, they said.
Among rural adults, multiple chronic health conditions are most common in non-Hispanic blacks and American Indians/Alaska Natives (AI/ANs) and least common among Asians and Native Hawaiians/other Pacific Islanders (NHOPIs), according to the Centers for Disease Control and Prevention.
The order was reversed for adults reporting no chronic conditions: Asians and NHOPIs at 61.8%, Hispanics at 49.2%, whites at 37.8%, blacks at 35.4%, and AI/ANs at 34.0%, the researchers said.
For the chronic health conditions included separately in the report, blacks had the highest rate (45.9%) and Asians and NHOPIs had the lowest rate (15.5%) of obesity; AI/ANs were most likely (23.2%) and Asians and NHOPIs were least likely (5.8%) to report depressive disorder. Other conditions considered in the estimates were myocardial infarction; coronary heart disease; stroke; hypertension; asthma; skin cancer; other types of cancer; chronic obstructive pulmonary disease; kidney disease; some form of arthritis, rheumatoid arthritis, gout, lupus, or fibromyalgia; and diabetes. Estimates for 2014 were not included because data for hypertension were not available, the investigators noted.
Of the 3,143 counties categorized by the National Center for Health Statistics’ Urban-Rural Classification Scheme for Counties, a total of 1,325 were considered rural and included 6.1% of the U.S. population, they said.
FROM MMWR SURVEILLANCE SUMMARIES
Mississippi has highest varicella vaccination rate
Coverage for two doses of varicella vaccine among kindergarten students was highest in Mississippi and lowest in the District of Columbia, said Ranee Seither and associates at the National Center of Immunization and Respiratory Disease at the Centers for Disease Control and Prevention, Atlanta.
For the 2016-2017 school year, 99.4% of Mississippi children enrolled in kindergarten received the state-required two doses of varicella vaccine, compared with 84.6% in D.C. The median was 93.8% for the 42 states that require two doses and 96.5% for those 42 plus the 7 states that reported and only require one dose. Oklahoma and Wyoming “did not report data because of widespread problems with the quality of data reported by schools,” the CDC investigators wrote (MMWR 2017;66[40]:1073-80).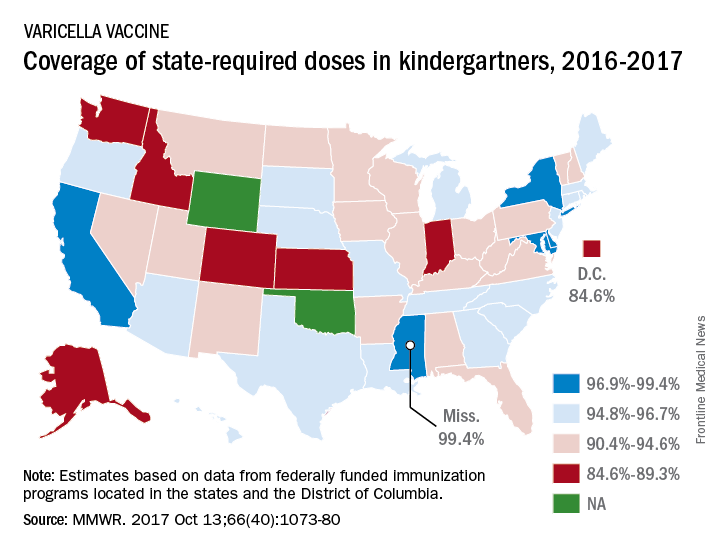
The data for the CDC analysis, which included 3,973,172 kindergartners for the 2016-2017 school year, were collected by federally funded immunization programs in the 50 states and D.C.
FROM MMWR
HealthCare.gov seeing more action this fall
Four weeks into the open enrollment for 2018, the number of health insurance plans selected through HealthCare.gov is up by 30% over the first 4 weeks of the 2017 sign-up period, according to data from the Centers for Medicare & Medicaid Services.
From Nov. 1 to Nov. 25 of this year, 2.78 million plans for 2018 were selected on the 39 state marketplaces that use the HealthCare.gov platform, the CMS reported Nov. 29, compared with the 2.14 million plans for 2017 selected from Nov. 1 to Nov. 26 of last year.
Last year, the enrollment numbers were released only every 2 weeks, so direct week-to-week comparisons are not possible. Looking at 2-week periods, however, shows that, despite a drop in the number of selections from the first to the second biweekly period this year, weeks 3 and 4 were still up considerably over last year.
“The final number of plan selections associated with enrollment activity during a reporting period may change due to plan modifications or cancellations,” the CMS noted. Also, “the weekly snapshot only reports new plan selections and active plan renewals and does not report the number of consumers who have paid premiums to effectuate their enrollment.”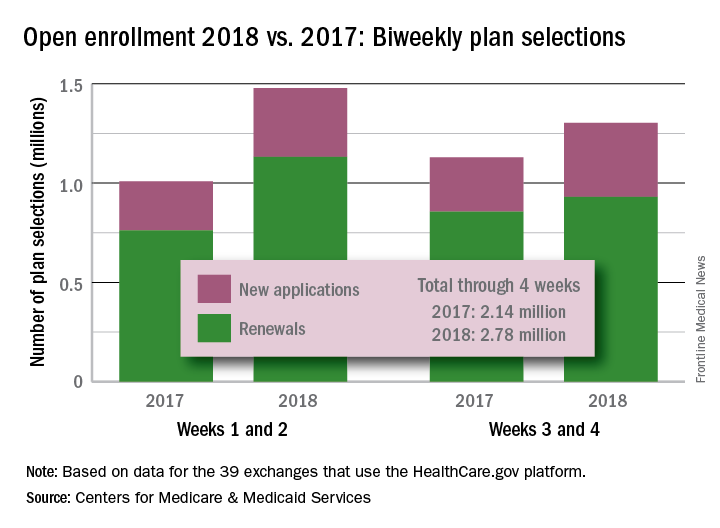
Two-thirds of abortions occur by 8 weeks’ gestation
, although there was variation by maternal age and race/ethnicity, according to the Centers for Disease Control and Prevention.
That year, 65.3% of abortions were performed at a gestational age of 8 weeks or earlier, with 25.6% occurring at 9-13 weeks. Gestational distribution of the remaining abortions was fairly even: 3.4% at 14-15 weeks, 2.2% at 16-17 weeks, 2.0% at 18-20 weeks, and 1.4% at 21 weeks or later, the CDC investigators reported (MMWR Surveill Summ. 2017 Nov 25;66[24]:1-48).
The percentage of abortions occurring at 8 weeks or earlier was lowest for the youngest age group and increased along with maternal age: 43% for those under 15 years of age and progressing up to 72.5% for women over age 40. That scenario was basically reversed for all of the other gestational periods, as the under-15 group had the highest percentage for 9-13 weeks (34.4%), 14-15 (6.7%), 16-17 (3.6%), 18-20 (5.0%), and 21 weeks and later (7.3%). Those over age 40 had the lowest or almost the lowest percentage in each period, reported Tara C. Jatlaoui, MD, and her associates.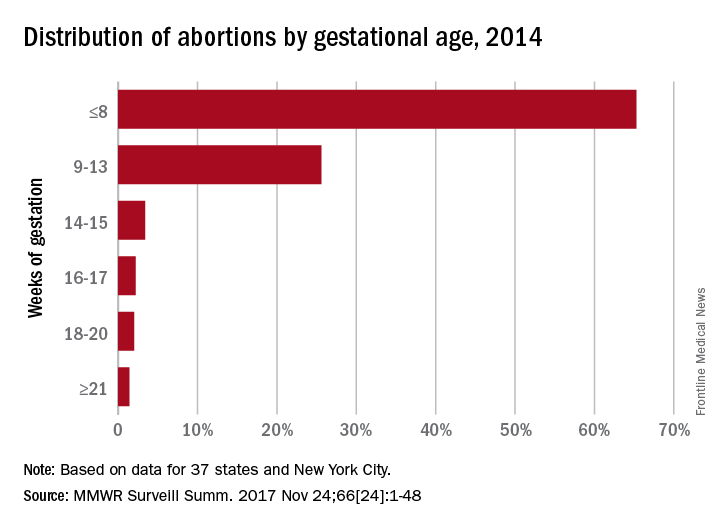
The data for gestational period analysis came from 37 states and New York City. New York State, along with 12 other states, did not report, did not report by gestational age, or did not meet reporting standards.
FROM MMWR SURVEILLANCE SUMMARIES
MMR vaccine coverage at 94% in kindergartners
, according to the Centers for Disease Control and Prevention.
A look at the map shows that state coverage of required MMR doses varied considerably. Mississippi (99.4%), Maryland (99.3%), Delaware (98.5%), California (97.3%), New York (97.3%), Texas (97.3%), and Louisiana (97.1%) were the furthest above the national median. Occupying the low end of the range were the District of Columbia (85.6%), Colorado (87.3%), Indiana (88.9%), Alaska (89.0%), Kansas (89.5%), and Idaho (89.9%), reported Ranee Seither, MPH, of the National Center for Immunization and Respiratory Disease, and associates at the CDC, Atlanta (MMWR 2017 Oct 13;66[40]:1073-80).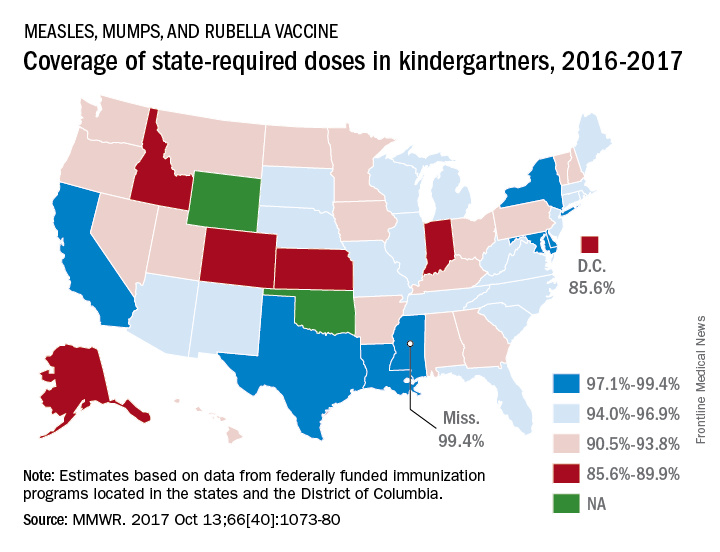
The data for the CDC analysis, which included 3,973,172 kindergartners for the 2016-2017 school year, were collected by federally funded immunization programs in the 50 states and D.C.
FROM MMWR