User login
Richard Franki is the associate editor who writes and creates graphs. He started with the company in 1987, when it was known as the International Medical News Group. In his years as a journalist, Richard has worked for Cap Cities/ABC, Disney, Harcourt, Elsevier, Quadrant, Frontline, and Internet Brands. In the 1990s, he was a contributor to the ill-fated Indications column, predecessor of Livin' on the MDedge.
DTaP vaccination rate highest in Maryland
, according to the Centers for Disease Control and Prevention.
Maryland’s coverage of required DTaP vaccine doses came in at a national high of 99.6% for children entering kindergarten in 2016-2017, while the District of Columbia had the nation’s lowest rate at 82.2%, Ranee Seither, MPH, of the National Center for Immunization and Respiratory Disease, and associates at the CDC, Atlanta, reported (MMWR. 2017 Oct 13;66[40]:1073-80).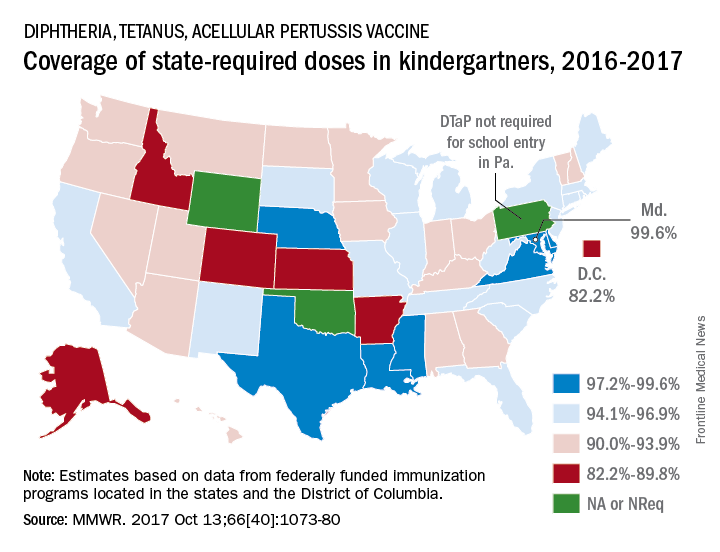
There is also variation among the states in the number of doses required for kindergarten entry: Most require five, but Illinois, Maryland, Virginia, and Wisconsin require four; Nebraska requires three; and Pennsylvania does not require pertussis vaccine. Oklahoma and Wyoming did not report vaccination coverage “because of widespread problems with the quality of data reported by schools,” they noted.
Nationally, median coverage for state-required doses of the DTaP vaccine was 94.5%, according to data from federally funded immunization programs in the 50 states and D.C., which included 3,973,172 kindergartners for the 2016-2017 school year.
FROM MMWR
Public health hazard: Bring your flu to work day
Slightly more than 41% of health care personnel who had the flu during the 2014-2015 influenza season went to work while they were ill, according to an annual survey.
Physicians, however, were well above this average, with 63% reporting they had worked with an influenza-like illness (ILI); they were not quite as far above average as pharmacists, though, who had a 67% rate of “presenteeism” – the highest among all of the health care occupations included in the survey, said Sophia Chiu, MD, MPH, of the Centers for Disease Control and Prevention’s National Institute for Occupational Safety and Health, and her associates.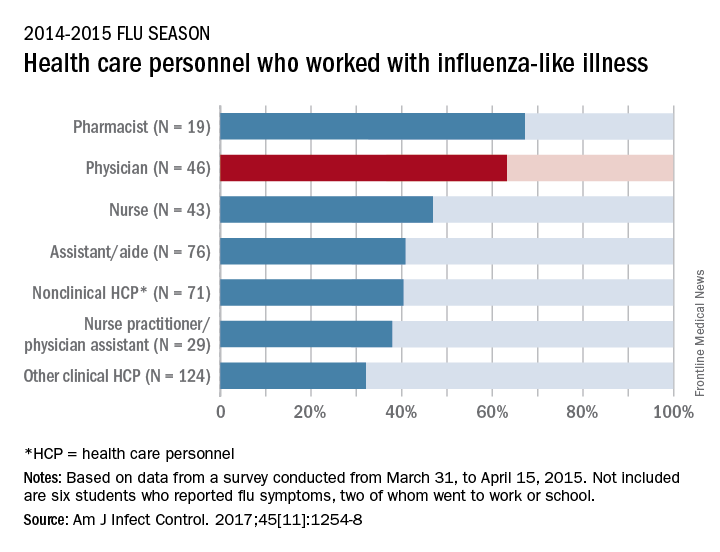
“The statistics are alarming. At least one earlier study has shown that patients who are exposed to a health care worker who is sick are five times more likely to get a health care–associated infection,” Dr. Chiu said in a separate written statement.
For the study, ILI was defined as “fever (without a specified temperature cutoff) and sore throat or cough.” The “nonclinical personnel” category included managers, food service workers, and janitors, while the “other clinical personnel” category included technicians and technologists. The annual Internet panel survey was conducted from March 31, 2015, to April 15, 2015, and 414 of its 1,914 respondents self-reported having an ILI, of whom 183 said that they worked during their illness, Dr. Chiu and her associates said.
The investigators are all CDC employees. The respondents were recruited from Internet panels operated by Survey Sampling International through a contract with Abt Associates.
FROM THE AMERICAN JOURNAL OF INFECTION CONTROL
AMA: Patient mix has become less uninsured since 2012
Uninsured patients made up a smaller share of the average physician’s practice in 2016 than in 2012, according to a survey by the American Medical Association.
For the average practice in 2016, 6.1% of patients were uninsured, compared with 6.9% in 2012. That significant drop of 0.8 percentage points was accompanied by significant increases in the number of patients covered by Medicaid and by private insurance, the AMA said in a report released Oct. 30.
“The overall picture from new physician-reported data is of more patients covered and fewer uninsured, but the findings also indicate that the improvement along those lines was concentrated in states that expanded their Medicaid programs under the ACA,” said David O. Barbe, MD, AMA president.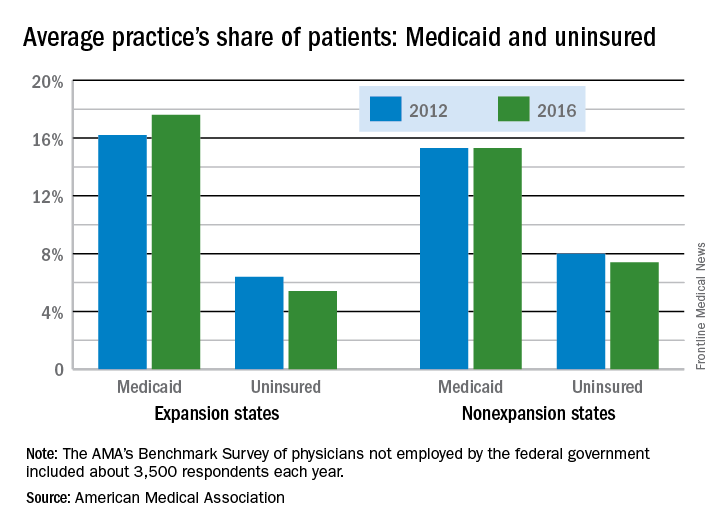
In the 31 states and the District of Columbia that expanded Medicaid, the average patient share dropped from 6.4% uninsured in 2012 to 5.4% in 2016, which was significant. In the states that did not expand Medicaid, the average share of uninsured patients went from 8.0% to 7.4% over that period, a drop that did not reach significance, the AMA said.
The changes involving Medicaid itself were of somewhat greater magnitude, in both directions: nonexpansion states saw a smaller increase and expansion states had a larger increase. In nonexpansion states the average share of a practice’s patients covered by Medicaid basically held steady at 15.3% (there was actually a very slight increase, but the AMA reported the figures for both 2012 and 2016 as 15.3%). In expansion states, the average Medicaid share went from 16.2% to 17.6% – a statistically significant increase of 1.4 percentage points, the AMA analysis shows.
The AMA report covers data from its 2012 and 2016 Benchmark Surveys, which each year involved approximately 3,500 physicians in patient care who were not employed by the federal government.
Fentanyl analogues an increasing factor in opioid deaths
Fentanyl analogues were involved in 14% of opioid overdose deaths in the second half of 2016, according to an analysis of 10 states reporting to the Enhanced State Opioid Overdose Surveillance program.
“Illicitly manufactured fentanyl is a key factor driving opioid overdose deaths and … fentanyl analogues [such as carfentanil, furanylfentanyl, and acetylfentanyl] are increasingly contributing to a complex illicit opioid market with significant public health implications,” investigators said in a report from the Centers for Disease Control and Prevention (MMWR 2017 Oct 27;66[early release]:1-6).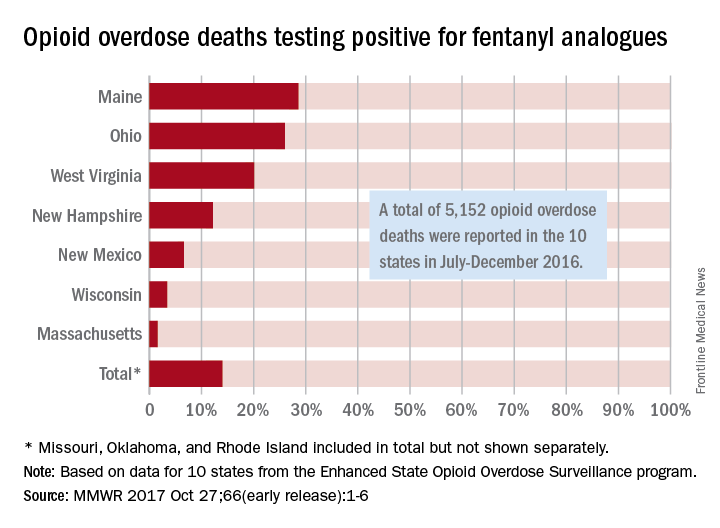
The overall rate of 14% represents 720 of the 5,152 total opioid deaths occurring in 10 states over the 6-month study period, they noted.
Of the 10 states in the analysis, Maine had the largest proportion (28.6%) of opioid overdose deaths involving fentanyl analogues, with Ohio second at 26% and West Virginia third at 20.1%. Ohio had the largest overall number of analogue-involved overdose deaths, however, at 531 during July-December 2016. At 1.6%, Massachusetts had the lowest rate of fentanyl analogue–involved deaths among the seven states for which separate figures were given, the published data show. (Three states – Missouri [22 counties], Oklahoma, and Rhode Island – were grouped together and had a combined rate of 1%.)
More than half of the overdose deaths involving fentanyl or a fentanyl analogue also involved heroin, cocaine, or methamphetamine, which means that almost half of the deaths “did not test positive for other illicit opioids, suggesting that fentanyl and fentanyl analogues might be emerging as unique illicit products,” the investigators wrote, adding that the fentanyl analogue situation “might mirror the rapidly rising trajectory of fentanyl overdose deaths that began in 2013 and become a major factor in opioid overdose deaths.”
FROM MMWR
Suicide rate highest in rural areas
The suicide rate in the United States rose over 19% from 2001 to 2015, with an increasing gap separating rural areas from those with large urban populations, according to the Centers for Disease Control and Prevention.
Suicide rates in nonmetropolitan/rural counties for those aged 10 years and older have been consistently higher, and increased more, than those in large metropolitan counties, the CDC said.
The trends for the two lower urbanization levels had similar patterns: increases from 2001 onward became significant accelerations in 2007 (nonmetro/rural) and 2008 (medium/small metro). Large metro counties, however, took a different path that involved significant decreases from 2001 to 2005, significant increases from 2005 to 2010, and then smaller increases after 2010 that were not significant, based on data from the National Vital Statistics System’s mortality data files.
The analysis of the 544,115 suicides committed during 2001-2015 used 3-year averages “to reduce the variability of a small number of observations in a particular period,” the investigators noted.
FROM MMWR SURVEILLANCE SUMMARIES
Mental health risks higher in sexual minorities with acne
Among young adults with acne, nonheterosexuals are much more likely to report mental health problems, according to data from a national cross-sectional study.
Since previous studies have shown that both acne and sexual minority status are associated with increased risk of depression and suicidal ideation, the investigators used data from the National Longitudinal Study on Adolescent to Adult Health, which included 4,094 heterosexual (167 with acne) and 564 sexual minority (35 with acne) adults aged 18-28 years, to examine the relationship between the two.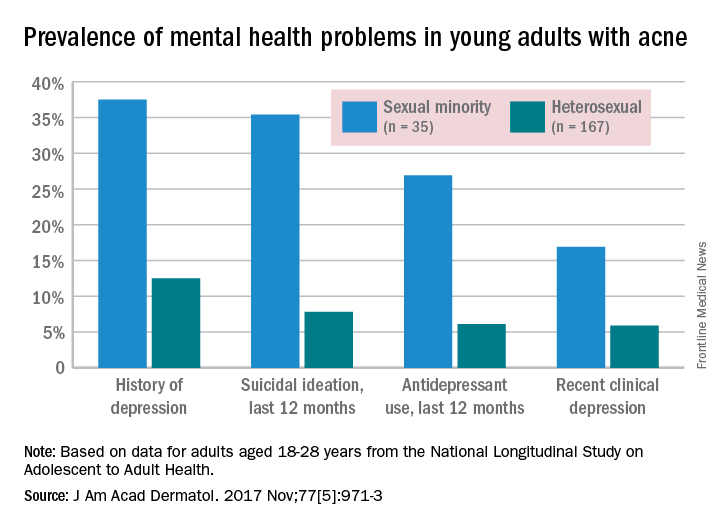
Past-year antidepressant use (AOR, 8.21) and current clinical depression (AOR, 4.1) also were both more common among sexual minorities, who were defined as “those indicating same-sex attraction or sexual orientation other than ‘100% heterosexual,’ ” they said.
“Validated screening tools to assess sexual orientation and depression among patients with acne may identify at-risk individuals and expedite referral for psychological care,” Mr. Gao and his associates wrote.
The investigators did not declare any conflicts of interest. The work of one of Mr. Gao’s associates was supported through a grant from the California Pacific Medical Center Foundation.
FROM JOURNAL OF THE AMERICAN ACADEMY OF DERMATOLOGY
Over 40% of Americans have experience with medical errors
More than 40% of adults have either experienced a medical error or been involved in the care of someone who did, according to a recent national survey.
Specifically, 21% of American adults said that they have personally experienced a medical error and 31% said that they have been involved in the care of another person who experienced an error. The combined total, which includes some overlap, was 41% in the survey conducted by the Institute for Healthcare Improvement (IHI)/National Patient Safety Foundation (NPSF) and National Opinion Research Center (NORC), a nonpartisan research institution at the University of Chicago, .
Medical errors were defined for respondents as “mistakes [that] sometimes result in no harm, while other times they may result in additional or prolonged treatment, emotional distress, disability, or death,” investigators at IHI/NPSF and NORC said in their report.
A misdiagnosed medical problem was the most common type of medical error, reported by 59% of those with error experience. The next most common type of error was a mistake during a test, surgery, or treatment, which was mentioned by 46% of those with error experience, followed by a diagnosis that didn’t make sense (42%), lack of respect (39%), and incorrect instructions about follow-up care (29%), the IHI/HPSF and NORC report indicated.
Feelings of disrespect were more common among younger respondents: 46% of those aged 18-44 years said they were not treated with respect by a health care provider, compared with 34% of those aged 45 years and older. No differences in disrespect were seen with regard to socioeconomic status, health literacy, or English language proficiency. Those who spoke a language other than English at home, however, were more than twice as likely to get the wrong medication from a physician (34%) than were those who did not (15%), the report showed.
The survey, which had a sampling error of plus or minus 3.2 percentage points, was conducted between May 12, 2017, and June 26, 2017, and involved 2,536 respondents. It was conducted with support from Medtronic.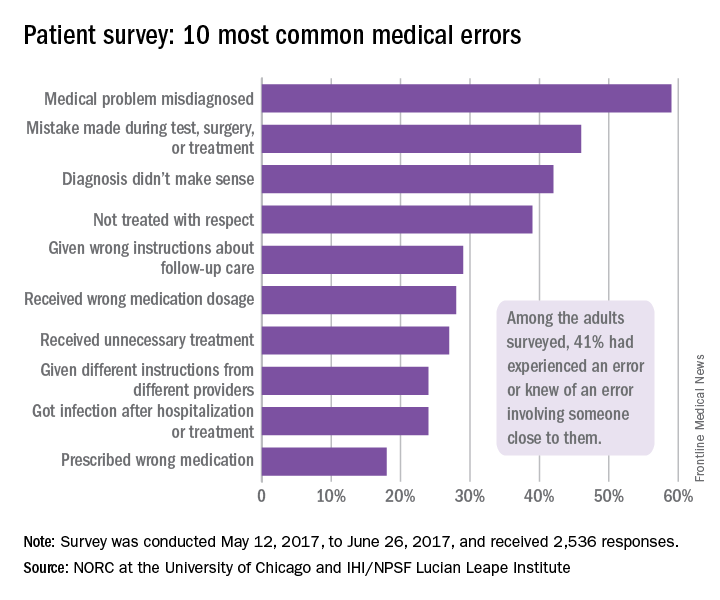
Reconstruction becoming more common after mastectomy
The rate of breast reconstruction surgery for mastectomy increased 62% from 2009 to 2014, while the mastectomy rate itself “remained relatively stable,” according to the Agency for Healthcare Research and Quality.
The rate of breast reconstructions in hospitals and ambulatory surgery settings rose steadily over the 6-year period, going from 21.7 per 100,000 women in 2009 to 35.1 per 100,000 in 2014. Meanwhile, the mastectomy rate dipped from 90.1 in 2009 to 83.2 in 2010 but varied less than 10% over the 2009-2014 time period, reaching 88.4 per 100,000 women in 2014. To put those numbers in a different context, the ratio of reconstructions to mastectomies went from 24-to-100 in 2009 to 40-to-100 in 2014, the AHRQ reported in a Statistical Brief.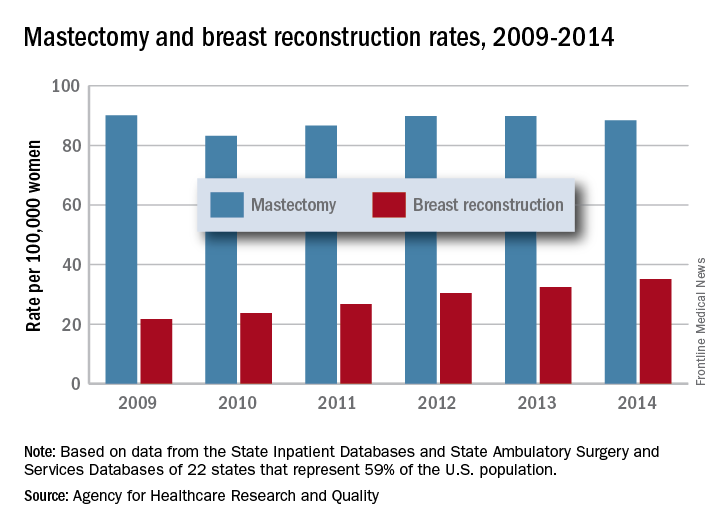
Those nonsimultaneous procedures were taking place much more often in ambulatory settings by 2014, as the rate of reconstructions at a separate visit increased 152% from 7.4 per 100,000 women in 2009 to 18.2. Simultaneous reconstructions in ambulatory settings were less common but increased at an even greater rate of 155%, going from 1.1 to 2.8 per 100,000 women. Inpatient reconstruction had little or no growth over the 6 years: Separate-visit procedures went from 6 to 6.8 and simultaneous reconstructions actually dropped from 7.4 per 100,000 women to 7.3, they reported.
The analysis was based on data from AHRQ State Inpatient Databases and State Ambulatory Surgery and Services Databases for 22 states that include 59% of the U.S. population: California, Colorado, Connecticut, Florida, Georgia, Iowa, Indiana, Maryland, Michigan, Minnesota, Missouri, Nebraska, New Jersey, New York, North Carolina, Ohio, South Carolina, South Dakota, Tennessee, Utah, Vermont, and Wisconsin.
Payment gaps seen for child visits
, according to the Agency for Healthcare Research and Quality.
Child visits covered by private insurance brought in a mean $214 for office-based physicians of all specialties in 2015, which was $88 more than the $126 they received for Medicaid-covered visits, the AHRQ said.
That gap has been consistent since 2010, even as payments rose from 2010 to 2013 and fell in 2014 and 2015. The payment gap was even larger in 2015 when looking at the most expensive 10% of child visits: $406 for those that were privately insured and $215 for those covered by Medicaid, the AHRQ reported in a recent Statistical Brief.
Variations in payments also were seen between geographic regions and among the different physician specialties. Mean payments to physicians in the Midwest were highest for both private insurance ($249) and Medicaid ($152), while the lowest payments – $192 from private insurance and $120 from Medicaid – went to physicians in the South. The South also had the smallest gap between private and Medicaid coverage at $72, and the West had the largest gap at an even $100, but none of the variation across regions was significant, the AHRQ said.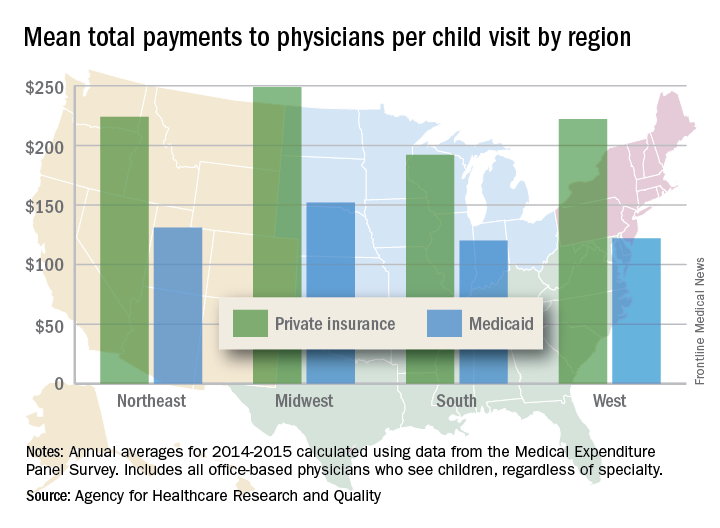
There were statistically significant gaps between private and Medicaid payments by specialty, although only for visits to orthopedists ($423 private – $162 Medicaid = $261) and primary care physicians such as family physicians and internists ($174 private – $122 Medicaid = $52). Payments to pediatricians were $190 private/$115 Medicaid, and the psychiatrists’ $111 mean payment from Medicaid represented the lowest for any specialty, data from Medical Expenditure Panel Survey’s household component show.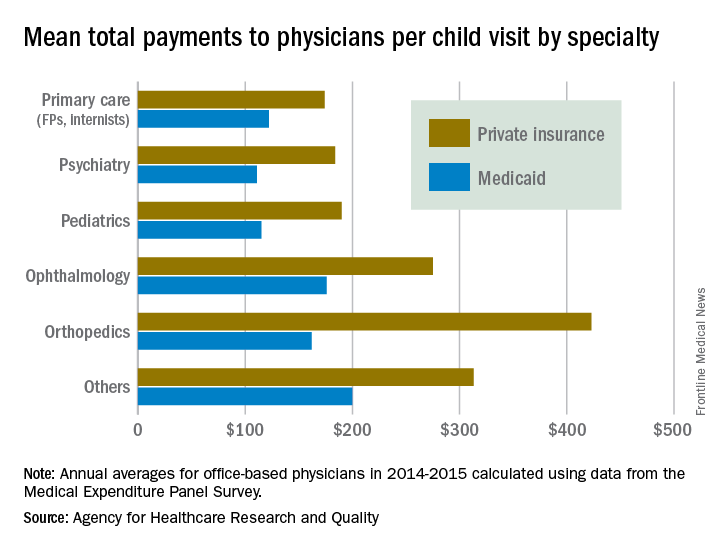
Lifesaving future seen for electronic cigarettes
A switch from cigarettes to e-cigarettes has the potential to prevent almost 90,000 premature deaths in the United States in the year 2026, according to a study examining e-cigarette substitution scenarios.
The investigators’ “optimistic scenario” – in which new smokers use e-cigarettes instead of cigarettes, smoking prevalence falls to 5% over a 10-year period, and e-cigarettes have a 5% excess risk over regular cigarettes – projects 380,832 premature deaths from smoking in the year 2026. Under a “status quo scenario,” which projected current cigarette initiation and cessation rates and did not include e-cigarettes or other tobacco products, there would be 470,743 deaths, reported David T. Levy, PhD, and his associates (Tob Control. 2017 Oct 2. doi: 10.1136/tobaccocontrol-2017-053759).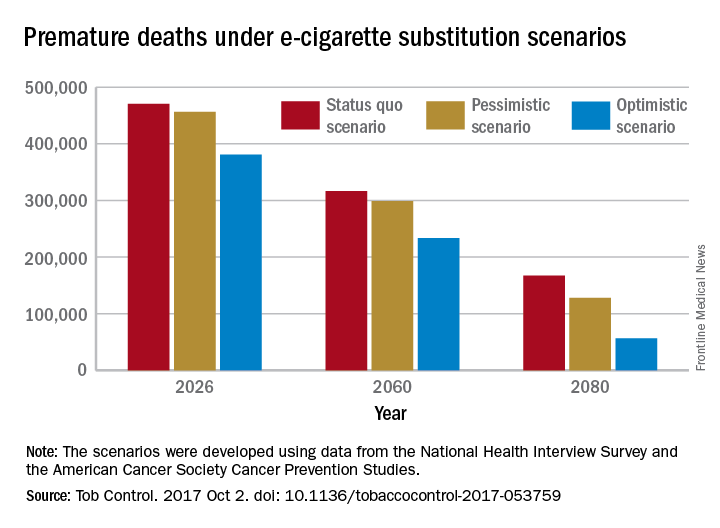
Further projections suggest that the optimistic scenario could result in almost 6.6 million fewer premature deaths and 86.7 million years of life gained by the year 2100, compared with the status quo scenario, while the pessimistic scenario would prevent 1.6 million deaths and add an extra 20.8 million years of life, they noted.
Since “a strategy of replacing cigarette by e-cigarette use can yield substantial gains, even with conservative assumptions about related risks … an endgame scenario for cigarettes might well be within reach, if new technologies for delivering nicotine with substantially less harm, but sufficient satisfaction, are harnessed with sufficient passion and political will to aggressively phase out tobacco cigarettes,” Dr. Levy and his associates wrote.
The study was funded by grants from the National Institute on Drug Abuse and the National Cancer Institute. One investigator received a research grant from Pfizer and served as an advisory board member to Johnson & Johnson, which manufactures smoking cessation medications. No other conflicts of interest were declared.
FROM TOBACCO CONTROL