User login
Richard Franki is the associate editor who writes and creates graphs. He started with the company in 1987, when it was known as the International Medical News Group. In his years as a journalist, Richard has worked for Cap Cities/ABC, Disney, Harcourt, Elsevier, Quadrant, Frontline, and Internet Brands. In the 1990s, he was a contributor to the ill-fated Indications column, predecessor of Livin' on the MDedge.
HCA is the country’s highest-volume health system
HCA of Nashville, Tenn., had more discharges in 2016 than any other health system in the United States, according to the Agency for Healthcare Research and Quality.
HCA’s 192 hospitals recorded over 1.7 million discharges last year, more than twice as many as Ascension Health in St. Louis, which discharged almost 860,000 patients from its 136 hospitals. Tennessee is also the home of the nation’s third-largest health system, Community Health Systems of Franklin, which totaled just over 805,000 discharges in 2016. Tenet Healthcare Corporation in Dallas was fourth with 752,000 discharges, and Trinity Health in Livonia, Mich., was fifth with 737,000 discharges, the AHRQ said in its Compendium of U.S. Health Systems, 2016.
Just over half of pregnant women got flu vaccine in 2016-2017
Influenza vaccination among pregnant women during the 2016-2017 flu season was slightly higher than during the 2015-2016 season, according to the Centers for Disease Control and Prevention.
Overall coverage for 2016-2017 was 53.6% among pregnant women, compared with 49.9% in 2015-2016, continuing the overall rise seen over the last several flu seasons. Among pregnant women who received a recommendation from a health care provider and were offered vaccination, coverage was 70.5% in 2016-2017, while coverage was 43.7% among women who received a recommendation but no offer and 14.8% among those who did not receive a recommendation, the CDC reported (MMWR. 2017 Sep 29;66[38]:1016-22).
Among other subgroups, coverage by age for the 2016-2017 flu season was 41.7% for those aged 18-24 years, 58.4% for those aged 25-34 years, and 58.5% for those 35-49 years old. There also was considerable variation by race/ethnicity, with coverage at 61.2% for Hispanics, 55.4% for whites, 42.3% for blacks, and 51.7% for others. Coverage for the subgroups corresponded with the rates at which vaccination was recommended: Younger women were less likely than older women to receive a recommendation, and Hispanic and white women more likely to receive recommendations than did blacks and other races/ethnicities, the CDC said.
The 2017 data include 1,893 responses to an Internet panel survey conducted from March 28 to April 7, 2017. The analysis of the 2016 panel survey, which was conducted from March 29 to April 7, 2016, included responses from 1,692 women.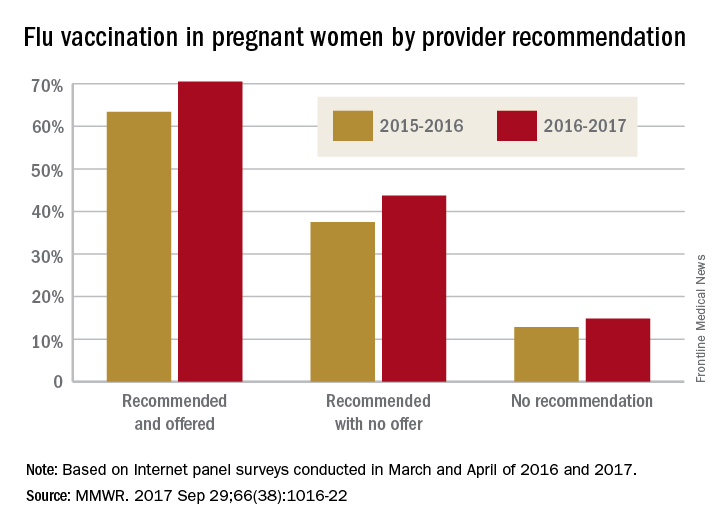
FROM MMWR
Residents getting unprecedented attention from employers
Half of final-year residents surveyed this April had received 100 or more job solicitations during their training, according to physician-recruiting firm Merritt Hawkins.
Among the 935 survey responses the company received, 70% of physicians in their final year of residency had gotten more than 50 job offers: 20% received 51-100, and 50% received more than 100. The numbers were even higher for those in primary care: 76% had received at least 51 job solicitations, and 55% reported more than 100 offers, Merritt Hawkins said in its 2017 Survey of Final-Year Medical Residents.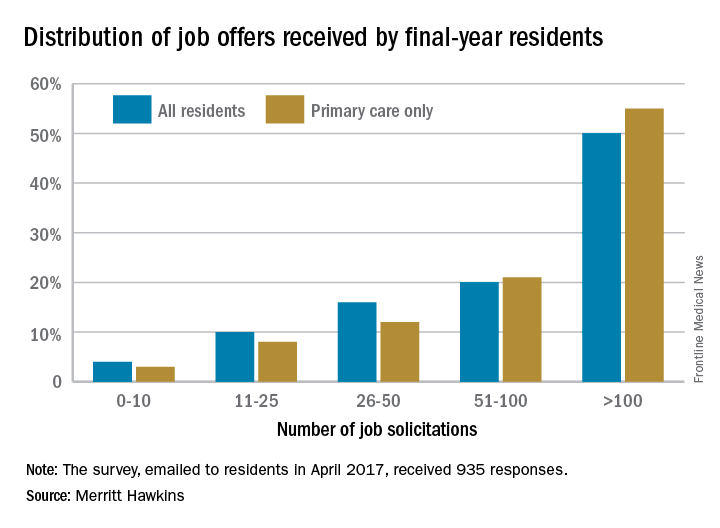
The 50% of all residents who received 100 or more job solicitations is the highest at that level since the survey began in 1991 (it is generally conducted every 2 or 3 years), with much lower figures seen as recently as 2008 – only 6% got that many offers – and 2006, when the number was 16%.
That primary care physicians are even more in demand shows their importance “as leaders of interdisciplinary clinical teams [and] managers of care and resources in emerging quality-driven delivery models such as ACOs [accountable care organizations],” the company said.
Demand for specialists is slightly lower, with 46% of residents in internal medicine, surgical, or diagnostic specialties getting more than 100 job offers and 64% getting more than 50. Current trends in mental health services, however, led Merritt Hawkins to single out psychiatry for special mention: 78% of final-year psychiatry residents had received more than 50 job solicitations – even more than primary care – although the number at the over-100 level, 48%, was lower, according to the report.
Job offers piling up for psychiatry residents
The increasing demand for mental health care is having a positive effect on the popularity of psychiatry residents, according to physician-recruiting firm Merritt Hawkins.
In a survey conducted earlier this year, 78% of final-year psychiatry residents said that they had received more than 50 job solicitations during their training: 30% reported 51-100 offers, and 48% said they had gotten over 100, Merritt Hawkins said in its 2017 Survey of Final-Year Medical Residents.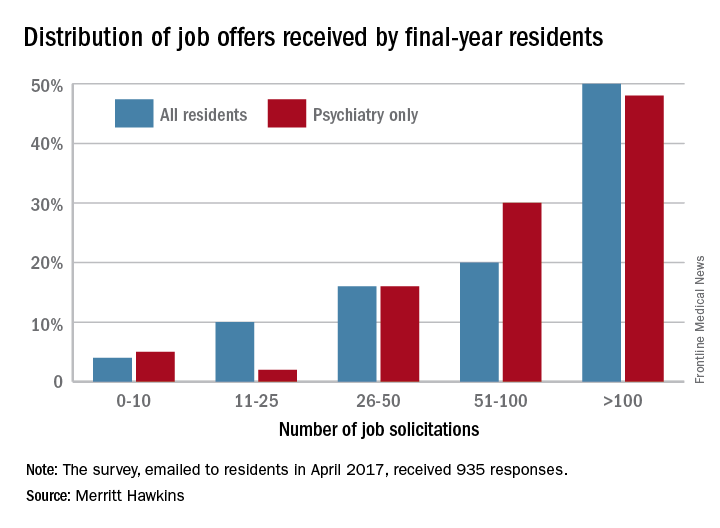
“The search for newly trained physicians is on the verge of becoming a feeding frenzy,” said Mark Smith, the firm’s president. “There are simply not enough physicians coming out of training to go around.”
The 50% of all residents who received 100 or more job solicitations is the highest at that level since the survey began in 1991 (it is conducted every 2 or 3 years), with much lower figures seen as recently as 2008 – only 6% got that many offers – and 2006, when the number was 16%.
Demand for residents in other specialties is slightly lower, with 64% of residents in internal medicine, surgical, or diagnostic specialties getting more than 50 job offers, according to the report.
Smoking linked to increased psoriasis risk
Current and former smokers were significantly more likely to have psoriasis than were nonsmokers in an analysis of the Korean National Health Insurance database.
Multivariate analyses produced adjusted incidence rates of 1.14 for current smokers (n = 132,566) and 1.11 for former smokers (n = 47,477), compared with nonsmokers (n = 320,435), indicating “that smoking status is an independent potential risk factor for psoriasis,” reported Eun Joo Lee, PhD, of the National Health Insurance Service in Wonjusi, South Korea, and associates (J Am Acad Dermatol. 2017;77[3]:573-5).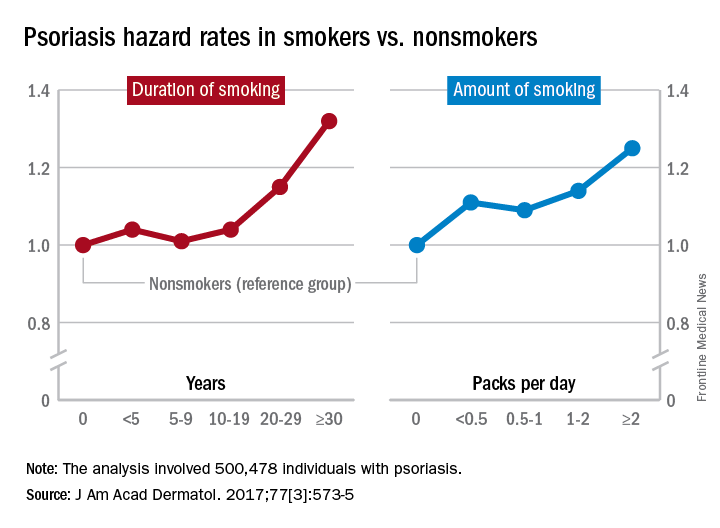
The study was supported by a grant from the National Research Foundation of Korea that was funded by the Korean government. The investigators did not declare any conflicts of interest.
FROM THE JOURNAL OF THE AMERICAN ACADEMY OF DERMATOLOGY
E-cigarettes most popular among youngest adults
Over 15% of adults have used electronic cigarettes at some time, and about 3% reported current use when they were surveyed in 2016, according to the Centers for Disease Control and Prevention.
When those numbers are broken down by age group, the youngest adults are the most likely e-cigarette users: 23.5% of those aged 18-24 years had ever vaped and 4.5% were currently vaping either every day or on some days, the CDC reported (MMWR. 2017;66[33]:892).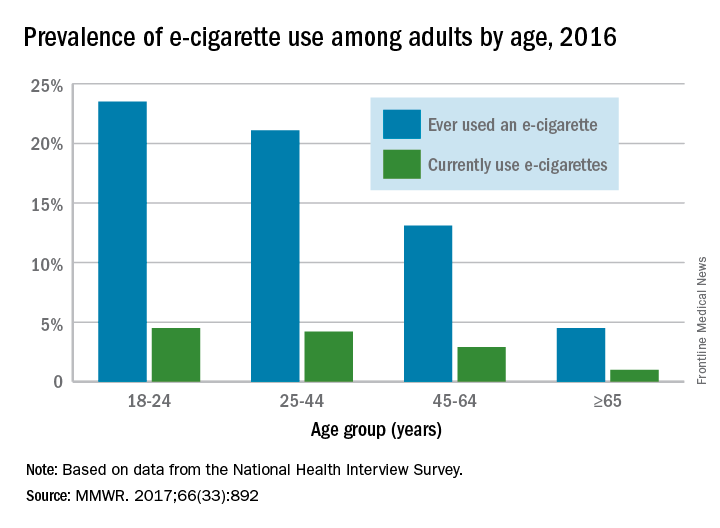
FROM MMWR
Increase in sepsis incidence stable from 2009 to 2014
The trend for sepsis incidence from 2009 to 2014, “calculated relative to the observed 2014 rates,” was a stable increase of 0.6% per year using the more accurate of two forms of analysis, investigators reported.
The incidence of sepsis was an adjusted 5.9% among hospitalized adults in 2014, with in-hospital mortality of 15%, according to a retrospective cohort study published online Sept. 13 in JAMA.
“Most studies [of sepsis incidence] have used claims data, but increasing clinical awareness, changes in diagnosis and coding practices, and variable definitions have led to uncertainty about the accuracy of reported trends,” wrote Chanu Rhee, MD, of Harvard Medical School, Boston, and his associates (JAMA. 2017 Sep 13. doi: 10.1001/jama.2017.13836).
They used two methods – one involving claims-based estimates using ICD-9-CM codes and the other based on clinical data from electronic health records (EHRs) – to analyze data for more than 2.9 million adults admitted to 409 U.S. academic, community, and federal acute-care hospitals in 2014. The claims-based “explicit-codes” approach used discharge diagnoses of severe sepsis (995.92) or septic shock (785.52), while the EHR-based, clinical-criteria method included blood cultures, antibiotics, and concurrent organ dysfunction with or without the criterion of a lactate level of 2.0 mmol/L or greater, the investigators said.
The explicit-codes approach produced an increase of 10.3% per year in sepsis incidence from 2009 to 2014, compared with 0.6% per year for the clinical-criteria approach, while in-hospital mortality declined by 7% a year using explicit codes and 3.3% using clinical criteria, Dr. Rhee and his associates reported.
“EHR-based criteria were more sensitive than explicit sepsis codes on medical record review, with comparable [positive predictive value]; EHR-based criteria had similar sensitivity to implicit or explicit codes combined but higher [positive predictive value],” they said.
The estimates provided by Dr. Rhee and his associates provide “a clearer understanding of trends in the incidence and mortality of sepsis in the United States but also a better understanding of the challenges in improving ICD coding to accurately document the global burden of sepsis,” Kristina E. Rudd, MD, of the University of Washington, Seattle, and her associates said in an editorial (JAMA 2017 Sep 13. doi: 10.1001/jama.2017.13697).
The study was funded by the Centers for Disease Control and Prevention, Agency for Healthcare Research and Quality, National Institutes of Health, Department of Veterans Affairs, National Institutes of Health Clinical Center, and National Institute of Allergy and Infectious Diseases. Three of Dr. Rhee’s associates reported receiving personal fees from private companies or serving on advisory boards or as consultants. No other authors reported disclosures. Dr. Rudd and her associates had no conflicts of interest to report.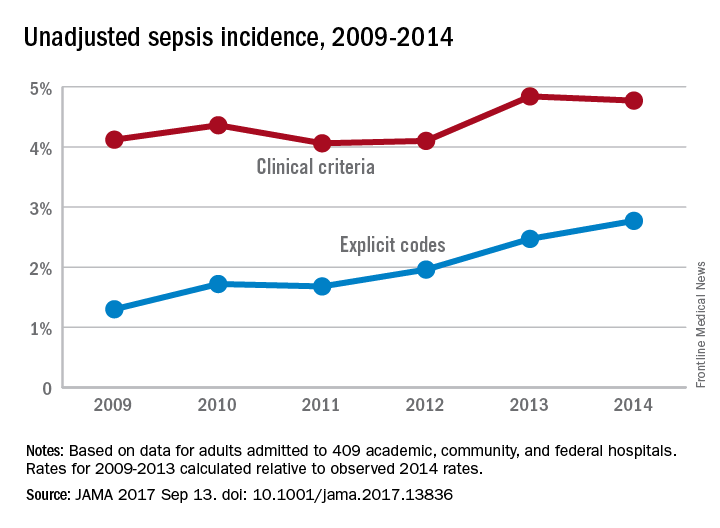
FROM JAMA
Sleep issues vary by menopausal status
Perimenopausal women aged 40-59 years were less likely than were others in the same age group to average at least 7 hours’ sleep each night in 2015, according to the National Center for Health Statistics.
Among the perimenopausal women in that age group, 56% said that they slept less than 7 hours, on average, in a 24-hour period, compared with 40.5% of postmenopausal women and 32.5% of those who were premenopausal. Overall, 35.1% of women aged 40-59 did not average at least 7 hours of sleep per night, the NCHS reported in a data brief released Sept. 7.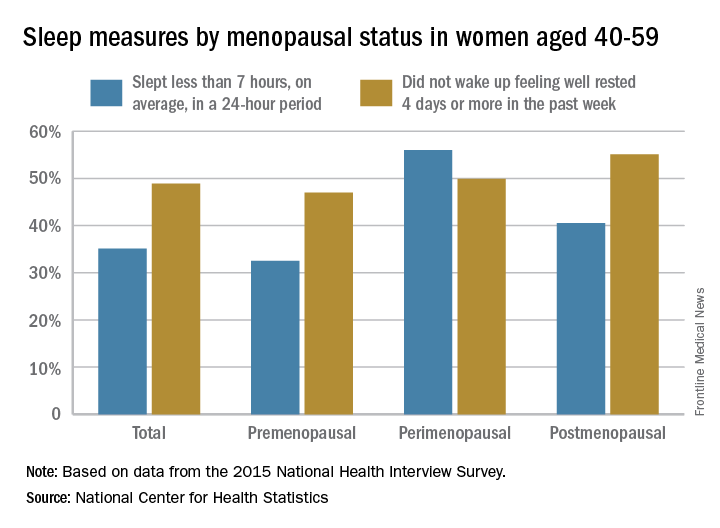
For this analysis, about 74% of the women included were premenopausal (still had a menstrual cycle), 4% were perimenopausal (last menstrual cycle was 1 year before or less), and 22% were postmenopausal (no menstrual cycle for more than 1 year or surgical menopause after removal of their ovaries).
Recent upturn seen in stroke death rate
A recent increase in the death rate from stroke resulted in more than 32,000 more deaths than would have occurred had the previous long-term decline continued, according to the Centers for Disease Control and Prevention.
The overall age-standardized stroke death rate among adults aged 35 years and older declined from 118.4 per 100,000 in 2000 to 73.3 per 100,000 in 2015, for an average annual percent change of –3.1%. That long-term rate, however, includes a more recent, but statistically nonsignificant, increase of 2.5% a year in 2013-2015, which produced an estimated 32,593 excess deaths based on the previous rate of decline, the CDC investigators said (MMWR 2017 Sep 6;66[early release]:1-7).
“Reasons for the slowing, stalling, and reversing in declines in stroke death rates are not clear. … Recent studies have reported that younger adults have experienced a significant increase in both stroke hospitalizations and in associated stroke risk factors (e.g., hypertension, obesity, diabetes, lipid disorder, and tobacco use). … These changes in modifiable stroke risk factors might present new challenges for stroke prevention and for maintaining a sustained decline in stroke mortality in the United States,” the investigators wrote.
FROM MMWR
Zika’s 2017 summer less active than 2016
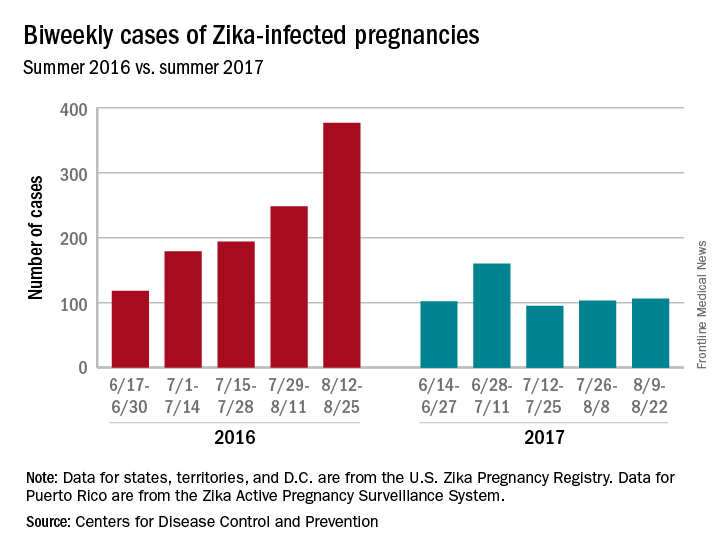
Zika may not have gone away this summer, but it didn’t make a comeback, either.
New cases in pregnant women are still being reported, but the numbers are much lower than a year ago, when the infection was kicking into high gear. For the 2 weeks ending Aug. 22, 106 pregnant women with laboratory evidence of Zika virus infection were reported: 43 in the U.S. states and the District of Columbia, and 63 in the U.S. territories, according to the Centers for Disease Control and Prevention.
The total cases reported for the previous 2-week periods, going back to mid-June, look like this: 102 (June 14-27), 160 (June 28–July 11), 95 (July 12-25), and 103 (July 26–Aug. 8). In the summer of 2016, the 2-week period of Aug. 12-25 produced 375 new reports of Zika-infected pregnant women, the CDC data show.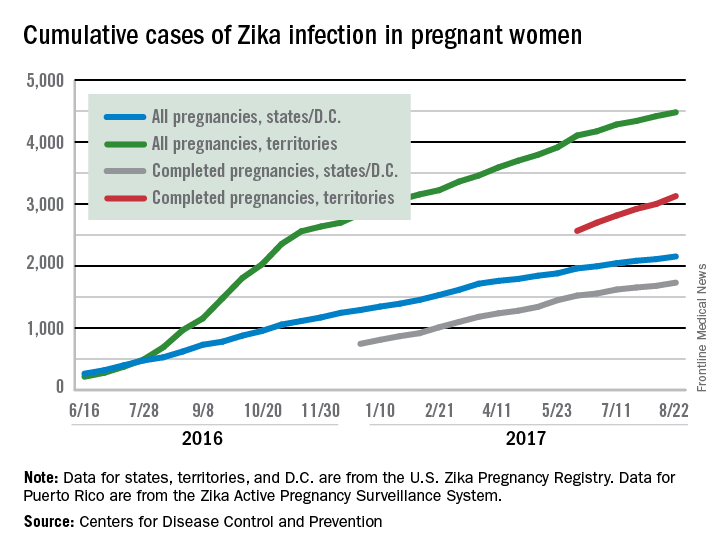